

Abstract
With the aim of supporting ecological analyses in butterflies, the third most species-rich superfamily of Lepidoptera, this paper presents the first time-calibrated phylogeny of all 496 extant butterfly species in Europe, including 18 very localized endemics for which no public DNA sequences had been available previously. It is based on a concatenated alignment of the mitochondrial gene COI and up to 11 nuclear gene fragments, using Bayesian inference of phylogeny. To avoid analytical biases that could result from our region-focus sampling, our European tree was grafted upon a global genuslevel backbone butterfly phylogeny for analyses. In addition to a consensus tree, we provide the posterior distribution of trees and the fully-concatenated alignment for future analyses.
Background & Summary
The incorporation of phylogenetic information in ecological theory and research has led to significant advancements by facilitating the connection of large-scale and long-term macro-evolutionary processes with ecological processes in the analysis of species interactions with their abiotic and biotic environments1,2. Phylogenies are increasingly used across diverse areas of macroecological research3, such as studies on large-scale diversity patterns4, disentangling historical and contemporary processes5, latitudinal diversity gradients6 or improving species area relationships7. Phylogenetic information has also improved studies on assembly rules of local communities8–10, including spatiotemporal community dynamics11 and multi-spatial and -temporal context-dependencies12. Additionally, phylogenetic information has provided insights into the mechanisms and consequences of biological invasions13–16. They also contribute to assessments of ecosystem functioning and service provisioning17,18, though phylogenetic relationships cannot simply be taken as a one-to-one proxy for ecosystem functioning19,20. However, they are of great value for studies of species traits and niche characteristics by quantifying the amount of phylogenetic conservatism21 and ensuring statistical independence22 in multi-species studies. Using an ever increasing toolkit of phylogenetic metrics23,24, and a growing body of phylogenetic insights, the afore mentioned advances across diverse research fields document how integrating evolutionary and ecological information can enhance assessments of future impacts of global change on biodiversity25–27 and consequently inform conservation efforts (but see also 20,28).
Although the amount of molecular data has increased exponentially during the last decades, most available phylogenetic studies are either restricted to a selected subset of species, higher taxa, or to small geographic areas. Complete and dated species-level phylogenetic hypotheses for species-rich taxa of larger regions are usually restricted to vascular plants29 or vertebrates, such as global birds30 or European tetrapods31, or the analyses are based on molecular data from a small subset of species (e.g. 5% in ants6). Surprisingly, comparable phylogenetic hypotheses are rare for insects, which comprise the majority of multicellular life on earth32, have enormous impacts on ecosystem functioning, provide a multitude of ecosystem services33, and have long been used as biodiversity indicators34.
Here, we present the first comprehensive time-calibrated molecular phylogeny of all 496 extant European butterfly species (Lepidoptera: Papilionoidea), based on one mitochondrial and up to eleven nuclear genes, and the most recent systematic list of European butterflies35. European butterflies are well-studied, ranging from population level analyses36 to large-scale impacts of global change37, with good knowledge on species traits and environmental niche characteristics38,39, population trends40,41 and large-scale distributions42,43 and are thus well placed for studies in the emerging field of ecophylogenetics1.
Compared to other groups of insects, the phylogenetic relationships of butterflies are reasonably well-known, with robust backbone molecular phylogenies at the subfamily44–46 and genus-level47. In addition, molecular phylogenies also exist for most butterfly families48–58 as well as major subgroups59–65 and comprehensive COI data on species level are available from DNA barcoding studies66–71. Some ecological studies on butterflies have already incorporated phylogenetic information, e.g. on the impact of climate change on abundance trends72,73, the sensitivity of butterflies to invasive species13,74 or the ecological determinants of butterfly vulnerability75. However, the phylogenetic hypotheses used in these studies had incomplete taxon coverage (but see 76) and were not made available for reuse by other researchers. To fill these gaps in the literature, and to facilitate the growing field of ecophylogenetics, here we present the first complete and time-calibrated species-level phylogeny of a speciose higher invertebrate taxon above the family level for an entire continent. Importantly, we provide this continent-wide fully resolved phylogeny in standard analysis formats for further advancements in theoretical and applied ecology.
Methods
Taxonomic, spatial and temporal coverage
We analyse a dataset comprising all extant European species of butterflies (Papilionoidea), including the families Papilionidae, Hesperiidae, Pieridae, Lycaenidae, Riodinidae and Nymphalidae. We base our species concepts, as well as the area defined as Europe, on the latest checklist of European butterflies35.
Acquisition of sequence data
The data were mainly collated from published sources and downloaded from NCBI GenBank (Table S1). One mitochondrial gene, cytochrome c oxidase subunit I (COI, 1464 bp), was available for all species in the data matrix, in particular the 5’ half of the gene (658 bp, also known as the DNA barcode). Eleven nuclear genes were included when available: elongation factor-1α (EF-1α, 1240 bp), ribosomal protein S5 (RpS5, 617 bp), ribosomal protein S2 (RpS2, 411 bp), carbamoylphosphate synthase domain protein (CAD, 850 bp), cytosolic malate dehydrogenase (MDH, 733 bp), glyceraldehyde-3-phosphate dehydrogenase (GAPDH, 691 bp), isocitrate dehydrogenase (IDH, 711 bp), wingless (412 bp), Arginine kinase (ArgK, 596 bp) and Dopa Decarboxylase (DDC, 373 bp) and histone 3 (H3, 329 bp). H3 has been sequenced almost exclusively from the family Lycaenidae, while the other gene regions have been sampled widely also in the other butterfly families. For each gene, the longest available sequence was used. However, in the case of several available sequences of similar length, those of European origin were preferentially used. Sequences were aligned manually to maintain protein reading frame, and were curated and managed using VoSeq77.
In several cases, new sequences were generated for this study. For these specimens, protocols followed Wahlberg and Wheat 78 or Wiemers and Fiedler 66. These include several species that did not have any available published sequences, many of which are island endemics (Table 1). The new sequences have been submitted to GenBank (accessions xxxx-xxxx).
Newly sequenced species for which no published sequences had previously been available
Almost all genera are represented by multiple genes, except Borbo, Gegenes, Laeosopis, Callophrys and Cyclyrius (the latter recently synonymized with Leptotes79) which are represented only by the COI gene. Species represented by only the DNA barcode tend to be closely related to species with more genes sequenced (Table S1), minimizing the potential bias these samples could have in our analyses.
Phylogenetic tree reconstruction
A biogeographically restricted tree of a given taxon is inherently very asymmetrically sampled. To avoid potentially strong biases when estimating topology and divergence times we chose to build upon the recent genus-level tree of butterflies47, which provides a well-supported time-calibrated backbone and corresponds well with a recent phylogenomic analysis of Lepidoptera80. This backbone tree contains 994 taxa, each taxon representing a genus across all Papilionoidea. The tree was time-calibrated using a set of 14 fossil calibration points, which provided minimum ages and 10 calibration points based on ages of host plant clades taken from the literature, which provided maximum ages. Importantly, Chazot, et al. 47 tested the robustness of their results to a wide range of alternative assumptions made in the time-calibration analysis, and showed that the estimated times of divergences were robust.
Analysis overview
In order to produce our time-calibrated tree of European butterflies, we identified the position of the European lineages and designed a grafting procedure accordingly. We split the European butterflies that needed to be added to the tree into 12 subclades. For each of these subclades we combined the DNA sequences of the taxa already included in the backbone to the DNA sequences of the European taxa to assemble an aligned molecular matrix. After identifying the best partitioning scheme, we performed a tree reconstruction without time-calibration (only estimating relative branch lengths). The subclade trees were then rescaled using the ages estimated in the backbone and were subsequently grafted. This procedure was repeated using 1000 trees from BEAST posterior distributions of the backbone and subclade trees in order to obtain a posterior distribution of grafted trees. The details of these procedures are described below.
Backbone and subclades
The time-calibrated backbone tree provided by Chazot, et al. 47 contained about 55% of all butterfly genera, including most genera occurring in Europe. A fixed topology was obtained using RAxML81 and node ages where estimated with BEAST v.1.8.3.82. We used this fixed topology from Chazot, et al. 47 to identify at which nodes European clades should be grafted. We partitioned the analysis into 12 subclades. For each subclade, the DNA sequences of all taxa already included in the global backbone (including also non-European taxa) were combined with the DNA sequences of all the new European taxa that were added. In addition to the focal taxa, we added between two and four outgroups.
The subclades, sorted by families, were defined as follows:
Papilionidae – All Papilionidae were placed into one subclade.
Hesperiidae – We identified two main clades to graft within the Hesperiidae: Hesperiinae and Pyrginae. The Hesperiinae subclade was extended to also encompass the subfamilies Heteropterinae and Trapezitinae. The genus Muschampia, not available in the backbone, was included in the Pyrginae subclade.
Pieridae – All Pieridae were considered as a single clade.
Lycaenidae – All Lycaenidae were considered as a single clade.
Riodinidae – The only European Riodinidae species, Hamearis lucina, was already available in the backbone tree.
Nymphalidae – European Nymphalidae were divided into seven subclades. (i) A subclade for the Apaturinae. (ii) In order to add Danaus chrysippus we generated a tree of Danainae. (iii) We combined the sister clades Heliconiinae and Limenitidinae into a single subclade. (iv) Nymphalinae was treated as a single subclade. (v) A first clade of Satyrinae contained the genera Kirinia, Pararge, Lasiommata, Tatinga, Chonala and Lopinga. (vi) A second Satyrinae clade contained the genera Calisto, Euptychia, Callerebia, Proterebia, Gyrocheilus, Strabena, Ypthima, Ypthimomorpha, Stygionympha, Cassionympha, Neocoenyra, Pseudonympha, Erebia, Boerebia, Hyponephele, Cercyonis, Maniola, Aphantopus, Pyronia, Faunula, Grumia, Paralasa, Melanargia, Hipparchia, Berberia, Oeneis, Neominois, Karanasa, Brintesia, Arethusana, Satyrus, Pseudochazara and Chazara. (vii) A third Satyrinae clade was created for the genus Coenonympha. Charaxinae were not treated separately from the backbone. Charaxes jasius is the only Charaxinae occuring in Europe and Charaxes castor (which is very closely related to C. jasius83) was already included in the backbone tree from Chazot et al. 47. Hence, we used the position of Charaxes castor for Charaxes jasius.
Partitioning the dataset
For each subclade we ran Partition Finder 2 84 in order to partition the data and choose substitution models. The dataset was initially partitioned into genes and codon positions. Branch lengths were set to linked and the comparison between partitioning strategies was made using the greedy algorithm and BIC score85.
Phylogenetic reconstruction
For each subclade, the dataset was imported in BEAUTi v.1.8.386 and partitioned according to the partitioning strategy identified by Partition Finder 2. We enforced the monophyly of the clade to be grafted (i.e., excluding the outgroups). All other relationships were estimated by BEAST v.1.8.3.82. We used an uncorrelated relaxed clock with lognormal distribution. By default, we started by setting one molecular clock per partition. If convergence or good mixing could not be obtained after running BEAST we reduced the number of molecular clocks (see details for each dataset further below). We did not add any time-calibration and therefore only estimated the relative timing of divergence. We performed at least two independent runs with BEAST for each subclade. We checked for convergence and mixing of the MCMC using Tracer v.1.6.087 and in the case of full convergence of the runs, the posterior distribution of trees from different runs were combined after removing the burn-in fraction.
Grafting procedure
Subclades were grafted on the backbone as follows. One backbone was sampled from the posterior distribution of time-calibrated trees from Chazot, et al.47. For each subclade, one subclade tree was sampled from the posterior distribution of trees, the outgroups removed and the tree was rescaled based on the crown age of the subclade extracted from the backbone tree. Finally, the rescaled subclade tree was grafted on the backbone after removing all lineages belonging to this subclade in the backbone (i.e. only keeping the stem branch). We repeated this procedure for 1000 backbone trees and 1000 subclade trees and thus we obtained a posterior distribution of 1000 grafted trees. The topology of the backbone was fixed (see 47) but the topologies of the subclades were free. Hence the posterior distribution of grafted trees includes a posterior distribution of topologies and node ages.
We describe below the details of the phylogenetic tree reconstruction for each subclade.
1- Papilionidae
Dataset – The dataset for the Papilionidae consisted of 36 taxa to which three outgroups were added: Macrosoma tipulata (Hedylidae), Achlyodes busiris (Hesperiidae), Pieris rapae (Pieridae). We concatenated 11 gene fragments (COI, CAD, EF-1α, GAPDH, ArgK, IDH, MDH, RpS2, RpS5, DDC, wingless).
Partition Finder – Partition Finder identified 12 subsets.
BEAST analysis – In order to improve the quality of our runs we replaced the default priors for rates of substitutions by uniform prior ranging between 0 and 10 for the following cases: subset5.at, subset5.cg, subset7.cg, subset7.gt, subset12.cg, subset12.gt. We used one molecular clock per subset identified by Partition Finder and obtained good mixing and convergence. We used a Birth-Death tree prior. We performed three runs of 40 million generations, sampling trees and parameters every 4000 generations.
Grafting – For grafting, the outgroups were removed, as well as Baronia brevicornis, the first Papilionidae to diverge and endemic to Mexico, i.e. we grafted at the most recent common ancestor (mrca) of all Papilionidae but Baronia brevicornis.
2- Hesperiidae: Hesperiinae
Dataset – The dataset for the Hesperiinae consisted of 169 taxa to which two outgroups were added: Typhedanus ampyx (Hesperiidae), Mylon pelopidas (Hesperiidae). We concatenated 10 gene fragments (COI, CAD, EF-1α, GAPDH, ArgK, IDH, MDH, RpS2, RpS5, wingless).
Partition Finder – Partition Finder identified 17 subsets.
BEAST analysis – Preliminary analyses showed problems with the subset 3 (ArgKin_pos3) and was therefore removed from the analyses. In order to improve the quality of our runs we replaced the default priors for rates of substitutions by uniform priors ranging between 0 and 10 for the following cases: subset17.cg. The substitution model for the subset 14 was also changed into HKY+I after preliminary analyses. We used one molecular clock per subset identified by Partition Finder and obtained good mixing and convergence. We used a Birth-Death tree prior. We performed two runs of 150 million generations, sampling trees and parameters every 15000 generations.
Grafting – For grafting, the outgroups were removed and the subclade grafted at the mrca of Hesperiinae.
3- Hesperiidae: Pyrginae
Dataset – The dataset for the Pyginae consisted of 77 taxa to which three outgroups were added: Typhedanus ampyx (Hesperiidae), Pyrrhopyge zenodorus (Hesperiidae) and Hasora khoda (Hesperiidae). We concatenated 10 gene fragments (COI, CAD, EF-1α, GAPDH, ArgK, IDH, MDH, RpS2, RpS5, wingless).
Partition Finder – Partition Finder identified 14 subsets.
BEAST analysis – In order to improve the quality of our runs we replaced the default priors for rates of substitutions by uniform prior ranging between 0 and 10 for the following cases: subset7.ac, subset7.gt, subset14.cg, subset3.cg. Preliminary analyses showed problems when using a separate molecular clock for each subset identified by Partition Finder. We restricted the analysis to one molecular clock. We used a Birth-Death tree prior. We performed two runs of 100 million generations, sampling trees and parameters every 10000 generations.
Grafting – For grafting, the outgroups were removed and the subclade grafted at the mrca of Pyrginae.
4- Pieridae
Dataset – The dataset for the Pieridae consisted of 126 taxa to which three outgroups were added: Bicyclus anynana (Nymphalidae), Achylodes busiris (Hesperiidae) and Papilio glaucus (Papilionidae). We concatenated 11 gene fragments (COI, CAD, EF-1α, GAPDH, ArgK, IDH, MDH, RpS2, RpS5, DDC, wingless).
Partition Finder – Partition Finder identified 17 subsets.
BEAST analysis – In order to improve the quality of our runs we replaced the default priors for rates of substitutions by uniform prior ranging between 0 and 10 for the following case: subset7.cg. The substitution model for the subset 7 was also changed into GTR+G after preliminary analyses. We used one molecular clock per subset identified by Partition Finder and obtained good mixing and convergence. We used a Birth-Death tree prior. We performed two runs of 100 million generations, sampling trees and parameters every 10000 generations.
Grafting – For grafting, the outgroups were removed and the subclade grafted at the mrca of Pieridae.
5- Lycaenidae
Dataset – The dataset for the Lycaenidae consisted of 187 taxa to which three outgroups were added: Bicyclus anynana (Nymphalidae), Pieris rapae (Pieridae) and Hamearis lucina (Riodinidae). We concatenated 12 gene fragments (COI, CAD, EF-1α, GAPDH, ArgK, IDH, MDH, RpS2, RpS5, DDC, wingless and H3).
Partition Finder – Partition Finder identified 12 subsets.
BEAST analysis – In order to improve the quality of our runs we replaced the default priors for rates of substitutions by uniform prior ranging between 0 and 10 for the following cases: subset3.cg, subset6.ag, subset6.at, subset11.gt_subst7.cg. We used one molecular clock per subset identified by Partition Finder and obtained good mixing and convergence. We used a Birth-Death tree prior. We performed two runs of 150 million generations, sampling trees and parameters every 15000 generations.
Grafting – For grafting, the outgroups were removed and the subclade grafted at the mrca of Lycaenidae.
6- Nymphalidae: Danainae
Dataset – The dataset for the Danainae consisted of 7 taxa to which two outgroups were added: Euploea camaralzeman (Nymphalidae) and Lycorea halia (Nymphalidae). We concatenated 9 gene fragments (COI, CAD, EF-1α, GAPDH, IDH, MDH, RpS2, RpS5, wingless).
Partition Finder – Partition Finder identified 8 subsets.
BEAST analysis – We used one molecular clock per subset identified by Partition Finder and obtained good mixing and convergence. We used a Birth-Death tree prior. We performed two runs of 20 million generations, sampling trees and parameters every 2000 generations.
Grafting – For grafting, the outgroups were removed and the subclade grafted at the mrca of Danainae.
7- Nymphalidae: Apaturinae
Dataset – The dataset for the Apaturinae consisted of 9 taxa to which two outgroups were added: Timelaea albescens (Nymphalidae) and Biblis hyperia (Nymphalidae). We concatenated 10 gene fragments (COI, CAD, EF-1α, GAPDH, ArgK, IDH, MDH, RpS2, RpS5, wingless).
Partition Finder – Partition Finder identified 7 subsets.
BEAST analysis – We used one molecular clock per subset identified by Partition Finder and obtained good mixing and convergence. We used a Birth-Death tree prior. We performed two runs of 20 million generations, sampling trees and parameters every 2000 generations.
Grafting – For grafting, the outgroups were removed and the subclade grafted at the mrca of Danainae.
8- Nymphalidae: Heliconiinae + Limenitidinae
Dataset – The dataset combined the sister clades Heliconiinae and Limenitidinae and consisted of 92 taxa to which three outgroups were added: Amnosia decora (Nymphalidae), Apatura iris (Nymphalidae) and Libythea celtis (Nymphalidae). We concatenated 11 gene fragments (COI, CAD, EF-1α, GAPDH, ArgK, IDH, MDH, RpS2, RpS5, DDC, wingless).
Partition Finder – Partition Finder identified 14 subsets.
BEAST analysis – Preliminary analyses showed problems with the subset 14 (RpS2_pos2) which was therefore removed from the analyses. In order to improve the quality of our runs we replaced the default priors for rates of substitutions by uniform priors ranging between 0 and 10 for the following case: subset7.cg. We used one molecular clock per subset identified by Partition Finder and obtained good mixing and convergence. We used a Birth-Death tree prior. We performed two runs of 100 million generations, sampling trees and parameters every 10000 generations.
Grafting – For grafting, the outgroups were removed and the subclade grafted at the split between Limenitidinae and Heliconiinae.
9- Nymphalidae: Nymphalinae
Dataset – The dataset of Nymphalinae consisted of 83 taxa to which two outgroups were added: Historis odius (Nymphalidae) and Pycina zamba (Nymphalidae). We concatenated 11 gene fragments (COI, CAD, EF-1α, GAPDH, ArgK, IDH, MDH, RpS2, RpS5, DDC, wingless).
Partition Finder – Partition Finder identified 12 subsets.
BEAST analysis – In order to improve the quality of our runs we replaced the default priors for rates of substitutions by uniform priors ranging between 0 and 10 for the following case: subset5.cg. Preliminary analyses revealed problems when using one molecular clock per subset identified by Partition Finder. We restricted the analysis to one molecular clock for the mitochondrial gene fragments and one molecular clock for the nuclear gene fragments. We used a Birth-Death tree prior. We performed two runs of 100 million generations, sampling trees and parameters every 10000 generations.
Grafting – For grafting, the outgroups were removed and the subclade grafted at the mrca of Nymphalinae.
10- Nymphalidae: Satyrinae 1
Dataset – The first Satyrinae dataset consisted of 13 taxa, belonging to the genera Kirinia, Pararge, Lasiommata, Tatinga, Chonala and Lopinga, to which three outgroups were added: Bicyclus anynana (Nymphalidae), Acrophtalmia leuce (Nymphalidae) and Ragadia makuta (Nymphalidae). We concatenated 5 gene fragments (COI, EF-1α, GAPDH, RpS5, wingless).
Partition Finder – Partition Finder identified 6 subsets.
BEAST analysis – We used one molecular clock per subset identified by Partition Finder and obtained good mixing and convergence. We used a Birth-Death tree prior. We performed two runs of 20 million generations, sampling trees and parameters every 2000 generations.
Grafting – For grafting, the outgroups were removed and the subclade grafted at the crown of the clade after removing the outgroups.
11- Nymphalidae: Satyrinae 2
Dataset – The second Satyrinae dataset consisted of 161 taxa, belonging to the genera Calisto, Euptychia, Callerebia, Proterebia, Gyrocheilus, Strabena, Ypthima, Ypthimomorpha, Stygionympha, Cassionympha, Neocoenyra, Pseudonympha, Erebia, Boerebia, Hyponephele, Cercyonis, Maniola, Aphantopus, Pyronia, Faunula, Grumia, Paralasa, Melanargia, Hipparchia, Berberia, Oeneis, Neominois, Karanasa, Brintesia, Arethusana, Satyrus, Pseudochazara and Chazara, to which three outgroups were added: Coenonympha pamphilus (Nymphalidae), Taygetis virgilia (Nymphalidae) and Pronophila thelebe (Nymphalidae). We concatenated 10 gene fragments (COI, CAD, EF-1α, GAPDH, ArgK, IDH, MDH, RpS2, RpS5, wingless).
Partition Finder – Partition Finder identified 11 subsets.
BEAST analysis – In order to improve the quality of our runs we replaced the default priors for rates of substitutions by uniform prior ranging between 0 and 10 for the following cases: subset5.ac, subset5.ag, subset5.at, subset5.cg, subset5.gt. We used one molecular clock per subset identified by Partition Finder and obtained good mixing and convergence. We used a Birth-Death tree prior. We performed two runs of 100 million generations, sampling trees and parameters every 10000 generations.
Grafting – For grafting, the outgroups were removed and the subclade grafted at the crown of the clade after removing the outgroups.
12- Nymphalidae: Satyrinae 3
Dataset – The third Satyrinae dataset consisted of 15 taxa all belonging to the genus Coenonympha, to which two outgroups were added: Sinonympha amoena (Nymphalidae) and Oressinoma sorata (Nymphalidae). We concatenated 9 gene fragments (COI, CAD, EF-1α, GAPDH, IDH, MDH, RpS2, RpS5, wingless).
Partition Finder – Partition Finder identified 6 subsets.
BEAST analysis – We used one molecular clock per subset identified by Partition Finder and obtained good mixing and convergence. We used a Birth-Death tree prior. We performed two runs of 20 million generations, sampling trees and parameters every 2000 generations.
Grafting – For grafting, the outgroups were removed and the subclade grafted at the crown of Coenonympha.
Data Records
The analysed dataset (a concatenated alignment of the genes COI, CAD, EF-1α, GAPDH, ArgK, IDH, MDH, RpS2, RpS5, DDC, wingless, and H3) is available in FASTA format at DOI: 10.5281/zenodo.3531555. The posterior distribution of ML trees and the consensus tree are available in NEWICK format at DOI: 10.5281/zenodo.3531555.
Technical Validation
Species identities of the chosen sequences for the dataset were validated by blasting the DNA barcode sequence against the Barcode Of Life Database, which has a good representation of European butterfly species due to a number of barcoding projects implemented in different countries. In almost all cases, the sequences came from the same voucher specimen itself. In 88 cases (Supporting Information), the sequences used were from different individuals. In these cases special care was taken to use sequences from reliable sources, preferably those with voucher photographs.
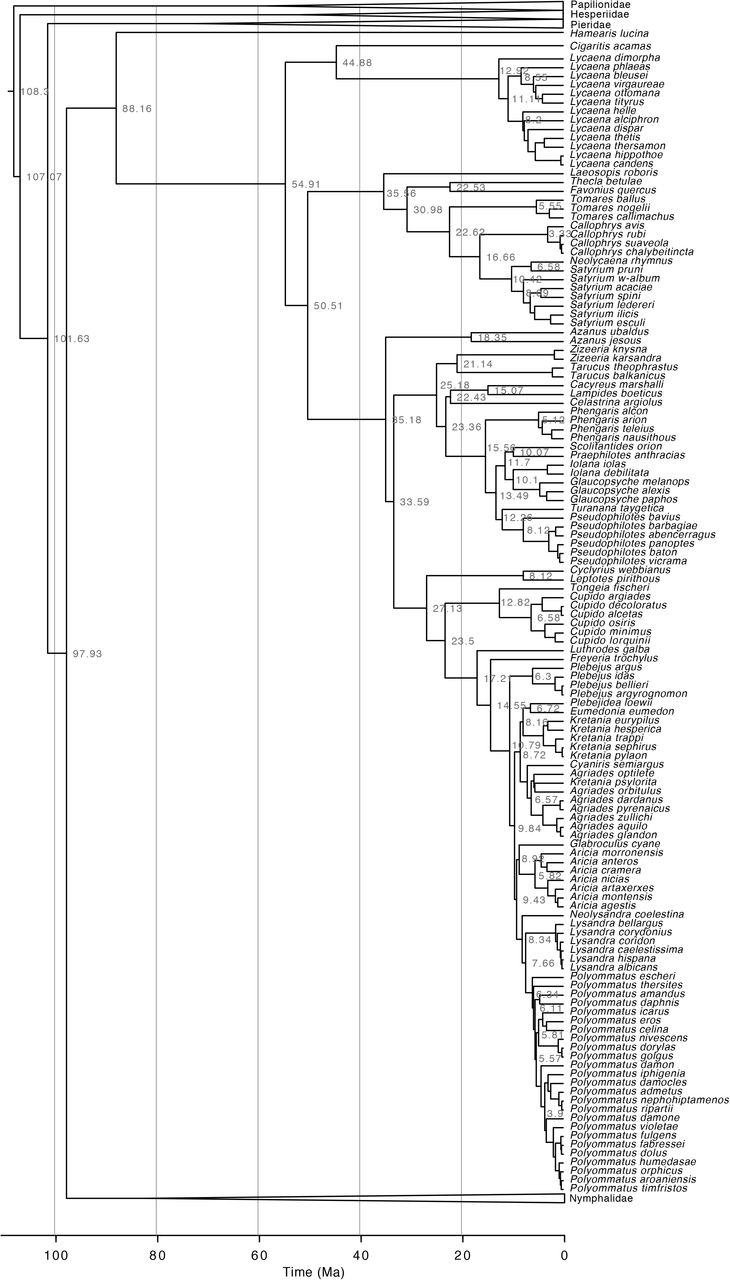
We based our time-calibration from a recent re-evaluation of the timing of divergence of higher-level Papilionoidea. We used the topology inferred by Chazot et al. 47 as a backbone in our grafting procedure. This topology was fixed in Chazot et al. 47, hence only node ages were estimated. Within each subclade we grafted however, we let BEAST estimate the topology in addition to node height. Several sections of the European butterfly tree remain poorly supported. This most likely arises from the lack of molecular information as well as recent and rapid diversification events within Polyommatus, Hipparchia, or Pseudochazara for example. We show here a synthetic tree summarizing the posterior distribution of topologies and node ages but the posterior distribution of grafted trees can be found in Supporting Information, providing a distribution of alternative topologies and node ages estimated by BEAST. We strongly advise any researcher using our phylogenetic framework to repeat the analyses on at least 100 trees randomly sampled from this posterior distribution in order to account for topology and node age uncertainty. This tree can also help identify the sections of the tree lacking molecular information and therefore points at the sections that should be targeted in the future when generating new molecular data.
Usage Notes
We have generated a robust phylogenetic hypothesis for all European species of butterflies with associated times of divergence (Fig. 1). Our purpose is to provide a complete phylogenetic framework for use by the ecological and evolutionary communities. The demand for such a phylogenetic information is high at the moment and various proxies have been used that are not ideal, starting already in 200588. We provide a posterior distribution of topologies and node ages, in order for researchers to be able to take phylogenetic and node age uncertainty into account if they so wish. The tree files are provided in standard Newick format as output from BEAST. Future studies will not necessarily be as comprehensive as the tree we provide. In such cases we recommend using tools such as the ape package89 in R90 to remove tips from the tree that are not relevant to a given study.


Acknowledgements
MW thanks Brigitte Gottsberger (University of Vienna) for assistance in the lab and the following colleagues for specimen samples or sequences: Benedicto Acosta-Fernandez (Spain), Bernard Turlin (France), Dirk Gerber (Germany), Eddie John (UK), John Coutsis (Greece), Javier García (Spain), Karen van Dorp (Netherlands), Klaus Schurian (Germany), Pedro Oromí (Spain), Peter Russell (UK), Roger Vila (Spain), Vlad Dinca (Finland), Xavier Merit (France), Zdenek Fric (Czech Republic), and Zdravko Kolev (Bulgaria). NW acknowledges funding from the Department of Biology, Lund University, the Swedish Research Council (grant number 2015-04441). NC acknowledges funding from BECC (Biodiversity and Ecosystem services in a Changing Climate). CWW acknowledges funding from the Swedish Research Council (grant number 2017-04386). The study was also supported by iDiv through the sDiv working group sECURE (https://www.idiv.de/secure).


