

Summary
Drained peatlands are significant sources of the greenhouse gas (GHG) carbon dioxide. Rewetting is a proven strategy to protect the large carbon stocks; however, it can also lead to increased emissions of the potent GHG methane. The response to rewetting of soil microbiomes as drivers of these processes is poorly understood, as are the biotic and abiotic factors that control community composition.
We analyzed the soil microbiomes of three contrasting pairs of minerotrophic fens subject to decade-long drainage and subsequent rewetting. Analyses comprised qPCR of methanogens, amplicon sequencing of prokaryotic and eukaryotic rRNA genes, and abiotic soil properties including moisture and dissolved organic matter.
The composition of pro- and eukaryotic communities was fen-type-specific, but all rewetted site showed higher abundance of anaerobic taxa. Based on multi-variate statistics and network analyses we identified soil moisture as major driver of community composition. Furthermore, salinity drove the separation between coastal and freshwater fen communities. Methanogens were more than tenfold more abundant in rewetted than in drained sites while their abundance was lowest in the coastal fen, likely due to competition with sulfate reducers. These results shed light on the factors that structure fen microbiomes via environmental filtering.
1. Introduction
Peatlands cover 3% of the global land surface and contain about 30% of the global soil organic carbon (SOC) pool in the form of peat (Joosten et al., 2016). During the agricultural industrialization in the 20th century, many temperate mires in Europe but also other parts of the world were drained to be used as grassland or arable farming. Globally, drained or generally disturbed peatlands cover 0.3% of the global land surface but contribute approx. 5% of all anthropogenic greenhouse gas (GHG) emissions including carbon dioxide (CO2), methane (CH4) and nitrous oxide (N2O). The latter holds also for Germany, where drained peatlands cover approx. 5 % of the surface (Freibauer et al., 2009; Joosten and Couwenberg, 2009). In the German federal state of Mecklenburg-West-Pomerania, peatlands cover 13% of the land surface, their large majority being drained (approx. 90%) and emitting about 30% of the total GHG budget in the region (Ziebarth et al., 2009; Greifswald Mire Center, 2019).
Peat accumulates under water-logged conditions, when more plant biomass is formed by growth than is mineralized by the prokaryotic and eukaryotic soil (micro-)biome. Water is a key factor, limiting decomposition by cutting off the supply of oxygen and other alternative terminal electron acceptors (TEA) to mineralizing microbiota (Dean et al., 2018). Under anoxic conditions plant litter accumulates and forms peat with a high content of soil organic matter that accumulates over millennia. Changes in ecology and hydrology of peatlands can lead to substantial changes in GHG fluxes by changing the peatland biogeochemistry (Parish et al., 2008). If peatlands are drained, formerly anoxic soil layers become aerated and carbon is released as CO2 during aerobic mineralization by peat microbiota (Conrad, 1996).
In the past three decades, several 100 000 ha of European peatlands were rewetted for environmental protection and to recover some of their ecological functions (Andersen et al., 2013; Chimner et al., 2017). Rewetting is a proven strategy to protect the large SOC stocks; however, it can also lead to increased emissions of the potent GHG CH4 and to the release of dissolved organic matter (DOM). While effects of peatland rewetting on GHG and DOM fluxes are comparably well studied (Couwenberg et al., 2011; Hahn et al., 2015; Estop-Aragonés et al., 2016; Wilson, D. Blain, D. Cowenberg, J. Evans, C.D. Murdiyarso, D. Page, S. E. Renou-Wilson, F. Rieley, J.O. Sirin, A. Strack. M. Tuittila, 2016; Lyu et al., 2018), the impact on the peat microbiota, who is the primary driver of GHG production and thus emissions is poorly understood, because it has been not well studied in temperate fens (see an exception in (Wen et al., 2018). The major players in soil organic matter (SOM) decomposition in peat soils are microorganisms of the bacterial, archaeal and eukaryotic (e.g. fungi) domains of life, participating in a cascade of SOM degradation steps (Andersen et al., 2013; Yarwood, 2018), eventually resulting in emissions of CH4 and CO2. Hydrolytic extracellular enzymes catalyze the initial decomposition of polymeric SOM. Under anoxic conditions, this step has been considered as a major bottleneck and the one determining the rate of downstream processes (Conrad, 1996). Further steps in the degradation are carried out through anaerobic respiratory microorganisms (like denitrifiers, iron reducers and sulfate reducers), fermentative and methanogenic microorganisms (Dean et al., 2018), while methanotrophic microorganisms constitute the biological filter for CH4 emissions from peat (e.g. Tveit et al., 2013). Remarkably, many novel players in soil CH4 cycling have been identified in the past few years (Söllinger et al., 2016; Welte et al., 2016; Sorokin et al., 2017; Singleton et al., 2018). Thus, despite more than half a century of research on methanogens, their diversity, physiology and interactions within the microbiom are still poorly understood.
It is crucial to obtain a mechanistic understanding of microbial responses and dynamics upon rewetting to suggest robust managing practices for climate-optimal peatland protection and utilization (e.g. paludiculture, Joosten et al., 2016). Environmental filtering, i.e. the selection of certain taxa through abiotic environmental conditions, is considered to be a major mechanism structuring communities (Cadotte and Tucker, 2017). In this context, identifying the main environmental drivers of both total microbiome composition, as well as the abundance of relevant functional groups involved in carbon cycling and methanogenesis is essential.
In this study we explore the effect of rewetting on temperate fen prokaryotic and eukaryotic microbial communities. For this purpose, three pairs of drained (dry; terms in parenthesis are used in the following to refer to these ecosystems and their states) and rewetted (wet) fens with contrasting water tables and vegetation were investigated: a brackish coastal fen (Coast), a percolation fen (Perco) and an alder carr (Alder). We hypothesize that despite the obvious structural and geo genetic differences, congruent effects of rewetting will be detectable in the microbiomes of the three peatland types because of environmental filtering. Possible controlling factors of community composition, like DOM quantity and quality, soil moisture, soil/water salinity, were also determined to allow for analyzing the effect of rewetting on key players of SOM mineralization and CH4-cycling microorganisms.
A suite of cultivation-independent microbiological and geochemical methods was applied, including DOM profiling as well as qPCR of the methanogenesis key enzyme mcrA and 16S and 18S rRNA gene amplicon based microbiome analysis. Our results may contribute to better understand how microbiomes respond to rewetting and to the relevant controlling environmental factors. Microbiome-based proxies for predicting CH4 emissions from rewetted peatlands eventually derive.
2. Results
Study site and their soil properties
Our investigations took place in three pairs of drained and rewetted peatlands (see table 1 and materials and methods for details).
Sampling site characteristics
In general, the gravimetric water content was higher in the rewetted than in the drained sites (Table S1). However, there was only a minor difference between Percodry (74.2% ± 5.1) and Percowet (75.4% ± 5.3), because of a high water-table near the soil surface in Percodry at the time of sampling. In all of the drained sites and in Coastwet, the water content increased with depth. In Percowet and Alderwet (78.7 ± 4.6) with water table 10 cm above ground, the water content increased slightly with depth or did not change. The lower gravimetric water contents in Coastdry (45.9% ± 6.7), Coastwet (53.8% ± 10.03), and Alderdry (46.3% ± 7.0) corresponded with higher amounts of mineral soil compounds.
The sampling sites were generally acidic; pH values varied between fen types but increased with depth in all drained sites. Lower pH values were detected in Coastdry (3.9 - 4.0) and Alderdry (4.2 - 4.7), while pH values were higher in Percodry (5.0-5.2) and Coastwet (4.7 - 6.1). In Alderwet (5.1 - 5.1) and Percowet (5.4 - 5.4), the pH values did not change with depth (Table S1).
Salinity in the freshwater fens was generally low (0.08 - 0.49‰). The influence of the nearby brackish bay water with a salinity of 8‰ led to a higher salinity in Coastdry (1.32‰) and in Coastwet (5.2‰) (Table S1).
DOM concentrations in the soil extracts of Alderwet and Coastwet were higher than in the drained sites. In Percowet DOM values measured near the surface were higher than in Percodry, but they showed a strong decrease with increasing depth. The distribution of separate DOM fractions, i.e. biopolymers, humic or humic-like substances and low molecular organic matter (lCOM) followed the overall pattern of total DOM (Table S1).
Total carbon (TC) and total nitrogen (TN) content of peat decreased with depth in Alderdry, Coastdry and Coastwet. In contrast, TC increased with depth in Alderwet, Percodry and Percowet. In Alderwet, Percowet and Percodry TN did not change with depth. Total sulfur (TS) content increased with depth in Alderdry, Alderwet and Percowet while it decreased with depth in Coastdry and Coastwet. In Percodry, no change was observed over depth (Table S1).
Diversity of prokaryotes and eukaryotes
Alpha diversity of prokaryotes, calculated from 16S rRNA gene amplicon sequence variants (ASVs), was significantly higher in the two freshwater peatlands than in the coastal fen (Fig. S1, p < 0.001). Alpha diversity was slightly higher in rewetted than in drained sites, but this was significant only in the coastal fen (p < 0.001). Alpha diversity showed a positive correlation with soil water content, TC, TN and DNA content (Fig. S2).
Similarly, alpha diversity of eukaryotes in freshwater peatlands was higher than in the coastal fen (p = 0.11). In contrast to prokaryotes, eukaryote alpha diversity was significantly lower in rewetted sites than in drained sites in Perco (p = 0.015), while no significant difference was observed in Alder and Coast. Alpha diversity of eukaryotes decreased with depth in the rewetted sites. For both pro- and eukaryotes, alpha diversity was negatively correlated with salinity (Fig. S2).
Microbiota composition
Community composition in 16S rRNA and 18S rRNA sequencing analysis of prokaryotes and eukaryotes showed remarkably similar patterns in the non-metric multidimensional scaling (NMDS) plot (Fig. 1), with a significant clustering of microbiota from the same sampling sites (PERMANOVA p = 0.001). While the communities of freshwater fens Alder and Perco showed some overlap, the microbiota in Coast were clearly separated along NMDS axis 1, possibly driven by the differences in abiotic factors, such as salinity, total nitrogen (TN), total carbon (TC), C/N ratio and DOM compounds (Fig. 1). Nevertheless, the pro- and eukaryotic microbiota of the dry and wet sites of each fen type were consistently separated along NMDS axis 2, indicating that the water table of the sites influenced the community composition (PERMANOVA p= 0.001, R2 = 0.267). Depth showed less impact on community composition (PERMANOVA p = 0.161, R2 = 0.046), although some clustering according to sample depth was observed.

NMDS plots showing (a) prokaryotic and (b) eukaryotic community compositions. Symbols show triplicates of cores and indicate the study sites; the color indicates the depth in cm (see legend). Environmental vectors with a significance of p < 0.05 are shown in black. TN: total nitrogen, hCOM: humic like carbon, TC: total carbon, PolyC: Carbon polymers, DOM: dissolved organic matter, lCOM: low molecular organic matter, TS: total Sulphur, C/N: carbon/nitrogen ratio.
Pro- and eukaryotic community compositions were compared between fen types, water conditions (dry/wet) and sampling depths (Fig. 2a). We detected a higher relative abundance of Acidobacteria in drained sites, while Betaproteobacteria, Deltaproteobacteria (mainly comprised of Myxobacteria and sulfate reducers) and Bathyarchaeota showed higher values in all rewetted sites and Percodry. SPAM and Latescibacteria were not detected in Coast, but they occurred in the freshwater fens, whereas Actinobacteria showed higher values in Coast than in Alder and Perco.

Composition of prokaryotic and eukaryotic microbial communities of drained and rewetted fens. a) Taxonomic composition of prokaryotic 16S rRNA genes displayed on phylum level, with Proteobacteria shown on class level. b) Taxonomic composition of eukaryotic 18S rRNA genes, on phylum level. Bars show triplicate of cores; phyla with < 1% abundance are displayed as “other”. The sample ID on x-axis displays fen type and depth in cm.
The eukaryotic community varied considerably between fen types and water condition (Fig. 2b). Among the fungi, ASVs of Ascomycota (which contain saprophytes, yeasts and several plant pathogens) showed high relative abundance in each site, except Percodry. ASV values of Basidiomycota decreased with depth in Alder and Coast, and showed higher relative abundance in these two site than in Perco. ASV values of Glomerycota, which form arbuscular mycorrhiza with plants, comprising mostly Mortirellales were high in Alderdry and Percodry.
Among the protists, ASV values of Apicomplexa were high (up to 40%) in Percodry, but accounted for less than 5% in other sites. Cercozoa, which contain micro-predators among other life styles, had higher values in the freshwater sites Alder and Perco. Relative abundance of Lobosa and Ciliophora, also potential micro-predators, was high in Alderwet and in sites with high water content (rewetted sites and Percodry) respectively.
Among the Metazoa, Nematoda showed highest relative abundance, followed by Arthropoda. The latter accounted for 5-10% of total amplicons in Coast and Percodry and the 5-10 cm layer of Alderdry, while their values were lower in Alderwet and Percowet.
A co-occurrence network was constructed to explore the potential interactions between pro- and eukaryotic species. The network shows two distinct clusters of ASVs (Fig. 3). Color coding of the vertices according to association with sites shows that ASVs within the same site were more connected than different sites (Fig. 3b). However, ASVs associated with rewetted sites shows little connections with those from the drained sites (Fig. 3c), highlighting the significant effect of water conditions on the co-occurrence patterns. Similarly, the indicator taxa from Coast were mostly connected with each other, and indicator taxa from Perco and Alder were also distinctly connected in the network (Fig. 3b). However, there were quite some shared indicator taxa from both Perco and Alder, indicating similarities between these two habitats compared with Coast, which we already detected in community composition (Figs. 1 and 2). The degree and closeness centrality of the indicator taxa were higher in the wet sites than in the dry sites (Fig. 3c). particularly in Coast, followed by Alder, and Perco (Fig. 3b, c). The transitivity was higher among Coast indicators compared with those from Alder.

Co-occurrence networks. a) Co-occurrence network of prokaryotes and eukaryotes corresponding to the indicator ASVs of 16S and 18S rRNA amplicon sequencing. ASVs with relative abundances lower than 0.05% were discarded. b) Co-occurrence network of ASVs associated with (A) alder carr, (C) coastal fen and (P) percolation fen. c) Co-occurrence of ASVs associated with drained (D) and rewetted (W) sites. ASVs were associated with sites using the indicspecies package (De Cáceres and Legendre, 2009). Solid lines indicate significant positive Spearman’s rank correlations (r > 0.7. p < 0.01) between prokaryotic and eukaryotic Indicator ASVs, dashed lines indicate significant negative correlations (r < −0.7. p < 0.01). Nodes are sized according to the number of correlating neighbors (degree) and color-coded according to site type or water condition (drained/rewetted). The relative abundance of prokaryotes and eukaryotes associated with the different site types is shown on the right hand side of b) and c).
The prokaryotic indicator taxa in drained sites mainly comprised ASVs from Acidobacteria and Alpha- and Gamma-Proteobacteria, whereas the main indicator taxa of rewetted sites were Beta- and Delta-Proteobacteria. Beta- and Delta-Proteobacteria were also the main phyla in both hydrological status (Fig. 2). Plants (Tracheophyta) accounted for the largest proportion of the eukaryotic indicator taxa for both water condition and site. Nematoda ASVs accounted for a larger proportion in the drained than in the rewetted sites; Ascomycota showed the reverse trend.
In the network with only connections between eukaryotes and prokaryotes (Fig. 3a), eukaryotes showed higher degrees of connection compared with prokaryotes (Fig. 3). Among the eukaryotes, fungi (Ascomycota, Basidiomycota and Glomeromycota) possessed the most connections with the prokaryotes.
Methanogens
The abundance of methanogens in the samples, assessed by quantitative polymerase chain reaction (qPCR) of the mcrA gene, ranged from 2.1×10⁵ to 5.1×10⁷ gene copies g-1 dry soil (Fig. 4). The mcrA gene abundance was significantly higher in the three rewetted sites compared with the drained sites (Kruskal-Wallis test, H = 16.5, p < 0.001). The difference was largest in the top soils, where mcrA abundances were much higher in rewetted sites. In Alderwet methanogen abundance decreased significantly with depth, while it was rather constant in Percowet. In contrast, methanogen abundance in Alderdry was rather constant or increased with depth (Coastdry and Percodry). Positive correlations were observed between mcrA abundance and water, DNA and DOM content (strongest with biopolymers and lCOM; Fig. S2). Furthermore, TC and TN as well as pH value were positively correlated with mcrA abundance (Fig. S2).
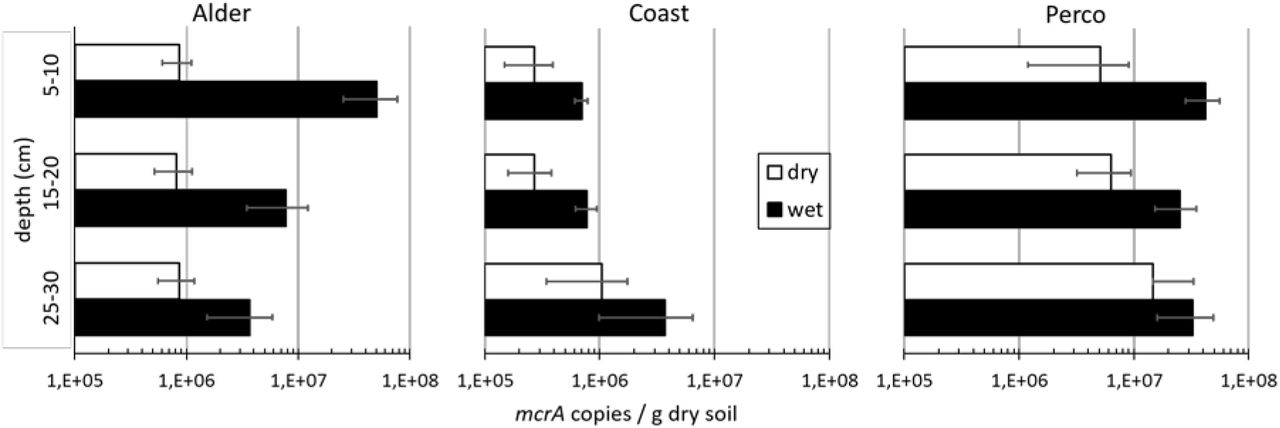
Abundance of methanogens. mcrA gene copy numbers per gram dry soil based on qPCR. X-axis shows mcrA copies per g dry soil, drained sites in white, rewetted sites in black bars, error bars show standard deviation of triplicate soil cores.
The relative abundance of methanogens in the prokaryotic microbiota was low. Methanogen-affiliated ASVs in the amplicon sequence datasets were on average below 0.25% of total 16S rRNA amplicons (Fig. 5). In most of the drained fens, methanogen ASVs were even absent, although they were detectable by mcrA qPCR (see above, Fig. 4). Upper soil samples of Alderwet and Coastwet showed highest abundances, while methanogens were more abundant in the lower samples of Percowet. Methanobacteriales and Methanosarcinales (including the families Methanosaetaceae and Methanosarcinaceae) were the dominant orders in Alderwet and Coastwet, while methanogens were more diverse in Percowet, where Methanomassiliicoccales and Methanomicrobiales were also present.

Relative abundance of functional groups in 16S rRNA gene amplicon datasets. a) Methanogens, b) methanotrophic bacteria and archaea, c) sulfate reducers. Barplots show relative abundance. X-axes represent fen type: alder carr (A), coastal fen (C), percolation fen (P), hydrological state drained (D) and rewetted (W), depth in cm (05, 15, 25). Data are shown as mean values of triplicate soil cores.
Despite apparently missing out on some methanogens in the amplicon data, the relative abundance calculated from mcrA gene copies per g dry soil (qPCR) shows a clear positive correlation with the relative abundance of methanogenic archaea in 16S rRNA amplicon (Spearman correlation, R= 0.578; p < 0.001).
Methanotrophs
16S rRNA genes of known methanotrophic prokaryotes were found in all sites (Fig. 5b), but never exceeded 1% of all prokaryotic 16S rRNA genes on average. Their relative abundance and taxon composition differed both between fen types and dry/wet. In drained fens ASVs affiliated with Ca. Methylacidiphilum (phylum Verrucomicrobia) were dominant across the soil profile. In contrast, ASVs of Methylococcaceae (class Gammaproteobacteria) were the most abundant methanotrophs in Coastwet and Percowet. Putative anaerobic methanotrophs affiliated with Ca. Methanoperedens (ANME-2d, archaea) and with Ca. Methylomirabilis (NC10 phylum), were the dominant methanotroph guild at the Alderwet site.
Sulfate reducers
ASVs of known sulfate reducers were generally more abundant than methanogens and methanotrophs (between 0.1% and 5% on average, Fig. 5c). Like methanogens, their relative abundance was higher in rewetted sites than in drained sites. Highest relative abundance was observed in the Coastwet, which is exposed to recurrent influx of sea water. ASVs of Desulfobacterales were particularly abundant in this site. Desulfarculales and Desulfosporosinus were only detected in rewetted sites, while Desulfuromonadales occurred in all sites. Relative abundance of sulfate reducers was positively correlated to salinity, but not to total sulfur (Fig. S2).
3. Discussion
To our knowledge, this is the first comprehensive study investigating the impact of long-term rewetting (>> 10 years) on freshwater and coastal fen microbiomes. The parallel study of three different fen types allowed for the identification of overarching factors next to fen type-specific factors. The NMDS plots of both prokaryotes and eukaryotes were almost superimposable. It is remarkable that rewetting caused highly congruent effects on beta-diversity of all three domains of life and it is conceivable that water table and salinity were the main environmental filters among the physicochemical controlling factors. Rewetting resulted in more anoxic conditions in the rewetted sites compared with the drained sites. Increased anoxia is supported by several lines of evidence, including (1) a higher moisture content and (2) higher proportions of presumably fermentative microorganisms and (3) higher proportion of taxa with different types of anaerobic respiration, such as methanogenesis and sulfate reduction.
Environmental filtering effect on pro- and eukaryotic community composition
The network analysis confirmed the conclusions we drew from the community composition: there are more taxa indicative for each of the different fen types than for water status. Consequently, site location has a more significant effect on the community assemblages. The higher degree and closeness centrality of indicators in rewetted sites indicates more connections in these sites. This might be due to that higher water flow rates in soils create greater homogeneity, and hence weak niche differentiation, contributing to stronger interactions between soil microbes. Further, it might reflect the close metabolic interactions in anaerobic microbiomes during plant biomass degradation (Schink, 1997; Tveit et al., 2015). Main taxa of indicator ASVs in rewetted sites were Chloroflexi and Delta- and Betaproteobacteria, which contained ASVs known from anoxic environments, also highly abundant in the wet communities (Fig. 2 and Fig. 3) (He et al., 2015). In the drained sites, most indicator taxa were from Acidobacteria, the predominant phylum, which would correspond with the general acidic site conditions. Drainage and subsequent oxidation processes in peat soils are associated with acid production and depending on the buffer capacity of soils pH may go down by one or two units compared with pre-drained conditions (Lamers, 1998). In contrast, rewetting with base-rich water will increase alkalinity and pH (Cusell et al., 2013). Especially the two dominant classes Acidobacteria (subdivision 1) and Solibacteres (subdivision 3) decreased in relative abundance upon rewetting (Supplementary Fig. S4), which is in line with the obligatory aerobic lifestyle of most characterized member species (Eichorst et al., 2018). Members of the aerobic Acidobacteria play important roles in carbohydrate degradation, but some subdivisions also contain facultative or obligate anaerobic species (Eichorst et al., 2018; Hausmann et al., 2018). Other putative anaerobic phyla such as Ignavibacter and Bathyarchaeota occurred only in rewetted sites and deep layers of drained sites. Obviously, soil moisture acted as environmental filter leading to community compositional changes from oxygen-dependent taxa (drained) to anaerobic and fermentative taxa in the rewetted peat soils (Fig. S3). A second likely environmental filter in our study is salinity. The higher connectivity and transitivity of indicators from Coast may result from environmental filtering through higher salinity in these sites, leading to a change in microbial community with increases of Actinobacteria and sulfate reducers and decrease of methanogens (Dang et al., 2018, and see below).
Remarkably, the largest proportion of eukaryotic indicator ASVs originated from Tracheophyta (plants), indicating that the interaction between plants and the soil microbiota is very important. Similar to the prokaryotes, the interaction was even stronger in rewetted sites than in drained sites. In Coast with the lowest moisture content, Tracheophyta ASVs showed lower values than in Perco and Alder. Among the animals, Nematoda indicator ASVs accounted for a larger proportion in drained sites, likely because they are dependent on oxic conditions.
In the network, we also observed that eukaryotes had higher degrees than prokaryotes. The prokaryotes mostly connected with fungi, like Ascomycota, Basidiomycota and Glomeromycota, suggesting that especially fungi may drive the composition of prokaryotic communities. We found fewer eukaryotic than prokaryotic ASVs, suggesting that one eukaryote was probably connected with multiple prokaryotes, as implied by higher degrees of connection for eukaryotes. Similarly, the richness of eukaryotes was far less than the richness of prokaryotes, which is common for soil microbiota, as shown before in e.g. Tveit et al. (2015). Therefore, our results potentially suggest this as a universal rule of pro-eukaryote interactions.
The influence of rewetting on methanogens
The important group of methanogenic archaea was hardly included in the analysis of microbial networks and played no role in the determination of indicator taxa. The reason was the low relative abundance of methanogens in the amplicon datasets of the microbiota, being less than three per mil in all samples. Although their relative abundance in the microbiota was low even under rewetted conditions, their abundance per gram soil was high, especially in the rewetted sites. Wet peatlands are known to contribute a large share of the global CH4 emissions (Nazaries et al., 2013; Joosten et al., 2016). The higher mcrA abundance after rewetting (Fig. 4) could lead to increased CH4 emissions from peatlands, as is the case in rice paddy fields (Reim et al., 2017; Wen et al., 2018). Interestingly, their abundance was high in the rewetted top soils, at least in Alderwet and Percowet, and not in the subsoils.
This is in contrast to general assumptions about their vertical distribution in the soil profile (reviewed in Dean et al., 2018) and corroborates recent findings from other ecosystems (Hahn-Schöfl et al., 2011; Angle et al., 2017). This observation makes peatland management practices such as top soil removal attractive for mitigation of CH4 emissions from peatlands (Harpenslager et al., 2015; Zak et al., 2018; A.Guenther, unpublished). The abundance of methanogens was strongly correlated with soil water content (Fig. S2), which drives anoxia in the soil. However, many other factors like substrate availability of DOM, especially lCOM, C and N content of soil, degradation status of the peat and sulfate and nitrate concentration all correlated with methanogen abundance per gram dry soil as well (Fig. S2). One significant factor was salinity, resulting from brackish water intrusions from the Baltic Sea in Coastwet, which led to large differences between freshwater fens (Alder and Perco) and Coast. In Coastwet the abundance of methanogens per gram soil was at least 10x lower than in the freshwater sites Alderwet and Percowet. Thus, this environmental filtering through salinity likely leads to lower CH4 emissions, also shown before in several studies(Neubauer et al., 2013; He et al., 2015; van Dijk et al., 2017).
The strong positive correlation of mcrA gene abundance in qPCR with the relative abundance of methanogenic archaea in 16S rRNA gene amplicon datasets proves the validity of the measured results. However, in most of the drained peats (Percodry, most Alderdry and Coastdry), methanogenic taxa were not present in the dataset, although mcrA genes were quantified by qPCR. This can be explained by the rather shallow average sequencing depth of 20,000 reads per sample, giving a taxon detection limit of about 0.05‰ in the microbiota, and thus taxa with lower abundances could not be detected. Still, the distribution of methanogenic taxa led to the assumption that substrate availability was different in the sites. While hydrogenotrophic Methanobacteriales were dominant in Coastwet, Coastdry and Alderwet, Percowet showed a high variability in methanogenic groups. Here the Methanosarcinales families of Methanosaetaceae (obligate acetoclastic) and Methanosarcinaceae (flexible substrate spectrum) occurred, as did the Methanomicrobiales and the Methanomassiliicoccales (that use the H2 dependent methylotrophic pathway). Methanomassiliicoccales were detected in every site with Methanomassiliicoccales specific qPCR primers AS1/AS2 (Mihajlovski et al., 2010) (data not shown). Their high abundance in Percowet indicates that besides the well reported hydrogenotrophic and acetotrophic pathways (Lyu et al., 2018), methylotrophic methanogenesis may contribute more to peatland CH4 emissions than currently assumed (Söllinger et al., 2016; Zalman et al., 2017).
Interactions between methanogens, methanotrophs and sulfate reducers
The second important player in peatland CH4 emissions is the heterogenic group of methanotrophic Bacteria and Archaea, acting as biological CH4 filter through aerobic or anaerobic oxidation of the produced CH4 (reviewed in Nazaries et al., 2013 and Knief, 2015). Do the methanogens influence abundance of methanotrophs? The methanotrophic groups differed with site, and were generally lower abundant in the drained sites where Ca. Methylacidiphilum aerobic CH4 oxidizers were dominant. These organisms were originally isolated from acidic and volcanic environments, but have recently also been found in pH neutral environments (van Teeseling et al., 2014; Vaksmaa et al., 2016). They are characterized by growth on low CH4 concentrations, and are possibly atmospheric CH4 oxidizers, which would make them independent of substrate supply by methanogens. As found in other wetland studies (e.g. Tveit et al., 2013, Smith et al., 2018) aerobic CH4 oxidizers of Methylococcaceae dominated in the wet sites. The anaerobic group Ca. Methylomirabilis (Vaksmaa et al., 2016), which uses oxygen from nitrite to reduce CH4 appeared in the sites with highest water content (Alderwet, Percodry and Percowet). The anaerobic CH4 oxidizing ANME-2d (Ca. Methanoperedens) which reduce CH4 by the reverse methanogenic pathway (Welte et al., 2016) were detected in the water-covered fen Alderwet. Although we did not find a clear correlation between methanogen and methanotroph abundance (see Wen et al., 2018 for similar findings), we did find a strong division of anaerobic and aerobic methanotrophs depending on water content and therefore oxygen availability, between sites and depths.
What is the basis of the environmental filter leading to the low methanogen abundance in the coastal fen? It is known that sulfate reducers can have an impact on methanogens, because methanogens and sulfate reducers not only share the anaerobic niche, but also compete for the same substrates, such as hydrogen (Kristjansson and Schönheit, 1983; Thauer et al., 2008; He et al., 2015) and acetate (Kristjansson et al., 1982). Due to their higher substrate affinity, sulfate reducers can outcompete methanogens, leading to lower methanogen abundance in the presence of sulfate reducers (Kristjansson et al., 1982; van Dijk et al., 2017). In fact, Desulfobacterales, known competitors for H2 as a substrate for methanogenesis, occurred in the coastal site Coastwet with a large proportion, which was associated with a more than tenfold lower mcrA gene abundance than in Alderwet and Percowet. The influence of salinity in tidal marshes is also known to decrease CH4 emission compared to freshwater sites (Poffenbarger et al., 2011; van Dijk et al., 2017). Although no CH4 emissions were measured in this study, the higher methanogen abundance in freshwater peatland suggests higher emission rates (Bartlett et al., 1987) than from the coastal fen. Our study provides microbiome-based insights into the environmental filtering effects of rewetting of fen ecosystems and suggests that, in terms of minimizing CH4 emissions, increased salinity and/or top soil removal might be promising options. Future analysis of seasonal microbiome dynamics and measurements of CH4 fluxes will provide evidence, whether these predictions hold true.
4. Experimental procedures
Sites and sampling
All sampling sites, alder carr, coastal fen and percolation fen, are located in north-eastern Germany (Fig. S5). The alder carr is part of the Recknitz river valley, was drained at least from 1786 on and has been used as a managed forest. The sub-site Alderwet (54°13’N 12°49’E) was unintentionally flooded in 1999 due to a blocked drain and has remained wet since then. In the sub-site Alderdry (54°13’N 12°51’E) long-term deep drainage Alderdry has caused subsidence of the soil surface of about 1 m.
The coastal fen, located on a peninsula, was naturally episodically flooded by brackish seawater coming from the Bay of Greifswald of the Baltic Sea, typically during winter storm surges. The entire area was diked in 1850 to allow for pasture and other agricultural use. In 1993, the dykes around the sub site Coastwet (54°16’N 13°39’E) were removed and, subsequently, the site was episodically flooded again. The sub-site Coastdry (54°16’N 13°39’E) in contrast remains behind the dyke and, thus, cut off from the seawater influence. Both, Coastwet and Coastdry are used as cattle pastures.
The percolation fens, representing the third type of peatlands, are located in the catchment areas of the rivers Trebel and Recknitz. Both sites were deeply drained for intensive land-use and used as deep-drained grassland in the 20th century. In 1998, the water table at the sub-site Percowet (54°10’N 12°74’E) in the Trebel valley was raised again to 5-10 cm above ground level as part of a large rewetting project (EU LIFE project) (Ministerium für Bau, Landesentwicklung und Umwelt, M-V 1998). In contrast, the water table of the still drained sub-site Percodry (54°13’N 12°63’E) in the Recknitz valley remains several decimeters below the surface and is mown 1-2 times per year.
At all sites peat samples were taken as triplicates at 5-10 cm, 15-20 cm and 25-30 cm depths (Fig. S5) using a gouge. The samples were stored in 50-ml reaction tubes on ice over night until further processing.
Soil physico-chemical properties
Soil moisture was measured gravimetrically by drying 2-3 g of soil over night at 90°C until mass constancy. Soil moisture is expressed as the percentage of lost water weight to wet soil weight. The potential soil pH was measured at room temperature with a digital pH meter (pH 540 GLP, WTW, Weilheim, Germany) in 0.01 M CaCl2 solution with a 1: 2.5 soil to solution ratio. Concentrations of total C, N and S were measured using a CNS analyzer (Vario MICRO cube – Elementar Analysensysteme GmbH Langenselbold, Germany). DOM was measured in soil extracts derived from mixing 3 g of previously frozen soil with 30 ml 0.1 M NaCl in 50 ml reaction tubes with subsequent shaking (vortex, 180 rpm) for 30 min. Extracts were filtered through 0.45 μm (pore size) sodium acetate filters, which were prewashed with 50 μl deionized H2O to remove soluble acetate. The concentrations and the composition of DOM based on size categories were determined using a size-exclusion chromatography (SEC) with organic carbon and organic nitrogen detection (LC-OCD-OND analyzer, DOC-Labor Huber, Karlsruhe, Germany) (Huber et al., 2011). The DOM was classified into three major sub-categories: (i) biopolymers, (ii) humic or humic-like substances including building blocks, and (iii) low molecular-weight substances. Time between sample preparation and analysis did never exceed two weeks and samples were stored at 5°C to avoid significant changes of DOM composition (Heinz and Zak, 2018). Soluble reactive phosphorus was determined with the ammonium molybdate spectrometric method (DIN EN 1189 D11) using a Cary 1E Spectrophotometer (Varian). N-NH4+ and N-NO3- were determined calorimetrically using the photometry CFA method (Skalar SAN, Skalar Analytical B.V., The Netherlands) according to the guidelines in EN ISO 11732 (DEV-E 23) and EN ISO 13395 (DEV, D 28), respectively.
DNA extraction and PCR/qPCR
DNA was extracted from 0.25 g soil using the DNeasy PowerSoil Kit (QIAGEN, Hilden, Germany) according to the manufacturer’s recommendation. The bead beating step was performed using a FastPrep®-24 5G instrument (MP Biomedicals, Santa Ana, USA), with intensity 5.0 for 45 s. DNA concentrations were measured with Qubit®2.0 dsDNA High Sensitivity and dsDNA Broad Range assays (Thermo Fisher, Waltham, USA). DNA size was analyzed using 1% agarose gels.
Quantitative polymerase chain reaction was used to measure the abundances of the mcrA gene, coding for methyl coenzyme M reductase subunit A. Quantification of mcrA gene copies in peat soil DNA extracts was performed on a qTOWER 2.2 (Analytic Jena, Jena, Germany). The primer pair of forward mlas-mod and reverse mcrA- rev (Steinberg and Regan, 2009) was used. For each reaction, 15 μl of PCR mixture contained 7.5 μl of innuMIX qPCR MasterMix SyGreen (Analytic Jena, Jena, Germany), 0.75 μl of each primer (10 pmol/μl), 5 μl of ddH2O and 1 μl of template DNA. Duplicate measurements of two concentrations (1 and 2 ng/μl) were performed for each DNA sample. Assay condition was 95°C for 5 min, 35 cycles of 95°C for 30 s, 55°C for 45 s and 72°C for 45°C, followed by melting curve analysis. PCR-product specificity was confirmed by melting point analysis. mcrA gene copy numbers were calculated from a standard curve obtained by serially diluting a standard from 106 to 101 mcrA gene copies per μl. The standard was created with above-mentioned primers by amplifying mcrA genes from cow rumen fluid (Söllinger et al., 2016) and cloning them into the pGEM®-Teasy vector system (Promega, Mannheim, Germany). Amplicons for mcrA standard were generated with vector-specific primers sp6 and T7 and the resulting PCR product was cleaned with DNA purification kit (Biozym, Hessisch Oldendorf, Germany), quality-controlled by agarose gel electrophoresis and quantified with Qubit®2.0 dsDNA High Sensitivity assay. The qPCR assay had the following parameters: slope: 3.41-3.52, efficiency: 0.92-0.96, R2: > 0.995.
Amplicon sequencing and bioinformatics
16S and 18S rRNA gene amplicons were prepared and sequenced using 300 bp paired-end read Illumina MiSeq V3 sequencing by LGC Genomics (Berlin, Germany). This comprised 16S and 18S rRNA gene PCR amplification, Illumina MiSeq library preparation and sequencing using the primer pair 515YF (GTG YCA GCM GCC GCG GTA A)/ B806R (GGA CTA CNV GGG TWT CTA AT) (Walters et al., 2015) for prokaryotes and 1183F (AATTTGACTCAACRCGGG)/ 1443R (GRGCATCACAGACCTG) (Ray et al., 2016) for eukaryotes.
The data were processed using R version 3.5.1 (The R Core Team, 2018). 16S rRNA and 18S rRNA gene amplicon sequences were quality filtered, de-replicated and clustered into ASVs using the dada2 package (Callahan et al., 2016). The chimeric sequences were de-novo checked and removed with dada2. Then the representative sequence of each ASV was assigned to taxonomy against a modified version of the SILVA SSUref_NR_128 data base, containing an updated taxonomy for Archaea (Lanzén et al., 2012), using the programs BLASTn (Altschul et al., 1990) and Megan 5 (Huson et al., 2016). ASVs that were assigned to Chloroplast or mitochondria were filtered. Due to the low number of sequences (<500) in one sample (Coastdry 2 15) for both 16S and 18S rRNA genes, this sample was discarded from further analysis. After filtering, 1,134,953 and 3,990,919 sequences, sequences were retained and were clustered into 7697 and 5548 ASVs for 16S and 18S rRNA genes, respectively. Plant sequences which accounted for 288 ASVs were filtered for downstream analysis to increase the resolution of other eukaryotic taxa.
Alpha diversity (Shannon entropy) of the microbial community was calculated using the package phyloseq (McMurdie and Holmes, 2013). ASV count table was then normalized using metagenomeSeq’s CSS (cumulative sum scaling) (Paulson et al., 2013). NMDS was performed to analyze the community composition using the package vegan (Oksanen et al., 2016) with defaults. Pairwise Spearman’s rank correlations were conducted among soil properties, DNA concentrations, qPCR data, NMDS axes and methanogen relative abundances using the package Hmisc to detect the significance of the impact of the factors on microbial communities (Harrell and Dunpont, 2019). The soil properties with significant impact were fitted into NMDS ordination using the envfit function in the vegan package.
The correlations were visualized by heatmap using corrplot. All P-values for multiple comparisons were adjusted by the false discovery rate (FDR) method and the null hypothesis was rejected when P-values were less than 0.05.
A co-occurrence network was constructed to explore the potential interactions between species. Plant ASVs were included in network analysis because plant residues are a major part of peat and they might be important in interactions between microbes. To eliminate the influence of rare taxa, ASVs with relative abundances lower than 0.05% were discarded. The pairwise Spearman’s rank correlations were conducted with the package Hmisc and all P-values were adjusted by the FDR. The cut-offs of adjusted P-value and correlation coefficient were 0.01 and 0.7, respectively. The network was visualized using package igraph (Csardi, 2019). A network showing the connections between eukaryotes and prokaryotes was sub-selected from the original network by keeping the edges connecting these two groups. The indicators of each group or group combination of a factor (site or water condition) were identified using indicspecies package.
The microbial ecological functional groups were predicted using FAPROTAX (Louca et al., 2016), The identified groups were verified based on literature knowledge. ANME2-D group within Methanosarcina known as methanotrophic, using the methanogenic pathway in reverse, was excluded from methanogens. All plots were created using package ggplot2 (Wickham, 2016).
Acknowledgement
The authors would like to thank Florian Beyer for providing the maps and arrangement of figure S5. The European Social Fund (ESF) and the Ministry of Education, Science and Culture of Mecklenburg-Western Pomerania (Germany) funded this work within the scope of the project WETSCAPES (ESF/14-BM-A55-0034/16 and ESF/14-BM-A55-0030/16).
References


