

Summary
Intracellular ion fluxes emerge as critical actors of immunoregulation but still remain poorly explored. Here we investigated the role of the redundant cation channels TMEM176A and TMEM176B (TMEM176A/B) in RORγt+ cells and conventional dendritic cells (cDCs) using germline and conditional double knock-out (DKO) mice. While Tmem176a/b appeared surprisingly dispensable for the protective function of Th17 and group 3 innate lymphoid cells (ILC3s) in the intestinal mucosa, we found that they were required in cDCs for optimal antigen processing and presentation to CD4+ T cells. Using a real-time imaging method, we show that TMEM176A/B accumulate in dynamic post-Golgi vesicles preferentially linked to the late endolysosomal system and strongly colocalize with HLA-DM. Together, our results suggest that TMEM176A/B ion channels play a direct role in the MHC II compartment (MIIC) of DCs for the fine regulation of antigen presentation and naive CD4+ T cell priming.
Introduction
Multiple ion channels and transporters are expressed in both innate and adaptive immune cells to control various vital functions, from membrane potential regulation to receptor signaling or migration1. The role of ion flux has notably been fully appreciated following the molecular characterization of the store-operated Ca2+ entry (SOCE) through Ca2+ release–activated Ca2+ (CRAC) channels mediated by the ORAI/STIM complex, best characterized in T cells. However, this system appears dispensable for key functions of macrophages and dendritic cells (DCs) while Ca2+ signaling remains critical in these cells2,3. This observation points to the importance of alternative systems, yet to be discovered, that regulate the intracellular and luminal concentrations of Ca2+ but also other ions including Na+, K+, Cl−, Mg2+ or Zn2+ for the control of immune responses. In comparison with the plasma membrane, there is still a paucity of studies investigating the role of intracellular ion channels and transporters, notably in DCs4, that could provide major insights into the understanding of new immunomodulatory mechanisms.
We previously showed that the co-regulated genes Tmem176a and Tmem176b encode redundant acid-sensitive, non-selective, cation channels5,6 whose precise functions remain largely unknown in vivo. Transcriptomic, SNP or epigenetic analysis have associated these homolog genes with different pathologies such as multiple sclerosis7, chronic obstructive pulmonary disease (COPD)8 or age-related macular degeneration (AMD)9. These findings suggest an important role of Tmem176a/b in the development of inflammatory diseases thus emphasizing the need to identify the immune cell types and the functions in which they are predominantly involved.
We initially cloned Tmem176b (originally named Torid) as an over-expressed gene encoding an intracellular four-span transmembrane protein in myeloid cells infiltrating non-rejecting allografts10. We later demonstrated its contribution to the suppressive function of ex vivo-generated tolerogenic DCs through antigen cross-presentation by allowing cation (Na+) counterflux required for progressive endophagosomal acidification5. However, the function of this ion flux in the homeostasis and physiological response of conventional DCs has not been explored and is likely achieved by both TMEM176A and TMEM176B in a redundant fashion6.
Unexpectedly, besides myeloid cells, we and others reported a strong expression of Tmem176a and Tmem176b in the retinoic-acid-receptor-related orphan receptor-γt-positive (RORγt+) lymphoid cell family, also referred to as type 3 (or type 17) immune cells, producing the prototypical cytokines IL-17 and IL-22 and including Th17 CD4+ T cells, γδT17 cells, group 3 innate lymphoid cells (ILC3s) and NKT17 cells6,11–14. Moreover, the Littman group included Tmem176a/b in the restricted group of 11 genes whose expression is directly dependent on RORγt in Th17 cells15. However, in our previous study, we found no or only modest effect of Tmem176b single deficiency in different models of autoinflammation linked to type 3 immunity6. We speculated that the absence of Tmem176b could be efficiently compensated by its homolog Tmem176a, located in the same genomic locus, thus masking possible phenotypic alterations.
Here we have used germline and conditional (“floxed”) double knock-out (DKO) mice to unequivocally determine the importance of Tmem176a and Tmem176b in the biology of RORγt+ cells and conventional DCs in vivo. In that respect, this is the first study exploring the consequence of Tmem176a/b double deficiency in vivo. Furthermore, we have combined these functional results with the elucidation of the precise trafficking of both proteins using a real-time imaging method. Our findings show that, while Tmem176a/b appear surprisingly dispensable for RORγt+ cell functions, these genes are required in the MHC II pathway in DCs for efficient priming of naive CD4+ T cells.
Results
Generation of germline and conditional double KO (DKO) mice simultaneously targeting Tmem176a and Tmem176b
Tmem176a and Tmem176b are homolog genes encoding structurally similar four-span transmembrane proteins6,10,16 (Figure 1A). In the immune system, our previous studies6,10,17 combined with the analysis of Immuno-Navigator18 and Immgen19 public databases (Figure S1) indicate that Tmem176a and Tmem176b are tightly co-regulated and highly expressed both in conventional DCs and in the RORγt+ cell family (depicted in Figure 1B). Taken together, these observations along with reported evidence of genetic compensation in Tmem176b−/− single KO mice6 strongly suggested the need to simultaneously target both genes to decipher their function.

(A) Graphical topology of mouse TMEM176A and TMEM176B using Protter. The most conserved amino acids between both molecules and across multiple species are highlighted and mainly concentrate within the three first transmembrane domains and in the N-terminal region. (B) Synthetic view of Tmem176a and Tmem176b expression in immune cells summarized from the literature and public databases (Figure S1). Dark red represents the highest expression. (C) Generation of germline Tmem176a/b double KO (DKO) mice carrying a large deletion using a dual CRISPR–Cas9 strategy. Tmem176a and Tmem176b genes are oriented in an opposite direction in the same genomic locus and share analogous intron-exon organization, with the respective first coding exons only separated by 3.8 kb. Small arrows labeled BR, BR, AF and AR show the position of the primers used for PCR genotyping of the mutant mice. Exons are shown as filled boxes and untranslated regions as shaded boxes. (D) Generation of conditional Tmem176a/b DKO mice. Small arrows labeled bEf, bEr, aEf and aEr show the position of the primers used for PCR genotyping of the mutant mice.
As described previously in a methodological study20, we generated a germline double KO (DKO) mouse (Figure 1C) in the pure C57BL/6N genetic background. Homozygous DKO mice were born in a Mendelian ratio and appeared normal, without any significant difference in weight from control WT littermates, suggesting that Tmem176a/b are not absolutely required, or can be sufficiently compensated, during development.
In order to clearly associate a cell type with a potential phenotypic observation resulting from Tmem176a/b deficiency, we also engaged in the generation of a conditional DKO mouse (Tmem176a/bflox) (Figure 1D) that we crossed to Rorc(γt)-Cre and CD11c-Cre (Itgax-Cre) mice to target RORγt+ and CD11c+ cells, respectively.
Tmem176a/b DKO mice exhibit normal ILC3 and Th17 distribution and RORγt cell-dependent protective functions in the gut mucosa
Owing to the high expression of Tmem176a/b in RORγt+ cells, we focused our attention on the intestinal mucosa where these cells preferentially localize to exert their sentinel function in response to the gut microbiota21. Flow cytometry analysis (gating strategy depicted in Figure S2A-B) of CD4+ T cells and ILCs in the small intestine and colon lamina propria revealed no differences in the proportions of Th17 or ILC3 subsets between WT and DKO mice (Figure 2A). Furthermore, in vitro cytokine production of intestinal CD4+ T cells and ILCs was not affected by Tmem176a/b double deficiency (Figure 2B). Concordant with this, we did not detect any significant change in the level of expression of Rorc2 (the isoform encoding RORγt), Il23r, Il22, Il17a or Il17f as well as target genes of the IL-22/IL17 axis in the small intestine and colon of DKO mice (Figure S2C).

(A) Relative frequencies of the indicated populations in the small intestine (siLP), colon (cLP) lamina propria and spleen of WT and Tmem176a/b DKO littermate mice. Data shown are means (±SD) of three independent experiments. (B) In vitro cytokine secretion by CD4+ T cells and ILCs FACS-sorted from the intestinal lamina propria of WT and Tmem176a/b DKO littermate mice following in vitro culture (18 h) with the indicated stimuli. Data shown are means (±SD) of triplicates representative of three independent experiments. (C) Acute colitis induced with 2% DSS in drinking water for 7 consecutive days in germline Tmem176a/b (left panels) and RORγt+ cell-restricted conditional (right panels) DKO mice in comparison to control mice. Data are presented as percent of initial weight (±SEM) and survival (weight loss >20%). (D) Infection with C. rodentium administered orally (2×10⁹ CFU) in germline Tmem176a/b and RORγt+ cell-restricted conditional DKO mice in comparison to control mice. (E) Quantification of C. rodentium EspB gene by qPCR in the faeces prior infection and 6 days post-infection. Bars indicate means and dots represent individual mice. ND : Not detected.
To test whether Tmem176a/b could play a role in RORγt+ cells in the context of inflammatory responses in the gut mucosa, we used the injury-induced self-resolving model of dextran sodium sulfate (DSS)-induced acute colitis in which Th17/ILC3-derived IL-22 is pivotal to restore barrier integrity upon epithelial damage22,23. However, both germline DKO and Tmem176a/bfl/flRorc-Cre+/– conditional mice exhibited a similar response to DSS when compared to control mice (Figure 2C). Next, we used an infectious colitis model using Citrobacter rodentium, a mouse attaching and effacing bacterial pathogen considered as an excellent model of clinically important human gastrointestinal pathogens and against which ILC3s and Th17 have been shown to play a protective and redundant role11,24,25. As shown in Figure 2D, Tmem176a/b deficiency did not hamper the mouse resistance to this infection. Moreover, although fecal Citrobacter rodentium bacterial loads detected by qPCR appeared increased in RORγt-specific conditional DKO, this difference did not reach statistical significance and was not found in germline DKO mice compared to respective control mice (Figure 2E).
Thus, these results suggest that Tmem176a/b are not critical for the development and protective functions of ILC3s and Th17 in the intestinal mucosa.
DCs develop normally in Tmem176a/b-deficient mice
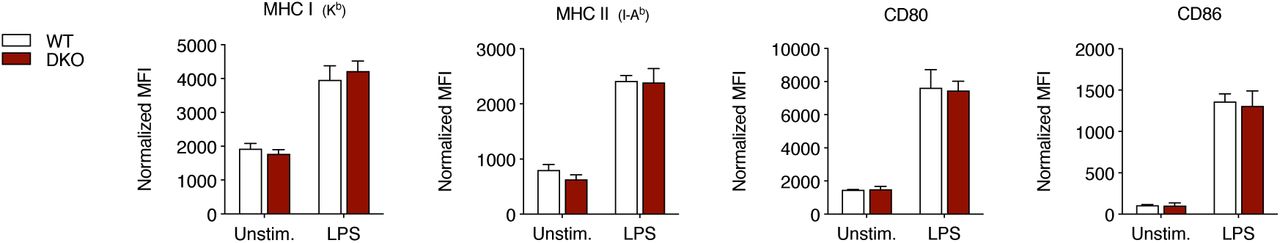
Next, we investigated the effect of Tmem176a/b double deficiency in the biology of conventional DCs (cDCs). First, because both genes are highly expressed in the majority of hematopoietic precursors including cDC progenitors (Figure 1B and Figure S1), we assessed their frequency in the bone marrow but found no alteration in DKO mice (Figure 3A and Figure S3). Accordingly, the percentages and absolute numbers of CD11chigh MHC II+ cells in the spleen and, within this population, the proportions of the two main conventional DC subsets, namely cDC1 (CD11b− CD8α+) and cDC2 (CD11b+ CD8α−), were similar between WT and DKO mice (Figure 3B). Furthermore, MHC I, MHC II, CD80 (B7-1) and CD86 (B7-2) surface expression on cDC1 and cDC2 were not affected by Tmem176a/b deficiency and LPS stimulation elicited an equally strong upregulation of MHC II, CD80 and CD86 at the surface of both WT and DKO cDC subsets (Figure 3C). Finally, purified spleen cDCs from WT and DKO mice produced similar basal levels of IL-12 and IL-6 that were both increased with the addition of LPS (Figure D).

(A) Hematopoietic stem cell and progenitor numbers in the bone marrow of WT and Tmem176a/b DKO mice analyzed by flow cytometry. Bars indicate means and dots represent individual mice. (B) Gating strategy (left panels) and quantification (right panels) of spleen cDCs and subsets from WT and Tmem176a/b DKO littermate mice by flow cytometry. Bars indicate means and dots represent individual mice. Data were pooled from three independent experiments. (C) Expression of MHC I, MHC II, CD80 and CD86 molecules at the surface of spleen cDC1 and cDC2 from WT and Tmem176a/b DKO littermate mice. Cells were analyzed by flow cytometry freshly after cell preparation or upon LPS stimulation for 6 h in vitro. Shown histograms data are representative of three independent experiments. FMO : Fluorescence minus one. (D) IL-12 and IL-6 secretion by purified cDCs purified from the spleen of WT and Tmem176a/b DKO littermate mice and cultured for 16 h with or without LPS. Data were pooled from three independent experiments. (E) Heatmap showing unsupervised clustering z-scores of the differentially acetylated (DA) peaks between WT and DKO spleen cDCs. (F) Volcano plot of the 962 DA peaks (red). Relevant genes linked to MHC class II pathway are highlighted. (G) Genome browser of Cd74, hyperacetylated in DKO. (H) Gene ontology of the 445 DA peaks up-regulated in DKO vs WT. (I) Expression of Tmem176a and Tmem176b assessed by RT-qPCR in the indicated populations FACS-sorted from the spleen. Bars indicate means and dots represent individual mice.
In the absence of obvious developmental abnormalities of cDCs, we sought to identify dysregulated cellular pathways resulting from the absence of Tmem176a/b. Chromatin dynamics reflect with great sensitivity gene regulation and play important roles in immune functions such as trained innate immunity26 or T cell effector/memory differentiation27. To investigate whether epigenetic alterations are present in DKO cDCs we FACS-sorted CD11chighMHC II+ cells and performed chromatin immunoprecipitation by targeting lysine H3K27 acetylation (H3K27ac) followed by sequencing (ChIP-seq) to detect active promoters and enhancers (epigenomics road map). We found that 962 enhancers were significantly differentially acetylated (DA) between WT and DKO cDCs (Figure 3E-F). Interestingly, one of the most significantly DA gene regulatory region covered the entire Cd74 gene (Figure 3G) and MHC gene ontology analysis included antigen processing and MHC II protein molecules (Figure 3H). Together, these data suggest that Tmem176a/b deficiency could impact intracellular processes of the MHC II pathway and lead to selective genetic adaptations. Further supporting a role of Tmem176a/b in the MHC II pathway, we found that both homologs were clearly over-expressed in cDC2 when compared to B cells, pDCs and cDC1 (Figure 3I), consistent with the propensity of this subset in priming naive CD4+ T cells through MHC II antigen presentation28.
Tmem176a/b are required for optimal presentation of exogenous antigens to CD4+ T cells by DCs
To determine whether Tmem176a/b are required in DCs for antigen presentation in vivo via MHC I or MHC II molecules, we set out to test different models of dominant CD8+ or CD4+ T cell responses.
First, using a minor histocompatibility transplantation model in which male skin is grafted onto female recipients, we found that WT and DKO exhibited the same rate of graft rejection (Figure 4A), suggesting that CD8+ T cell priming and effector functions were not impaired in the absence of Tmem176a/b. Next, we examined whether anti-tumor immune responses could be influenced by Tmem176a/b deficiency. Notably, we hypothesized that DKO could exhibit enhanced anti-tumor immunity owing to a recent study proposing that targeting Tmem176b could improve anti-tumor CD8+ T-cell response by de-repressing inflammasome activation in myeloid cells29. Subcutaneous injection of OVA-expressing EG7 thymoma led to detectable tumors within two weeks in all mice and, consistently with the relatively immunogenic nature of this cell line in our experimental conditions, tumor regression was then observed in a large fraction of the mice but without significant difference between WT and DKO mice (Figure 4B and Figure S4). Furthermore, Tmem176a/b deficiency did not impact tumor growth and mouse survival with two aggressive tumor cell lines, MCA101-sOVA fibrosarcoma and B16-OVA melanoma (Figure 4B and Figure S4). Thus, our results show that the absence of Tmem176a and Tmem176b does not prevent nor enhance CD8+ T-cell responses. To evaluate CD4+ T-cell responses in vivo, we first used the model of experimental autoimmune-encephalomyelitis (EAE) induced by MOG35–55 peptide or MOG1–125 protein immunization (Figure 4C). Interestingly, whereas EAE developed similarly between WT and DKO mice with MOG peptide immunization (Figure 4D), DKO mice appeared less susceptible if the MOG protein was used (Figure 4E), thus pointing to a specific role of Tmem176a/b in antigen processing before peptide-MHC II complex display at the surface. Because of the high variability of this model, we next turned to a model of delayed-type hypersensitivity (DTH) (Figure 4F). Again, we observed that DKO mice differed from WT mice for the DTH response upon challenge in the footpad only if the whole protein was used for the immunization (Figure 4G-H). Taken together, these data suggest that Tmem176a/b deficiency selectively affects the intracellular processing of exogenous antigens for naive CD4+ T-cell priming.

(A). Rejection rates of male skin graft transplanted onto female WT and Tmem176a/b DKO mice. Donor and recipient mice were matched for the presence or absence of Tmem176a/b. (B) Survival curves of WT and Tmem176a/b DKO mice injected with EG7, MCA101-sOVA or B16-OVA tumor cell line. (C) Schematic representation of EAE induction using MOG35–55 peptide or MOG1–125 protein. PT : Pertussis toxin. (D) EAE incidence and score (means±SEM) in WT and Tmem176a/b DKO mice using MOG35–55 peptide for immunization. (E) EAE incidence and score (means±SEM) in WT and Tmem176a/b DKO mice using MOG1–125 protein for immunization. (F) Schematic representation of DTH response using OVA323–339 peptide or whole OVA protein for immunization. (G) Left (control) and right footpad swelling (means±SEM) upon injection with the indicated heat-aggregated proteins in WT and Tmem176a/b DKO mice using OVA323–339 peptide for immunization. (H) Left (control) and right footpad swelling (means±SEM) upon injection with the indicated heat-aggregated proteins in WT and Tmem176a/b DKO mice using whole OVA protein for immunization.
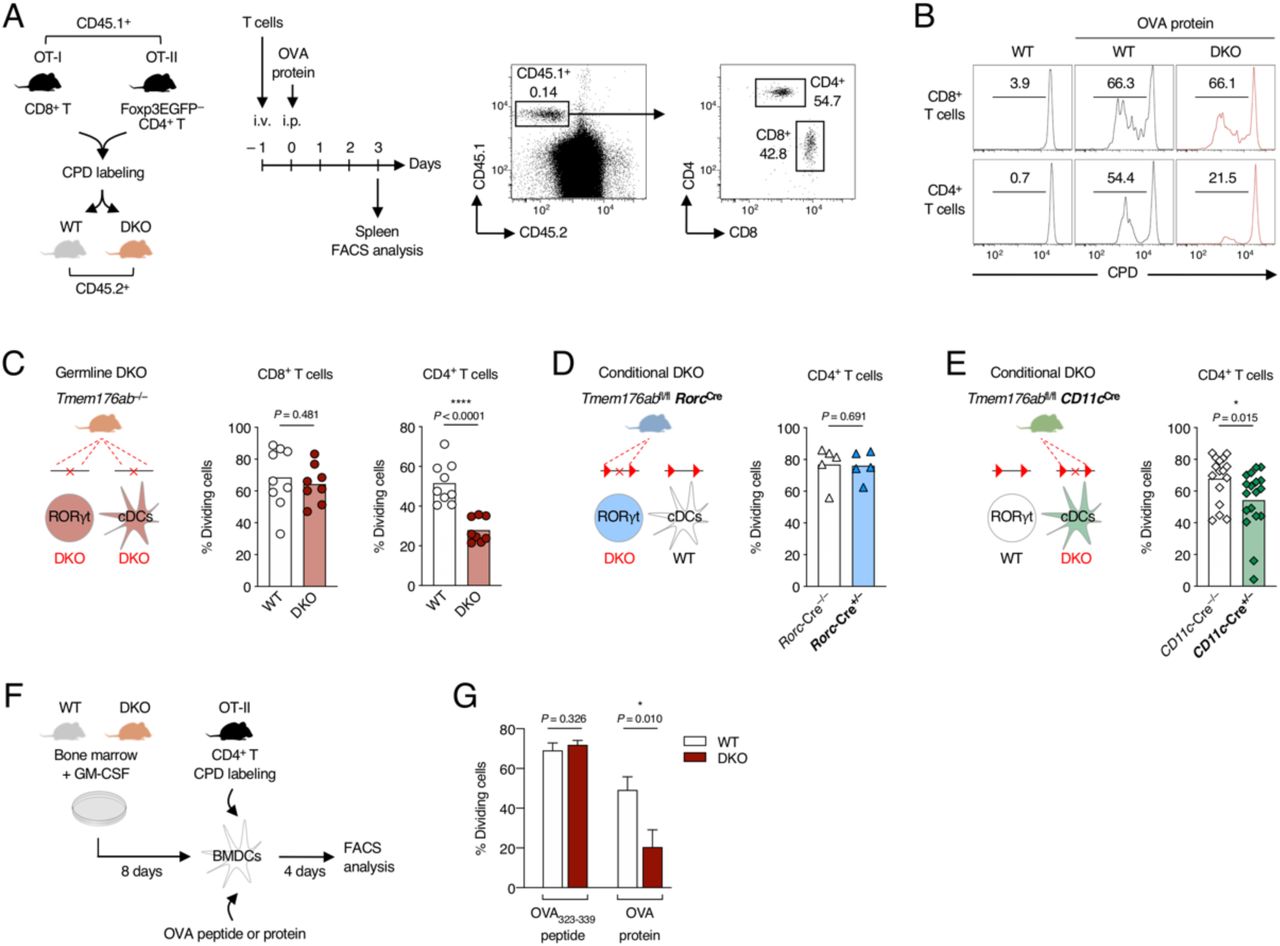
To further test this hypothesis, we directly assessed antigen-specific T-cell proliferation in WT and DKO mice using naive OVA-specific CD8+ and CD4+ T cells (Figure 5A). It is important to note that cDCs are strictly required in this system to induce activation and proliferation of naive T cells30. As shown in Figure 5B-C, CD4+ T cell proliferation was markedly diminished in DKO mice in comparison to WT mice whereas CD8+ proliferation was not. Importantly, this alteration was not observed in Tmem176a/bfl/flRorc-Cre+/– conditional mice (Figure 5D) but was replicated, although to a lesser extent than in germline DKO mice, in Tmem176a/bfl/flCD11c-Cre+/– mice (Figure 5E).

(A) Schematic representation of the in vivo antigen-specific T cell proliferation assay and gating strategy for tracking the injected OVA-specific T cells by flow cytometry. CPD : cell proliferation dye. (B) Representative histograms showing the level of proliferation (reflected by CPD dilution) of the OVA-specific CD8+ and CD4+ T cells following OVA protein injection in WT and Tmem176a/b DKO mice. (C) Quantification of OVA-specific CD8+ and CD4+ T cell proliferation in WT and Tmem176a/b DKO mice. (D-E) Quantification of OVA-specific CD4+ T cell proliferation in RORγt+ cell-restricted (D) or CD11c+ cell-restricted (E) conditional DKO mice. Bars indicate means and dots represent individual mice. Data were pooled from at least two independent experiments. (F) Schematic representation of the in vitro antigen-specific CD4+ T cell proliferation assay using BMDCs as antigen-presenting cells. (G) Quantification of CD4+ T cell proliferation following incubation of BMDCs from WT and Tmem176a/b DKO mice with OVA323–339 peptide or whole OVA protein. Data shown are means (±SD) of triplicates and are representative of two independent experiments.
In vitro antigen-specific CD4+ T-cell proliferation was also significantly decreased in the absence of Tmem176a/b using GM-CSF-induced bone-marrow derived DCs (BMDCs) only when OVA protein was used (Figure 5F-G), while surface expression of MHC II and co-stimulatory molecules remained unaltered (Figure S5).
In conclusion, these results show that Tmem176a/b have an intrinsic function in DCs to allow efficient presentation of exogenous antigens onto MHC II molecules and priming of naive CD4+ T cells.
Tmem176a/b-deficient cDCs exhibit normal antigen uptake and degradation but dysregulated H2-M expression selectively in cDC2
Antigen presentation by MHC II molecules is achieved through a series of complex events (depicted in Figure 6A) beginning with the uptake and mild degradation of exogenous antigens and including finely regulated processes in the specialized MHC II compartment (MIIC)31.

(A) Schematic overview of the MHC II pathway. The late endocytic compartment in which MHC II peptide loading occurs is referred to as the MHC II compartment (MIIC). Newly synthesized MHC II molecules in the endoplasmic reticulum (ER) bind to the invariant chain (Ii or CD74) that prevents premature loading with endogenous peptides before HLA-DM (H2-M in mouse) catalyzes the release of the class II-associated invariant chain peptide (CLIP) in the MIIC. Another MHC II-like protein, HLA-DO (H2-O in mouse), may add another level of regulation by inhibiting H2-M. ILVs : intraluminal vesicles. (B) In vitro antigen uptake and degradation by spleen cDCs from WT and Tmem176a/b DKO mice using Alexa 488-coupled OVA and DQ-OVA (that emits fluorescence upon degradation), respectively. Bars indicate means and dots represent individual mice. (C) Surface (white area) and intracellular (total, grey area) expression of MHC II, Ii, H2-M (αβ2 dimer) and H2-O (β chain) molecules in B cells, cDC1 and cDC2 populations from the spleen of WT and Tmem176a/b DKO mice. Bars indicate means and dots represent individual mice. Data were pooled from two independent experiments.
Both OVA endocytosis and degradation were similar in WT and DKO cDCs (Figure 6B), indicating that altered MHC II-mediated antigen presentation by Tmem176a/b DCs cannot be explained by a defect in the initial steps of antigen processing.
To determine whether Tmem176a/b deficiency could influence the surface or intracellular levels of key players in the MHC II pathway, we analyzed the expression of MHC II (I-Ab), Ii (invariant chain), H2-M and H2-O in splenic B cells, cDC1 and cDC2 by flow cytometry (Figure 6C). As expected, cDC1 exhibited the highest levels of intracellular MHC II, Ii and H2-O whereas H2-M was primarily expressed in cDC2, an equilibrium concordant with the intrinsic efficiency of this subset in MHC II processing28. Strikingly, while we did not detect aberrant expression of these molecules at the surface of DKO cells, we found that, intracellular H2-M was paradoxically and selectively over-expressed in the cDC2 subset of DKO mice compared to WT mice (Figure 6C, lower left panel).
Taken together, these data suggest that Tmem176a/b-mediated function is directly involved in the MIIC for optimal MHC II antigen loading or trafficking.
TMEM176A and TMEM176B traffic in dynamic vesicles between the Golgi apparatus and the endolysosomal compartments
To gain insight into the intracellular function of TMEM176A/B ion channels, we aimed to elucidate their subcellular localization that remains elusive as different studies reached different conclusions5,6,32. To this end, we used the Retention Using Selective Hooks (RUSH) system33, a two-state assay allowing fluorescence-based analysis of intracellular trafficking in living cells at physiological temperature (Figure 7A). We performed dual-color imaging using multiple organelle-specific proteins or probes (Figure 7B) to track the intracellular fate of TMEM176A/B from the endoplasmic reticulum (ER). We used HeLa cells as they allow higher resolution of intracellular compartments compared to immune cells. Addition of biotin triggered a rapid change in the TMEM176B signal from a network of tubular elements characteristic of the ER to a pattern reminiscent of the Golgi apparatus but which rapidly evolved into multiple dynamic vesicles (Figure 7C and Supplementary Video 1). TMEM176A and TMEM176B exhibited a very similar intracellular dynamic, as measured by strong colocalization throughout the time of acquisition (Figure 7D and Supplementary Video 2).

(A) Principles of the retention using selective hooks (RUSH) system. In the setting we chose to implement for this two-state assay, the protein of interest is fused to the streptavidin binding protein (SBP) and is retained in the donor compartment (here the endoplasmic reticulum, ER) in which the hook (here an isoform of the invariant chain fused to the core streptavidin) remains localized. Synchronous release of the protein of interest is induced by addition of biotin and intracellular trafficking can be monitored by measuring fluorescent tags such as enhanced (E)GFP or mCherry signal by time-lapse confocal microscopy. (B) Schematic representation of the different intracellular compartments and associated markers analyzed. Proteins analyzed using RUSH constructs are indicated (C) Micrographs of HeLa cells expressing the TMEM176B-EGFP RUSH construct prior and after addition of biotin. Bar, 10 μm. (D) Dual-color analysis using the TMEM176A-EGFP and TMEM176B-mCherry RUSH constructs. Insets show higher magnifications of regions of interest. Circles show examples of colocalized signals. (E) Dual-color analysis using the TMEM176B-mCherry and Golgin-84-EGFP RUSH constructs. (F) Pearson’s correlation coefficients comparing TMEM176B with TMEM176A and Golgin-84 signals. (G) Dual-color analysis using the TMEM176B-mCherry or TMEM176B-EGFP RUSH constructs and the indicated genes or probes, >40 min after biotin addition. (H-I) Dual-color analysis in Hela-CIITA cells using the TMEM176B-mCherry RUSH construct with the YFP-associated HLA-DR (H) or HLA-DM (I) plasmids, >40 min after biotin addition. To avoid interference of the ER-resident mutated form of Ii (in the TMEM176B RUSH construct) on normal dynamic of the MHC II pathway, Ii was replaced by Golgin-84 as a hook in a new construct. To compensate for the low transfection efficiency of the DR/DM constructs, YFP+ cells were FACS-sorting 24 h before imaging. (J) Pearson’s correlation coefficients comparing TMEM176B with CD44, HLA-DR and HLA-DM signals. Each dot represents an individual cell.
Confirming our previous hypothesis that TMEM176B traffics through but does not accumulate in the Golgi apparatus6, it clearly separated from Golgin-84, a Golgi-resident protein. After 10–15 min of incubation with biotin, Golgin-84 reached the Golgi apparatus where it stayed after longer incubation time in contrast to TMEM176B (Figure 7E-F and Supplementary Video 3). We then examined a variety of markers depicted in Figure 7G. We did not, or only marginally, observe accumulation at the plasma membrane, a result that was confirmed by co-imaging with CD44. Interestingly, TMEM176B-bearing vesicles could interact with RAB5+ early endosomes as well as with RAB7+ late endosomes. We generated a LAMP1 (CD107a) RUSH construct to best reveal endolysosomes and also observed a strong association with TMEM176B trafficking during the post-Golgi time frame. Of interest, TMEM176B could be found colocalized with TNF or TfR (transferrin receptor), during the late events of endocytosis/recycling of these proteins. However, TMEM176B was not associated with RAB4, a marker of recycling endosomes. Although we cannot rule out alternate recycling pathways, these result suggest that TMEM176A/B follow a relatively selective route among the various vesicular compartments of the cell. In this line, TMEM176B did not traffic through mitochondria labeled by the Mitotracker probe but was significantly associated with Lysotracker that preferentially marks acidic vesicles. Moreover, we found some colocalization signals using a cation-dependent mannose-6-phosphate receptor (CD-MPR) RUSH construct but even stronger association with the monomeric clathrin adaptor GGA1, known to decorate the carrier vesicles budding from the TGN and merging toward the endosomes34.
Taken together, these data show that TMEM176A/B ion channels preferentially localize in the late endosomal compartment and in vesicular vesicles between the Golgi and the endolysosomal system.
TMEM176B colocalizes with HLA-DM in MHC II-expressing cells
Given the requirement of Tmem176a/b in MHC II antigen presentation, the selective alteration of H2-M expression in cDC2 and the preferential trafficking of TMEM176A/B in the late endosomal compartment, we asked whether these ion channels could localize in the MIIC. To recapitulate the MHC II pathway in HeLa cells, we used the HeLa-CIITA cell line that stably expresses the transactivator CIITA35. To reveal MHC II (HLA-DR) and HLA-DM localization in these cells, we used plasmid constructs expressing YFP tagged to the beta or alpha chains of each molecule, respectively, as described in Zwarts et al.36. Colocalized signals were detected between TMEM176B and HLA-DR, mostly in intracellular vesicles (Figure 7H). However, a more pronounced association was observed with HLA-DM in intracellular compartments presumably highlighting the MIIC.
Thus, these results strongly suggest that TMEM176A/B exert their function directly in the MIIC to contribute to efficient MHC II peptide loading and/or trafficking.
Discussion
Finely tuned ion influx and efflux result from various intricate interplays of multiple channels likely tailored for each type of cell and maturation status. The intriguing high expression of TMEM176A and TMEM176B cation channels in both RORγt+ lymphoid cells and DCs logically raises the question of their specific role in these two very distinct immune cell types. Based on expression and functional data, we reasoned that each gene has the potential to compensate for each other and that simultaneous targeting would be a requisite to avoid such redundancy.
We present here the first functional study of Tmem176a/b double KO (DKO) mice, either germline or conditional. Given the broad tissue expression of Tmem176a/b, the “floxed” conditional mouse represents an invaluable tool to achieve Cre-mediated cell-specific deletion and document the role of these ion channels in virtually any tissue or cell of interest. Indeed, there is a growing interest in understanding the role of these homolog genes that are over-expressed in a wide range of cell types other than immune cells including fibroblast subsets37, neurons38, adipocytes39 or tumor cells40–42, likely adapting a universal mechanism of intracellular ion flux regulation to their specific needs. Importantly, these Tmem176a/b DKO mice were generated directly in a pure genetic background (C57BL/6N) thus avoiding incorrect interpretations resulting from carryover of gene variants of a different background surrounding the targeted locus43,44.
The striking expression of Tmem176a/b in all type 3 immune cells and their dependency on the master transcription factor RORγt15 make these homologs promising candidates to uncover novel aspects of RORγt+ cell biology beyond their cytokine production and could represent a novel therapeutic entry point for treating immune-mediated diseases. However, our results indicate that RORγt-dependent intestinal repair and host defense functions are not compromised in the absence of Tmem176a/b. Furthermore, the normal development MOG35–55 peptide-induced EAE suggest that these genes are not required for the pathogenicity of Th17 in this model. Investigating the transcriptomic and epigenetic profiles of purified DKO ILC3s or Th17 cells may expose compensatory mechanisms notably involving the regulation of other ion channels that could sufficiently counterbalance the absence of Tmem176a/b. It is also tempting to speculate that these homologs could be required for IL-17/IL-22-independent functions in RORγt+ cells, including the regulation of anti-commensal effector CD4+ T-cells by ILC3s through MHC II-mediated inhibitory presentation45,46. Although Tmem176a/bfl/flRorc-Cre+/– conditional mice did not exhibit increased CD4+ T cell activation and proliferation nor neutrophil accumulation in the colonic lamina propria in comparison to control mice (data not shown), the fact that ILC3s selectively share with DCs the expression of MHC II molecules is in favor of a pivotal role of Tmem176a/b in this adaptive function.
In view of the recent study by Segovia et al.29 using Tmem176b single KO mice or an ion channel inhibitory molecule, our results do not support the hypothesis that inhibiting TMEM176A/B-mediated ion flux could enhance anti-tumor CD8+ T-cell response in vivo. Moreover, we did not observe increased IL-1β production by Tmem176a/b-deficient BMDCs (data not shown). One can speculate that TMEM176B must be targeted alone, leaving TMEM176A function intact, to obtain such phenotype, and that the effect of the inhibitory molecule is therefore achieved in a selective manner. Alternatively, because of the 129 genetic background origin of the Tmem176b single KO mouse5, confounding genetic factors could be invoked, despite >10 backcrosses onto the C57BL/6 background and the use of littermates47.
We initially reported that Tmem176a/b were highly expressed in cDCs but not in pDCs10,17, likely a consequence of E2-2-mediated repression as revealed by Ghosh et al. for Tmem176a48. Remarkably, recent mouse and human single-cell RNA-seq analysis highlighted these homologs as markers of selective DC subsets, both in mouse and human49–51. Notably, the association of TMEM176B expression with a subset of cDC2 in Binnewies et al.51 is concordant with our data in the mouse showing that Tmem176a/b are markedly over-expressed in cDC2 compared to cDC1. cDC2 exhibit an overall dominance in MHC II presentation in vivo resulting from the combination of their intrinsic efficiency28,52 and their favorable position within lymphoid tissues for antigen uptake53. Consistently, we found that Tmem176a/b deficiency selectively affected the capacity of DCs to prime naive CD4+ T cells but not CD8+ T cells in vivo. Our results point to a defect in the intracellular processing events for exogenous antigen presentation to MHC II molecules. However, this functional alteration is not complete and it is possible that, in the same manner as in ILC3s, compensatory mechanisms develop in DCs in the absence of Tmem176a/b. In support of this hypothesis, the fact that H2-M was found selectively over-expressed in cDC2 of DKO mice suggests an adaptation to alleviate a defect in the MIIC for peptide loading onto MHC II molecules. Alternatively, this expression may also reflect an incorrect intracellular localization of H2-M, therefore disrupting the optimal processes leading to MHC II presentation. The analysis of TMEM176A/B intracellular dynamics enabled us to clearly delineate that they preferentially traffic in the late endolysosomal system in close relationship with the Golgi apparatus. In contrast with the limitations in sensitivity and the non-dynamic nature of classical immunostaining, the RUSH system was instrumental in revealing the route taken by TMEM176A/B from the ER and beyond the Golgi apparatus. However, because we focused on the first hour of trafficking after release in most of our analyses, we cannot exclude that TMEM176A/B can eventually reach other compartments over time.
The strong colocalization found with HLA-DM in HeLa-CIITA cells supports the hypothesis of a direct role in the MIIC. TMEM176A/B-mediated cation (Na+) efflux could participate in the regulated acidification of this compartment as a counterion conductance54. TMEM176A/B could be located on the limiting membrane of the MIIC or on intraluminal vesicles (ILVs) where a direct interaction with HLA-DM would be possible. In this regard, independently of their ion channel function, it is conceivable that these four-span transmembrane proteins act similarly to tetraspanin molecules to stabilize DM-MHC II interaction55. On the same note, given the reported genetic association between TMEM176A and HDL cholesterol levels in human56, TMEM176A/B function may be connected to cholesterol-containing microdomains for efficient MHC II trafficking57. High resolution imaging, FRET analysis or the characterization of organelle-specific disruption in DKO DCs could be informative to uncover the precise role of TMEM176A/B in the MHC II pathway.
In conclusion, while the intrinsic role of TMEM176A/B in RORγt+ cells remains to be further explored, we found that these cation channels play a substantial role in the MHC II pathway to ensure optimal naive CD4+ T cell priming by DCs.

mRNA expression in different panels of purified immune cells from (A) Immuno-Navigator microarray data (https://genomics.virus.kyoto-u.ac.jp/immuno-navigator/) and (B) Immgen RNA-seq data (http://www.immgen.org/). The populations exhibiting the highest relative expression are highlighted in red. HSC : hematopoietic stem cells, MPP : multipotent progenitors, CLP : common lymphoid progenitors, CMP : common myeloid progenitors, GMP : granulocyte-macrophage progenitors, CDP : common dendritic progenitors, MEP : megakaryocyte-erythroid progenitors, DP : Thymic double positive cells, CD4 : CD4+ T cells, Th1 : T helper 1, Th2 : T helper 2, CD8 : CD8+ T cells, Tmem : memory T cells, NKT : natural killer T cells, Mature NK : mature natural killer cells, cDC : conventional dendritic cells, pDC : plasmacytoid dendritic cells, Mast : Mastocytes.

(A-B) Gating strategy for the analysis (shown in Figure 2A) of T (A) and ILC (B) subsets in the small intestine (siLP), colon (cLP) lamina propria and spleen by flow cytometry. Shown are examples of WT siLP analysis. iCD3 indicates that the anti-CD3ε staining was performed intracellularly along with the transcription factor stainings. DP : double positive cells, NCR : natural-cytotoxicity-receptor cells, LTi : lymphoid-tissue-inducer cells. (C) RT-qPCR analysis of Tmem176a, Tmem176b, RORγt-related genes and IL-22/IL-17 target genes in the ileum and colon of Tmem176a/b DKO mice. Pieces of ileum and colon were collected from WT and Tmem176a/b DKO mice and total RNA was extracted for RT-qPCR relative expression analysis of the indicated genes. Bars indicate means and dots represent individual mice.


For each indicated tumor cell line, tumor growth in WT and Tmem176a/b DKO mice is shown in individual mice and as mean (±SEM) in addition to survival rate (as shown in Figure 4B).
Expression of MHC I, MHC II, CD80 and CD86 molecules at the surface of BMDCs generated from WT and Tmem176a/b DKO littermate mice. Cells were analyzed by flow cytometry after a culture (6 h) with or without 0.5 μg/mL LPS. Data shown are means (±SD) of triplicates representative of three independent experiments.
Video S1. Real-time imaging of the synchronized trafficking of TMEM176B using the RUSH system (corresponds to Figure 7C). After 20 h of expression, at time 00:00, release of the reporter TMEM176B-SBP-EGFP was induced by addition of biotin and monitored using a spinning disk confocal microscope.
Video S2. Dual color, real-time imaging of the synchronized trafficking of TMEM176B and TMEM176A using the RUSH system (corresponds to Figure 7D). After 20 h of expression, at time 00:00, release of the reporters TMEM176B-SBP-mCherry (red) and TMEM176A-SBP-EGFP (green) was induced by addition of biotin and monitored using a confocal microscope.
Video S3. Dual color, real-time imaging of the synchronized trafficking of TMEM176B and TMEM176A using the RUSH system (corresponds to Figure 7E). After 20 h of expression, at time 00:00, release of the reporters TMEM176B-SBP-mCherry (red) and Golgin-84-SBP-EGFP (green) was induced by addition of biotin and monitored using a confocal microscope.
Table S1. Antibodies used in this study.
Table S2. Oligonucleotides used in this study.
Table S3. Plasmids used in this study.
Methods
Mice
Tmem176a/b double KO (DKO) mice were generated by a dual targeting approach using the CRISPR–Cas9 system as previously described20. DKO mice used in this study were generated in the C57BL/6N genetic background. Three consecutive backcrosses with C57BL/6N mice were performed before intercrossing heterozygous mice. To control for cage-dependent microbiota variations, WT and DKO mice were systematically co-housed directly after weaning following sex- and age-matching.
Conditional DKO mouse carrying a « floxed » Tmem176a/b allele (Tmem176a/bfl) were generated at Mouse Clinical Institute (Illkirch, France). Briefly, two consecutive rounds of ES cell (C57BL/6N genetic background) modifications using two independent selection cassettes were realized to insert LoxP sites on both sides of Tmem176a and Tmem176b first coding exons. F0 mouse chimera were crossed to a FlpO deleter mouse58 (pure C57BL/6N background) to remove the FRT- and F3-flanked Neomycin and Hygromycin selection cassettes abutted to the two LoxP sites. Allele transmission was verified on F1 mice before rederivation and housing in a SPF mouse facility. Tmem176a/bfl/wt heterozygous mice were crossed to BAC transgenic Rorc(γt)-Cre mice (generated by Gérard Eberl59 and provided by Bernhard Ryffel) or CD11c-Cre mice (Itgax-Cre, generated by Boris Reizis60 and provided by Véronique Godot). Following intercrossing, co-housed, sex- and age-matched Tmem176a/bfl/fl homozygous littermates carrying or not a transgenic Cre allele were used for experiments.
OT-I.Ly5.1 homozygous mice were obtained by intercrossing OVA-specific TCR-transgenic OT-I mice (C57BL/6-Tg(TcraTcrb)1100Mjb/Crl) (Charles River) with Ly5.1 mice (B6.SJL-PtprcaPepcb/BoyCrl) (Charles River).
OT-II.Ly5.1.Foxp3EGFP homozygous mice were obtained by intercrossing OVA-specific TCR-transgenic OT-II mice (C57BL/6-Tg(TcraTcrb)425Cbn/Crl) (Charles River) with Ly5.1 mice (B6.SJL-PtprcaPepcb/BoyCrl) (Charles River) and Foxp3EGFP reporter mice (generated by Bernard Malissen61).
All mice used for experiments were between 8 and 25 weeks of age and kept under specific pathogen-free conditions. Experimental procedures were carried out in strict accordance with the protocols approved by the Commitee on the Ethics of Animal Experiments of Pays de la Loire and authorized by the French Government’s Ministry of Higher Education and Research.
Chemically-induced acute colitis
Mice were given 2% dextran sulfate sodium (DSS) (36,000–50,000 MW, MP Biomedical) in drinking water ad libitum for 7 days followed by a recovery period without DSS. Mice were monitored and weighed daily.
Citrobacter rodentium infection
Citrobacter rodentium (DBS100, ATCC 51459) were culture aerobically at 37°C overnight at 200 rpm in Luria-Bertani (LB) broth medium (MP Biomedicals) and then diluted 1:10 in fresh LB medium until the concentration of bacteria reached optical density 600. Mice were pre-treated with 750 mg/L metronidazole (Sigma) in 2.5% sucrose drinking water for 4 days as previously described62, followed by 3 days with regular drinking water. Mice were then fasted 8 h before the infection by oral gavage with 2×10⁹ colony-forming units (CFUs) of C. rodentium resuspended in sterile 0.9% NaCl. Bacterial concentration was assessed via serial dilution on LB agar plates to confirm the CFUs administered. Mice were monitored and weighed daily. Faeces were collected at days 0 and 6 post-infection for detection of C. rodentium by qPCR.
Skin transplantation
Mice were anesthetized with a mixture of 5% xylazine (Rompun) and 18% ketamine in PBS (170 μL) injected intraperitoneally (8.5 mg/kg of xylazine and 76.5 mg/kg of ketamine per mouse). Square skin grafts (1 cm2) were prepared from the tail of male donors and transplanted on the shaved left flank of female recipients. The grafts were fixed to the graft bed with 10-12 interrupted sutures and were covered with protective tape. Mice were monitored every other day and graft rejection was defined as complete sloughing or a dry scab.
Tumor growth models
EG7, MCA101-sOVA63 (provided by Clotilde Théry) and B16-OVA tumor cells were recovered from log phase in vitro growth and 1×10⁶ cells were injected subcutaneously in 50 μL of cold PBS into the flank skin of recipient mice. Tumor growth was measured in a blind fashion with a caliper and expressed as the area based on two perpendicular diameters. Mice were monitored daily and were euthanized when tumor size reached 289 mm2.
Experimental Autoimmune-Encephalomyelitis (EAE)
For EAE induced with MOG peptide, mice were immunized subcutaneously at the base of the tail and lower flanks with 200 μg of MOG35–55 peptide (MEVGWYRSPFSRVVHLYRNGK, GenScript) emulsified in complete Freund’s adjuvant (Sigma) supplemented with Mycobacterium tuberculosis H37Ra (Difco Laboratories) at 8 mg/mL (400 μg/mL per mouse). Pertussis toxin (200 ng, Calbiochem) was injected intraperitoneally on the day of immunization and 2 days later.
For EAE induced with MOG protein64, mice were immunized subcutaneously at the base of the tail and lower flanks with 500 μg of mMOGTag protein (mouse MOG1–125 extracellular domain fused to a tag for stability and purification purposes) provided by Steven Kerfoot and emulsified in complete Freund’s adjuvant. Pertussis toxin (250 ng) was injected intraperitoneally on the day of immunization and 2 days later.
Mice were scored daily for EAE clinical signs on a scale of 0–5 : 0, no disease; 1, complete limp tail; 2, limp tail with unilateral hindlimb paralysis; 3, bilateral hindlimb paralysis; 4, bilateral hindlimb paralysis and forelimb weakness (end point). The observer was blinded to the genotype during the scoring.
Delayed-type hypersensitivity (DTH) assay
Mice were immunized subcutaneously at the base of the tail and lower flanks with 50 μg of whole OVA protein (grade V, Sigma) or OVA323–339 (ISQAVHAAHAEINEAGR) peptide (GenScript) emulsified in complete Freund’s adjuvant (Sigma). After 7 days, mice were challenged with 250 μg of heat-aggregated OVA (2 min incubation at 100°C) injected (20 μL, s.c.) in the right hind footpad whereas the left hind footpad received 250 μg of heat-aggregated BSA (Sigma) as a control for non-specific inflammation. Footpad thickness was measured prior to, 24 h and 48 h after injection with an electronic digital micrometer. The observer was blinded to the genotype during the scoring.
Flow cytometry analysis and cell sorting
Antibodies and panels used in this study for FACS analysis and cell sorting are listed in Supplementary Table 1. Red blood cells were lysed with ammonium chloride. Small intestine and colon lamina propria (siLP an cLP) cells were prepared as previously described6. Before all stainings, dead cells were marked for exclusion using Fixable Viability Dye eFluor 506 (eBioscience) or DAPI (Thermo Fisher Scientific) followed by Fc receptor blocking using CD16/32 antibody (BD Biosciences). Intracellular stainings were realized using eBioscience Foxp3 / Transcription Factor Staining Buffer Set. FACS analyses were performed using BD FACS Canto II or a BD LSRFORTESSA X-20 (BD Biosciences) and FlowJo (Treestar) software. For mean fluorescence intensity (MFI) analysis, values were ajusted by substracting the basal signal from fluorescence minus one (FMO) staining for each marker. Absolute cell numbers were determined using CytoCount microspheres (Dako, Agilent). Total and surface expression analysis of MHC II, Ii (invariant chain, CD74), H2-M and H2-O in spleen cDC1 and cDC2 were performed with or without a fixation/permeabilization step, respectively, and by gating on B cells (B220+CD11c−), cDC1 (B220−CD11c+CD11b−CD8α+) or cDC2 (B220− CD11c+CD11b+CD8α−). H2-M (αβ2 dimer) staining was revealed using a FITC-conjugated anti-rat IgG1 antibody. Alexa Fluor 647-conjugated anti-H2-Oβ was provided by Liza Denzin65.
Cells were FACS-sorted using BD FACSAria II (BD Biosciences). Intestinal CD3+CD5+CD4+ T cells and CD3−CD5−CD127+ ILCs (first gated on CD45+/lowCD11b/c−CD19−CD90+ cells) were FACS-sorted from the lamina propria of the small intestine and colon (pooled). For spleen cDCs used in epigenetic analysis and in vitro culture, CD11c+ cells were first stained with a PE-conjugated anti CD11c antibody and enriched using magnetic-activated cell sorting (Anti-PE MicroBeads, Miltenyi Biotec) before FACS-sorting of CD11chighMHC II+ cells at high purity (>98%). For RT-qPCR analysis, B cells (CD19+B220+CD11c−), pDCs (CD19−B220+CD11c+) cDC1 (CD19−B220−CD11chighCD11b−CD8α+) and cDC2 (CD19−B220−CD11chighCD11b+CD8α−) were FACS-sorted from the spleen of WT mice. OVA-specific CD8+ T cells were purified from the spleen of OT-I.Ly5.1 mice using CD8a+ T Cell Isolation Kit II (Miltenyi Biotec). OVA-specific CD4+EGFP− cells T conventional cells were FACS-sorted from the spleen of OT-II.Ly5.1.Foxp3EGFP mice after enrichment using CD4+ T Cell Isolation Kit (Miltenyi Biotec).
In vivo antigen-specific T-cell proliferation assay
OVA-specific naive CD8+ T and CD4+ T conventional cells from OT-I.Ly5.1 and OT-II.Ly5.1.Foxp3EGFP mice, respectively, were labeled with Cell Proliferation Dye (CPD) eFluor 670 (eBioscience) and co-injected (i.v.) at a 1:1 ratio (total of 1−2×10⁶ cells per mouse). One day later, recipient mice were administered (i.p.) 100 μg EndoFit Ovalbumin protein (InvivoGen). After three days, spleens were harvested and proliferation (CPD dilution) of injected cells (CD45.1+CD8+ or CD45.1+CD4+) was assessed by flow cytometry.
BMDC generation and in vitro antigen-specific T-cell proliferation assay
Bone marrow cells were cultured (0.5×10⁶ cells per mL) in the presence of 20 ng/mL GM-CSF (Miltenyi Biotec) in complete RPMI medium. By day 8, the cells, referred to as BMDCs, were harvested and incubated in 96-well plate (1×10⁴ cells per well) with 250 μg/mL EndoFit Ovalbumin protein (InvivoGen) or 10 μg/mL OVA323–339 (ISQAVHAAHAEINEAGR) peptide (GenScript). After 5 h, the cells were washed three times and CPD-labeled CD4+ Foxp3− T cells purified from OT-II.Ly5.1.Foxp3EGFP mice were added and proliferation (CPD dilution) was assessed by flow cytometry 3 days later.
In vitro stimulation and analysis of cDCs and BMDCs
Purified spleen cDCs were plated in 96-well plate at 1×10⁵ cells and incubated with or without 0.5 μg/mL LPS (Sigma) for 16 h before the quantification of IL-12p40 and IL-6 in the supernatant by ELISA (BD Biosciences). For phenotypic analysis (MHC II, MHC I, CD80, CD86) by flow cytometry, bulk spleen cells (comprising cDC1 and cDC2 identified using the markers CD11c, CD11b and CD8α as indicated) or BMDCs were stained freshly of stimulated for 6 h with 0.5 μg/mL LPS.
In vitro stimulation of CD4+ T cells and ILCs
Purified intestinal CD4+ T cells and ILCs were cultured in vitro in 96-well plate (10,000 cells per well in triplicates) in complete medium (Gibco, Thermo Fisher Scientific) for 18 hours in the presence of anti-CD3/CD28 Dynabeads (Thermo Fisher Scientific) at a ratio of 2:1 or IL-23 ± IL-7, IL-2, IL-1β (R&D Systems) at 50 ng/mL (except IL-2 at 50 IU/mL), respectively. IL-17A, IL-17F, IL-22 (R&D Systems) and IFNγ (BD Biosciences) were then measured in the supernatant by ELISA.
In vitro antigen uptake and degradation assays
Antigen endocytosis and degradation in cDCs (CD11c+MHCII+) were assessed by flow cytometry after incubating one million bulk splenocytes in 96-well plate with 50 μg/mL OVA-FITC or DQ-OVA (Invitrogen, Thermofisher Scientific), respectively. As controls, cells were incubated at 4°C or treated with Bafilomycin A (Sigma).
ChIP-seq experiments
Highly purified spleen cDCs (1×10⁶ cells from two pooled mice for each preparation) were resuspended in 40 μL of PBS. Cells were lysed and chromatin was fragmented with 300 units of Micrococcal nuclease (MNase) (M0247S, New England Biolabs) per well for 10 min at 37°C. After full speed centrifugation, supernatants were collected and filled up to 400 μL. Two μg of anti-H3K27ac (39133, Active Motif) was used for immunoprecipitation overnight at 4°C. Twenty five μL of G-protein dynabeads (Invitrogen) were added for rotation for 4 h at 4°C. Beads were then washed twice with 200 μL wash buffers with increasing salt concentration. ChIP beads were eluted in 50 μL of ChIP elution buffer (50 mM Tris-HCl pH 7.5, 10 mM EDTA, 1% SDS). ChIP and input samples were digested with 250 μg/mL proteinase K (GEXPRK006R, Eurobio) in 50 μL TE buffer for 1 h at 63°C. ChIP DNA was purified using phenol chlorophorm. Libraries were then prepared according as previously described66. Libraries were verified and equimolar pools were sequenced on a NextSeq 500 (75 bp single-end).
ChIP-seq analysis
Single-end reads were mapped to the mm10 genome by the BWA algorithm and reads mapping to non-canonical and mitochondrial chromosomes were also removed. For each sample, ChIP-seq peaks were detected using DFilter at a P-value threshold of 1×10⁻⁶. All samples passed the quality controls (Fraction of reads in peaks [FRiP] > 3% and non-redundancy fraction [NRF] > 0.9). A set of consensus peaks was then obtained by taking the union of all peaks and counting reads these peaks using Bedtools. To perform Differential Peak Calling, differentially acetylated (DA) peaks were determined using edgeR after a counts per million (cpm) normalization. DA peaks were defined with a Benjamini-Hochberg Q-value ≤5%. For heatmap representation, peaks were rlog transformed. To determine gene ontology enrichment in up-regulated peaks the GREAT tool was used.
Quantitative PCR
Quantitative PCR (qPCR) was performed using ViiA 7 Real-Time PCR System and Fast SYBR Green Master Mix reagent (Applied Biosystems, Thermo Fisher Scientific). Primer sequences are listed in Supplementary Table 2).
For Citrobacter rodentium bacterial load quantification, genomic DNA (gDNA) from faeces was purified using QIAamp DNA Stool Mini Kit (Qiagen) and the EspB gene was detected using specific primers and normalized with total bacterial gDNA (16S gene) using the 2−ΔΔCt method.
For mRNA quantification, total RNA was isolated using RNeasy Mini Kit or Micro Kit (Qiagen). Reverse transcription was performed using M-MLV Reverse Transcriptase and random primers following manufacturer’s instructions (Thermo Fisher Scientific). Gene-specific primers were designed over different exons to prevent amplification of genomic DNA. Gene expression was normalized to glyceraldehyde 3-phosphate dehydrogenase (Gapdh) and expressed in arbitrary units using the 2−ΔΔCt method.
RUSH system
RUSH experiments were realized as previously decribed by the Perez group33. Plasmid constructs are listed in Supplementary Table 3. When indicated, 250 nM MitoTracker Deep Red or 100 nM LysoTracker Deep Red (Thermo Fisher Scientific) were added 30 min before imaging. HeLa cells (1.5×10⁴) were seeded into a μ-Slide 8 Well Chamber Slide (Ibidi) and transfected using Lipofectamine LTX Plus Reagent (Thermo Fisher Scientific). After 24 h, the medium was replaced by medium containing 40 μM of D-biotin (Sigma). The initial time-lapse acquisition characterizing TMEM176B was performed at Institut Curie (Paris, France) with a a thermostat controlled chamber using an Eclipse 80i microscope (Nikon) equipped with a spinning disk confocal head (Perkin) and an Ultra897 iXon camera (Andor). Subsequent RUSH analyses were performed at MicroPICell facility (Nantes, France) with a Confocal Nikon A1 RS microscope. To analyze molecule colocalization, we used the plugin Colocalization Studio that contains pixel-based methods that were introduced in section Pixel-Based Methods in the Icy platform. HeLa-CIITA (generated by Philippe Benaroch35) were used for the analysis of HLA-DR and HLA-DM.
Statistical analysis
Statistical analyses were performed using Graphpad Prism (La Jolla, CA, USA) using the Mann-Whitney test or, for survival rates, using the Log-rank (Mantel-cox) test. P values < 0.05 were considered significant.
Author contributions
C.L., M.L. and M.C.C. designed and supervised the research. M.L., G.Bienvenu, L.G, S.S., E.M., S.R., A.Molle, C.F., G.Beriou P.K., S.A.R, V.D.S., G.Boncompain, J.P. and C.L. performed experiments and analyzed data. A.E., C.F., L.B-D and F.C., performed experiments. S.K., G.M. and F.P. contributed to key research tools and experiment design. A.Moreau., E.C., S.C., F.P., R.J. and J.P. helped with the study design and data interpretation. C.L., M.L., J.P., A.Molle and C.F. wrote the paper.
Declaration of interests
The authors declare no competing interests.
Acknowledgments
This work was supported by IHU-Cesti, Nantes Métropole and Région des Pays de la Loire, Paris Scientifiques Régionaux. This work was realized in the context of the Labex IGO program supported by the Agence Nationale de la Recherche (ANR-11-LABX-0016-01). M. Lancien was supported by a PhD fellowship from Fondation pour la Recherche Médicale (FRM grant number ECO20160736078). We are grateful to Philippe Hulin, Steven Nedellec and Magalie Feyeux from the MicroPICell imagery core facility (Nantes, France) for excellent assistance with confocal microscopy and to Claire Usal, Pierre Pajot and Jean-Marc Merieau for mouse housing and experimental help.
Work performed in the F. Perez laboratory was funded by Centre National de la Recherche Scientifique, the Fondation pour la Recherche Medicale (FRM DEQ20120323723), the Labex CellTisPhyBio, and the Agence Nationale de la Recherche (ANR-12-BSV2-0003-01). The laboratory of F. Perez is part of Labex CelTisPhyBio (11-LBX-0038) and Idex Paris Sciences et Lettres (ANR-10-IDEX-0001-02 PSL). The authors acknowledge the Cell and Tissue Imaging Facility (PICT-IBiSA), Institut Curie, a member of the French National Research Infrastructure, France-BioImaging (ANR10-INBS-04).
Footnotes
↵7 Lead Contact
References


