

Abstract
Sepkoski’s hypothesis of Three Great Evolutionary Faunas that dominated Phanerozoic oceans represents a foundational concept of macroevolutionary research. However, the hypothesis lacks spatial information and fails to recognize ecosystem changes in Mesozoic oceans. Using a multilayer network representation of fossil occurrences, we demonstrate that Phanerozoic oceans sequentially harbored four evolutionary faunas: Cambrian, Paleozoic, Mesozoic, and Cenozoic. These mega-assemblages all emerged at low latitudes and dispersed out of the tropics. The Paleozoic–Mesozoic transition was abrupt, coincident with the Permian mass extinction, whereas the Mesozoic–Cenozoic transition was protracted, concurrent with gradual ecological shifts posited by the Mesozoic Marine Revolution. These findings support the notion that long-term ecological changes, historical contingencies, and major geological events all have played crucial roles in shaping the evolutionary history of marine animals.
One Sentence Summary Network analysis reveals that Phanerozoic oceans harbored four evolutionary faunas with variable tempo and underlying causes.
The hypothesis of the Three Great Evolutionary Faunas postulated that the major groups of marine animals archived in the Phanerozoic fossil record were distributed non-randomly through time and could be grouped into Cambrian, Paleozoic and Modern mega-assemblages (1). Jack Sepkoski formulated this hypothesis based on a factor analysis of family-level diversity within taxonomic classes (2). This hypothesis became a foundational concept of macroevolutionary research, used as a framework-setting assumption of studies on large-scale trends in diversity (3, 4), extinction (5–7), and evolution of marine animals (8–10). However, the three-phase model fails to account for ecosystem changes in Mesozoic oceans, which point to a later emergence of the modern marine faunas than was predicted by the model (11–13). Moreover, the geographic origin, timing, and causative drivers of the major biotic transitions between successive evolutionary faunas are still debated (14–16). This lack of clarity raises a fundamental question: How does Phanerozoic marine diversity structure into these discrete, global-scale mega-faunal assemblages that persist over extended intervals of geological time? Using a multilayer network framework, we unveiled the dynamic spatiotemporal organization of marine life during Phanerozoic times.
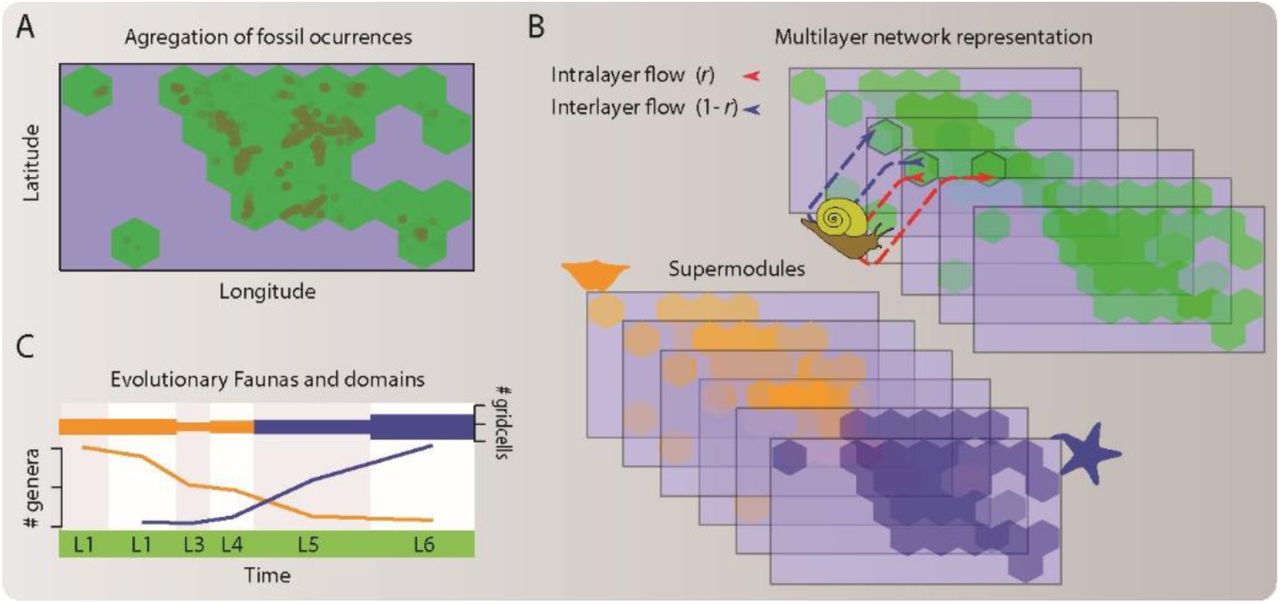
In the network analysis employed here (Fig. S1), we aggregated accepted genus-level occurrences of the dominant fossil groups of marine invertebrates (trilobites, decapods, brachiopods, bryozoans, corals, echinoderms, and mollusks) (17) from the Paleobiology Database (18) into spatially and temporally explicit grid cells. We used the aggregated data to generate a multilayer network where each layer represents a geological stage in the geological timescale (19) and consists of grid cells and taxa that occur in each stage. The taxa connect both to stage-specific grid cells through intra-layer links with weights adjusted for sampling effort (20) and to grid cells in adjacent stages through inter-layer links (21). The assembled network comprises 4,906 spatiotemporal grid cells and 18,297 genera, distributed into 99 stages (Data S1). This multilayer network representation simultaneously captures geographical and temporal relationships between taxa, which enables integrative spatiotemporal analysis of the Metazoan macroevolution.

(A) Data aggregation. We aggregated global-scale fossil occurrences into hexagonal spatial grid cells. (B) Network representation and clustering. We constructed a multilayer network representation (21) of the aggregated data by joining taxa to grid cells in each stage (L1 to L6) through links adjusted for sampling effort and layers representing ordered geological stages. We used the hierarchical network clustering algorithm called Infomap (22) to delineate groups of highly interconnected taxa and grid cells across layers with multilayer modules. (C) Mapping evolutionary faunas and domains. We mapped faunas and temporal domains using the chronostratigraphic distribution of the module grid cells and per-layer taxa richness.
Using the multilevel network clustering algorithm Infomap (21–23), we found that the assembled network is best described by four significant supermodules of highly interconnected taxa and grid cells (Data S2). These supermodules capture fundamental structure and dynamics of the Phanerozoic benthic marine faunas in two ways (Fig. 1). First, the supermodule grid cells divided the Phanerozoic rock record into four successive intervals: The Phanerozoic domains. Second, the supermodule taxa define four partially overlapped sets of marine animals that characterize each Phanerozoic domain and sequentially shift dominance patterns over time: The four evolutionary faunas. These faunas represent marine mega-assemblages that vary in the composition and proportional representation of major animal groups, which we define as those taxa that represent ≥ 5 % of the supermodule genera (Fig. S2). Although our analysis identified four mega-assemblages, in contrast to three assemblages discriminated in the classic analyses (1), the classes of marine invertebrates that contribute the most to our Cambrian, Paleozoic, and combined Mesozoic―Cenozoic mega-assemblages match those from the hypothesis of the Three Great Evolutionary Faunas, suggesting that these macroevolutionary units are unlikely to represent an artifact of the factor (12) or network analyses.

Clustered taxa define four partially overlapping sets of benthic marine animals. (A) Cambrian evolutionary fauna. (B) Paleozoic evolutionary fauna. (C) Mesozoic evolutionary fauna. (D) Cenozoic evolutionary fauna. The classes of marine invertebrates that contribute the most to the Cambrian, Paleozoic, and combined Paleozoic-Mesozoic mega-assemblages delimited here match those from the Three Great Evolutionary Faunas [if you decide not to capitalize and italicize this phrase in the manuscript, make that change here also](1). The Cambrian mega-assemblage comprises trilobites (88%) and lingulates (5%); the Paleozoic domain comprises rhynchonellids (19%), trilobites (16%), anthozoans (13%), strophomenids (13%), gastropods (11%), crinoids (8%), bivalves (7%), and stenolaemate bryozoans (6%); the Mesozoic domain comprises bivalves (25%), gastropods (22%), rhynchonellids (20%), and anthozoans (13%); and the Cenozoic domain comprises gastropods (43%), bivalves (25%), decapods (8%), and anthozoans (8%).

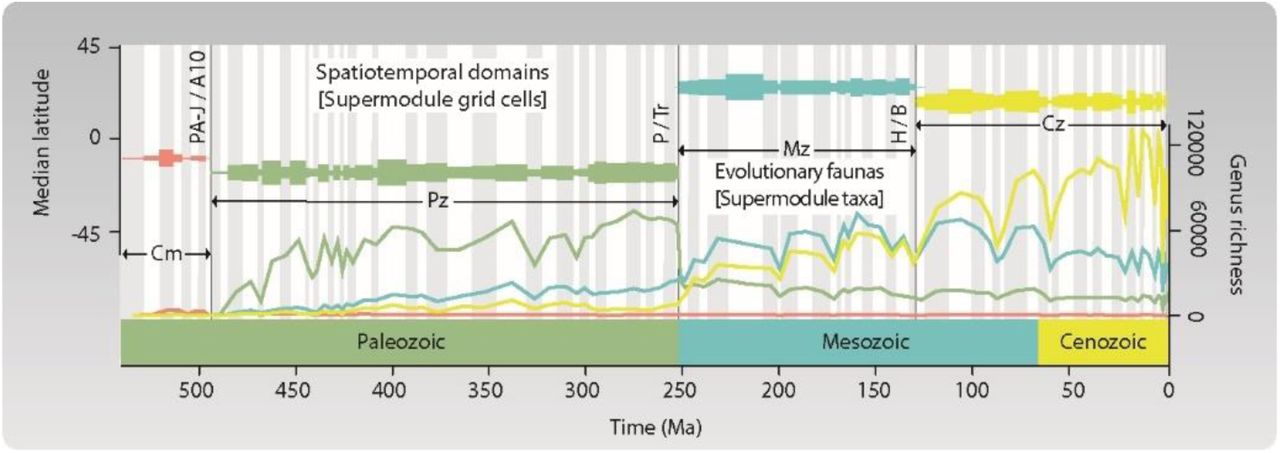
The four evolutionary faunas and domains delineated by multilayer network analysis. Lines represent the genus richness of each evolutionary fauna. Mega-assemblages shift dominance patterns over time, but transitions are either abrupt (Paleozoic―Mesozoic faunal shift) or protracted (Mesozoic―Cenozoic faunal shift). Horizontal bars represent the Phanerozoic domains, with the bar width indicating the number of grid cells. The domains are temporally coherent units describing the successive dominance of the four evolutionary faunas. Abbreviations: Cambrian (Cm); Paleozoic (Pz); Mesozoic (Mz); and Cenozoic (Cz). Domain boundaries: combined Paibian-Jiangshanian―Age10 (PA-J/A10); Permian―Triassic (P/Tr); and Hauterivian―Barremian (H/B). Supermodule robustness: Cambrian, P0.7 = 1.00; Paleozoic, P0.7 = 0.99; Mesozoic, P0.7 = 0.25 and P0.5 = 1.00; and Cenozoic, P0.7 = 1.00.
The Phanerozoic domains are slightly different from standard geological eras (Adjusted Mutual Information, AMI = 0.71). They show that Phanerozoic oceans sequentially harbored the four evolutionary faunas, as follows (Fig. 1): Cambrian (Fortunian to Paibian, 541-494 Ma), Paleozoic (Jiangshanian to Changhsingian, 494-252 Ma), Mesozoic (Induan to Hauterivian, 252-129 Ma), and Cenozoic (Barremian to Holocene, 129-0 Ma). However, the three mega-assemblage shifts that define four evolutionary faunas vary in timing and causative drivers. The Cambrian―Paleozoic faunal shift appears to be an abrupt transition at the base of the uppermost Cambrian stage (Fig. 2A-C), although the limited number of fossil occurrences from that interval prevents a better understanding of the faunal transition (Supplementary Materials and Methods). The Paleozoic―Mesozoic faunal shift is also abrupt (Fig. 2C-D); the two consecutive domains overlap in one geological stage that lasted ∼2.5 Ma, and the mega-assemblages share a few taxa (Jaccard similarity index = 0.03). This faunal transition coincided with the Earth’s largest mass extinction event (6, 24), which is viewed as the cause of the global shift in ocean life at that time (2, 25). In contrast, the Mesozoic―Cenozoic faunal transition is protracted, with a gradual shift in dominance among mega-assemblages, which share more taxa (Jaccard similarity index = 0.11) (Fig. 1), and substantially overlap in geographic space (Fig. 2D-E). In addition, the two consecutive domains overlap in two geological stages that lasted ∼8.0 Ma.

(A) Latitudinal extent of the Phanerozoic domains. Lines represent the maximum latitude of the grid cells delimiting each domain. The domains emerge at low latitudes and experience rapid extratropical spread. (B-E). Genus richness maps of the four evolutionary faunas. Mega-assemblage shifts are either abrupt global perturbations (Cambrian―Paleozoic and Paleozoic―Mesozoic faunal shifts) or protracted changes with substantial temporal and spatial overlap (Mesozoic―Cenozoic faunal shift). (F) Maps across the Mesozoic―Cenozoic domain transition.
The protracted Mesozoic―Cenozoic biotic transition is reminiscent of the gradual Mesozoic restructuring of the global marine ecosystems, which included changes in food-web structure, functional ecology of dominant taxa, and increased predation pressure (11, 13). These changes in marine ecosystems started early in the Mesozoic era and continued throughout the Cenozoic era (26, 27). However, changes in Mesozoic oceans were particularly notable in the mid-Cretaceous (28, 29). Our results suggest that such changes in the global marine ecosystems may have been responsible for the gradual emergence of the modern evolutionary fauna. However, regardless of the transition mechanism, the gradual emergence of the Cenozoic evolutionary fauna indicates that modern benthic biota first emerged during the early Mesozoic already, but did not became dominant until the mid-Cretaceous (∼130 Ma) (Fig. 2A). In this way, the quadripartite structuring of the Phanerozoic marine fossil record revealed by multilayer network analysis resolves the conflict between the Three Great Evolutionary Faunas and the Mesozoic Marine Revolution hypothesis (15), which postulates the gradual diversification of Sepkoski’s modern evolutionary fauna during the late Cretaceous and Cenozoic (11).
The multilayer network framework provides a platform for studying the geographic distribution of the evolutionary faunas over time. The spatial distribution of the taxa shows that Mesozoic (Fig. 2D) and Cenozoic (Fig. 2E) evolutionary faunas were concentrated preferentially in lower latitudes before they became globally dominant by establishing their respective domain. Taxa from both Paleozoic (Fig. 2C) and Mesozoic (Fig. 2D) evolutionary faunas preferentially persisted in low-latitude areas after a new fauna became globally dominant. Furthermore, the latitudinal extent of the Phanerozoic domains shows that evolutionary faunas became dominant first at low (< 12°, Cambrian, Paleozoic, and Mesozoic) and low-to-mid latitudes (< 40°, Cenozoic) and then experienced extratropical spread (Fig. 2A). Overall, these findings are consistent with the Out of the Tropics hypothesis, which postulates tropical origin, poleward dispersal, and low-latitude persistence of the marine taxa (30).
The nested hierarchical structure of the multilayer network of Phanerozoic benthic marine faunas suggests that biogeographic structure underlies evolutionary faunas. The supermodules identified in the assembled network consist of lower-level modules that capture internal structure of the faunas. Overall, modules from the second hierarchical level delineate shorter temporal units consistent with periods in the geological timescale (AMI = 0.83) (Fig. S3A). Moreover, some lower-level modules form geographically coherent units that change over time (Fig. S4) (17, 20). We were unable to map such bioregions through the entire Phanerozoic, which may reflect resolving limitations of existing data. Nevertheless, the presence of bioregions suggests that evolutionary faunas scale up from localized geographic areas (Fig. 3; Fig. S4). Testing this hypothesis – mapping the complete Phanerozoic marine bioregions in a consistent fashion that links them explicitly to evolutionary faunas – will require improved paleontological data with finer chronostratigraphic constraints and improved spatial coverage.

Lower-level modules capture internal structure of the four evolutionary faunas. (A) Second hierarchical level (Level 2). Lines represent the genus richness of the faunas associated with Cretaceous and Neogene modules. Horizontal bars represent the number of module grid cells in each time interval. The Cenozoic fauna consists of Cretaceous (Cr2 and Cr3), Paleogene (Pg), Neogene (Ng), and Quaternary (Q) modules (all P0.7 ≥ 0.99). The Mesozoic fauna consists of Triassic (Tr), Jurassic (J1, J2) and Cretaceous (Cr1) modules (all P0.7 ≥ 0.98). The Paleozoic fauna consists of Ordovician, Silurian, Devonian, Carboniferous, and Permian modules (all P0.7 ≥ 0.94). The Cambrian consists of various small modules (five modules all P0.7 ≥ 0.58; 4 modules all P0.7 ≤ 0.41). (B) Third hierarchical level (Level-3) (Table S2). Some of these lower-level modules form geographically coherent units underlying the evolutionary faunas.

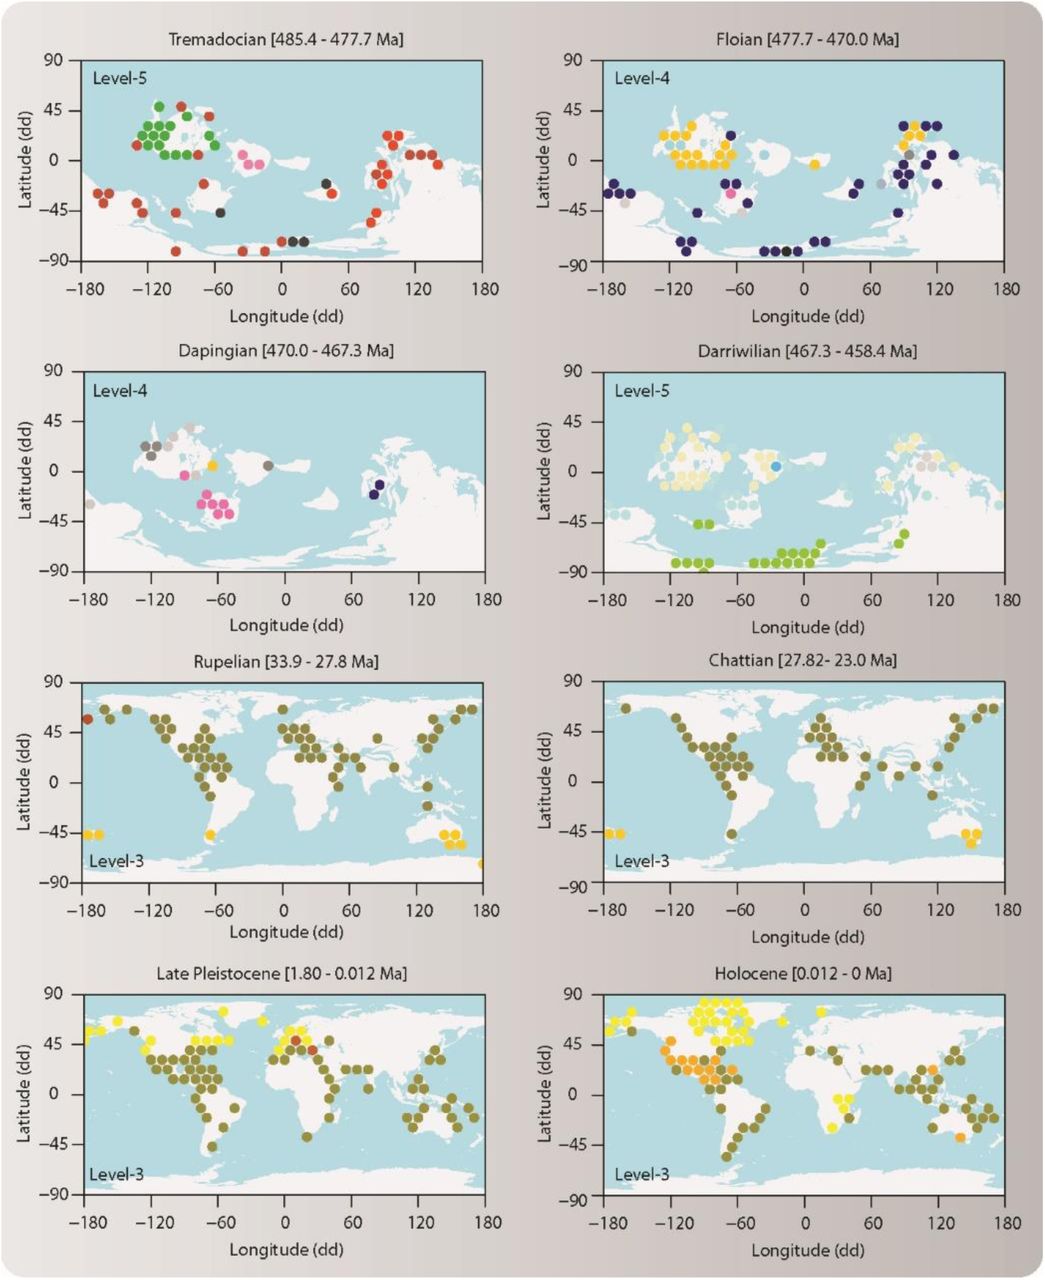
Geographic maps of lower-level modules. Circles represent grid cells colored by their module affiliation (Data S2). Lower-level modules form geographically coherent bioregions (17, 20) underlying the evolutionary faunas in the modular organization of the Phanerozoic marine life.

Network clustering results are highly robust to variations in the relax rate (r). The plot illustrates the similarity of the reference solution (r = 0.25) with[similarity to?] solutions obtained from different relax rates. Results are particularly robust in the domain r ≥ 0.20. Following previous studies on complex networks, we used a relax rate r = 0.25 for the reference solution, which is large enough to enable interlayer interdependencies but small enough to preserve intralayer information (38).

The average probability (median) of belonging to a supermodule for nodes of the same layer was calculated according to (39). It shows the instability of the modular structure in the assembled network after the Earth’s largest mass extinction event (6, 24). This stage-level pattern explains the overall significance (P0.7 = 0.25) of the Mesozoic Evolutionary Fauna (Fig. 1, Table S1). Abbreviations: Cambrian (Cm); Paleozoic (Pz); Mesozoic (Mz); and Cenozoic (Cz). Boundaries: combined Paibian-Jiangshanian―Age10 (PA-J/A10); Permian―Triassic (P/Tr); and Hauterivian―Barremian (H/B).

(A) Supermodule. (B) Second hierarchical level. Modules are consistent with geological periods (all modules P0.7 ≥ 0.94). (C) Third hierarchical level (all modules P0.7 ≥ 0.95). (D) Bioregions around the Carboniferous/Permian boundary (all modules P0.7 ≥ 0.97). Lower-level modules delineate geographically coherent units (20) that change throughout time (17). The nested hierarchical structure of the assembled network suggest that geographic structure underlies the evolutionary faunas.
Our analysis of the marine fossil record in a multilayer network framework demonstrates that Phanerozoic oceans sequentially harbored four marine evolutionary faunas, which emerged at low latitudes and then persisted as globally dominant mega-assemblages. The major transitions between successive evolutionary faunas varied in tempo and underlying causes, ranging from abrupt global perturbations to protracted ecological shifts. In addition, we show that biogeographic structure underlies the evolutionary faunas in the dynamic organization of the Phanerozoic marine diversity. Overall, these findings highlight the evolutionary importance of historical contingencies and support the notion that long-term ecological interactions, as well as global geological perturbations, have played a critical role in the shaping evolutionary history of marine animals (16).
Supplementary Materials
Materials and Methods
Data
Genus-level occurrences derive from the Paleobiology Database (PaleoDB; https://paleobiodb.org) (18), which at the time of access consisted of 79,976 fossil collections with 448,335 occurrences from 18,297 genera. Here we only included resolved fossil occurrences. The downloaded taxa comprise the well-preserved benthic marine invertebrates (17): Brachiopoda, Bivalvia, Gastropoda, Bryozoa, Echinodermata, Anthozoa, Decapoda, and Trilobita. The Paleobiology database assigned fossil collections to paleogeographic coordinates based on their present-day geographic coordinates and geologic age using rotation models provided by the GPlates (http://www.gplates.org). We plotted the geographic maps of the spatial grid cells with the corresponding plate tectonic configuration from GPlates (31). Using the Hexbin R-package (32), we aggregated fossil occurrences into a regular grid of hexagons covering the Earth’s surface per each stage in the geological timescale (4,906 grid cells with count > 0; inner diameter = 10° latitude-longitude) (Fig. S1A). This hexagonal binning procedure provides symmetry of neighbors that is lacking in rectangular grids and captures the irregular shape of geographic regions more naturally (33). The grid size is a compromise between the lack of spatial resolution provided by hexagons with inner diameter > 10° and an increased number of hexagons with none count when shortening the inner diameter. Nevertheless, study cases on modern marine faunas have demonstrated that network-based biogeographic analyses are robust to the shape (square and hexagonal), size (5° to 10° latitude-longitude), and coordinate system (geographic and projected) of the grid used to aggregate data (34, 35).
Network analysis
We used aggregated occurrence data to generate a multilayer bipartite network (21), where layers represent ordered geological stages in the geological timescale (19), and two types of nodes in each layer represent taxa and spatiotemporal grid cells (20) (Fig. S1). Whereas each taxon can be present in multiple layers, each grid cell is only present in a single layer. To capture interdependencies in the occurrence data in a statistically sound way, we linked taxa to spatiotemporal grid cells through links with weights (w) adjusted for sampling effort. Specifically, for the adjusted weight (wki) between grid cell k and taxa i, we divided the number of collections at grid cell k that register taxa i by the total number of collections recorded at grid cell k. A similar sampling correction has been employed on previous network-based biogeographic analysis using weighted projections from bipartite occurrence networks (17, 20). In addition, we combined the last two Cambrian stages, i.e., Jiangshanian Stage (494 to 489.5 Ma) and Stage 10 (489.5 to 485.4 Ma), into a single layer to account for the lack of data from the younger Stage 10 and to maintain an ordered sequence in the multilayer network framework (21). Even though such a gap was placed at the end of the Cambian Period, most grid cells and species from the combined Jiangshanian/Stage 10 (494-485.4 Ma) layer clustered into the Paleozoic supermodule (see below). The assembled multilayer network of the Phanerozoic benthic marine faunas comprises 23,203 nodes (n), including 4,906 spatiotemporal grid cells and 18,297 genera, joined by 144,754 links (m), distributed into 99 layers (t) (Data S1).
To identify important dynamical patterns in the spatiotemporal organization of the Phanerozoic benthic marine faunas as represented in the assembled multilayer network, we used a network clustering approach (Fig. S1B). The conventional approach to partition bipartite occurrence networks based on aggregated fossil occurrences applies standard community detection methods to the one-mode projection of the original network (20). Although such a procedure can provide some insights about the biogeographic structure of ancient marine faunas (17), it destroys relevant information regarding higher-order interdependences between taxa and geographic regions. Instead, here we used the map equation multilayer framework (www.mapequation.org), which can operate directly on the multilayer bipartite network and thereby preserve higher-order interdependencies. The map equation multilayer framework consists of an objective function that measures the quality of a given network partition, the map equation itself (23), and Infomap, an efficient search algorithm that optimizes this function over different solutions (21). We used this method because it can handle bipartite, weighted, and multilayer networks and because it is known for its high performance (36-38). In addition, Infomap directly provides the number of hierarchical levels within each layer and thus removes the subjectivity inherent in other approaches (38).
To capture interdependencies beyond nearest neighbors in the assembled network, the map equation models a random walk on the nodes within and also across layers (Fig. S1B): With probability (1 − r), a random walker moves between taxa and grid cells guided by the weighted intralayer links within its current geological stage, and with probability r, it moves between taxa and grid cells guided by the weighted links in its current geological stage and also in the adjacent geological stages. By relaxing the constraint to allow movement within layers in this way, the multilayer framework enables coupling between adjacent layers such that it accounts for the temporal ordering of geological stages. Consequently, the random walker tends to spend extended times in multilayer modules of strongly connected taxa and grid cells across geological stages. Infomap can identify these modules because using modules in which the random walker persists for relatively long periods optimizes the map equation, which measures how much a modular partition of the nodes can compress a description of the random walker on the network. Following previous network studies, we used the relax rate r = 0.25, which is large enough to enable interlayer interdependencies but small enough to preserve intralayer information (38). We tested the robustness to the selected relax rate by clustering the assembled network for a range of relax rates and comparing each solution to the solution for r = 0.25 using the Jaccard Similarity. Finally, we obtained the reference solution (Data S2) using the assembled network and the following Infomap arguments: -N 200 -i multilayer --multilayer-relax-rate 0.25 --multilayer-relax-limit 1. The relax limit is the number of adjacent layers in each direction to which a random walker can move. Thus, a value of 1 enables the temporal ordering of geological stages in the multilayer framework.
We employed a parametric bootstrap for estimating the significance of the multilayer modules delineated in the reference solution. This approach assumes that the assembled network accurately captures connections between benthic taxa and grid cells but that there can be uncertainty in the strength of those interdependencies from variations in sampling effort through time and across space. We resampled taxon occurrence using a truncated Poisson distribution with mean equal to the number of taxon occurrences. The truncated distribution has all probability mass between one and the total number of collections in the grid cell, thus avoiding false negatives. We obtained the resampled link weight by dividing the sampled number by the total number of recorded collections. Using Infomap with the arguments detailed above, we clustered these bootstrapped networks and then compared the resulting partitions with the reference solution. Specifically, for each reference module, we computed the proportion of bootstrapped partitions where we could find a module with Jaccard similarity higher than 0.5 (P05) and 0.7 (P07) (Tables S1-S2). In addition, we computed the average probability (median) of belonging to a supermodule for nodes of the same layer (Fig. S6). This procedure for estimating module significance is described in (39), which includes a case study on biogeographic networks of modern vertebrates.
Funding
A.R. and M.N. were supported by the Olle Engkvist Byggmästare Foundation. M.R. was supported by the Swedish Research Council, grant 2016-00796.
Author contributions
A.R. conceived the project. A.R., and M.R. designed the experiments. A.R. performed the network analysis. J.C., AR., and M.N. performed the robustness assessment. A.R., M.K., and M.R. wrote the manuscript with input from all authors. All authors discussed the results and commented on the manuscript.
Competing interests
Authors declare no competing interests.
Data and materials availability
All data is available in the main text or the supplementary materials.
Acknowledgments
We thank S. Finnegan and D. Edler for useful discussions, and R. Nawrot for helpful comments on the manuscript.
Footnotes
Here we merge the supplemental material into our manuscript PDF so that it is one file.


