


Abstract
Genetic studies of essential hypertension, a complex, polygenic, and age-dependent disorder, have not been able to completely elucidate the genes responsible for development of the trait. We used a novel strategy to compare gene expression in the adrenal gland of two independent rodent models of human essential hypertension (the spontaneously hypertensive rat, SHR, and the blood pressure high mouse, BPH), with the goal of uncovering shared, common genetic mechanisms of hypertension across mammalian species that might, therefore, be pertinent to human hypertension. We deliberately studied young, 4- to 5-week-old, “prehypertensive” SHR and BPH that had not yet developed complete elevations in blood pressure (BP), so that we could minimize the impact of chronic, sustained BP elevation, age, and other confounding factors on gene expression, therefore increasing the likelihood that differential expression reflects relatively early pathogenic mechanisms in hypertension, rather than later responses to, or compensations for BP elevation. We compared transcript expression patterns of genes orthologous between the rat and the mouse, and presented candidate genes for hypertension that are differentially expressed in the same direction in SHR and BPH (ie, overexpressed in both SHR and BPH, or underexpressed in both SHR and BPH). Then we used a systems biology approach to analyze expression patterns in biochemical pathways and networks to isolate systems involved in hypertension pathology in both SHR and BPH. We found transcript pattern evidence for involvement of several systems in the pathology of hypertension in SHR and BPH: adrenal catecholamines and sympathetic function; steroid hormone synthesis, catabolism, and its contribution to enhanced glucocorticoid sensitivity in SHR; oxidative stress and its role as a common mechanism of vascular and end-organ injury; and intermediary metabolism with global but mechanistically different perturbations in SHR and BPH. Approximately 10% of the differentially expressed orthologous genes we studied shared a common direction of expression in the two hypertensive rodent strains, suggesting fundamental transcriptional mechanisms in common whereby mammals can elevate BP or respond to such elevation; even these shared orthologs spanned a diverse set of biological processes, reinforcing the multifactorial and complex nature of hypertension. Am J Hypertens 2005;18:633–652 © 2005 American Journal of Hypertension, Ltd.
The complex, polygenic, and age-dependent nature of human essential hypertension has made it difficult to isolate the primary genetic causes of the disease. The exact mechanisms of hypertension are further confounded by environmental factors (eg, diet and exercise), which are estimated to contribute up to 70% to development of the disease trait,1 and the presence of dyslipidemia, dysglycemia, insulin resistance, and other facets of the “cardiovascular dysmetabolic syndrome”2 that often accompany essential hypertension.
Microarrays are a potentially powerful tool for studying the genetics of hypertension as they allow measurement of the expression of thousands of genes simultaneously. Inbred, homozygous rodent models of human essential hypertension are ideal for microarray research but only a limited amount of research using microarrays and animal models of essential hypertension has been presented thus far.3–9 We present a comparison of adrenal gland gene expression in two independent, inbred, homozygous rodent models of human essential hypertension: the spontaneously hypertensive rat (SHR) and the blood pressure high mouse (BPH).
The SHR, the current paradigm for essential hypertension research, was developed in a breeding program based solely on selection by elevated blood pressure (BP) in the Wistar rat.10 The Wistar/Kyoto (WKY) strain was established as a normotensive control strain for the SHR by inbreeding of the normotensive Wistar colony (from which the SHR originally emerged) by brother/sister mating.11 In addition to elevated BP, the SHR exhibits many of the co-morbidities observed in human hypertension, such as insulin resistance, hypertriglyceridemia, and abdominal obesity.12–15 The BPH inbred, hypertensive mouse strain, developed by Schlager16 in a selection program based solely on elevated BP, also parallels human hypertension with elevated BP and co-morbidities such increased heart rate and early mortality.17 During the breeding program used to develop the BPH strain, Schlager developed the hypotensive genetically/hereditary low BP mouse (BPL) strain to serve as a control for the BPH.16
Adrenal gland secretory products, both medullary and cortical, are logical candidates to study hypertension because they can directly influence cardiovascular, endocrine, and sympathetic function. The purpose of this study is to compare adrenal gene expression in two independent rodent models of the same human disease, with the goal of uncovering shared, common mechanisms of hypertension across mammalian species.
Methods
Rodent strains
Three juvenile (∼4-week-old) SHR and three juvenile (∼4-week-old) normotensive WKY male rats were obtained from colonies at the University of California, San Diego, in La Jolla, CA.18 Juvenile SHR are “prehypertensive” with a systolic BP (∼125 mm Hg at 6 weeks19) slightly higher than juvenile WKY (∼107 mm Hg at 6 weeks19) but still not completely elevated. Upon maturity, the SHR exhibits a systolic BP (∼200 mm Hg) approximately 70 mm Hg higher than that of WKY (∼130 mm Hg).
Three juvenile (∼5-week-old) BPH and three juvenile (∼5-week-old) BPL male mice were obtained from colonies at the Jackson Laboratory, Bar Harbor, ME. Juvenile BPH are prehypertensive with a systolic BP (∼120 mm Hg at 7 weeks17), already somewhat higher than juvenile BPL (∼78 mm Hg at 7 weeks17) but still not completely elevated. The divergence in systolic BP reaches its maximum at 21 weeks of age, when BPH shows a systolic BP (∼130 mm Hg)17 approximately 60 mm Hg higher than that of BPL (∼70 mm Hg).17
We chose juvenile animals (∼4 to 5 weeks old) because at that age, the SHR and BPH are prehypertensive—they do not yet have maximal elevation of BP. The SHR and BPH models appear to experience the same degree of hypertension: with maturity of the SHR and BPH, systolic BPs diverge to a maximum of 70 mm Hg between SHR and its WKY control, and to a maximum of 60 mm Hg between the BPH and its BPL control. Studying prehypertensive animals allowed us to minimize the effect of confounding factors on gene expression, and therefore increase the odds of detecting pathogenic mechanisms of hypertension, while decreasing the chance of detecting consequential effects of BP elevation. However, the ∼42 mm Hg (120 − 78 mm Hg) difference in systolic BP between BPH and BPL mice, and the ∼18 mm Hg (125 − 107 mm Hg) difference between SHR and WKY rats,19 indicate that we cannot completely exclude distinct responses to BP as determinants of differential gene expression between the strains, even at these early ages.17,19
Preparation of RNA
Total RNA was extracted from isolated adrenal glands of the SHR and WKY rats, as well as the BPH and BPL mice, with the RNAzol (guanidinium thiocyanate) kit (TelTest, Friendswood, TX), followed by RNase-free DNase I (Qiagen, Valencia, CA) treatment to eliminate residual genomic DNA. Integrity of the RNA was confirmed through 28S and 18S rRNA profiles on Agilent (Palo Alto, CA) columns and ethidium bromide-stained gels (data not shown).
Microarray analysis
Gene expression in the adrenal gland of each animal (n = 3 SHR, n = 3 WKY, n = 3 BPH, n = 3 BPL) was measured using standard Affymetrix protocols and Affymetrix (Santa Clara, CA) GeneChips, as previously described.3 RG-U34A rat GeneChips were used for measurement of SHR and WKY gene expression, and MG-U74Av2 mouse GeneChips were used to assay BPH and BPL gene expression. The rat RG-U34A chip contains 8740 probe sets (excluding quality controls) corresponding to all full-length, annotated rat gene clusters (∼6000) from the UniGene database (Build 34) as well as ∼3000 expressed sequence tag (EST) clusters. The mouse MG-U74Av2 chip contains 12,422 probe sets (excluding quality controls) corresponding to all functionally characterized sequences (∼6000) in the mouse UniGene database (Build 74) and thousands of EST clusters (∼6000). Tab-delimited text files of all chip spot features and probe design information are publicly available on the Affymetrix website: http://www.affymetrix.com.
We compared the expression patterns of all orthologous genes on the rat and mouse chips. Orthologs were derived from the HomoloGene and UniGene databases at the National Center for Biotechnology Information (NCBI) (http://www.ncbi.nlm.nih.gov). Orthologous probe set information can be downloaded from the Affymetrix website: http://www.affymetrix.com.
Real-time-polymerase chain reaction
A commonly used method, real-time-polymerase chain reaction (RT-PCR), to confirm microarray fidelity, was performed on SHR, WKY, BPH, and BPL adrenal mRNA with the SuperScript first-strand synthesis system (Invitrogen, Carlsbad, CA), an ABI-7700 (Applied Biosystems, Foster City, CA) thermal cycler and fluorescent plate reader, and the Amplifluor universal detection system (Serologicals Corporation; Norcross, GA), as previously described.20 Data normalization was performed by quantification of the endogenous 18S rRNA, and final nanogram equivalents were determined with relative standard curve analysis (Applied Biosystems). Statistical significance was computed with a two-tailed Student t test.
SHR Cd36 mutation
To detect the dysfunctional chimeric Cd36 gene in the SHR, we resequenced the gene and verified the presence of the previously published polymorphisms.21 The rat Cd36 gene was resequenced in adrenal mRNA from 12-week-old SHR and WKY rats (three each). The RT-PCR was performed using PTC-200 DNA Engine thermal cyclers (MJ Research, Watertown, MA) using the Qiagen one-step RT-PCR kit and the following gene-specific primers: CD36F2, [226] 5′-CAAAAACTGGGTGAAAACGGG-3′ [246]; and CD36B2, [912] 5′-TCAAACACAGCATAGATGGACCTG-3′ [889]. First strand cDNA was prepared from 500 ng of total RNA template by reverse transcription (using Omniscript and Sensiscript reverse transcriptases) at 54°C for 30 min, followed by PCR as described previously.22 As a negative control, when RNA was pretreated with RNase A (Qiagen), no product in the RT-PCR assay was detected after gel electrophoresis. As a second negative control, no PCR product was obtained when water was taken instead of RNA samples in the reaction mixture. The RT-PCR products were then sequenced on ABI-3100 automated fluorescent DNA sequencer.
Data analysis
Statistical analysis of the microarray data was performed with Cyber-T,23 a bayesian probabilistic framework designed for microarray experiments without large numbers of replicates, as well as a standard t test. Probe sets were considered significantly differentially expressed at P < .05 for Cyber-T or t test to minimize false negatives and gain a broad perspective on biochemical systems perturbed in the hypertensive rodent strains.
All probe sets, regardless of statistical significance, were sorted into orthologous and functional clusters. The orthologous clusters consisted of two distinct groups: orthologs with common expression, and orthologs with unique expression. We define commonly expressed orthologs as being significantly differentially expressed in the same direction in both of the hypertensive rodent strains (ie, overexpressed in both SHR and BPH, or underexpressed in both SHR and BPH). Orthologs uniquely expressed exhibit one of the following patterns of expression: 1) overexpressed in BPH, underexpressed in SHR; 2) overexpressed in BPH, no change in SHR; 3) underexpressed in BPH, overexpressed in SHR; 4) underexpressed in BPH, no change in SHR; 5) no change in BPH, underexpressed in SHR; or 6) no change in BPH, overexpressed in SHR.
The following groups were chosen for functional clustering based on their known or purported role in BP control or hypertension: adrenergic receptors, apoptosis, catecholamines and sympathetic function (including chromogranins/secretogranins), cholinergic systems, inflammation (leukotriene and prostaglandin synthesis), intermediary metabolism, neurotrophins, other vasoconstrictor/vasodilator systems, oxidative stress, proteases, renin-angiotensin-aldosterone system, and steroid hormone biosynthesis/degradation and receptors.
Results
Microarray statistical results
Statistical analysis of the rat and mouse microarray experiments yielded similar percentages of probe sets differentially expressed by strain: 13.9% for SHR/WKY v 16.9% for BPH/BPL (Table 1). In both experiments (ie, SHR/WKY and BPH/BPL), about half of the differentially expressed probe sets were overexpressed and the other half were underexpressed (Table 1).
SHR and BPH ortholog comparison
| Species Strains | Rat SHR, WKY | Mouse BPH, BPL |
|---|---|---|
| GeneChip | RG-U34A | MG-U74Av2 |
| Probe sets | 8740 | 12422 |
| Total differentially expressed probe sets | 1217 (13.9%) | 2108 (16.9%) |
| Overexpressed probe sets | 580 | 1059 |
| Underexpressed probe sets | 637 | 1049 |
| Orthologous probe sets | 5273 (60.3%) | 5273 (42.4%) |
| Total differentially expressed orthologs | 815 (15.4% of 5273) | 1012 (19.2% of 5273) |
| Overexpressed orthologs | 389 | 492 |
| Common (shared by rat and mouse) | 41 (10.5% of 389) | 41 (8.3% of 492) |
| Unique (unshared by rat and mouse) | 348 (89.5% of 389) | 451 (91.7% of 492) |
| Underexpressed orthologs | 426 | 520 |
| Common (shared by rat and mouse) | 52 (12.2% of 426) | 52 (10% of 520) |
| Unique (unshared by rat and mouse) | 374 (87.8% of 426) | 468 (90% of 520) |
The number of significantly differentially expressed genes for the rat (SHR, WKY) and the mouse (BPH, BPL) is shown. “Common” expressed orthologs are differentially expressed in the same direction in SHR and BPH; ie, overexpressed in both SHR and BPH, or underexpressed in both SHR and BPH. “Unique” expressed orthologs can show six types of expression patterns (described in the Methods section). Probe sets were considered significantly differentially expressed if they achieved P <. 05 by Cyber-T or by t test.
The rat and mouse GeneChips contain probe sets for 5273 genes orthologous between the two species. Each chip contained a large portion of orthologous genes: 60.3% of the rat chip and 42.4% of the mouse chip. In both the SHR and BPH, about half of the differentially expressed orthologs were overexpressed and about half were underexpressed (Table 1). Orthologs designated as commonly differentially expressed (ie, overexpressed in both BPH and SHR, or underexpressed in both BPH and SHR) comprised ∼10% of the differentially expressed orthologs (Table 1, Fig. 1). Approximately 90% of the orthologs differentially expressed in SHR or BPH were uniquely expressed (defined in Methods) (Table 1, Fig. 1).
Distribution of significantly differentially expressed orthologs in SHR and BPH. The graph displays the percent of significantly (P < .05) differentially expressed orthologs stratified by ortholog classification (common versus unique; defined in Methods section) and direction of expression (overexpressed versus underexpressed). Approximately 10% of the significantly differentially expressed orthologs show a “common” direction of expression, ie, overexpressed in both SHR and BPH or underexpressed in both SHR and BPH. Conversely, ∼90% of the significantly differentially expressed orthologs lack the same direction of expression in SHR and BPH (ie, show “unique” expression).
Did the directional patterns of ortholog differential expression (Table 1) differ from those expected by chance alone? In the rat, for example, 11.4% of the differentially expressed orthologs (93/815) shared a common direction, whereas in the mouse this value was 9.2% (93/1012). The expectation of differential expression by chance alone might be stated: 1↑ :1↑ ↓:1↓ ↑:1↓, or 25%:25%:25%:25%. Thus, directionally shared differential expression was observed to be substantially less than predicted under random conditions (in the rat, χ2 = 154, P < .0001; in the mouse, χ2 = 224, P < .0001). Therefore, such rat:mouse directional pairings appear to be a highly restricted subset of all differentially expressed genes.
RT-PCR: verification of microarray fidelity
Relative expression (SHR versus WKY; BPH versus BPL) of a subset of genes (n = 25) was verified with RT-PCR (data not shown), a commonly used technique to quantify relative gene expression. Microarray and RT-PCR results agreed over a large range of values. Linear regression analysis for RT-PCR-fold change versus chip-fold change yielded Pearson correlation coefficients of R = 0.788 for the SHR/WKY experiment and R = 0.739 for the BPH/BPL experiment. Genes were picked from a spectrum of functional categories so as to generalize our results to all transcripts, rather than only a few particular systems.
Orthologous and functional clustering
Differentially expressed genes were sorted into orthologous and functional clusters. The cluster of differentially expressed orthologs included 41 probe sets overexpressed in both SHR and BPH (Table 2, Fig. 1) and 52 probe sets underexpressed in both SHR and BPH (Table 3, Fig. 1). The actual number of genes overexpressed/underexpressed in common (28 overexpressed and 35 underexpressed) is less than the number of probe sets because of redundancy in probe sets (ie, two probe sets representing the same gene). Even the subset of differentially expressed orthologs with common directionality in the two species’ genetically hypertensive models (Fig. 2) showed substantial heterogeneity in biological processes represented.
Functional classification of shared orthologous genes in SHR and BPH. The orthologs differentially expressed in the same direction (n = 63) in SHR and BPH (ie, overexpressed in both SHR and BPH, or underexpressed in both SHR and BPH) were sorted into functional groups based on known function of the gene products. The pie chart shows the percent of orthologs that fall into the various functional groups.
Orthologous probe sets underexpressed in both SHR and BPH
| Functional Group Rat Probe Set ID | Mouse Probe Set ID | Orthologous Gene Name (rat, mouse) | Gene Symbol (rat, mouse) | Rat Fold Change (SHR/WKY) | Mouse Fold Change (BPH/BPL) |
|---|---|---|---|---|---|
| Calcium binding proteins | |||||
| S53527mRNA_s_at | 101467_at | S100 protein, beta polypeptide | S100b | 0.17 | 0.49 |
| X86086_g_at | 94304_at | Annexin 6; annexin A6 | Anxa6 | 0.78 | 0.80 |
| Calcium channels (voltage dependent) | |||||
| AF051895_at | 93083_at | annexin 5; annexin A5 | Anxa5 | 0.31 | 0.84 |
| Cytoskeleton | |||||
| rc_AA892506_at | 96648_at | coronin, actin binding protein 1A | Coro1a | 0.13 | 0.63 |
| Extracellular matrix | |||||
| AJ005394_at | 101080_at | collagen, type V, alpha 1; procollagen, type V, alpha 1 | Col5a1 | 0.56 | 0.69 |
| J04035_at | 92207_at | elastin | Eln | 0.57 | 0.26 |
| Immune response | |||||
| Y12009_at | 161968_f_at | chemokine (C-C motif) receptor 5 | Cmkbr5; Ccr5 | 0.31 | 0.34 |
| X53430_at | 92683_at | CD3 antigen, delta polypeptide | Cd3d | 0.23 | 0.27 |
| U16025_g_at | 102730_at | RT1 class 1b gene, locus M3; histocompatibility 2, M region locus 3 | RT1-M3; H2-M3 | 0.29 | 0.42 |
| M10094_at | 101898_s_at | RT1 class 1b gene(Aw2); histocompatibility 2, Q region locus 10 | RT1Aw2; H2-Q10 | 0.11 | 0.10 |
| Inflammation | |||||
| X71127_at | 96020_at | complement component 1, q subcomponent, beta polypeptide | C1qb | 0.47 | 0.57 |
| Intermediary metabolism | |||||
| X65296cds_s_at | 101538_i_at | carboxylesterase 3 | Ces3 | 0.10 | 0.65 |
| rc_AA800243_at | 99994_at | Rattus norvegicus similar to cell death activator CIDE-A (LOC291541), mRNA; cell death-inducing DNA fragmentation factor, alpha subunit-like effector A | —; Cidea | 0.53 | 0.38 |
| M27467_at | 100551_r_at | cytochrome c oxidase, subunit VIc | Cox6c | 0.51 | 0.47 |
| X64827cds_s_at | 160851_r_at | cytochrome c oxidase subunit VIII-H (heart/muscle); cytochrome c oxidase, subunit VIIIb | Cox8h; Cox8b | 0.51 | 0.33 |
| rc_A1237007_at | 97869_at | electron transferring flavoprotein, dehydrogenase | Etfdh | 0.02 | 0.46 |
| J04473_at | 99148_at | fumarate hydratase 1 | Fh1 | 0.69 | 0.63 |
| rc_A1171090_g_at | 94324_f_at | 3-hydroxy-3-methylglutaryl-Coenzyme A lyase | Hmgcl | 0.74 | 0.59 |
| U07181_g_at | 101990_at | lactate dehydrogenase B; lactate dehydrogenase 2, B chain | Ldhb; Ldh2 | 0.63 | 0.51 |
| X51415cds_s_at | 103083_at | lipase, hormone sensitive | Lipe | 0.66 | 0.41 |
| rc_AA892864_at | 97511_at | Monoglyceride lipase | Mgll | 0.70 | 0.58 |
| D86215_at | 97201_s_at | NADH dehydrogenase (ubiquinone) 1 alpha subcomplex, 5 | Ndufa5 | 0.65 | 0.67 |
| J02585_at | 94057_g_at | stearoyl-Coenzyme A desaturase 1 | Scd1 | 0.39 | 0.40 |
| K01934mRNA#2_at | 160306_at | thyroid hormone responsive protein; thyroid hormone responsive SPOT14 homolog | Thrsp | 0.51 | 0.35 |
| Myelin | |||||
| S55427_s_at | 102395_at | peripheral myelin protein 22 | Pmp22 | 0.72 | 0.70 |
| Oxidative stress | |||||
| X68041cds_s_at | 94902_at | superoxide dismutase 3 | Sod3 | 0.60 | 0.68 |
| Phosphorylation | |||||
| rc_AA875506_at | 104546_g_at | casein kinase II, alpha 1 polypeptide; casein kinase II, alpha 1 related sequence 4 | Csnk2a1; Csnk2a1-rs4 | 0.14 | 0.37 |
| Protease inhibitors | |||||
| rc_A1010453_at | 93109_f_at | serine (or cysteine) proteinase inhibitor, clade A, member 1; serine (or cysteine) proteinase inhibitor, clade A, member 1d | Serpina1; Serpina1d | 0.40 | 0.44 |
| Signal transduction | |||||
| rc_A1010581_at | 97248_at | diazepam binding inhibitor | Dbi | 0.68 | 0.56 |
| U57499_at | 102874_at | protein tyrosine phosphatase, non-receptor type 11 | Ptpn11 | 0.54 | 0.17 |
| Transcription factors | |||||
| rc_A1172476_at | 99602_at | TGFB inducible early growth response; TGFB inducible early growth response 1 | Tieg; Tieg1 | 0.63 | 0.54 |
| Unknown | |||||
| M76110_s_at | 98859_at | acid phosphatase 5 | Acp5 | 0.83 | 0.49 |
| U44948_at | 93550_at | cysteine rich protein 2; cysteine and glycine-rich protein 2 | Csrp2 | 0.64 | 0.78 |
| U27562_at | 160319_at | SPARC-like 1 (mast9, hevin) | Sparcl1 | 0.35 | 0.69 |
| rc_A1014169_at | 160547_s_at | upregulated by 1,25-dihydroxyvitamin D-3; thioredoxin interacting protein | Vdup1; Txnip | 0.55 | 0.73 |
Genes listed have an ortholog in the rat and mouse and have significantly (P < .05) underexpressed (SHR < WKY and BPH < BPL) probe sets in both the rat and mouse microarray experiments. Affymetrix rat probe set ID (column 1), Affymetrix mouse probe set ID (column 2), orthologous gene name (column 3), orthologous gene symbol (column 4), rat fold change (SHR fluorescence/WKY fluorescence) (column 5), and mouse fold change (BPH fluorescence/BPL fluorescence) (column 6) are shown. In several orthologs, the gene name or gene symbol differs between the rat and mouse; the two different names/symbols are separated by a semicolon. Genes were placed into general functional categories based on current knowledge about the function of the gene products.
Orthologous probe sets overexpressed in both SHR and BPH
| Functional Group Rat Probe Set ID | Mouse Probe Set ID | Orthologous Gene Name (rat, mouse) | Gene Symbol (rat, mouse) | Rat Fold Change (SHR/WKY) | Mouse Fold Change (BPH/BPL) |
|---|---|---|---|---|---|
| Activation and detoxification of exogenous chemicals | |||||
| M26125_at | 101587_at | epoxide hydrolase 1, microsomal | Ephx1 | 1.54 | 1.46 |
| Adrenal tumor suppressor | |||||
| M32754cds_s_at | 102266_at | inhibin alpha | Inha | 1.51 | 1.59 |
| Cellular adhesion | |||||
| AJ009698_g_at | 101560_at | Embigin | Emb | 3.37 | 2.64 |
| Chaperones | |||||
| rc_AA818604_s_at | 93875_at | heat shock 70kD protein 1B; heat shock protein 1A | Hspa1b; Hspa1a | 3.01 | 5.08 |
| Cysteine protease inhibitor | |||||
| AF090692_at | 103245_at | cystatin 8 | Cst8 | 1.70 | 3.84 |
| Glycosylation | |||||
| AF047707_g_at | 96623_at | UDP-glucose ceramide glucosyltransferase | Ugcg | 2.61 | 1.72 |
| Inflammation | |||||
| S77528cds_s_at | 92925_at | CCAAT/enhancer binding protein (C/EBP), beta | Cebpb | 1.25 | 1.52 |
| Intermediary metabolism | |||||
| rc_A1236284_s_at | 102381_at | fatty acid-Coenzyme A ligase, long chain 4 | Facl4 | 1.36 | 1.28 |
| M29249cds_at | 99425_at | 3-hydroxy-3-methylglutaryl-Coenzyme A reductase | Hmgcr | 2.56 | 3.11 |
| rc_AA817685_at | 98533_at | cytochrome b-5 | Cyb5 | 1.73 | 1.40 |
| Nuclear hormone receptors | |||||
| X99470_at | 93141_at | nuclear receptor subfamily 0, group B, member 1 | Nr0b1 | 1.81 | 1.47 |
| U17254_at | 102371_at | immediate early gene transcription factor NGFI-B; nuclear receptor subfamily 4, group A, member 1 | Nr4a1 | 2.03 | 5.04 |
| L08595_at | 92248_at | nuclear receptor subfamily 4, group A, member 2 | Nr4a2 | 4.10 | 3.92 |
| Oxidative stress | |||||
| AB008807_at | 97819_at | glutathione S-transferase omega 1 | Gsto1 | 1.51 | 1.28 |
| U73525_at | 98130_at | thioredoxin 2 | Txn2 | 1.26 | 1.20 |
| Prohormone processing | |||||
| L07281_at | 99643_f_at | carboxypeptidase E | Cpe | 1.73 | 1.37 |
| Signal transduction | |||||
| D14839_at | 100346_at | fibroblast growth factor 9 guanine nucleotide binding protein, | Fgf9 | 2.28 | 2.91 |
| S50461_s_at | 97226_at | alpha 12 | Gna12 | 1.27 | 1.31 |
| U35345_s_at | 97823_g_at | p21 (CDKN1A)-activated kinase 2 | Pak2 | 1.99 | 1.27 |
| D85183_s_at | 103070_at | protein tyrosine phosphatase, non-receptor type substrate 1 | Ptpns1 | 4.47 | 1.86 |
| Transcription factors | |||||
| D13417_at | 160887_at | hairy and enhancer of split 1 (Drosophila) | Hes1 | 2.36 | 1.27 |
| rc_A1072435_at | 93740_at | nuclease sensitive element binding protein 1 | Nsep1 | 1.55 | 1.66 |
| rc_A1112516_at | 93324_at | zinc finger protein 36, C3H type-like 1 | Zfp3611 | 1.47 | 1.67 |
| Transport | |||||
| AB015433_s_at | 99133_at | solute carrier family 3, member 2 | Slc3a2 | 1.81 | 1.61 |
| M24105_at | 98926_at | vesicle-associated membrane protein 2 | Vamp2 | 1.27 | 1.39 |
| Unknown | |||||
| U67140_g_at | 104136_at | disks large-associated protein 4; cDNA sequence BC024558 | DAP-4;BC024558 | 2.26 | 3.07 |
| rc_AA850568_at | 96295_at | phosphoserine aminotransferase 1 | Psat1 | 2.75 | 1.51 |
| X99338cds_i_at | 93043_at | stromal cell derived factor receptor 1 | Sdfr1 | 3.35 | 1.09 |
Genes listed have an ortholog in the rat and mouse and have significantly (P < .05) overexpressed (SHR > WKY and BPH > BPL) probe sets in the hypertensive strain in both the rat and mouse microarray experiments. Affymetrix rat probe set ID (column 1), Affymetrix mouse probe set ID (column 2), orthologous gene name (column 3), orthologous gene symbol (column 4), rat fold change (SHR fluorescence/WKY fluorescence) (column 5), and mouse fold change (BPH fluorescence/BPL fluorescence) (column 6) are shown. In several orthologs, the gene name or gene symbol differs between the rat and mouse; the two different names/symbols are separated by a semicolon. Genes were placed into general functional categories based on current knowledge about the activities of the gene products.
For the purposes of the current discussion, data for the following functional clusters are presented: catecholamines and sympathetic function (Fig. 3), steroid hormone biosynthesis/degradation and receptors (Fig. 4), oxidative stress (Table 4), and intermediary metabolism (Fig. 5). (See Supplementary Tables 1 and 2 online.)
Steroid hormone biosynthesis/degradation and receptors. Gene expression of steroid hormone biosynthetic enzymes and receptors is shown for SHR (A) and BPH (B). Red indicates an overexpressed gene, blue indicates an underexpressed gene, white indicates no data (ie. no probe on chip), and gray indicates lack of statistical significance. The bold number listed next to significantly (P < .05) differentially expressed genes is the fold change (SHR/WKY or BPH/BPL). Abbreviations: Akr1c1 = aldo-keto reductase family 1, member c1 (20-alpha-hydroxysteroid dehydrogenase); Akr1c2 = aldo-keto reductase family 1, member c2 (3-alpha-hydroxysteroid dehydrogenase); Akr1c6 = aldo-keto reductase family 1, member C6; Akr1c13 = aldo-keto reductase family 1, member C13; Akr1c21 = aldo-keto reductase family 1, member C21; Ar = androgen receptor; Cyp7a1 = cytochrome P450, 7a1; Cyp11a = cytochrome P450, subfamily 11a; Cyp11b1 = cytochrome P450, subfamily 11b, polypeptide 1; Cyp11b2 = cytochrome P450, subfamily 11b, polypeptide 2; Cyp17a1 = cytochrome P450, subfamily 17a; Cyp19a1 = cytochrome P450, family 19, subfamily a, polypeptide 1; Cyp21 = cytochrome P450, subfamily 21a; Esr1 = estrogen receptor 1; Esr2 = estrogen receptor 2; Esrra = estrogen-related receptor α; Esrrb = estrogen-related receptor β; Hsd3b = hydroxysteroid dehydrogenase, delta<5>-3-β; Hsd11b1 = hydroxysteroid 11-β dehydrogenase 1; Hsd11b2 = hydroxysteroid 11-β dehydrogenase 2; Hsd17b = hydroxysteroid 17-β dehydrogenase; Nr3c1 = nuclear receptor subfamily 3 group C member 1 (glucocorticoid receptor); Nr3c2 = nuclear receptor subfamily 3 group C member 2 (mineralocorticoid receptor); Pgr = progesterone receptor; Ste = sulfotransferase, estrogen preferring; Sth2 = sulfotransferase, hydroxysteroid preferring 2; Sult1b1 = sulfotransferase family 1B, member 1; Sult2b1 = sulfotransferase family, cytosolic, 2B, member 1; Sult4a1 = sulfotransferase family 4A, member 1.
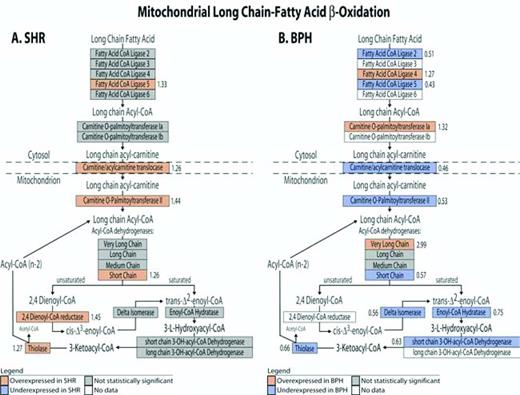
Differences in metabolic gene expression patterns between SHR and BPH. Gene expression of the mitochondrial long chain fatty acid β-oxidation pathway is shown for SHR (A) and BPH (B). Red indicates an overexpressed gene, blue indicates an underexpressed gene, white indicates no data (ie, no probe on chip), and gray indicates lack of statistical significance. The bold number listed next to significantly (P < .05) differentially expressed genes is the fold change (BPH/BPL or SHR/WKY).
Oxidative stress functional cluster
| Functional Group Rat Probe Set ID | Mouse Probe Set ID | Gene Name | Gene Symbol | Rat Fold Change (SHR/WKY) | Mouse Fold Change (BPH/BPL) |
|---|---|---|---|---|---|
| ROS sources | |||||
| Mitochondria (electron transport chain) (Please see online) | |||||
| Cytochrome P450s (Please see online) | |||||
| NADPH oxidase | |||||
| U18729_at | 100059_at | cytochrome b-245, alpha polypeptide | Cyba | N/A | N/A |
| — | 100300_at | cytochrome b-245, beta polypeptide | Cybb | — | N/A |
| X74402_at | 97313_at | Guanosine diphosphate dissociation inhibitor 1 | Gdi1 | 1.20 | N/A |
| rc_AA892258_at | — | NADPH oxidase 4 (kidney specific) | Nox4 | 0.11 | — |
| — | 97763_at | neutrophil cytosolic factor 1 | Ncf1 | — | N/A |
| — | 102326_at | neutrophil cytosolic factor 2 | Ncf2 | — | N/A |
| — | 103662_at | neutrophil cytosolic factor 4 | Ncf4 | — | N/A |
| — | 101555_at | RAS-related C3 botulinum substrate 1 | Rac1 | — | N/A |
| — | 103579_at | RAS-related C3 botulinum substrate 2 | Rac2 | — | N/A |
| Other | |||||
| — | 100414_s_at | myeloperoxidase | Mpo | — | N/A |
| Xanthine oxidase | |||||
| rc_A1172247_at | 97950_at | xanthine dehydrogenase | Xdh | 0.49 | 1.48 |
| ROS defense | |||||
| Glutathione-dependent defense systems | |||||
| J05181_at | 99649_at | Glutamate-cysteine ligase catalytic subunit | Gclc | 1.62 | N/A |
| rc_A1233261_i_at | 160335_at | Glutamate cysteine ligase, modifier subunit | Gclm | N/A | 1.28 |
| — | 100085_at | gamma-glutamyltransferase 1 | Ggt1 | — | N/A |
| X07365_s_at | 94132_at | glutathione peroxidase 1 | Gpx1 | N/A | N/A |
| rc_AA800587_at | 99810_at | glutathione peroxidase 2 | Gpx2 | N/A | N/A |
| D00680_at | — | glutathione peroxidase 3 | Gpx3 | N/A | — |
| L24896_s_at | 94897_at | glutathione peroxidase 4 | Gpx4 | 0.84 | N/A |
| — | 161986_f_at | glutathione peroxidase 5 | Gpx5 | — | 0.73 |
| rc_AA893189_at | 160646_at | glutathione reductase | Gsr | N/A | N/A |
| L38615_g_at | 101425_at | glutathione synthetase | Gss | N/A | N/A |
| S83436_i_at | — | glutathione S-transferase, mitochondrial | Gst13-13 | N/A | — |
| X62660mRNA_at | — | glutathione S-transferase subunit 8 | — | 3.13 | — |
| X78848cds_f_at | 160063_i_at | glutathione S-transferase, alpha 1 | Gsta1 | N/A | N/A |
| S72506_s_at | 101872_at | glutathione-S-transferase, alpha type2 | Gsta2 | N/A | N/A |
| — | 93015_at | glutathione S-transferase, alpha 3 | Gsta3 | — | N/A |
| — | 96085_at | glutathione S-transferase, alpha 4 | Gsta4 | — | N/A |
| — | 96670_at | glutathione S-transferase kappa 1 | Gstk1 | — | 1.26 |
| X04229cds_s_at | 93543_f_at | glutathione S-transferase, mu 1 | Gstm1 | 1.72 | N/A |
| J02592_s_at | 161357_r_at | glutathione S-transferase, mu 2 | Gstm2 | N/A | N/A |
| E01415cds_s_at | 97682_r_at | glutathione S-transferase, mu 3 | Gstm3 | N/A | 0.67 |
| U86635_g_at | 100629_at | glutathione S-transferase, mu 5 | Gstm5 | 0.27 | 1.19 |
| — | 104637_at | glutathione S-transferase, mu 6 | Gstm6 | — | N/A |
| AB008807_at | 97819_at | glutathione S-transferase, omega 1 | Gsto1 | 1.51 | 1.28 |
| rc_A1012589_s_at | — | glutathione-S-transferase, pi 1 | Gstp1 | N/A | — |
| X02904cds_s_at | 99583_at | glutathione S-transferase, pi 2 | Gstp2 | N/A | N/A |
| X67654_at | 95019_at | glutathione S-transferase, theta 1 | Gstt1 | 1.74 | N/A |
| D10026_s_at | 104603_at | glutathione S-transferase, theta 2 | Gstt2 | 0.61 | N/A |
| — | 160350_at | glutathione transferase zeta 1 (maleylacetoacetate isomerase) | Gstz1 | — | N/A |
| rc_A1012802_at | 100042_at | hydroxyacyl glutathione hydrolase | Hagh | N/A | N/A |
| J03752_at | 93026_at | microsomal glutathione S-transferase 1 | Mgst1 | 1.22 | 0.29 |
| — | 104742_at | microsomal glutathione S-transferase 2 | Mgst2 | — | 4.15 |
| — | 96258_at | microsomal glutathione S-transferase 3 | Mgst3 | — | 1.54 |
| S73424_s_at | — | macrophage migration inhibitory factor | Mif | 1.42 | — |
| Hydrogen peroxide specific defense | |||||
| rc_AA926149_g_at | 161877_f_at | Catalase | Cat | 1.66 | N/A |
| Paraoxonase systems | |||||
| U94856_at | 96895_at | paraoxonase 1 | Pon1 | 3.44 | 0.55 |
| — | 104378_at | paraoxonase 2 | Pon2 | — | N/A |
| — | 93940_at | paraoxonase 3 | Pon3 | — | N/A |
| Peroxiredoxin systems | |||||
| rc_A1010083_at | 97758_at | peroxiredoxin 1 | Prdx1 | N/A | 0.71 |
| U06099_at | 99608_at | peroxiredoxin 2 | Prdx2 | N/A | 1.38 |
| rc_AA799650_g_at | 96256_at | peroxiredoxin 3 | Prdx3 | N/A | 1.40 |
| — | 93495_at | peroxiredoxin 4 | Prdx4 | — | 1.35 |
| AF014009_at | 100622_at | peroxiredoxin 6 | Prdx6 | 1.34 | N/A |
| Superoxide specific defense | |||||
| — | 103909_at | copper chaperone for superoxide dismutase | Ccs | — | N/A |
| Y00404_s_at | 100538_at | Superoxide dismutase 1 | Sod1 | N/A | N/A |
| Y00497_s_at | 96042_at | Superoxide dismutase 2 | Sod2 | N/A | 0.61 |
| X68041cds_s_at | 94902_at | Superoxide dismutase 3 | Sod3 | 0.60 | 0.68 |
| Thioredoxin systems | |||||
| — | 92807_at | thioredoxin 1 | Txn1 | — | 1.14 |
| U73525_at | 98130_at | thioredoxin 2 | Txn2 | 1.26 | 1.20 |
| — | 160547_s_at | thioredoxin interacting protein | Txnip | — | 0.73 |
| rc_AA875390_at | 160115_at | thioredoxin-like (32kD) | Txnl | 0.25 | N/A |
| — | 95696_at | thioredoxin-like 2 | Txnl2 | — | N/A |
| rc_AA891286_at | 99985_at | thioredoxin reductase 1 | Txnrd1 | N/A | N/A |
| AF072865_g_at | 160437_at | thioredoxin reductase 2 | Txnrd2 | N/A | N/A |
| — | 161043_r_at | thioredoxin reductase 3 | Txnrd3 | — | N/A |
| Transport (export of detoxified ROS from cell) | |||||
| S66618_at | 102910_at | ATP-binding cassette, sub-family B (MDR/TAP), member 1A | Abcb1a | N/A | 2.12 |
| — | 93414_at | ATP-binding cassette, sub-family B (MDR/TAP), member 1B | Abcb1b | — | N/A |
| — | 94733_at | ATP-binding cassette, sub-family B (MDR/TAP), member 4 | Abcb4 | — | N/A |
| AF106563_s_at | — | ATP-binding cassette, sub-family B (MDR/TAP), member 6 | Abcb6 | N/A | — |
| — | 103300_at | ATP-binding cassette, sub-family B (MDR/TAP), member 7 | Abcb7 | — | N/A |
| — | 92418_at | ATP-binding cassette, sub-family B (MDR/TAP), member 9 | Abcb9 | — | 0.73 |
| — | 104394_at | ATP-binding cassette, sub-family B (MDR/TAP), member 10 | Abcb10 | — | 0.31 |
| AF010597_s_at | — | ATP-binding cassette, sub-family B (MDR/TAP), member 11 | Abcb11 | N/A | — |
| X96394_at | 99329_at | ATP-binding cassette, sub-family C (CFTR/MRP), member 1 | Abcc1 | N/A | N/A |
| D86086_s_at | 95283_at | ATP-binding cassette, sub-family C (CFTR/MRP), member 2 | Abcc2 | N/A | N/A |
| AB010467_s_at | 103689_at | ATP-binding cassette, sub-family C (CFTR/MRP), member 3 | Abcc3 | N/A | 1.87 |
| — | 103800_at | ATP-binding cassette, sub-family C (CFTR/MRP), member 5 | Abcc5 | — | N/A |
| AB010466_s_at | 93407_at | ATP-binding cassette, sub-family C (CFTR/MRP), member 6 | Abcc6 | 1.41 | N/A |
| L40624_at | 103274_at | ATP-binding cassette, sub-family C (CFTR/MRP), member 8 | Abcc8 | N/A | N/A |
| D83598_at | 97172_s_at | ATP-binding cassette, sub-family C (CFTR/MRP), member 9 | Abcc9 | N/A | N/A |
| Uncoupling proteins | |||||
| X03894_at | 99507_at | Uncoupling protein 1 | Ucp1 | N/A | 0.15 |
| AB005143_s_at | 92792_at | Uncoupling protein 2 | Ucp2 | 0.38 | N/A |
| AF030163_s_at | 93392_at | Uncoupling protein 3 | Ucp3 | N/A | 0.29 |
| Oxidative stress pathology (vasomotor systems affected by ROS) | |||||
| rc_A1179610_at | 160101_at | heme oxygenase 1 | Hmox1 | 1.70 | N/A |
| J05405mRNA_s_at | 101062_at | heme oxygenase 2 | Hmox2 | N/A | N/A |
| S81433_at | — | heme oxygenase 2 (5′ region, alternative splicing) | Hmox2 | 0.29 | — |
| AF058787_at | — | heme oxygenase 3 | — | N/A | — |
| U67309_at | 98365_at | nitric oxide synthase 1, neuronal | Nos1 | N/A | N/A |
| D44591_s_at | 104420_at | nitric oxide synthase 2, inducible | Nos2 | N/A | N/A |
| AJ011115_at | 94167_at | nitric oxide synthase 3, endothelial cell | Nos3 | N/A | N/A |
Genes listed are functionally involved in oxidative stress. Affymetrix rat and mouse probe IDs (columns 1 and 2), gene name (column 3), gene symbol (column 4), rat fold change (SHR fluorescence/WKY fluorescence) (column 5), and mouse fold change (BPH fluorescence/BPL fluorescence) (column 6), and are shown. The symbol “—” indicates that there is no data because a probe set for the corresponding gene did not exist on the GeneChip. The symbol “N/A” indicates that the fold change is not reported because the gene is not significantly differentially expressed for the particular species (ie, rat or mouse) it is listed under. Statistically significant fold changes (P < .05) are shown in bold type.
Catecholamines and sympathetic function in SHR and BPH. Gene expression of the catecholamine biosynthetic and target (receptor) pathway is shown in the SHR hypertensive rat strain (A) and BPH hypertensive mouse strain (B). Red indicates an overexpressed gene, blue indicates an underexpressed gene, white indicates no data (ie, no probe on chip), and gray indicates lack of statistical significance. The bold number listed next to significantly (P < .05) differentially expressed genes is the fold change (BPH/BPL or SHR/WKY). Abbreviations: 6-pt = 6-pyruvoyl-tetrahydropterin; 7,8-dtp = 7,8-dihydroneopterin triphosphate; Adra1a = adrenergic receptor, alpha 1a; Adra1b = adrenergic receptor, alpha 1b; Adra2a = adrenergic receptor, alpha 2a; Adra2b = adrenergic receptor, alpha 2b; Adra2c = adrenergic receptor, alpha 2c; Adrb1 = adrenergic receptor, beta 1; Adrb2 = adrenergic receptor, beta 2; Adrb3 = adrenergic receptor, beta 3; BH4 = tetrahydrobiopterin; Chga = chromogranin A; Chgb = chromogranin B; Comt = catechol-O-methyltransferase; Drd1a = dopamine receptor 1a; Drd2 = dopamine receptor 2; Drd3 = dopamine receptor 3; Drd4 = dopamine receptor 4; Gch = GTP cyclohydrolase 1; GTP = guanosine triphosphate; Maoa = monoamine oxidase A; Maob = monoamine oxidase B; Pts = 6-pyruvoyl-tetrahydrobiopterin synthase; Scg2 = sececretogranin II; Scg3 = secretogranin III; Sgne1 = secretory granule neuroendocrine protein 1; Slc6a2 = solute carrier family 6 (neurotransmitter transporter, noradrenalin), member 2; Slc6a3 = solute carrier family 6 (neurotransmitter transporter, dopamine), member 3; Slc18a1 = solute carrier family 18 (vesiclular monoamine transporter) member 1; Slc18a2 = solute carrier family 18 (vesicular monoamine transporter) member 2; Spr = sepiapterin reductase; Sult1a1 = sulfotransferase family 1A, phenol-preferring, member 1; Sult1a2 = sulfotransferase family 1A, member 2; Vgf = VGF nerve growth fa
Discussion
Microarray statistical results
The mouse GeneChip contains 3682 more probe sets than the rat GeneChip, yet both chips showed approximately the same percentage of differentially expressed genes: 16.9% of the mouse chip and 13.9% of the rat chip (Table 1). Such widespread differential gene expression in two independent models of the same human disease reinforces the complex and polygenic nature of hypertension, especially because ∼66% of the differentially expressed genes exhibit subtle changes between −twofold underexpressed and +twofold overexpressed (data not shown). Furthermore, in the SHR and BPH, genetic linkage analyses have estimated that only a few major loci play a role in the pathogenesis of hypertension (at least three in SHR,24,25 and four to five in BPH26). Therefore, much of the differential gene expression we noted is likely to reflect responses to these few major BP-determining genes. In addition, allelic variation at other loci could produce gene expression differences entirely unrelated to BP. In both species, the number of differentially expressed genes is approximately divided in half between overexpressed and underexpressed (Table 1), perhaps reflecting a complex response of activation and depression of both pressor and depressor mechanisms in hypertension.
Orthologous clusters
We compared expression of orthologs on the rat and mouse chips to probe the possibility of shared or even universal genetic mechanisms of hypertension across mammalian species. Intriguingly, just 10% of the differentially expressed orthologs showed common directional patterns of expression (ie, overexpressed in both SHR and BPH, or underexpressed in both SHR and BPH) (Table 1, Fig. 1). The set of orthologs with common patterns of expression may represent conserved mammalian mechanisms of generation of, or response to hypertension, and therefore may be particularly relevant to the study of human essential hypertension. It is also possible that genes with common patterns of expression might not be related to the hypertensive trait, and could reflect genetic drift (with subsequent fixation by strain inbreeding to homozygosity) or random chance. Even the subset of differentially expressed orthologs with common directionality in the two species’ hypertensive models showed substantial herterogeneity of biological processes (Fig. 2).
Conversely, ∼90% of the differentially expressed orthologs exhibited unique expression patterns in SHR and BPH (defined in Methods). Initially, the gross lack of rat/mouse agreement in expression patterns of orthologs appeared to cast doubt on the relevance of applying knowledge of either model to human treatment. If two closely related rodents, both selected for the same trait and inbred to homozygosity, showed ∼90% discordance in differential expression of their adrenal transcriptomes, how relevant are they to human essential hypertension? In fact, the difference in expression of orthologs between the two strains may simply be a reflection of how different organisms respond to similar stress, or a reflection of strain polymorphisms not related to BP. Because much of the differential expression in orthologs could reflect responses to hypertension or genotypes unrelated to hypertension, it is perhaps not surprising that two independent hypertensive models would exhibit substantial differences in patterns of gene expression, especially when considering the substantial interspecific (rat/mouse) differences in factors such as size, weight, lifespan, and the presence of other disease states (such as the metabolic syndrome in the SHR).
Many of the orthologs differentially expressed in common between SHR and BPH are intriguing candidate genes for hypertension pathogenesis (Tables 2 and 3). Evidence is increasing that supports the role of inflammation in pathogenesis and consequences of many cardiovascular diseases, including hypertension. The CCAAT/enhancer-binding protein (Cebpb) (1.25-fold overexpressed in SHR; 1.52-fold overexpressed in BPH) codes for a transcription factor responsive to interleukin 6, and may serve as a control point for widespread, global changes in the inflammatory cascade. The complement component 1, q subcomponent, β polypeptide (C1qb) (0.47-fold underexpressed in SHR; 0.57-fold underexpressed in BPH) is the first and major component of the complement cascade, an important mechanism in inflammation. Mutations in Cebpb and C1qb could have profound consequences on inflammatory processes in SHR and BPH.
Many metabolic abnormalities often accompany hypertension in a disorder called the metabolic syndrome, or syndrome X.2 Hydroxy-3-methylglutaryl-coenzyme A (HMG-CoA) reductase (Hmgcr) is the rate-limiting enzyme in cholesterol biosynthesis and target of the statin drugs in humans.27 Its coordinate differential overexpression in two rodent models of genetic hypertension (2.56-fold overexpressed in SHR; 3.11-fold overexpressed in BPH) suggests the possibility that its overexpression might be a systematic facet of hereditary hypertension in mammals, perhaps even contributing to the diverse metabolic abnormalities associated with the human disease state. Underexpression of HMG-CoA lyase (Hmgcl) in both hypertensive strains (0.74-fold underexpressed in SHR; 0.59-fold underexpressed in BPH) might increase the substrate availability of HMG-CoA to Hmgcr, perhaps magnifying the effect of Hmgcr excess to increase cholesterol biosynthesis.
Cholesterol is the precursor of glucocorticoid steroid hormones that play a profound but still incompletely understood role in BP homeostasis and hypertension in humans and rodents.28–33 Abnormalities in the glucocorticoid receptor have been proposed as a cause of glucocorticoid dependence in hypertension.34,35 The heat-shock 70-kD protein 1a gene (Hspa1a), which encodes a protein with a crucial role in glucocorticoid receptor activation, is overexpressed 3.01-fold in SHR and 5.08-fold in BPH. Aberrant Hspa1a function may contribute to the glucocorticoid dependence of hypertension. Its differential expression has been implicated previously in hypertension.36
Another metabolic abnormality observed in hypertension is dyslipidemia. The SHR and BPH underexpressed hormone-sensitive lipase (Lipe) by 0.61-fold and 0.41-fold, respectively. Lipe catalyzes the rate-limiting step in lipolysis of stored triglycerides to form free fatty acids, an important source of energy in mammals. Lipe is regulated by catecholamines and hormones (eg, insulin). The consistent alterations of Lipe observed here may thus contribute to metabolic and homeostatic abnormalities in hypertension common to mammalian species.
Enhanced oxidative stress is another mechanism rapidly gaining support as both a pathogenic and an end-organ damaging mechanism in hypertension. The decreased ability of superoxide dismutase to scavenge the free radical superoxide (O2−) in hypertensives has previously been reported.37–43 Superoxide dismutase 3 (Sod3) is underexpressed 0.60-fold in SHR and 0.68-fold in BPH. Such consistent underexpression may represent a fundamental susceptibility of genetic hypertension to vascular and organ damage.
To identify common mechanisms causing or responding to genetic hypertension in mammalian species, we determined the orthologous genes differentially expressed in the same direction in SHR and BPH (Tables 2 and 3). Even within this focused and specific set of orthologous genes, the multifactorial and systemic nature of hypertension is apparent in the classification of the orthologs into diverse functional groups (Fig. 2, Tables 2 and 3).
Catecholamines and sympathetic function
Analysis of catecholamine biosynthetic gene expression suggests fundamentally different patterns in the two models of genetic hypertension, with depressed synthesis of catecholamines likely in SHR, but enhanced synthesis in BPH (Fig. 3). Tyrosine hydroxylase, which catalyzes the rate-limiting step of catecholamine biosynthesis, is not differentially expressed in SHR but is overexpressed 1.61-fold in BPH. GTP cyclohydrolase 1 (Gch), the rate-limiting enzyme in synthesis of the essential cofactor of tyrosine hydroxylase (tetrahydrobiopterin), is not differentially expressed in SHR but is overexpressed 1.68-fold in BPH. In contrast, the SHR underexpressed dopamine β hydroxylase (Dbh) and phenylethanolamine-N-methyltransferase (Pnmt) 0.39-fold and 0.67-fold, respectively (Fig. 3). The mouse chip did not contain a probe set for Dbh, but the BPH overexpressed Pnmt 2.11-fold. Other investigators have observed decreased Dbh activity in the SHR.44
Transport of dopamine and monoamines into secretory vesicles is mediated by Slc18a1 and Slc18a2, also known as the vesicular monoamine transporters (Vmat1 and Vmat2). The SHR underexpressed Slc18a1 0.49-fold and overexpressed Slc18a2 2.20-fold, but the mouse chip did not have probe sets for Slc18a1 and Slc18a2. Underexpression of Slc18a1, the transporter specifically located in adrenal chromaffin granules, is consistent with a decrease of vesicular catecholamine storage in SHR. Slc18a2 is thought to function primarily in the brain and other noradrenergic neurons. The effect of Slc18a2 overexpression in the adrenal gland of SHR is unclear.
Chromogranins and secretogranins are the major soluble proteins in neurotransmitter and catecholamine secretory vesicles,45,46 and have roles in vesiculogenesis and regulation of catecholamine secretion.47 The SHR exhibits no differential expression of chromogranin A (Chga) and chromogranin B (Chgb), but 0.67-fold underexpression of secretogranin 2 (Scg2) (Fig. 3). The overexpression of chromogranin A (Chga), chromogranin B (Chgb), and secretogranin 2 (Scg2), 1.53-fold, 1.87-fold, and 2.12-fold (Fig. 3), respectively, in BPH further supports enhanced catecholamine storage in BPH. An increase in catecholamine synthesis would tend to increase the steady-state level of catecholamines, perhaps eventuating in an increase in the number or size of vesicles.
Expression patterns of catecholamine degradation enzymes are inconsistent in SHR but suggest decreased catecholamine degradation in BPH. Catechol-O-methyltransferase (Comt), the initial enzyme responsible for catecholamine degradation upon reuptake from the synapse, is overexpressed 37.39-fold in SHR (Fig. 3), which is actually the largest fold change observed in SHR. Such large fold changes may indicate major quantitative or even qualitative gene mutations that could have profound effects in other organs. In contrast, SHR exhibits underexpression of two other enzymes with catecholamine degradation function: monoamine oxidase B (Maob, 0.52-fold underexpressed) and sulfotransferase family 1a, member 1 (Sult1a1, 0.53-fold underexpressed) (Fig. 3). Comt is underexpressed 0.68-fold in BPH (Fig. 3), which may exaggerate the prohypertensive effects of enhanced catecholamine biosynthesis by increasing steady-state levels of catecholamines.
Overall, gene expression patterns suggest that that SHR has depressed catecholamine production and that BPH might suffer from increased catecholamine action. The effect of decreased adrenal catecholamine biosynthetic enzyme transcripts in SHR is not completely understood, but may serve as a compensatory mechanism for high BP. An overproduction of adrenal catecholamines in BPH would likely contribute to BP elevation in the strain. Changes in expression of catecholamine biosynthetic genes, however, could have unpredictable and counterintuitive effects in tissues other than the adrenal gland, such as the brain. Nonetheless, aberrant (albeit discordant) adrenal catecholamine production may underlie hypertensive pathology in both SHR and BPH.
Steroid hormone biosynthesis/degradation and receptors
Hypertension in the SHR may be glucocorticoid dependent.28–32 A trait that is also observed in human essential hypertensives33 but unexplored in BPH. The glucocorticoid dependence of the SHR appears to hinge on an enhanced sensitivity to rather than an increase in circulating levels of the hormone, with an enhanced level of glucocorticoid receptors in peripheral tissue.34 We examined adrenal steroid hormone biosynthetic pathways in SHR and BPH for glucocorticoid abnormalities (Fig. 4). The steroid hormone pathways we investigated are based on human metabolism because steroid synthesis pathways in rodents are not as well understood as in humans. A crucial distinction to make for this discussion is that the most abundant active glucocorticoid is corticosterone in rodents and cortisol in humans.
An important observation in the steroid synthesis by SHR is underexpression of cytochrome P450, subfamily 11, polypeptide 2 (Cyp11b2) (commonly known as aldosterone synthase) 0.57-fold (Fig. 4). Cyp11b2 converts corticosterone (the primary glucocorticoid) to aldosterone (the primary mineralocorticoid). Underexpression of Cyp11b2 could lead to corticosterone excess or aldosterone deficiency. Furthermore, the mineralocorticoid receptor (Nr3c2) can bind both glucocorticoids and mineralocorticoids. Receptor-binding specificity is conferred by hydroxysteroid dehydrogenase 11 β 2 (Hsd11b2), the enzyme that protects the receptor from glucocorticoid activation by degrading glucocorticoids to inactive metabolites.48 In what may be a compensatory mechanism for excess glucocorticoid activity, the SHR overexpressed the gene coding for Hsd11b2 by 1.40-fold.
Patterns of expression of SHR steroid degradation enzymes suggest an increase in progesterone catabolism. Aldo-keto reductase family 1, member c1 (Akr1c1) and aldo-keto reductase family 1, member c2 (Akr1c2) code for enzymes that specifically degrade progesterone49–51 (Akr1c2 can also degrade androstenedione and dihydrotestosterone), and are overexpressed in SHR 15.23-fold (the second largest fold change in SHR) and 3.50-fold, respectively. The large increase in expression of progesterone degradation enzymes has at least three possible implications for glucocorticoid activity in SHR. 1) Because progesterone is a precursor of corticosterone, degradation of progesterone may be a compensatory mechanism to reduce excessive glucocorticoid levels or activity, a theory supported by enhanced Hsd11b2 activity and decreased Cyp11b2 activity; 2) progesterone has been shown to have anti-glucocorticoid effects in vitro52,53 and in vivo54; mutations that lead to abnormally high rates of progesterone degradation could be a facet of the enhanced sensitivity of SHR to glucocorticoids; and 3) previous studies have shown that progesterone can bind to the glucocorticoid receptor with high affinity in vitro, and induce nuclear translocation and binding of the receptor complex.55 If, in the SHR, progesterone exerts a higher than normal proportion of its genomic actions through the glucocorticoid receptor, we may predict overactivity of glucocorticoid receptor signaling in effector tissues. Interestingly, we have previously observed overexpression of the glucocorticoid receptor in the microcirculation of the SHR.34
Oxidative stress
Glucocorticoids are also implicated in hypertension as a trigger of increased reactive oxygen species (ROS) and therefore oxidative stress. Increased levels of ROS are detectable in the circulation in both human56,57 and rodent hypertension,58–61 and glucocorticoids can induce expression of xanthine oxidase (a source of superoxide) in the kidney62 and increase oxidative stress in the microvasculature.63 At this point, the specific role of glucocorticoids in production of ROS is unclear, but strong evidence is emerging in support of oxidative stress as a pathologic mechanism of microvascular damage and end-organ injury in hypertension.35 The oxidative stress observed in hypertensives can be attributable to an increase in ROS production, a decrease in ROS scavenging, or a combination of both.
ROS production
Under normal conditions, the most abundant source of ROS within cells is the electron transfer processes of the mitochondria.64 Other ROS sources include the cytochrome P450 electron transferring enzyme systems,65,66 as well as xanthine oxidase and NADPH oxidase, two important superoxide-producing enzyme systems67–69 implicated in hypertension,70–76 which are expressed in almost all cells of the microcirculation.77
The SHR and BPH show global perturbations in expression of the electron transport chain of the mitochondria (Supplementary Table 1), an observation discussed later (see subheading Intermediary Metabolism) that is perhaps more relevant to intermediary metabolic function than to production of ROS. Twenty-two cytochrome P450 genes are differentially expressed in SHR and BPH: some genes are upregulated and some downregulated (Supplementary Table 2). Analysis of expression of these cytochrome P450 genes at the transcript level does not provide strong evidence for or against the role of the genes in ROS production.
The NADPH oxidase system is best known for its role in superoxide production as part of the bactericidal mechanism of neutrophils and other phagocytic cells. Recent evidence has shown that NADPH oxidase activity mediates endothelial dysfunction in hypertension70 and that the enzyme activity is elevated in the kidney of hypertensives.72 Proteins of the NADPH oxidase complex are coded for by seven genes: Cyba, Cybb, Ncf1, Ncf2, Ncf4, Rac1 (in macrophages), and Rac2 (in neutrophils). Genes of the NADPH oxidase system are not differentially expressed in either SHR or BPH, but many of the genes are not represented on the rat microarray (Table 4).
Xanthine oxidase, coded by the gene xanthine dehydrogenase (Xdh), is a source of superoxide, and elevated activity of the enzyme is implicated in hypertension.74–76 Endothelial cells of the microvasculature, but not those in larger vessels, are a major source of xanthine oxidase in the body.78 The SHR underexpressed Xdh 0.49-fold, whereas BPH overexpressed Xdh 1.48-fold. If the majority of the Xdh activity occurs within the endothelial cells of the microvasculature; homogenates of the entire adrenal glands may not be ideal for measuring xanthine oxidase activity. Nonetheless, our data suggest opposing roles of xanthine oxidase as a source of oxidative stress in SHR and BPH.
ROS scavenging
Defense against ROS includes a multitude of enzymes: catalase (Cat), which specifically attacks hydrogen peroxide (H2O2), superoxide dismutase (Sod), which targets superoxide (O2−), and the glutathione, paraoxonase, peroxiredoxin, and thioredoxin defense systems that protect against a variety of ROS. A consistent pattern of overexpression or underexpression does not exist in the ROS defense systems of SHR and BPH, as some of the genes are upregulated and others are downregulated (Table 4). The global perturbations in the ROS enzyme defense systems do, however, suggest that the adrenal glands of both SHR and BPH are subjected to enhanced oxidative stress. Previous studies suggest that hypertensive organisms may suffer from an impaired ability to scavenge ROS and thus protect against increases in oxidative stress. The SHR, for example, has reduced mRNA levels as well as reduced enzyme activity of superoxide dismutase (Sod) in many but not all tissues.37–43 Superoxide dismutase 3 (Sod3) is one of the orthologous genes commonly underexpressed in both SHR (0.60-fold) and BPH (0.68-fold), and may thus be the source of a fundamental defect of hypertensives to effectively scavenge ROS.
Export of detoxified ROS from cell
Reactive oxygen species that are detoxified by the cellular defense mechanisms are exported from the cell through a variety of transport proteins, such as the multidrug resistance proteins, also known as the ATP-binding cassettes. Neither the SHR nor the BPH show consistent patterns of differential expression of the ATP-binding cassette genes.
Although vasoconstriction (with increased arteriolar tone) does increase BP, an increase in arterial pressure per se may not be entirely sufficient to account for the vascular lesions and end-organ injury observed in hypertension.35 The observation of global perturbations (Table 4) in gene expression patterns of the oxidative stress defense systems in two independent models of human essential hypertension (ie, SHR and BPH) further suggests that oxidative stress is a common mammalian mechanism activated in hereditary hypertension, and likely contributes to vascular and end-organ injury in this setting. Investigation into such heretofore unexplained links between ROS, glucocorticoids, and microvascular damage is likely to provide novel insights into both the pathogenesis and consequences of hypertension.
Intermediary metabolism
Hypertension in humans is often observed as part of a condition known as the cardiovascular dysmetabolic syndrome, or syndrome X. In addition to increased BP, the metabolic syndrome is characterized by a variety of risk factors, such as central obesity, dyslipidemia, dysglycemia, insulin resistance, and elevated levels of the circulating inflammatory mediator C-reactive protein, which are risk factors for cardiovascular disease and type 2 diabetes. We investigated intermediary metabolism transcripts of the SHR and BPH and observed widespread derangements in metabolic gene expression patterns (Fig. 5, Supplementary Tables 1 and 3), suggesting that the SHR and BPH strains sustain rather global metabolic abnormalities in addition to increased BP. In fact, abnormalities of the intermediary metabolism of the SHR are well known21 and the strain also serves as a model of the metabolic syndrome. The metabolism of BPH has yet to be investigated in great detail.
The SHR shows derangements in expression of genes involved in fatty acid degradation and synthesis, gluconeogenesis, glycolysis, and the tricarboxylic acid (TCA) cycle (Supplementary Tables 1 and 3). Genes involved in the electron transport chain, fatty acid degradation and synthesis, glycolysis, gluconeogensis, and the TCA cycle are almost globally underexpressed in BPH (Supplementary Tables 1 and 3). In general, the entire gene network of the intermediary metabolism of the BPH is underexpressed, whereas the gene network of the SHR is globally differentially expressed, but not uniform in direction of expression. The very different perturbation patterns in intermediary metabolism of SHR and BPH suggest that, although each strain suffers from metabolic abnormalities, the mouse BPH strain has sustained a more unidirectional alteration of such functions.
Because the SHR and BPH models of human hypertension are oligogenic, involving about three to five major loci cosegregating with BP,24–26 the widespread metabolic transcript changes we observed are likely to be downstream effects resulting from a few primary genetic causes. A candidate for one of these primary genetic defects is 3-hydroxy-3-methylglutaryl-coenzyme A reductase, an ortholog overexpressed in common by the SHR and BPH (Hmgcr; Table 2). Hmgcr is the rate-limiting enzyme in cholesterol biosythesis and also the target of the statin drugs in dyslipidemic humans.27 Alterations in expression of this crucial “bottleneck” enzyme could serve as a primary genetic defect that disrupts many facets of the intermediary metabolism of SHR and BPH. In that case, then, the metabolic differential gene expression patterns in SHR and BPH might reflect the ways in which the two organisms respond to the same primary stress.
A previous study by Aitman et al21 marshaled data from transcript expression microarrays, congenic strain mapping, and radiation hybrid mapping to identify a mutation in the Cd36 gene, a fatty acid transporter, that may account for one of the defective glucose and fatty acid metabolism, hypertriglyceridemia, and hypertension quantitative trait loci (QTLs) on SHR chromosome 4. A genomic deletion event is thought to result in a chimeric Cd36 gene that encodes a dysfunctional protein undetectable in SHR adipocyte plasma membranes.21 The global gene expression derangements that we observe in the SHR metabolism might, in part, result from this primary defect in Cd36, and the defect could also partially explain the differences we observe in metabolic expression patterns between SHR and BPH. It is unknown whether the BPH genome contains a defective copy of the Cd36 gene. Another study79 showed that the Cd36 mutation is not present in the original SHR colony developed by Okamoto in Japan, indicating that the mutation did not play a role in the selection for high BP in the SHR, nor the insulin resistance observed in the original stock. The SHR strain we used18 did harbor the Cd36 mutation.
The fact that the SHR and BPH animals suffer from metabolic maladies although the two strains were selected solely on the basis of BP indicates a clear, yet unresolved link between metabolic abnormalities and increases in BP. The question is unresolved as to whether metabolic abnormalities arise from or contribute to the BP elevation in the hypertensive strain.
Conclusion
The SHR rat strain and BPH mouse strain are two independent genetic models of human essential hypertension. Because a diverse set of potential mechanisms can lead to development of hypertension in humans, it is unlikely a priori that elevation of BP in the SHR and BPH results from precisely the same mechanisms. The question arises then as to which hypertensive rodent strain is more appropriate as a model of human essential hypertension.
The SHR and BPH strains have each reached more than 50 generations of inbreeding and, in the case of the SHR, different stocks of the strain exist in institutions throughout the world. The existence of multiple colonies and such extensive inbreeding may lead to mutations that did not contribute to the hypertensive phenotype during the selection process. At least one such mutation exists in SHR. A mutation in the Cd36 gene of the SHR leads to undetectable protein levels of the transcribed gene and has been proposed as a cause of insulin resistance, defective fatty acid metabolism, and hypertriglyceridemia in the SHR,21 yet the mutation does not exist in all substrains of SHR, including the original stock developed in Japan.79 Mutations in Cd36 have not been well investigated in BPH; Cd36 mRNA is well expressed in the BPH (Supplementary Table 3).
We found 1217 genes differentially expressed in SHR (13.9% of the microarray) and 2108 genes differentially expressed in BPH (16.9% of the microarray), yet genetic analyses have estimated that only about three major loci contribute to hypertension in SHR,24,25 whereas about four or five major loci contribute to hypertension in BPH.26 Clearly, then, much if not most of the differential gene expression observed here must be secondary to or compensating for a much smaller number of primary genetic defects. It is also likely that a subset of differentially expressed genes exists that results from polymorphisms or interspecies and interstrain differences unrelated to hypertension. Our current technique cannot distinguish between differentially expressed genes resulting from hypertension and those resulting from interspecies and interstrain differences not related to hypertension. Furthermore, the microarrays we used contain probe sets for only several thousand genes each and therefore provide limited views of the rat and mouse genomes, which likely harbor up to ∼25,000 genes each (estimate from the Ensembl project, www.ensembl.org). Microarray analyses of the entire rat and mouse genomes would likely produce hundreds if not thousands of additional differentially expressed genes.
Because the SHR exhibits several phenotypes of the metabolic syndrome and the BPH may also suffer from similar metabolic abnormalities, altered gene expression in the SHR and BPH may be affected by or causative of metabolic abnormalities in addition to hypertension. The vast number of differentially expressed genes and the presence of other associated or confounding phenotypes clearly make it difficult to identify the primary genetic defects in hypertension, based solely on microarray studies. The small number of genes that cause hypertension in SHR and BPH may or may not lie in our dataset of differentially expressed genes, depending on whether the underlying mutations confer quantitative or qualitative changes in gene expression. Nonetheless, our strategy to compare differentially, commonly expressed orthologs may be key to determining shared, fundamental gene expression mechanisms across mammalian species, and, therefore, may be particularly relevant to the study of human essential hypertension.
Our dataset of differentially expressed orthologs unshared in ∼90% of cases by SHR and BPH (Table 1) shows that the same selection paradigm in two different inbred, homozygous rodent species creates patterns of gene expression that are fundamentally and quantitatively different. If such differences exist even among homogeneous rodent strains, the genetic determinants of human hypertension may be even more complex and daunting than we imagined.
We present a set of orthologous differentially expressed genes in the rat and mouse, ∼10% of which that may serve as common genetic contributors or responses to hypertension in mammalian species (Tables 2 and 3). Even this limited subset of shared orthologs spanned a diverse range of biological processes, reinforcing the picture of biological complexity in genetic models of hypertension (Fig. 2). Further investigation into this set of shared orthologous genes would be required to elucidate whether they are centrally involved in the development of hypertension in the rat SHR and mouse BPH strains.
We also present patterns of gene expression data that implicate several systems in the pathology of hypertension in the SHR and BPH strains: adrenal catecholamine synthesis appears depressed in SHR and enhanced in BPH (Fig. 3); abnormalities in glucocorticoid synthesis and progesterone catabolism provide clues to the unresolved glucocorticoid dependence of hypertension in the SHR strain (Fig. 4); global perturbations in the ROS defense systems in both SHR and BPH suggest that oxidative stress is a common mechanism for vascular and end-organ damage in hypertension (Table 4); and global differential gene expression patterns of the intermediary metabolism of SHR and BPH suggest that both strains suffer from metabolic abnormalities that may differ mechanistically (Fig. 5). Further investigation into our observations may provide novel clues to genetic mechanisms of hypertension in the SHR and BPH strains, and help pinpoint common mechanisms conserved across mammalian species.
We appreciate the assistance of the University of California San Diego Veterans Medical Research Foundation and Center for AIDS Research Genomics Core for performing the real-time PCR experiments, and the University of California San Diego Veterans Medical Research Foundation Microarray Center for performing the GeneChip experiments. The metabolic pathway diagrams were adapted from GenMAPP 1.0 software. Dr. Gunther Schlager developed the mouse BPH and BPL strains, while Dr. Morton Printz provided the rat SHR and WKY tissues.
Appendix
Supplementary data
Supplementary data associated with this article can be found, in the online version, at doi:10.1016/j.amjhyper.2004.11.037.
References
1.
2.
3.
4.
5.
6.
7.
8.
9.
10.
11.
12.
13.
14.
15.
16.
17.
18.
19.
20.
21.
22.
23.
24.
25.
26.
27.
28.
29.
30.
31.
32.
33.
34.
35.
36.
37.
38.
39.
40.
41.
42.
43.
44.
45.
46.
47.
48.
49.
50.
51.
52.
53.
54.
55.
56.
57.
58.
59.
60.
61.
62.
63.
64.
65.
66.
67.
68.
69.
70.
71.
72.
73.
74.
75.
76.
77.
78.
79.
Author notes
This study was supported by the Department of Veterans Affairs and National Institutes of Health.
