
Abstract
Apoptosis is a mode of programmed cell death that is widely used to eliminate cells during development, tissue homeostasis, infection or in response to injury. Alterations to the plasma membranes of apoptotic cells trigger recognition and engulfment of such cells by phagocytes. Measurement of plasma membrane phosphatidylserine externalization, using fluorescently labeled annexin V, is widely used for the detection of apoptotic cells. Here we describe protocols for bacterial expression, purification and FITC labeling of recombinant annexin V. By following the method outlined in this protocol, it is possible to produce milligram amounts of recombinant annexin V within 3 d. We also describe a method for the assessment of annexin V binding to cell populations by flow cytometry or fluorescence microscopy.
Introduction
Multicellular organisms balance the rates of ongoing cell division and cell death to maintain homeostasis. Homeostatic cell death typically occurs in a precisely coordinated manner, known as apoptosis. Apoptosis is the preferred mode of death in multicellular organisms, as this mode of cell death permits removal of dying cells without releasing cell contents, thereby minimizing the impact on surrounding cells1. By comparison, necrosis is an uncoordinated cell death process during which cells swell and rupture, releasing their contents onto surrounding cells and provoking activation of the immune system1.
Initial studies by Kerr et al.2 in the 1970s identified apoptotic cells based on their distinctive morphology. Cells undergoing apoptosis show characteristic features including cell rounding and retraction, nuclear condensation, nuclear fragmentation and plasma membrane blebbing, while maintaining plasma membrane integrity until late in the process. These characteristic features of apoptotic cells are a consequence of the activation of a family of proteases called caspases1. Upon activation during apoptosis, caspases target hundreds of protein substrates for proteolysis, a specific subset of which results in the characteristic apoptotic phenotype1,3. Ultimately, apoptotic cell death results in the controlled dismantling of the cell and formation of apoptotic bodies. Crucially, phagocytes can discriminate between healthy and apoptotic cells, rapidly engulfing the latter to ensure their swift removal and precluding the possibility of inadvertent leakage of cellular contents4.
Phosphatidylserine exposure
The mechanism by which phagocytes selectively recognize apoptotic cells is not fully understood. However, plasma membrane changes are fundamental to this process. Several studies have shown that phosphatidylserine (PS), a phospholipid normally retained in the inner leaflet of the plasma membrane, is important for the recognition of apoptotic cells by phagocytes4,5,6. Typically, PS is actively sequestered in the inner leaflet of the plasma membrane through the action of an aminophospholipid translocase and a calcium-dependent scramblase7. Upon receipt of pro-apoptotic signals, PS is transported from the inner to the outer leaflet of the plasma membrane, in which it signals as an early marker of apoptosis4,5,6. The exact mechanism of PS translocation during apoptosis is unclear; however, the ATP-binding cassette transporter, ABC1, has been implicated in mammals8, and the aminophospholipid translocase TAT-1 has been implicated as a PS-transporting molecule during programmed cell death in Caenorhabditis elegans9,10.
Annexin V binding assay
Annexin V, a member of the phosholipid-binding annexin family, binds efficiently to PS and, to a lesser extent, phosphatidylcholine and sphingomyelin in a reversible and Ca2+-dependent manner11,12. As annexin V can specifically bind to PS, this protein represents a selective probe for identifying and quantifying apoptotic cells. Annexin V was first reported as a method to detect apoptotic cells by Koopman et al. in 1994 (ref. 5). In this study, B cells undergoing serum starvation-induced apoptosis were found to exhibit a dramatic increase in the binding of annexin V, strongly suggesting that PS externalization occurred during apoptosis5. Subsequent studies demonstrated that the annexin V staining method could be used to detect apoptotic cells, in numerous settings, irrespective of the stimulus used to trigger apoptosis or the lineage of the cells under study6,7. Furthermore, it was also demonstrated that PS exposure preceded other features of apoptosis, such as membrane permeabilization and nuclear condensation, confirming that annexin V-mediated detection of PS is a viable technique for the early detection of apoptotic cells6. Importantly, this study and subsequent studies also established a role for caspases in PS externalization. Inhibition of caspase activation, through Bcl-2 overexpression, or addition of a poly-caspase inhibitor such as z-VAD-fmk reduced PS exposure and consequently annexin V binding6,13. However, the identity of the caspase substrates associated with the triggering of PS exposure during apoptosis remains unknown. Although the complexities of PS externalization and recognition are still being teased out, PS exposure is widely used as a signature of apoptotic cell death5,6,7,13.
On the basis of these initial studies, the annexin V binding assay has become an established technique for the identification and quantification of apoptotic cells. Currently, a multitude of techniques are available for the identification of apoptotic cells including, among others, assessment based on morphological criteria, analysis of DNA fragmentation through the TUNEL (terminal deoxynucleotidyltransferase-mediated dUTP nick end labeling) method and determination of caspase activation either by western blot or by fluorimetry-based assays14. Each of these assays is time-consuming, and in some cases, such as morphological assessment of cells for features of apoptosis, they are subjective and prone to operator bias. The annexin V binding assay has numerous advantages over these techniques. It is a rapid, precise, unbiased and reliable method that requires minimal sample preparation. Annexin V binding to cell populations can be evaluated by microscopy or flow cytometry analysis. Assessment of annexin V binding by microscopy also permits the identification of other characteristics of apoptotic cells, such as nuclear fragmentation and plasma membrane blebbing. Although flow cytometry analysis does not allow such direct assessment of cell morphology, it does afford a rapid and highly quantitative method for assessing apoptosis and—in conjunction with vital dyes such as propidium iodide (PI)—can rapidly distinguish between apoptotic and necrotic cells6.
Annexin V has been widely used for the detection of apoptotic cells in vivo as well as in vitro15,16. Imaging of cell death in vivo, using annexin V labeled with radiotracer or positron emission tomography (PET) probes, has shown promising results and could become a useful tool for the assessment of cell death in solid tumors after radiotherapy or chemotherapy17,18,19. Annexin V has also been used to detect membrane PS externalization in other organisms, such as intracellular parasites20. Although PS externalization appears to be a highly conserved feature of apoptosis, it has been reported that some cell types do not appear to undergo increased binding of annexin V during apoptosis, for reasons that remain unclear21. However, this is very much the exception rather than the rule, and the annexin V binding assay has been used to detect apoptosis in various cell types. A selection of cell types where apoptosis can be readily detected using the annexin V binding assay is listed in Table 1.
The annexin V binding assay is a powerful tool for the quantification of apoptosis and for distinguishing between apoptotic and necrotic cells and is used by many laboratories. However, purchase of significant quantities of fluorescein isothiocyanate (FITC)-conjugated annexin V can be expensive (100 μg of annexin V–FITC conjugate can cost €500 from commercial suppliers). Furthermore, in vivo imaging studies using annexin V require very large amounts of material, which makes the cost of sourcing this protein from commercial suppliers prohibitive in these circumstances. For these reasons, we describe a method that can be used to express and purify milligram amounts of annexin V within 3 d.
Overview of the procedure
A flow chart depicting the steps involved in the expression and purification of annexin V is shown in Figure 1. Recombinant annexin V can be expressed in bacteria and purified within 3 d. The first two stages of the protocol involve minimal work but do require overnight incubations at 37 °C. Purification of annexin V (day 3) represents the most intensive portion of the protocol and takes ∼8 h to complete. Purified annexin V can be stored at this point for several months. Conjugation of annexin V to FITC takes 3 d in total with overnight dialysis required. To determine the optimal concentration of annexin V–FITC that should be used to stain apoptotic cells, annexin V should be titrated on a cell population containing a mixture of viable and apoptotic cells. Titration of FITC-conjugated annexin V requires flow cytometry analysis of the stained cell population. The time required to induce apoptosis is dependent on the cell type and stimulus chosen. To stain cells with annexin V, cells require a 5-min incubation with annexin V–FITC in a buffer containing 1.8 mM calcium ions. Flow cytometry analysis takes ∼10 min, depending on the number of samples, with a further 10 min required for analysis.

Day 0, transformation of pProExHtb.annexin V plasmid; day 1, inoculation of an overnight 3-ml starter culture; day 2, dilution of overnight starter cultures into 250 ml of LB and induction of annexin V expression by the addition of IPTG; day 3, capture of His-tagged annexin V on Ni2+ NTA beads, elution of protein and SDS-PAGE analysis to estimate the annexin V yield and to determine the protein purity.
Experimental design
pProEx.Htb.annexin V plasmid. Human annexin V cDNA (accession no. NM_001154) was amplified from a Jurkat cDNA library through PCR and cloned into the bacterial expression vector pProEx.Htb using the restriction sites BamHI and EcoRI. The pProEx.Htb vector contains an ampicillin resistance cassette and encodes an N-terminal poly-histidine tag to facilitate purification of proteins expressed with this epitope tag. The ampicillin resistance gene enables selection and growth of colonies expressing the pProEx.Htb.annexin V plasmid. The Trc promoter within the pProEx.Htb.annexin V plasmid is under the control of the lacI repressor and can be activated by the addition of isopropyl-β-D-thiogalactopyranoside (IPTG) (a lactose analog) to the bacterial growth medium, thereby inducing expression of recombinant annexin V protein with an N-terminal poly-histidine tag. Poly-histidine-tagged proteins bind with high affinity to nickel or cobalt ions. Ni–nitrilotriacetic acid (NTA) agarose can then be used to capture and purify the recombinant annexin V from bacterial lysates.
Transformation of competent DH5α Eschericha coli bacteria with the pProEx.Htb.annexin V plasmid. When transforming competent DH5α E. coli bacteria with the pProEx.Htb.annexin V plasmid, it is important to include a control transformation where competent DH5α bacteria are mock-transformed with sterile water. The next morning, many individual bacterial colonies should be present on the pProEx.Htb.annexin V-transformed plate (Fig. 1). The control plate should be completely devoid of any bacterial growth. The presence of colonies on the control plate suggests nonspecific transformation (e.g., due to contamination with some other plasmid) in which colonies that do not contain the plasmid of interest are present. For this to occur, the pProEx.Htb.annexin V-transformed plate should not be used and the transformation should be repeated using fresh bacteria and reagents.
Analysis of recombinant annexin V production and purification. To monitor the production and purification of recombinant annexin V in this protocol, we highlight specific steps at which samples should be collected for subsequent SDS-PAGE gel analysis. Samples taken before and after the addition of IPTG to bacterial cultures can be used to confirm successful expression of annexin V. In Figure 2, annexin V protein is not evident in lane 1 (T0), but after a 3-h incubation of pProEx.Htb.annexin V-transformed bacteria in the presence of IPTG, annexin V protein is now present, as shown in lane 2 (T3). The expression of annexin V protein confirms a successful induction.

Bacterial lysate samples taken before (T0) (lane 1) and after ITPG treatment (T3) (lane 2) were analyzed by SDS-PAGE. Clear induction of annexin V (∼34 kDa) is visible after IPTG treatment (lane 2). Equivalent volumes of bacterial lysate after sonication (lysate) (lane 3), removal of insoluble material (pellet) (lane 5) and the clarified bacterial (supernatant) (lane 4) were also run on the gel. A 5-μl sample of Ni-NTA beads after protein capture (Ni-NTA pre-elution) (lane 6) was run alongside 5 μl of elution 1 (lane 7), elution 2 (lane 8), elution 3 (lane 9) and beads post elution (Ni-NTA post-elution) (lane 10). Known amounts of BSA were included to allow the estimation of annexin V concentration (lanes 11–13). The numbers present at the bottom of the gel correspond to the sample preparation outlined in Table 2. Molecular weight markers are shown (kDa).
During the purification phase of the protocol, samples are collected to monitor the purification process and to identify steps in the procedure at which problems may have arisen. The bacterial lysate sample (lane 3) confirms the presence of annexin V in the lysate following sonication to rupture bacterial cell walls and release the proteins inside. It is important to take bacterial supernatant (lane 4) and pellet samples (lane 5) to verify that the protein of interest is present in the soluble fraction of the bacterial lysate and is not retained exclusively in the insoluble pellet fraction after centrifugation. Inclusion of a pre-elution Ni–NTA resin sample (lane 6) allows us to confirm that the recombinant annexin V has been successfully captured on the Ni–NTA resin. The E1, E2 and E3 eluate samples (lanes 7–9) verify that the imidazole present in the elution buffer has displaced the poly-histidine-tagged annexin V from the Ni–NTA resin. Three elutions are carried out in total. Normally this is sufficient to liberate all bound annexin V from the Ni–NTA agarose. The post-elution Ni–NTA sample (lane 10) is used to confirm that the majority of recombinant annexin V protein has been eluted from the Ni–NTA resin.
Determining the yield of annexin V. The yield of annexin V in the eluate fractions can be roughly estimated by directly comparing the intensity of the protein bands in the E1, E2 and E3 samples on an SDS-PAGE gel, with known amounts of bovine serum albumin (BSA) ran on the same gel. As described in Table 2, 25 μl of samples 1–10 are loaded onto the gel. For the BSA standards, 100 μl of 2 × SDS-PAGE sample buffer is added to 100 μl of 1 mg ml−1 BSA, giving 200 μl of 0.5 mg ml−1 BSA in 1 × SDS-PAGE sample buffer. To load 4 μg of BSA standard, 8 μl of 0.5 mg ml−1 BSA in 1 × SDS-PAGE sample buffer is loaded. It is important to determine the yield of annexin V so that the protein concentration can be adjusted to 1 mg ml−1 for subsequent conjugation to fluorochromes.
Conjugation of recombinant annexin V with a fluorochrome. In this protocol, we describe the chemical coupling of annexin V to the fluorochrome FITC, although other fluorochromes such as TRITC can be substituted for FITC depending on the particular need. This is especially useful if the use of FITC will interfere with the analysis of another fluorescent marker (e.g., green fluorescent protein). After conjugation of the fluorochrome to annexin V, it is important to estimate the yield of conjugated protein. This is achieved by running varying amounts of conjugated annexin V on an SDS-PAGE gel, alongside known amounts of BSA. The yield of conjugated protein can be estimated by directly comparing the annexin V–FITC bands to the BSA standards.
Considerations for a successful binding assay. For the annexin V binding assay to work successfully, several important factors need to be considered.
Cell treatments. Cells to be stained with annexin V should not be fixed or permeabilized with agents such as paraformaldehyde or methanol, as this may generate false positives. Indeed, the same consideration applies when harvesting adherent cells, as aggressive trypsinization or manipulation of cells (e.g., scraping to detach cells from the plate) may damage plasma membranes, again leading to false positives.
Calcium concentration. For annexin V to bind PS efficiently, calcium is required at a concentration of 1–3 mM. Annexin V binding buffer should therefore contain calcium. For most cell types, a concentration of 1.8 mM calcium is ideal, as higher concentrations can result in nonspecific binding of annexin V to other phospholipids.
Buffer pH. The pH of the annexin V binding buffer should be above pH 5, but ideally pH 7.2; a pH below 5 leads to the loss of the PS binding properties of annexin V.
Titration of annexin V–FITC. Each batch of annexin V–FITC must be carefully titrated to determine the optimum concentration for use in annexin V–FITC binding assays. Cells should be treated with a known apoptotic stimulus and binding assays carried out using varying concentrations of annexin V–FITC (0.1, 0.5, 1 and 2 μg ml−1). This step is particularly important, as too much or too little annexin V–FITC may give sub-optimal separation between healthy and apoptotic cell populations in the binding assays.
PI staining. When carrying out annexin V binding assays, we routinely incorporate a vital dye, such as PI, to distinguish between apoptotic and necrotic cells. PI can enter necrotic cells with disrupted plasma membrane, but is excluded from apoptotic cells where the plasma membrane remains intact. It is added to the cells, from a 10 × stock (100 μg ml−1) of dye, just before acquiring samples on the flow cytometer. It is important to add the PI just before sample acquisition, as prolonged incubation with PI can lead to false-positive results.
Considerations for flow cytometry. Negative control. Untreated cells must be included to enable the setup of the flow cytometer22. Forward and side scatter settings are set on control cells, as are the FL1 and FL2 channel settings. Refer to a flow cytometer manual for specific instructions on set up.
Positive control. For FITC–annexin V binding assays, it is important to incorporate a positive control sample. This is usually a sample of the particular cell type treated with a known apoptotic stimulus (e.g., Jurkat cells treated with 250 ng ml−1 of anti-Fas, 10 μM of actinomycin D (Act D) or 2.5 μM of staurosporine6).
Compensation. When using multicolor flow cytometry, e.g., FITC–annexin V and PI staining, it is important to compensate for spectral overlap between the different fluorochromes used22. Please refer to flow cytometer manual for specific instructions regarding compensation settings.
Materials
Reagents
-
pProEx.Htb.annexin V (this plasmid is freely available upon request to investigators working in non-profit organizations) (see REAGENT SETUP).
-
Competent DH5α Eschericha coli bacteria
-
Acrylamide (Sigma, cat. no. A8887)
Caution
Neurotoxic; wear gloves when handling and weigh out in a fume hood.
-
Ammonium persulphate (Sigma, cat. no. A3678)
-
Bis-acrylamide (Fluka, cat. no. 66669)
Caution
Neurotoxic; wear gloves when handling and weigh out in a fume hood.
-
Bacto-tryptone (Becton Dickinson, cat. no. 211705)
-
Bacto-yeast extract (Becton Dickinson, cat. no. 212750)
-
Bacto-agar (Becton Dickinson, cat. no. 214010)
-
Sodium chloride (Sigma, cat. no. 57653)
-
Trizma Base (Sigma, cat. no. T1503)
-
2-Mercaptoethanol (Sigma, cat. no. M7154)
Caution
Toxic; avoid exposure and use in a fume hood.
-
Potassium chloride (Sigma, cat. no. P9333)
-
Glycerol (Sigma, cat. no. G6279)
-
SDS (Sigma, cat. no. L5750)
-
Glycine (Sigma, cat. no. G8898)
-
Bromophenol blue (Sigma, cat. no. B8026)
-
Methanol
Caution
Flammable should be handled away from any sources of ignition.
-
PI (Sigma, cat. no. P4170) (see REAGENT SETUP)
-
Acetic acid (Fluka, cat. no. 45731)
Caution
Corrosive; wear gloves and eye protection when handling.
-
Calcium chloride (Sigma, cat. no. C3306)
-
HEPES (Sigma, cat. no. H7523)
-
Magnesium chloride (Sigma, cat. no. M8266)
-
Sodium phosphate dibasic (Sigma, cat. no. S7907)
-
Potassium phosphate monobasic (Sigma, cat. no. P5655)
-
TEMED (Sigma, cat. no. T9281)
-
Brilliant blue (Sigma, cat. no. 57653)
-
Protein marker (NEB, cat. no. P77085)
-
30% (wt/vol) Acrylamide solution (see REAGENT SETUP)
Caution
Neurotoxic; wear gloves when handling.
-
LB medium (see REAGENT SETUP)
-
LB agar plates (see REAGENT SETUP)
-
Ampicillin (Sigma, cat. no. 9518) (see REAGENT SETUP)
-
IPTG (Melford, cat. no. MB1008) (see REAGENT SETUP)
-
Tris mercaptoethanol (Tm) lysis buffer (see REAGENT SETUP)
-
Imidazole (Sigma, cat. no. I5573)
-
Imidazole wash buffer (see REAGENT SETUP)
-
Imidazole elution buffer (see REAGENT SETUP)
-
PMSF (Sigma, cat. no. 7626)
-
Leupeptin (Sigma, cat. no. 62070)
-
Aprotinin (Sigma, cat. no. 10820)
-
BSA (Sigma, cat. no. A2153)
-
12% (vol/vol) SDS-PAGE gel (see REAGENT SETUP)
-
SDS-PAGE gel running buffer (see REAGENT SETUP)
-
2 × SDS PAGE sample buffer (see REAGENT SETUP)
-
Sodium carbonate (see REAGENT SETUP)
-
Phosphate buffered saline (PBS) pH 7.2 (see REAGENT SETUP)
-
Coomassie stain (see REAGENT SETUP)
-
Destain solution (see REAGENT SETUP)
-
Fluorescein isothiocyanate (Sigma, cat. no. F1010) (see REAGENT SETUP)
-
Ni–NTA agarose (Qiagen, cat. no. 3020)
-
Annexin V binding buffer (see REAGENT SETUP)
-
DMSO (Sigma, cat. no. D-8779)
Equipment
-
Sorvall centrifuge or equivalent
-
Branson sonifier/cell disruptor or similar
-
Rotator
-
0.2 μm Filters
-
Syringe (1 ml)
-
Slide-E-Lyzer 3.5 kDa cutoff (Pierce, cat no. 66330) or similar dialysis membrane
-
Stirrer plate
-
Microcentrifuge
-
SDS-PAGE system
-
Flow cytometer
Reagent Setup
pProEx.Htb.annexin V
-
Human annexin V cDNA (accession no. NM_001154) was amplified from a Jurkat cDNA library through PCR and cloned into the bacterial expression vector pProEx.Htb vector using the restriction sites BamHI and EcoRI. The pProEx.Htb vector encodes ampicillin resistance and incorporates a N-terminal poly-histidine tag.
LB medium
-
Add 5 g of bacto-tryptone, 2.5 g of bacto-yeast extract and 5 g of sodium chloride to 500 ml of H2O and sterilize by autoclaving. If required, add ampicillin to a final concentration of 100 μg ml−1 following sterilization. LB medium without ampicillin can be stored at room temperature (∼22 °C) for up 1 year, providing no bacterial growth occurs.
Critical
Allow the LB medium to cool before the addition of ampicillin, as ampicillin degrades at temperatures above 56 °C.
LB Agar
-
Add 5 g of bacto-tryptone, 2.5 g of yeast extract, 5 g of sodium chloride and 7.5 g of bacto-agar to 500 ml of H2O and sterilize by autoclaving. Allow to cool to 56 °C or until the bottle can be comfortably held in the hand. Then, add ampicillin to a final concentration of 100 μg ml−1. Mix by gentle swirling and pour ∼20 ml into each sterile Petri dish (100 mm diameter). Allow the plates to set on the bench and then store at 4 °C for up to 1 month.
Critical
Allow the LB agar to cool to below 56 °C before the addition of ampicillin, as ampicillin degrades at temperatures above 56 °C.
Ampicillin
-
Prepare a stock solution of 100 mg ml−1 in H2O and filter-sterilize using a 0.2-μm filter. Store at −20 °C in 1 ml aliquots for up to 1 year.
IPTG
-
Prepare a stock solution of 500 mg ml−1 in H2O and filter-sterilize using a 0.2-μm filter. Store at −20 °C in 1 ml aliquots for up to 1 year.
Tm lysis buffer
-
50 mM Tris-HCl (pH 8.5). Immediately before use, add 10 of mM 2-mercaptoethanol, 1 mM of PMSF, 2 μg ml−1 of aprotinin, 10 μg ml−1 of leupeptin. When the protease inhibitors have been added, the Tm lysis buffer should be stored on ice. Discard Tm lysis buffer after use.
Imidazole wash buffer
-
20 mM Tris-HCl (pH 8.5), 100 mM of KCl, 10% glycerol (vol/vol). Add 10 mM of 2-mercaptoethanol and 20 mM of imidazole immediately before use. Discard buffer after use.
Imidazole elution buffer
-
Add 100 mM of imidazole, 1 mM of PMSF, 2 μg ml−1 of aprotinin, 10 μg ml−1 of leupeptin to PBS immediately before use. Discard buffer after use.
2 × SDS-PAGE sample buffer
-
100 mM of Tris-HCl, pH 6.8, 4% SDS (wt/vol), 0.2% bromophenol blue (wt/vol), 20% glycerol (vol/vol), 715 mM 2-mercaptoethanol. It (minus 2-mercaptoethanol) can be stored at room temperature for up to 1 year. Before use, add 715 mM of 2-mercaptoethanol. Once 2-mercaptoethanol has been added, the buffer should be stored for no longer than 1 week at room temperature.
5 × SDS-PAGE running buffer
-
Add 15.14 g of Tris, 93.8 g of glycine and 5 g of SDS to 1 liter of H2O. Adjust the pH to 8.3 and store at room temperature for up to 1 year.
30% (wt/vol) Acrylamide (29:1) solution
-
Dissolve 29 g of acrylamide and 1 g of bis-acrylamide in H2O to a final volume of 100 ml. The solution can be stored at 4 °C for up to 1 year.
Caution
Acrylamide and bis-acrylamide are neurotoxic, wear gloves when handling and weigh in a fume hood.
12% SDS-PAGE separating gel
-
Table 4 Table 3
Coomassie stain
-
225 ml of methanol, 225 ml of H2O, 50 ml of acetic acid and 1 g of Coomassie brilliant blue. It can be stored for up to 1 year at room temperature.
Caution
Acetic acid is corrosive and should be handled with care. Wear gloves when handling.
Destain solution
-
225 ml of methanol, 225 ml of H2O, 50 ml of acetic acid. It can be stored at room temperature for up to 1 year.
Sodium carbonate
-
100 mM pH 9. It can be stored at room temperature for up to 1 year.
PBS, pH 7.2
-
Dissolve 8 g of NaCl, 0.2 g of KCl, 1.44 g of Na2HPO4, 0.24 g of KH2PO4 in 1 l of H2O, adjust to pH 7.2. It can be stored at room temperature for up to 1 year.
FITC
-
1 mg ml−1 stock in DMSO. Prepare 100 μl aliquots and store protected from light at −20 °C for up to 1 year.
Critical
It is light-sensitive and must be stored protected from light.
Annexin V binding buffer
-
10 mM of HEPES-NaOH (pH 7.4), 150 mM of NaCl, 5 mM of KCl, 1 mM of MgCl2, 1.8 mM of CaCl2. Store at 4 °C for up to 1 year.
PI
-
Prepare 1 mg ml−1 stock in PBS. Store at 4 °C protected from light for up to 1 year.
Equipment setup
Equilibrated Ni–NTA
-
Gently re-suspend 250 μl of Ni–NTA agarose (50 μl of Ni–NTA agarose per ml of bacterial lysate) and place in a microcentrifuge tube, centrifuge for 1 min at 1,000g, room temperature. Remove the supernatant and equilibrate the Ni-NTA agarose by adding 0.5 × volume (125 μl) of imidazole wash buffer (REAGENT SETUP). Resuspend the matrix and centrifuge again for 1 min at 1,000g, room temperature. Remove the supernatant and resuspend the Ni-NTA with 0.5 × volume (125 μl) of imidazole wash buffer. In total, there is 250 μl of equilibrated Ni-NTA.
Critical
Equilibrate Ni-NTA immediately before use; this is best timed during Step 20.
Procedure
Day 0: transformation of chemically competent DH5α strain E. coli bacteria with annexin V expression plasmid
Timing ∼2 + overnight
-
1
Thaw 100 μl of competent DH5α E. coli bacteria on ice.
-
2
Dispense 50 μl of competent DH5α E. coli bacteria into a 13-ml pre-chilled round-bottomed tube.
-
3
Add 2 μl (∼1 μg) of pProEx.Htb.annexin V bacterial expression plasmid. As a control, add 2 μl of sterile H2O to 50 μl of competent DH5α bacteria.
-
4
Incubate on ice for 30 min.
-
5
Heat shock for 40 s at 42 °C to allow the uptake of the plasmid.
-
6
Place on ice for 2 min.
-
7
Add 450 μl of liquid LB medium to each transformation mixture and incubate for 1 h at 37 °C in a shaking incubator (220 r.p.m.).
-
8
Spread 50 μl aliquots of the transformed bacteria from Step 7 onto agar plates containing 100 μg ml−1 ampicillin (REAGENT SETUP). Incubate the plates overnight at 37 °C to allow bacterial colonies to grow.
-
9
The next morning, remove the plates from the incubator and store at 4 °C.
Pause point
Plates can be stored at 4 °C for 1 month.
Day 1: prepare overnight seed culture
Timing ∼5 min + overnight
-
10
Inoculate 3 ml of liquid LB medium containing 100 μg ml−1 ampicillin, with a single bacterial colony picked from the pProEx.Htb.annexin V-transformed plate (Step 9). Grow the colony overnight in a 37 °C shaker incubator shaking at 280 r.p.m. (Fig. 1).
Day 2: expression of annexin V
Timing ∼6 h
-
11
Dilute 2.5 ml of the overnight culture 1:100 in 250 ml of liquid LB culture medium supplemented with 100 μg ml−1 of ampicillin to a starting OD600 of ∼0.1.
-
12
Grow the diluted culture at 37 °C with shaking (280 r.p.m.) to mid-log phase (OD600 of 0.4–0.6). This step takes ∼2 h.
-
13
Remove a 1-ml sample of the culture, place in a microcentrifuge tube and label as the 0 h sample (T0). Centrifuge the T0 sample for 1 min at 20,000g, room temperature, remove the supernatant and freeze the bacterial pellet at −20 °C for later analysis at Step 34 (Fig. 2).
Pause point
The bacterial pellets can be stored at −20 °C for several months.
-
14
To the remaining culture, add IPTG to a final concentration of 500 μM and continue incubation for an additional 3 h shaking at 280 r.p.m., 37 °C.
-
15
After incubation with IPTG, remove a 1-ml sample of the culture and centrifuge for 1 min at 20,000g, room temperature, remove the supernatant and freeze the bacterial pellet at −20 °C for later analysis at Step 34 (Fig. 2). Label this as the 3 h induction sample (T3).
-
16
Pellet the remaining culture for 10 min at 7,500g, 4 °C. Discard the supernatant and either continue with the protocol or alternatively freeze the bacterial pellet at −20 °C. Better lysis of the bacterial cell pellet is usually achieved after freezing for a minimum of 1 h, although this step can be omitted if time is limited.
Pause point
Bacterial cell pellets can be stored at −20 °C overnight, or for several months at this point.
Day 3: purification of annexin V
Timing ∼8 h
-
17
Carefully resuspend the bacterial cell pellets from Step 16 in 5 ml of Tm lysis buffer (REAGENT SETUP) (2% of the initial culture volume). Transfer the bacterial cell suspension to a fresh tube and place on ice.
Critical Step
Proteins can degrade during the isolation procedure because of activation of bacterial proteases; therefore, it is important to carry out all subsequent steps at 4 °C, in the presence of protease inhibitors.
-
18
Using a Branson sonicator, or similar, disrupt the bacteria on ice with 5 × 30 s pulses of 5 W (with 40 s pauses between each pulse to minimize buildup of heat within the sample that could denature the protein of interest). After sonication, the lysate should be less viscous and lighter in color. Remove a 20-μl sample of the bacterial lysate after the sonication (lysate sample) and freeze at −20 °C for later analysis (Step 34) (Fig. 2).
Critical Step
It is important not to over-sonicate or allow excessive frothing of the sample, as this can result in protein denaturation because of the generation of excessive heat.
-
19
Divide the bacterial lysate into 5 × 1 ml microcentrifuge tubes and spin for 15 min at 15,000g, 4 °C to pellet insoluble material and bacteria that have failed to lyse.
-
20
During the above 15 min spin, equilibrate the Ni-NTA agarose (REAGENT SETUP), which will be used to capture the polyhistidine-tagged annexin V.
-
21
Remove the clear bacterial supernatant from each microcentrifuge tube (from Step 20 above) and combine in a clean tube (∼5 ml of supernatant in total). Take a 20-μl sample of the supernatant (supernatant sample) and freeze at −20 °C for later analysis (Step 34) (Fig. 2). Resuspend one of the bacterial pellets in 1 ml of H2O, take a 20-μl sample (pellet sample) and freeze at −20 °C for later analysis (Step 34). The remaining bacteria pellets should be discarded.
-
22
Add 250 μl of equilibrated Ni-NTA (REAGENT SETUP) to the combined supernatants, seal the tube and incubate under constant rotation for 3 h at 4 °C to allow the capture of the polyhistidine-tagged annexin V.
Critical Step
Protein capture should always be carried out at 4 °C to minimize protein degradation.
-
23
After proteins have been captured on the Ni-NTA agarose, gently centrifuge the agarose (for 1 min at 1,000g, 4 °C) and remove the supernatant (∼5 ml), which should now be depleted of annexin V.
-
24
Add 1 ml of imidazole wash buffer to the Ni-NTA agarose and incubate for 5 min under constant rotation at 4 °C to wash off nonspecifically bound bacterial proteins. Centrifuge the Ni-NTA agarose as in Step 23 and discard the supernatant.
-
25
Repeat Step 24 twice for a total of three washes.
Critical Step
Washing of the Ni-NTA matrix (Steps 24–25) after protein capture is important to ensure high purity of recombinant annexin V, free from contaminating bacterial proteins.
-
26
Following the final wash and after removal of the supernatant, resuspend the Ni-NTA agarose in 125 μl of imidazole wash buffer. Take a 5-μl sample of the Ni-NTA (pre-elution beads sample) and freeze at −20 °C for later analysis (Step 34) (Fig. 2).
-
27
Centrifuge the remaining Ni-NTA (for 1 min at 1,000g, 4 °C), remove the supernatant and resuspend in 250 μl of ice-cold imidazole elution buffer.
-
28
Elute the captured annexin V under constant rotation for 30 min at 4 °C.
-
29
Centrifuge the Ni-NTA (for 1 min at 1,000g, 4 °C) and remove the supernatant (elution 1), which should contain purified recombinant annexin V, and store at 4 °C.
Critical Step
Do not discard the supernatants from this step as these contain the purified annexin V.
-
30
Add 250 μl of ice-cold imidazole elution buffer to the beads and repeat Steps 28 and 29. Add a further 250 μl of ice-cold imidazole elution buffer and repeat Steps 28 and 29. Keep the elution fractions (elutions 2 and 3) at 4 °C. In total, three elutions should be carried out. Normally this is sufficient to liberate all bound annexin V.
Pause point
The eluted protein can be stored at 4 °C for up to 1 year.
-
31
Resuspend the post-elution beads in 125 μl of imidazole wash buffer. Take a 5-μl sample (post-elution beads) and freeze at −20 °C for later analysis (Step 34).
-
32
Thaw the collected samples (Steps 13, 15, 18, 21, 26, 29–31) on ice and prepare samples for gel electrophoresis by the addition of SDS-PAGE loading buffer (as outlined in Table 2). Also prepare the BSA standards as described in Table 2.
-
33
Boil the samples at 100 °C for 7 min, place on ice for 2 min and spin for 1 min at 20,000g, room temperature.
-
34
Load the samples onto a 12% SDS-PAGE gel (REAGENT SETUP) as outlined in Table 2. Run the gel for ∼3 h at 75 V or until the dye front reaches the bottom of the gel.
-
35
Stain the gel by addition of 100 ml of Coomassie blue stain (REAGENT SETUP). Incubate overnight at room temperature with gentle shaking (50 r.p.m.).
Day 4: quantification of annexin V yield
Timing ∼5 h
-
36
Remove the Coomassie stain, briefly rinse the gel with 100 ml of dH2O, and add 100 ml of destain solution (REAGENT SETUP).
-
37
Incubate the gel with gentle shaking (50 r.p.m.) at room temperature with several changes of destain solution until the protein becomes visible (at least 4 h destaining is required to visualize protein bands).
-
38
Quantify the amount of annexin V in each elution fraction, either by comparison with the BSA standards on the gel or by using the Bradford protein assay23.
-
39
Combine all elution fractions containing annexin V solution and adjust the protein concentration to ∼1 mg ml−1 with PBS buffer (REAGENT SETUP).
Pause point
Purified annexin V can be stored for several months at 4 °C, if desired, before FITC conjugation.
Day 5: FITC conjugation of annexin V
Timing ∼3 d
-
40
Using a 1-ml syringe, inject annexin V solution (∼1 mg ml−1) into a 3.5-kDa molecular weight cutoff Slide-E-Lyzer dialysis cassette (or similar).
-
41
Dialyze the annexin V solution overnight at 4 °C with gentle agitation against 1 liter of 100 mM sodium carbonate (pH 9) to remove any residual imidazole and provide optimum buffer conditions for FITC conjugation.
-
42
Using a 1-ml syringe, carefully remove all of the annexin V solution from the dialysis cassette and place in a fresh microcentrifuge tube.
-
43
Wrap the tube in aluminum foil (FITC is light-sensitive) and add 50 μl of FITC solution (1 mg ml−1) in 5 μl increments. Flick the tube gently between each 5 μl addition.
Critical Step
FITC is light-sensitive; therefore, the tube must be wrapped in aluminum foil.
-
44
Incubate under constant rotation at 4 °C for 4 h.
-
45
Dialyze the annexin V–FITC solution using a 3.5-kDa molecular weight cutoff Slide-E-Lyzer dialysis cassette (or similar) against 1 liter of PBS (pH 7.2) overnight at 4 °C with gentle agitation (40 r.p.m.) to remove excess unconjugated FITC.
-
46
Run 0.5, 1 and 2 μg of the FITC–annexin V (assuming it is at a concentration of ∼1 mg ml−1) and 0.5, 1 and 2 μg of BSA on a 12% SDS-PAGE gel. Visualize the gel as described in Steps 34–37. Estimate the concentration of FITC–annexin V by direct comparison with the BSA standards on the gel (see Fig. 2).
-
47
If required, dilute the stock samples of annexin V in PBS buffer to a final concentration of 1 mg ml−1. Divide annexin V–FITC stock solution into 50 μl aliquots and store at 4 °C. It is convenient to store annexin V solution at 1 mg ml−1, which is ∼1,000 × the final concentration required for staining of apoptotic cells (Fig. 3).
Figure 3: Titration of recombinant annexin V–FITC on apoptotic cells. 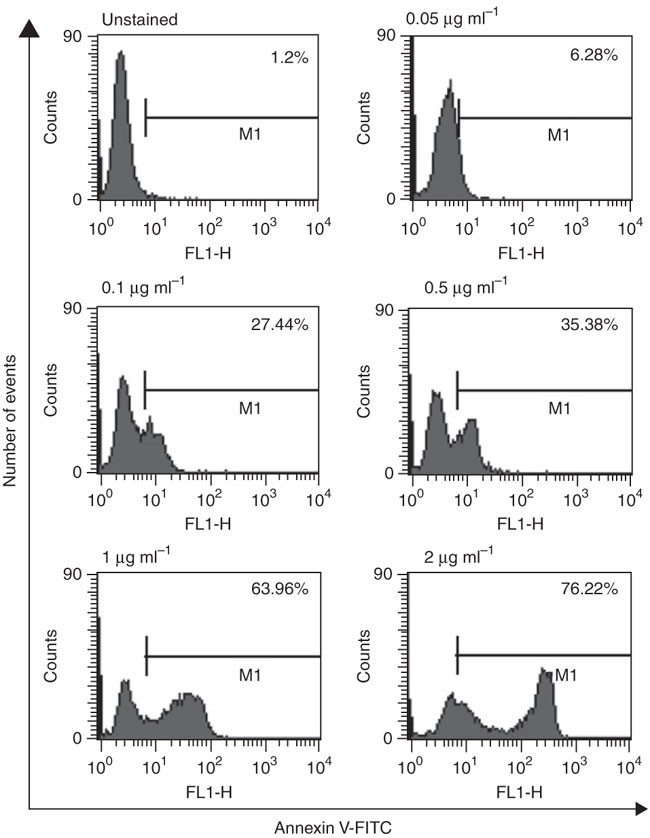
HeLa cells were treated with 1 μM of actinomycin D (Act D) for 12 h. Cells were then harvested and either left unstained or were incubated with recombinant annexin V–FITC at a final concentration of 0.05, 0.1, 0.5, 1 or 2 μg ml−1 for 5 min at room temperature and analyzed by flow cytometry. The percentage of annexin V-positive cells, as determined by the M1 gate, in each treatment is indicated in the top right-hand corner of each panel. Note that concentrations of annexin V–FITC between 1 and 2 μg ml−1 result in optimum separation between live and apoptotic cell populations.
Critical Step
FITC-labeled annexin V stock solution should not be stored frozen, as this can result in a loss of activity due to dimerization24.
Pause point
FITC-conjugated annexin V solution is stable for several years when stored at 4 °C protected from light.

Day 6: titration of annexin V–FITC to obtain optimum concentration for flow cytometry assays
Timing ∼4 h
-
48
Apoptosis should be induced in the chosen cell type (density 1 × 10⁶ ml−1) with an appropriate stimulus (e.g., UV irradiation, 5 μM Act D and 200 ng ml−1 anti-Fas IgM antibody)6. Untreated cells at the same density should be included as a negative control.
-
49
Remove 200 μl of the cell suspension or trypsinized adherent cells (∼2 × 10⁵ cells) per treatment (four treatments in total) and pellet by centrifugation (for 5 min at 300g, room temperature).
-
50
Resuspend the cells in 300 μl of annexin V binding buffer containing 0.1, 0.5, 1 and 2 μg ml−1 annexin V–FITC solution and incubate for 5 min at room temperature.
-
51
Analyze the samples on a flow cytometer setting the forward scatter (FSC), side scatter (SSC) and FL1 channel settings using the untreated (i.e., viable) cell samples22 (Fig. 3).
-
52
Analyze annexin V–FITC binding and choose the annexin V concentration that provides optimum separation between the peak of viable cells (left peak) and apoptotic cells (right peak) (see Fig. 3).
Annexin V–FITC binding assay
Timing ∼20 min
-
53
Repeat Steps 47–49 using the apoptotic stimulus of interest plus positive and negative controls. Incubate cells for 5 min with the concentration of annexin V–FITC deemed optimum in Step 52.
-
54
After incubation with annexin V–FITC in Step 53, necrotic cells can be identified by the addition of PI (final concentration 10 μg ml−1) (REAGENT SETUP) to the annexin V binding buffer.
-
55
Immediately acquire samples on a flow cytometer using the FL1 channel to determine annexin V–FITC binding and the FL2 channel for PI uptake.
-
56
To analyze cells using microscopy, follow Steps 53–54, then mount the cells on microscope slides and view by fluorescence or confocal microscopy.
Troubleshooting
Troubleshooting advice can be found in Table 3.
Timing
Steps 1–9, transformation of pProEx.Htb.annexin V into bacteria: 2 h + overnight
Step 10, preparation of overnight seed culture: ∼5 min + overnight
Steps 11–16, expression of recombinant annexin V: ∼6 h
Steps 17–35, purification of recombinant annexin V: ∼8 h
Steps 36–39, estimation of recombinant annexin V yield: ∼5 h
Steps 40–47, FITC conjugation of annexin V: ∼3 d
Steps 48–52, titration of FITC-annexin V to determine optimum concentration for the detection of apoptotic cells: ∼4 h
Steps 53–56, FITC–annexin V binding assay: ∼20 min
Anticipated results
Here, we have described methods for bacterial expression, purification and FITC conjugation of recombinant polyhistidine-tagged annexin V (Fig. 1). We have specified points at which samples should be taken to monitor the efficiency of annexin V expression and purification (see Table 2 and Fig. 2). This is important, as it permits monitoring of the expression and purification process to identify points at which problems may have occurred. As shown in Figure 2, after induction of recombinant annexin V for 3 h at 37 °C, robust expression of this protein is observed (lane 2). After sonication of bacteria and subsequent removal of insoluble material by centrifugation, annexin V is released into the soluble supernatant fraction (lane 4), although some protein is retained in the bacterial pellet (lane 5). Soluble annexin V is captured by Ni-NTA agarose (lane 6) and efficiently eluted from the agarose beads by addition of elution buffer containing 100 mM of imidazole (lanes 7–9). The analysis of Ni-NTA agarose beads post elution confirmed displacement of His-tagged annexin V by imidazole (lane 10). By comparison with known amounts of BSA that are run simultaneously on the gel (lanes 11–13), the concentration of annexin V can be estimated. We find that a 250-ml annexin V bacterial expression culture routinely yields milligram amounts of the protein, which is highly stable and retains its specificity for PS for several years upon storage at 4 °C. The protocol can be scaled up or down as required.
We have also described a method for annexin V conjugation to FITC; however, other fluorochromes may be used for the conjugation step (such TRITC or phycoerythrin) offering more possibilities for flow cytometry if FITC is not suitable for the particular application.
It is important to titrate each batch of annexin V–FITC to determine the optimum concentration for use in flow cytometry, as too little annexin V–FITC may not give the desired separation between viable and apoptotic cells. As shown in Figure 3, 0.05, 0.1 and 0.5 μg ml−1 of annexin V–FITC fail to adequately distinguish between the viable (peak on the left) and apoptotic cells (peak on the right) in the population. Analysis with 1 μg ml−1 of annexin V–FITC provided the best separation between viable and apoptotic cells. Normally, we find a final concentration of ∼1 μg ml−1 provides optimum results.
The annexin V-binding assay can be used to detect apoptotic cells irrespective of the stimulus used. As illustrated in Figure 4, induction of apoptosis with a range of stimuli was found to induce apoptosis leading to annexin V–FITC binding in all cases, as shown by a shift of the cell population from the left (annexin V–FITC-negative) to the right (annexin V–FITC-positive) (Fig. 4). Annexin V binding can also be detected early in apoptosis (Fig. 5). As early as 6 h after treatment with Act D, a peak of apoptotic annexin V-positive cells is evident in Figure 5 and as time progresses more cells shift from the viable to apoptotic population.

HeLa cells were treated for 12 h with 20 ng ml−1 of TNF in combination with 1 μM of cycloheximide (TNF), 75 μM of cisplatin, 75 μM of 3,4-dichloroisocoumarin (DCI), 200 μM of cycloheximide (CHX), 1 μM actinomycin D (Act D), 75 μM of MG132, 100 μM of etoposide, or left untreated. Cells were then harvested and incubated with recombinant annexin V–FITC at a final concentration of 1 μg ml−1 for 5 min at room temperature and analyzed by flow cytometry. The percentage of annexin V-positive cells in each treatment is indicated in the top right-hand corner of each panel.

HeLa cells were treated with 1 μM of actinomycin D (Act D) and samples were taken for the assessment of annexin V–FITC binding at 0, 6 and 12 h. The percentage of annexin V-positive cells in each treatment is indicated in the top right-hand corner of each panel.
When carrying out annexin V binding assays, we routinely include a vital dye, such as PI, to distinguish between apoptotic and secondary necrotic cells (Fig. 6). As shown in the dot plots presented in Figure 6, in the untreated sample 94.4% of cells are located in the lower left quadrant. Cells that are both annexin V- and PI-negative represent the viable cells in the population. In the lower panels (TNF- and Act D-treated), some cells are in the lower right quadrant. These cells are positive for annexin V and negative for PI staining, and are cells in the early stages of apoptosis that have externalized PS but have not yet begun to take up vital dyes. Cells located in the upper-right quandrant of the same panel are positive both for annexin V and for PI, and are cells in the late stages of apoptosis that have lost plasma membrane integrity (secondary necrosis). Double staining of cells with annexin V and PI provides information concerning the stage of apoptosis and therefore is more informative than staining with annexin V alone. This is illustrated by comparison of the dot plots with the histograms of annexin V–FITC staining shown on the right of Figure 6. On the basis of these histograms, we can see in the case of Act D treatment that 55% of cells are annexin V–FITC-positive. However, analysis with both annexin V and PI showed that of the 55% annexin V-positive cells, 20% are in the early stages (only annexin V positive), whereas 32% are in the late stages of apoptosis moving toward secondary necrosis. Cells that enter necrosis directly become double positive for annexin V and PI simultaneously6.

HeLa cells were treated for 12 h with 20 ng ml−1 of TNF in combination with 1 μM of cycloheximide (TNF), 1 μM of actinomycin D (Act D) or left untreated. Cells were then harvested and incubated with recombinant annexin V–FITC at a final concentration of 1 μg ml−1 for 5 min at room temperature. Just before analysis by flow cytometry, PI was added to all samples to a final concentration of 10 μg ml−1. In the left-hand panels, cells have been analyzed for annexin V binding as well as for PI uptake. In the right-hand panels, only annexin V binding data for the same samples is shown. The percentage of cells annexin V positive, PI positive or double positive for both annexin V and PI is indicated.
Analysis of annexin V binding can also be assessed by immunofluorescence or confocal microscopy. In Figure 7, cells in the early stages of apoptosis, that are only annexin V–FITC-positive, display green fluorescence. Cells in the late stage of apoptosis also stain positive for PI as well as for annexin V–FITC (red and green cells). We can also see morphological features indicative of apoptosis, such as membrane blebbing.

HeLa cells were treated for 12 h with 20 ng ml−1 of TNF in combination with cycloheximide (1 μM). Cells were stained with recombinant annexin V–FITC at final concentration of 1 μg ml−1 for 15 min at 37 °C (a), or in combination with PI at final concentration of 10 μg ml−1 (b). Annexin V–FITC-positive cells are stained green and PI-positive cells are stained red.
References
Taylor, R.C., Cullen, S.P. & Martin, S.J. Apoptosis: controlled demolition at the cellular level. Nat. Rev. Mol. Cell Biol. 9, 231–241 (2008).
Kerr, J.F., Wyllie, A.H. & Currie, A.R. Apoptosis: a basic biological phenomenon with wide-ranging implications in tissue kinetics. Br. J. Cancer 26, 239–257 (1972).
Lüthi, A.U. & Martin, S.J. The CASBAH: a searchable database of caspase substrates. Cell Death Differ. 4, 641–650 (2007).
Fadok, V.A. et al. Different populations of macrophages use either the vitronectin receptor or the phosphatidylserine receptor to recognize and remove apoptotic cells. J. Immunol. 148, 2207–2216 (1992).
Koopman, G. et al. Annexin V for flow cytometric detection of phosphatidylserine expression on B cells undergoing apoptosis. Blood 84, 1415–1420 (1994).
Martin, S.J. et al. Early redistribution of plasma membrane phosphatidylserine is a general feature of apoptosis regardless of the initiating stimulus: inhibition by overexpression of Bcl-2 and Abl. J. Exp. Med. 182, 1545–1556 (1995).
Fadok, V.A., Bratton, D.L., Frasch, S.C., Warner, M.L. & Henson, P.M. The role of phosphatidylserine in recognition of apoptotic cells by phagocytes. Cell Death Differ. 5, 551–562 (1998).
Hamon, Y. et al. ABC1 promotes engulfment of apoptotic cells and transbilayer redistribution of phosphatidylserine. Nat. Cell Biol. 2, 399–406 (2000).
Züllig, S. et al. Aminophospholipid translocase TAT-1 promotes phosphatidylserine exposure during C. elegans apoptosis. Curr. Biol. 17, 994–999 (2007).
Darland-Ransom, M. et al. Role of C. elegans TAT-1 protein in maintaining plasma membrane phosphatidylserine asymmetry. Science 320, 528–531 (2008).
Gerke, V. Annexins and membrane organisation in the endocytic pathway. Cell Mol. Biol. Lett. 6, 204 (2001).
Gerke, V. & Moss, S.E. Annexins: from structure to function. Physiol. Rev. 82, 331–371 (2002).
Martin, S.J., Finucane, D.M., Amarante-Mendes, G.P., O'Brien, G.A. & Green, D.R. Phosphatidylserine externalization during CD95-induced apoptosis of cells and cytoplasts requires ICE/CED-3 protease activity. J. Biol. Chem. 271, 28753–28756 (1996).
Krysko, D.V., Vanden Berghe, T., D'Herde, K. & Vandenabeele, P. Apoptosis and necrosis: detection, discrimination and phagocytosis. Methods 44, 205–221 (2008).
Blankenberg, F.G. et al. In vivo detection and imaging of phosphatidylserine expression during programmed cell death. Proc. Natl. Acad. Sci. USA 95, 6349–6354 (1998).
Brumatti, G., Sheridan, C. & Martin, S.J. Expression and purification of recombinant annexin V for the detection of membrane alterations on apoptotic cells. Methods 44, 235–240 (2008).
Belhocine, T. et al. Increased uptake of the apoptosis-imaging agent (99m)Tc recombinant human Annexin V in human tumors after one course of chemotherapy as a predictor of tumor response and patient prognosis. Clin. Cancer Res. 8, 2766–2774 (2002).
Haas, R.L. et al. In vivo imaging of radiation-induced apoptosis in follicular lymphoma patients. Int. J. Radiat. Oncol. Biol. Phys. 59, 782–787 (2004).
Kartachova, M. et al. In vivo imaging of apoptosis by 99mTc-Annexin V scintigraphy: visual analysis in relation to treatment response. Radiother. Oncol. 72, 333–339 (2004).
de Freitas Balanco, J.M. et al. Apoptotic mimicry by an obligate intracellular parasite downregulates macrophage microbicidal activity. Curr. Biol. 11, 1870–1873 (2001).
Fadeel, B. et al. Phosphatidylserine exposure during apoptosis is a cell-type-specific event and does not correlate with plasma membrane phospholipid scramblase expression. Biochem. Biophys. Res. Commun. 226, 504–511 (1999).
Maecker, H.T. & Trotter, J. Flow cytometry controls, instrument setup, and the determination of positivity. Cytometry A 69, 1037–1042 (2006).
Bradford, M.M. A rapid and sensitive for the quantitation of microgram quantitites of protein utilizing the principle of protein-dye binding. Anal. Biochem. 72, 248–254 (1976).
van Genderen, H. et al. In vitro measurement of cell death with the annexin A5 affinity assay. Nat. Protoc. 1, 363–367 (2006).
Hatse, S., Schols, D., De Clercq, E. & Balzarini, J. 9-(2-Phosphonylmethoxyethyl)adenine induces tumor cell differentiation or cell death by blocking cell cycle progression through the S phase. Cell Growth Differ. 10, 435–446 (1999).
Vanags, D.M., Pörn-Ares, M.I., Coppola, S., Burgess, D.H. & Orrenius, S. Protease involvement in fodrin cleavage and phosphatidylserine exposure in apoptosis. J. Biol. Chem. 271, 31075–31085 (1996).
Casciola-Rosen, L., Rosen, A., Petri, M. & Schlissel, M. Surface blebs on apoptotic cells are sites of enhanced procoagulant activity: implications for coagulation events and antigenic spread in systemic lupus erythematosus. Proc. Natl. Acad. Sci. USA 93, 1624–1629 (1996).
Concin, N. et al. Role of p53 in G2/M cell cycle arrest and apoptosis in response to gamma-irradiation in ovarian carcinoma cell lines. Int. J. Oncol. 22, 51–57 (2003).
Brassard, D.L. et al. Integrin alpha(v)beta(3)-mediated activation of apoptosis. Exp. Cell Res. 251, 33–45 (1999).
Karlseder, J., Broccoli, D., Dai, Y., Hardy, S. & de Lange, T. p53- and ATM-dependent apoptosis induced by telomeres lacking TRF2. Science 283, 1321–1325 (1999).
Albanese, C. et al. Activation of the cyclin D1 gene by the E1A-associated protein p300 through AP-1 inhibits cellular apoptosis. J. Biol. Chem. 274, 34186–34195 (1999).
van Engeland, M., Ramaekers, F.C., Schutte, B. & Reutelingsperger, C.P. A novel assay to measure loss of plasma membrane asymmetry during apoptosis of adherent cells in culture. Cytometry 24, 131–139 (1996).
Stockwin, L.H. et al. Proteomic analysis of plasma membrane from hypoxia-adapted malignant melanoma. J. Proteome Res. 5, 2996–3007 (2003).
Repp, A.C., Mayhew, E.S., Howard, K., Alizadeh, H. & Niederkorn, J.Y. Role of fas ligand in uveal melanoma-induced liver damage. Graefes Arch. Clin. Exp. Ophthalmol. 239, 752–758 (2001).
Guicciardi, M.E., Miyoshi, H., Bronk, S.F. & Gores, G.J. Cathepsin B knockout mice are resistant to tumor necrosis factor-alpha-mediated hepatocyte apoptosis and liver injury: implications for therapeutic applications. Am. J. Pathol. 159, 2045–2054 (2001).
Zhou, A. et al. Interferon action and apoptosis are defective in mice devoid of 2′,5′-oligoadenylate-dependent RNase L. EMBO J. 16, 6355–6363 (1997).
Gatti, R. et al. Comparison of annexin V and calcein-AM as early vital markers of apoptosis in adherent cells by confocal laser microscopy. J. Histochem. Cytochem. 46, 895–900 (1998).
Hiddinga, H.J. & Eberhardt, N.L. Intracellular amyloidogenesis by human islet amyloid polypeptide induces apoptosis in COS-1 cells. Am. J. Pathol. 154, 1077–1088 (1999).
Boersma, A.W., Nooter, K., Oostrum, R.G. & Stoter, G. Quantification of apoptotic cells with fluorescein isothiocyanate-labeled annexin V in Chinese hamster ovary cell cultures treated with cisplatin. Cytometry 24, 123–130 (1996).
Sato, T. et al. Apoptosis of cultured rat glomerular mesangial cells induced by IgG2a monoclonal anti-Thy-1 antibodies. Kidney Int. 49, 403–412 (1996).
Acknowledgements
We thank Science Foundation Ireland for support of work in our laboratory. The work in the Martin laboratory is supported by grants from the European Union Marie Curie Research Training Network (Apoptrain), Science Foundation Ireland (SRCG20336 and 08/IN.1/B2031) and The Wellcome Trust (082749).
Rights and permissions
About this article
Cite this article
Logue, S., Elgendy, M. & Martin, S. Expression, purification and use of recombinant annexin V for the detection of apoptotic cells. Nat Protoc 4, 1383–1395 (2009). https://doi.org/10.1038/nprot.2009.143
Published:
Issue Date:
DOI: https://doi.org/10.1038/nprot.2009.143
This article is cited by
-
Nano-scaled emulsion and nanogel containing Mentha pulegium essential oil: cytotoxicity on human melanoma cells and effects on apoptosis regulator genes
BMC Complementary Medicine and Therapies (2023)
-
Annexin A5 stabilizes matrix vesicle-biomimetic lipid membranes: unravelling a new role of annexins in calcification
European Biophysics Journal (2023)
-
New indolo-β-lactam hybrids as potential anticancer and anti-inflammatory agents
Medicinal Chemistry Research (2023)
-
Synthesis, molecular modeling and functional evaluation of a GnRH antagonist
Journal of the Iranian Chemical Society (2022)
-
ML323, a USP1 inhibitor triggers cell cycle arrest, apoptosis and autophagy in esophageal squamous cell carcinoma cells
Apoptosis (2022)
Comments
By submitting a comment you agree to abide by our Terms and Community Guidelines. If you find something abusive or that does not comply with our terms or guidelines please flag it as inappropriate.
