
Abstract
Electroporation is a high-efficiency and low-toxicity physical gene transfer method. Classical electroporation protocols are limited by the small volume of cell samples processed (less than 107 cells per reaction) and low DNA uptake due to partial permeabilization of the cell membrane. Here we describe a flow-through electroporation protocol for continuous transfection of cells, using disposable devices, a syringe pump and a low-cost power supply that provides a constant voltage. We show transfection of cell samples with rates ranging from 40 μl min−1 to 20 ml min−1 with high efficiency. By inducing complex migrations of cells during the flow, we also show permeabilization of the entire cell membrane and markedly increased DNA uptake. The fabrication of the devices takes 1 d and the flow-through electroporation typically takes 1–2 h.
Introduction
Gene delivery is an indispensable technique for both basic biological research and applied biotechnology; genetically modified cells provide critical information regarding the involvement of genes and gene products in cell development, differentiation and malignancy. More recently, transfected cells have become essential materials for a wide range of emerging cell therapies and gene therapies that have the potential to treat both inherited and acquired disorders1,2,3,4,5. A substantial number of these therapies apply an ex vivo approach: cells are first isolated from a patient or a donor, then genetically modified and selected, before they are introduced into the patient. The implanted transfected cells either restore damaged tissues or stimulate desired cellular functions such as immune responses. These new clinical practices demand advanced methods for genetic engineering of cells at various scales.
A variety of transfection methods have been developed for genetic modification of cells over the years. Viruses (e.g., retroviruses and adenoviruses) with genetically disabled virulence are high-efficiency gene transfer vectors. However, retroviruses (including oncoretroviruses and lentiviruses) may integrate into the host genome and produce insertional mutagenesis6,7. Adenoviruses, although nonintegrating, often elicit strong immune responses in patients because of the high titers required8,9,10. Random integration and tumorigenesis also limits the use of adeno-associated viruses, which generally have low virulence and immunogenicity11,12,13,14. Alternatively, nonviral methods based on the complexing of DNA with cationic lipids or polymers have also been widely applied for gene delivery15,16,17. However, results of these methods are strongly dependent on the cell type, the state of the cells and the size of the construct. Certain delivery reagents may also induce altered gene expression18.
Electroporation is the most widely used physical method for gene transfer, with a mechanism that is fundamentally different from those of viral or chemical transfection19,20,21,22,23. Electroporation creates nanoscale pores in the plasma membrane that allow DNA delivery into cells24,25. Electroporation occurs when an external electric field is applied to cells and the transmembrane potential (ΔψE) exceeds a critical threshold.

where g(λ) is a function of the membrane and buffer conductivities, a is the diameter of the cell, E is the field intensity and θ is the angle between the normal to the membrane surface and the field direction. Classical electroporation is conducted using a high-voltage pulse generator that exerts short electric pulses of defined duration and intensity to a cuvette with embedded electrodes inside. By tuning the electric parameters (e.g., field intensity, field duration and pulse pattern), gene transfer efficiency and cell viability can be optimized. Because of its physical nature, electroporation is simple to operate, amenable to miniaturization (which often markedly decreases the required voltage)26,27,28,29,30,31 and yields reproducible results32. In comparison with viral and chemical transfection, electroporation offers greatly reduced safety concerns. The major limitations associated with electroporation are relatively high cell death rate, high cost of the equipment and limited delivery area through the cell surface. The last limitation is determined by both the physics and the practice of electroporation. On the basis of Equation (1), the transmembrane potential ΔψE is highest at the poles of a cell (i.e., θ → 0) where the surface normal is aligned with the field direction. When a cell remains static during the application of the electric field (this is typically the case for conventional electroporation given the pulse duration of milliseconds or shorter), permeabilization of the membrane and gene delivery occur mostly at the poles. The rest of the cell membrane is usually not permeabilized under the optimized electroporation conditions (which prevent excessive cell death)33,34. The fact that gene entry into cells is via a small fraction of the cell surface area creates a profound hurdle for improving transfection efficiency.
Flow-through electroporation based on constant voltage
Here we present a protocol for DNA delivery via flow-through electroporation by constant voltage, which is based on previously published methods used in our laboratory35,36. In our protocol, instead of using a pulse generator, we use a common power supply that applies a constant voltage across a fluidic channel. Cell suspension mixed with DNA molecules flows through the channel, which has multiple sections of designed cross-sectional areas. The local field intensity and the cross-sectional area of a particular section are inversely proportional. Owing to convenience for fabrication, the channel is typically made of uniform depth and composed of wide and narrow sections in order to create variation in the cross-sectional area. Appropriate combination of the voltage and the channel design yields high field intensity in the narrow sections and low intensity in the wide sections. The field intensity in the narrow sections is beyond the electroporation threshold, whereas the intensity in the wide sections does not affect membrane integrity. Cells experience electroporation while flowing through the narrow section(s) and the duration of electroporation is determined by the residence time(s) in the narrow section(s). Having multiple narrow sections in the channel renders flowing cells subject to field variations equivalent to multiple pulses. The channels can be fabricated at low cost using soft lithography. Because the physics of the device does not depend on its absolute size, the channel can be easily scaled up and down in the range of micrometers to millimeters to accommodate a processing rate from μl min−1 to ml min−1. Figure 1 shows the major steps involved in the protocol, including (i) photomask design and printing; (ii) master mold fabrication; (iii) polydimethylsiloxane (PDMS) device fabrication; (iv) cell and sample preparation; (v) flow-through electroporation; and (vi) transfection and viability assays. As a proof of principle, pEGFP-C1 plasmid DNA was efficiently transferred into Chinese hamster ovary (CHO-K1) cells using this protocol35,36; we have not tested the method with other plasmids or cell types.

The device fabrication process is depicted in the upper box.
Advantages and limitations
Our protocol has several unique advantages. First, the flow-through format allows us to process sample volumes ranging from microliters to liters35. This feature facilitates genetic modification of both scarce and large-volume samples. The ability to work with tiny sample amounts permits functional tests of genes and gene products using cells from limited sources (e.g., animal or human clinical materials). However, for cell therapies, ex vivo transfection on the order of 109 cells per patient per trial is routinely required37,38. We showed a processing rate of up to 20 ml min−1 (or 107–108 cells min−1) with our flow-through electroporation protocol in recent work35. Such an operation is impossible or very difficult with conventional cuvette-based electroporators that typically handle sample sizes of a few milliliters. Second, our flow-through electroporation protocol permits gene delivery through the entire cell surface36. As mentioned above, conventional electroporation with pulses applied to static cell suspension only permeabilizes a small fraction of the cell membrane area. We showed recently that, by creating device geometry and flow conditions, which gave rise to complex cell migrations, the entire surface area of cells was exposed to the electric field for permeabilization during the course of the flow36. Such practice markedly improved the uptake without a substantial effect on the cell viability. A high concentration of DNA at the cell surface has been identified as a prerequisite for high-efficiency transfection39. Finally, our protocol does not require expensive equipment. Our protocol is the only electroporation technique that is based on application of constant voltage. This unique feature eliminates the need for a pulse generator, which is used in virtually all other electroporators. With a low-cost direct current (DC) power supply and fluidic channels fabricated by soft lithography, we are able to implement sophisticated pulse sequences by variations in the design of the channel. The use of constant voltage also ensures stable operation and uniform cell treatment over an extensive period of processing.
Our flow-through electroporation protocol compares well with available commercial devices and techniques, as shown in Table 1. Cuvette, well-plate or capillary-based electroporators (e.g., Bio-Rad Gene Pulser, Amaxa Nucleofector40,41,42, Invitrogen Neon system43) work in batch mode and produce transfected samples of ∼107 cells or less per reaction. Our protocol works in a continuous manner with a constant output rate up to ∼108 cells min−1 and makes it practical to transfect liters of cell samples. The physics involved does not limit our protocol from further scale-up. MaxCyte offers flow electroporation for large-volume processing44. However, the MaxCyte system uses a high-performance pulse generator to continuously electroporate flowing cells, and it requires much more sophisticated and expensive apparatus than that of our technique. Among all the systems, the Amaxa Nucleofection system offers the highest transfection efficiency due to the pulse sequence and buffer ingredients (both undisclosed) optimized for each cell type. To our knowledge, our protocol is the only electroporation technique that produces permeabilization and delivery over the entire cell surface.
One limitation of our protocol is that generating very short pulses (∼10 μs or shorter) is challenging because this requires very fast velocity (up to ∼1 m s−1) in the channel. Fortunately, we found that the optimal transfection normally required field durations of a few microseconds. Our protocol also shares some of the common limitations of all electroporation protocols. For example, a balance needs to be struck between high transfection efficiency and high cell viability. Typically, even under optimized conditions, there still is a cell-death rate of 10–20%. Furthermore, for each particular cell type, optimization of the electric parameters and other operational conditions is necessary. The potential combinations of field intensities, durations and pulse patterns are practically endless. Thus, it is important to establish some general guidelines about these parameters.
Experimental design
Electric parameters. The most relevant electric parameters for electroporation are field intensity, duration and pulse sequence. In our typical designs, only the electric field in the sections with small cross-sectional area of the channel has higher intensity than the electroporation threshold (e.g., ∼300–400 V cm−1 for Chinese hamster ovary cells)35,36. The field intensity in these sections (i.e., the electroporation field intensity) is determined by the constant voltage applied across the channel (V) and the geometry of the channel. The residence time of cells in these sections (determined by the cell velocity and the lengths of these sections) determines the electroporation duration. By having multiple electroporation sections in series, we are able to deliver a number of pulses to cells with designed pattern and sequence, determined by the arrangement of various sections.
Although a constant DC voltage is established across a channel that is filled with a conductive buffer, and has multiple sections with various cross-sectional areas, based on Ohm's law, the field intensities in two sections (Ei and Ej) follow the simple relationship Ei/Ej = Aj/Ai, where Ai and Aj are the cross-sectional areas of these sections, respectively45. Because of the planar nature of soft lithography fabrication, we often make the depth of the channel uniform in all the sections and in that case we have Ei/Ej = Wj/Wi, where Wi and Wj are the widths of the sections. We typically have the same width among multiple narrow sections (or multiple wide sections) for the sake of simplicity, although it is also possible to have multiple widths for the narrow sections in one channel. In this protocol, we refer to the width and field intensity of the wide sections as W1 and E1 and those of the narrow section(s) (the electroporation sections) as W2 and E2, respectively. We found that a ratio of 7–15 for W1/W2 (= E2/E1) guaranteed exclusive electroporation in the narrow sections and no substantial compromise of the membrane integrity in the wide sections35. We also refer to the combined length and duration in the wide sections as L1 and T1 and those in the narrow section(s) as L2 and T2, respectively. We use notation such as 'T2 = 5 × 1 ms' to indicate that there are five narrow sections in the channel with a residence time of 1 ms in each with a total combined duration of 5 ms. When determining the operational parameters for a device with known dimensions and desired electroporation intensity (E2) and duration (T2), we can use the following formulas to calculate the applied voltage (V) and the flow rate of a cell sample (Q)


where H is the channel depth.
Multiple pulses created by having multiple narrow sections typically produce superior results compared with those created by devices with one single narrow section35,46. The arrangement of the electroporation sections has a major influence on the transfection efficiency. The narrow electroporation sections are segmented by the wide sections. Although the low field in the wide sections does not generate electroporation, it exerts electrophoretic drag that is important for delivering DNA deeply into the cell interior and facilitates DNA entry into the nucleus. For example, we showed that, whereas the optimal combined T2 was in the range of 1–10 ms, the combined T1 in the wide sections needed to be on the order of a few seconds to produce high-efficiency transfection35.
Control of permeabilized membrane area using hydrodynamics. The flow-through format of our electroporation protocol allows hydrodynamic manipulation of cell motions that strongly influence the cell membrane area being permeabilized. In our recent work, we showed that by inducing transverse Dean flow in the channel, flow-through electroporation generated permeabilization over the entire cell surface without introducing a substantial decrease in the cell viability36. Under these flow conditions, cells are involved in both the flow along the channel path and the vortices in the secondary transverse direction (i.e., in the plane that is perpendicular to the main flow direction). Such complex migrations expose different surface areas of a cell to the electric field and overcome the major difficulty with conventional electroporation (i.e., limited permeabilized membrane area).
The flow conditions and the channel geometry need to meet certain criteria in order to generate secondary flows and entrain cells in these flows. We found that the channel Reynolds number Rc and the dimensionless inertial force ratio Rf (expressing the relative magnitudes of inertial lift forces FL and drag forces due to the secondary flow FD) were crucial measures for determining whether cells experienced transverse migration, and whether the permeabilization took place at the entire cell surface. The two parameters can be calculated by

where Um is the maximum velocity in the cross-section, Dh is the hydraulic diameter of the channel, which is defined as 2wh / (w + h) (with w and h being the width and depth of the channel), and v is kinematic viscosity, and

where R is the radius of curvature of the channel and a is the cell diameter. In general, a combination of low Rf and high Rc provides the most favorable conditions for vortex-assisted electroporation by inducing a high degree of entrainment in the secondary flow. For example, we showed that in the region of Rf < 1 and Rc > 30, cells were effectively entrained in the secondary Dean flow and experienced enhanced DNA delivery36. We showed that, by introducing secondary flows in a spiral channel, flow-through electroporation permeabilized the entire cell membrane and both DNA uptake and transfection efficiency were markedly improved36. In addition, we achieved similar cell viability with spiral channels as with straight channels (which generated no transverse vortices and led to much smaller permeabilization area)36. We speculate that the cell viability is much more affected by Joule heating (which is determined only by the field intensity and duration) than by the permeabilized cell membrane area.
Scaling up. The physics associated with the flow-through electroporation and the secondary flows is not dependent on the actual size of the channel. Flow-through electroporation is thus fully scalable. We have tested channels with feature sizes ranging from tens of micrometers to millimeters, with the processing rates between 40 μl min−1 and 20 ml min−1 (ref. 35). We typically scale up the devices by increasing the cross-sectional area by the same factor for all the sections in the channel. We need to vary the flow rate of the cell sample accordingly in order to maintain the same field durations. We noticed that the transfection efficiency and cell viability showed some dependence on the device size35. Such dependence could be substantial when there was only one narrow section in the channel. When channels with one narrow section were used, longer T2 was required in a larger device in order to yield transfection efficiency comparable to that yielded by a smaller device35. This is presumably due to weakened electroporation in a larger device, although the exact physics behind this is not clear. However, as a result of the improved electroporation efficiency associated with applying multiple pulses35, channels with multiple narrow sections did not show a substantial loss in the transfection efficiency when scaled up. In general, after optimization of the operational parameters, similar performance can be obtained using devices of different sizes.
Materials
REAGENTS
Device fabrication
-
SU-8 2025 and SU-8 2150 photoresist (MicroChem)
Caution
Photoresist is toxic and flammable. Handle only in a chemical fume hood with appropriate personal protective equipment.
Critical
The SU-8 2000 series of photoresists are highly sensitive to light. Store at 4 °C and process in a room protected from light.
Critical
There are, in total, 12 kinds of SU-8 2000 series photoresists. Each photoresist has different viscosities and densities. Choose an appropriate photoresist for fabricating devices with desired channel depths. See MicroChem data sheets for process guidelines (http://www.microchem.com/Prod-SU82000.htm). SU-8 2025 and 2150 are used in this protocol.
-
SU-8 developer (1-methoxy-2-propyl acetate; MicroChem)
Caution
It is toxic and flammable. Handle only in a chemical fume hood with appropriate personal protective equipment.
-
Isopropanol (Fisher Scientific, cat. no. A516-4)
Caution
It causes irritation and is flammable. Handle only in a chemical fume hood with appropriate personal protective equipment.
-
Acetone (Fisher Scientific, cat. no. A494-4)
Caution
It causes irritation and is flammable. Handle only in a chemical fume hood with appropriate personal protective equipment.
-
Hydrogen peroxide solution (30% (vol/vol); H2O2; Electron Microscopy Sciences, cat. no. 26212-02)
Caution
It is a strong oxidizer, corrosive, toxic by ingestion and a carcinogen. Handle only in a chemical fume hood with appropriate personal protective equipment.
-
Ammonium hydroxide solution (27% (vol/vol); NH4OH; Fisher Scientific, cat. no. A669C-212)
Caution
It is corrosive and toxic by ingestion. Handle only in a chemical fume hood with appropriate personal protective equipment.
-
PDMS (Polydimethylsiloxane) prepolymer and curing agent (General Electric Silicones RTV 615; MG chemicals)
Caution
It is an irritant. Handle with appropriate personal protective equipment.
Cell culture and sample preparation
-
CHO-K1 cells (ATCC)
-
pEGFP-C1 plasmid (Clontech), cat. no 6084–1.
-
DMEM (Invitrogen, cat. no. 11971) for CHO-K1 cell culture
-
FBS (Invitrogen, cat. no. 10082)
-
Penicillin-streptomycin solution (Invitrogen, cat. no. 15140)
-
L-glutamine solution (Invitrogen, cat. no. 25030)
Caution
It is an irritant. Handle with appropriate personal protective equipment.
-
Trypsin-EDTA 4Na solution (0.05% (wt/vol); Invitrogen, cat. no. 25300)
-
PBS tablet (Sigma-Aldrich, cat. no. P4417)
-
Tris(hydroxymethyl)aminomethane (Sigma-Aldrich, cat. no. 154563)
Caution
It is an irritant. Handle with appropriate personal protective equipment.
-
EDTA (Sigma-Aldrich, cat. no. E6758)
Caution
It is an irritant. Handle with appropriate personal protective equipment.
-
Sodium hydroxide (NaOH; Sigma-Aldrich, cat. no. S5881)
Caution
It is corrosive. Handle with appropriate personal protective equipment.
-
Hydrochloric acid (HCl; Fisher Scientific, cat. no. A144C-212)
Caution
It is corrosive. Handle with appropriate personal protective equipment.
Electroporation and related assays
-
Potassium phosphate monobasic (KH2PO4; Sigma-Aldrich, cat. no. P5655)
-
Sodium phosphate dibasic (Na2HPO4; Sigma-Aldrich, cat. no. S5136)
-
Magnesium sulfate heptahydrate (MgSO4·7H2O; Sigma-Aldrich, cat. no. 63138)
-
Sucrose (Sigma-Aldrich, cat. no. S9378)
-
YOYO-1 (1 mM solution in DMSO; Invitrogen, cat. no. Y3601)
Caution
It is an irritant. Handle with appropriate personal protective equipment.
-
Propidium iodide (PI; Invitrogen, cat. no. P1304MP)
Caution
It is an irritant and a potent mutagen. Handle with appropriate personal protective equipment.
EQUIPMENT
Master fabrication
-
Computer-aided design software (Macromedia Freehand MX and Autodesk AutoCAD)
-
Silicon wafers (3-inch diameter; University Wafer)
-
Spin coater (WS-400-6NPP-LITE; Laurell Technologies)
-
Hot plates
-
UV illuminator (OminiCure S1000; EXFO Life Science & Industrial Division)
Caution
Use with proper UV protection.
-
Alignment tools
-
Plastic containers and tanks
-
Wash bottles
-
Tweezers
-
Petri dishes (100 mm in diameter)
-
Nitrogen gas line
-
Nitrogen regulator
-
Vacuum line
-
Air line
-
Chemical fume hood
Glass slide cleaning
-
Microscope glass slides (75 × 25 mm, 1 mm thick; 75 × 50 mm, 1 mm thick; and 45 × 50 mm, 170 μm thick)
-
Glass slide racks
-
Glass slide storage boxes
-
Glass beaker
-
Aluminum foil
-
Magnetic stir bar
-
Hot plate stirrer
PDMS device fabrication
-
Balance
-
Polystyrene weighing dishes
-
Disposable transfer pipettes
-
Glass stirring rods
-
Vacuum desiccators
-
Laboratory oven
-
Razor blades
-
Hole puncher
-
Plasma cleaner (Harrick Plasma) and vacuum pump
Solution preparation
-
Milli-Q Direct system (Millipore)
-
Glass syringe with Lure-Lock tip (50 ml)
-
Sterile syringe filters with 0.2 μm pore diameter
Cell culture and sample preparation
-
Laminar flow hood
-
Tissue culture incubator set at 37 °C with humidified, 5% CO2 atmosphere
-
Cell culture flasks and well plates
-
Pipettes/tips
-
Centrifuge tubes (0.2, 1, 15 and 50 ml)
-
Centrifuge
-
Spray bottles
-
Hemocytometer
-
Ice maker
-
Spectrophotometer
Electroporation system
-
Critical
The system should be sterilized with UV irradiation in a laminar flow hood overnight prior to the experiment.
-
Syringe pump (Fusion 400; Chemyx)
-
Sterile syringes with Luer slip tip (1 ml; Becton Dickinson)
-
Sterile syringes with Luer-Lock tip (6 ml; Kendall)
-
Female Luer adaptor (IDEX Health & Science, cat. no. P-678)
-
Tubing, 1/16 inch (IDEX Health & Science, cat. no. 1622L)
-
Flangeless ferrule, 1/16 inch (IDEX Health & Science, cat. no. P-200)
-
Male flangeless nut, 1/16 inch (IDEX Health & Science, cat. no. P-201)
-
Tubing, 1/8 inch (IDEX Health & Science, cat. no. 1641L)
-
Flangeless ferrule, 1/8 inch (IDEX Health & Science, cat. no. P-300)
-
Male flangeless nut, 1/8 inch (IDEX Health & Science, cat. no. P-301)
-
DC power supply (PS350; Stanford Research System) with alligator clip leads
-
Plastic-coated copper wire
-
Platinum wire (0.5 mm in diameter, Premion, 99.997%; Alfa Aesar, cat. no. 10957)
Microscope
-
Inverted phase-contrast and epifluorescence microscope system with 100 W mercury lamp (IX-71; Olympus) equipped with ×10 and ×20 objectives
-
High-resolution CCD camera (Hamamatsu, ORCA-285)
-
Fluorescence filter cubes (For EGFP and YOYO-1: exciter HQ480/40x, emitter HQ535/50m and beamsplitter Q505LP; for PI: exciter HQ535/50x, emitter HQ645/75m and beamsplitter Q565LP; Chroma Technology)
-
Confocal fluorescence microscope system (LSM 510; Carl Zeiss) equipped with a ×63, 1.4 NA oil-immersion objective
-
Image acquisition software (QImaging QCapture Pro)
-
Stage micrometer
-
ImageJ software (or similar)
REAGENT SETUP
Glass slide cleaning solution
-
Add one volume of 27% (vol/vol) ammonium hydroxide and 1 volume of 30% (vol/vol) hydrogen peroxide to five volumes of ultrapure water in a glass beaker. Heat the solution on a hot plate stirrer and maintain at 75 °C.
Critical
Prepare the solution immediately before cleaning the slides. The cleaning solution becomes useless when stored for 24 h at room temperature (25 °C).
TE buffer
-
TE buffer comprises 10 mM Tris-HCl and 1 mM EDTA, pH 8.0. Prepare 1 M Tris-HCl (pH 8.0) stock solution by dissolving 12.14 g Tris(hydroxymethyl)aminomethane in 80 ml of water and adjusting pH to 8.0 with concentrated HCl solution; add water to adjust the volume to 100 ml. Prepare 500 mM EDTA (pH 8.0) stock solution by dissolving 14.612 g of EDTA in 80 ml of water and adjusting pH to 8.0 with concentrated NaOH solution; add water to adjust the volume to 100 ml. Prepare 10 mM Tris-HCl and 1 mM EDTA, pH 8.0, from the respective stock solutions. Filter with a 0.2-μm membrane, and store at room temperature.
Caution
Tris(hydroxy-methyl) aminomethane, EDTA and sodium hydroxide are irritants. Hydrochloric acid is corrosive. Prepare the solution with appropriate personal protective equipment.
Plasmid DNA
-
Prepare in advance using any standard protocol or commercially available plasmid preparation kit, e.g., QIAfilter Plasmid Giga Kit (Qiagen, cat. no. 12291). Dissolve purified plasmid DNA in TE buffer (pH 8.0). Determine the DNA concentration and purity by UV absorbance at 260 and 280 nm. Split the plasmid DNA solution into multiple aliquots to avoid repeated freeze-thaw cycles and store them at −20 or −80 °C for up to 1 year without marked degradation. pEGFP-C1 plasmid (Clontech) encoding enhanced GFP (EGFP) is used as a model to facilitate observation.
Critical
For optimal transfection, plasmid DNA should be of high quality and free of proteins (especially nucleases), other contaminating nucleic acids and chemicals. Impurities such as salts, ethanol and endotoxin could result in reduced transfection efficiency and cell viability. For reliable DNA purity, the ratio of absorbance at 260 versus 280 nm (A260/280) should be between 1.8 and 2.0. A ratio of <1.8 suggests the contamination of proteins or other UV absorbers, and a ratio of >2.0 indicates the presence of chemicals. In both cases, it is advisable to re-extract the plasmid DNA.
Cell culture medium
-
Use appropriate cell culture medium for specific cell types. For CHO-K1 cells, the medium is DMEM supplemented with 10% (vol/vol) FBS, 2 mM L-glutamine, 100 U ml−1 penicillin and 100 mg ml−1 streptomycin. Store at 4 °C for up to 1 year.
Sterile PBS
-
Dissolve one PBS tablet in 200 ml of ultrapure water. Autoclave for 20 min to sterilize. Store at 4 °C for up to 1 year.
Electroporation buffer
-
Combine 8 mM Na2HPO4, 2 mM KH2PO4, 1 mM MgSO4·7H2O and 250 mM sucrose, pH 7.4. Dissolve 1.136 g of Na2HPO4, 0.272 g of KH2PO4, 0.2465 g of MgSO4·7H2O and 85.575 g of sucrose in 1 liter of water, and adjust pH to 7.4. Filter with a 0.2-μm membrane and store at 4 °C for up to 6 months.
Critical
The concentrations of salts in the buffer are maintained low in order to generate a solution conductivity of ∼0.14 S m−1, whereas sucrose is added to keep the buffer isotonic. More conductive buffers may lead to gas bubble formation (hydrolysis) upon application of the voltage and cause excessive Joule heating that lowers cell viability.
PI stock solution
-
Dissolve 1 mg of PI in 1 ml of PBS at 1 mg ml−1. Store at 4 °C, protected from light, for up to 1 year.
PI working solution
-
Dilute PI stock solution to 1 μg ml−1 with PBS (1:1,000 of dilution from stock). Store at 4 °C, protected from light, for up to 1 month.
EQUIPMENT SETUP
Wafer treatment
-
Silicon wafers should be precleaned and dehydrated before fabrication to enhance the adhesion of photoresist onto the wafers. Immerse the silicon wafer in acetone for 5 min, and rinse with isopropanol. Immerse the silicon wafer in isopropanol for 5 min, and rinse with deionized water. Blow-dry with clean air. Bake on a hot plate at 200 °C for 5 min to remove the adsorbed water from wafer surface. Cool down to room temperature for photoresist coating, or store in a clean and dry environment.
Caution
Acetone and isopropanol cause irritation and are flammable. Handle only in a chemical fume hood with appropriate personal protective equipment.
Glass slide cleaning
-
Place the glass slides in a glass beaker with slide racks, add the cleaning solution (see REAGENT SETUP for detail) and cover the beaker with a sheet of aluminum foil. Heat the slides at 75 °C on a hot plate, and stir the solution continuously with a magnetic stir bar. After 3 h, remove glass slides with tweezers, rinse with ultrapure water and thoroughly blow-dry them with clean air. Place the cleaned glass slides in a slide storage box.
Critical
This process is used to remove organic residues such as alkanethiols from the glass surface by oxidization, during which oxygen bubbles are generated vigorously in the solution.
Caution
Both ammonium hydroxide and hydrogen peroxide are highly toxic. Perform this step in a chemical hood and use appropriate personal protective equipment.
Procedure
Design and printing of photomasks
Timing 1 h for design and 1–4 d for printing
-
1
Draw patterns with a computer-aided design software, such as Macromedia FreeHand MX or Autodesk AutoCAD. Figure 2 shows four examples of the designs: first, multiple alternating wide and narrow sections with different sizes (a and b in Fig. 2); second, two wide sections and one straight narrow section (c in Fig. 2); and, finally, two wide sections and one spiral narrow section (d in Fig. 2).
Figure 2: Examples of photomasks used for fabricating flow-through electroporation devices. 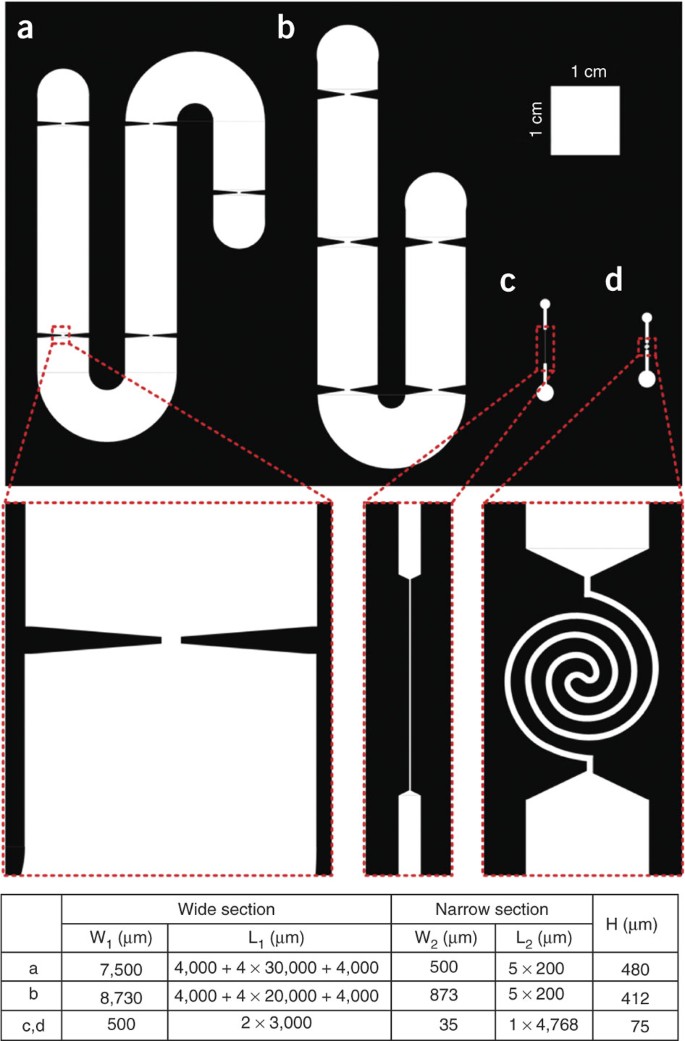
The narrow sections are not magnified by the same proportion. The channel patterns are designed as transparent areas allowing UV penetration. The table shows the dimensions of the channels. W1: the width of the wide sections; L1: the total length of wide sections; W2: the width of the narrow sections; L2: the total length of the narrow sections; H: the depth of the channel.
Critical Step
SU-8 2000 is a series of epoxy-based negative photoresists. Channel patterns should be drawn as transparent area, allowing UV light to pass through the photomask and cross-link the SU-8 2000 photoresist.
-
2
For straight channels, print the design on high-resolution (5,080 dpi) film transparencies. For spiral channels, print the pattern on glass with a layer of chromium to generate chrome masks with higher resolution. Many commercial suppliers provide a printing service, such as University of Illinois at Urbana-Champaign Facilities & Services Printing Department (http://130.126.4.33/scripts/contacts.cgi) and Purdue University Birck Nanotechnology Center (https://engineering.purdue.edu/NANO/Microfab).
Critical Step
Film transparency is suitable for patterns with relatively large sizes (>20 μm), and is much cheaper than chrome masks.

Fabrication of masters
Timing 0.5–3.5 h
-
3
Turn on the nitrogen cylinder, which is connected to the spin coater, and set the pressure to 60 psi.
-
4
Place a 3-inch silicon wafer on the center of the spinner chuck and apply vacuum to hold the wafer.
Critical Step
The position of the wafer will need fine adjustments to ensure uniform spread of photoresist on the wafer.
-
5
Pour ∼5 ml of SU-8 2000 photoresist on the center of the wafer. Spin the wafer with an appropriate spin speed to obtain the desired film thickness. Determine the required spin speed and time from spin curves (see MicroChem data sheet on SU-8 2000). As an example, for a thickness of 75 μm with SU-8 2025, set the speed to 100 r.p.m. for 5 s and then 1,000 r.p.m. for 30 s (Fig. 3a).
Figure 3: Schematic illustration of master fabrication with standard photolithography technique. 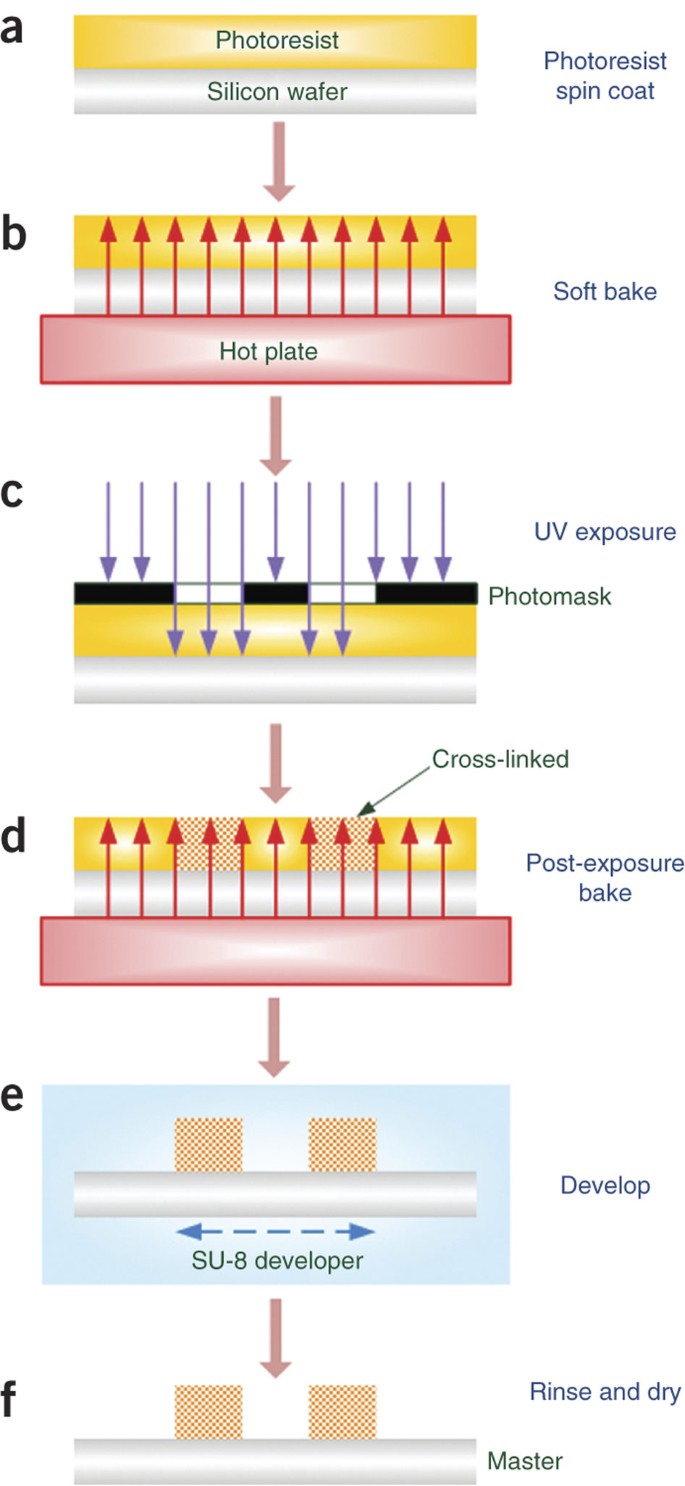
(a–f) Spin-coat SU-8 2000 photoresist on a silicon wafer (Steps 3–5) (a); soft-bake on a hot plate to evaporate the solvent and harden the photoresist (Step 6) (b); UV exposure to replicate the pattern on a photomask into the photoresist (Step 7) (c); post-exposure bake on a hot plate to fully cross-link the exposed photoresist (Step 8) (d); agitate in SU-8 developer to remove the unexposed photoresist (Step 9) (e); and rinse and dry with clean air (Step 10) (f).
Critical Step
It is important to choose the appropriate photoresist with the required viscosity and density for fabricating devices with the desired channel depth (see REAGENTS section for additional information).
Caution
SU-8 2000 series photoresists are toxic and flammable. Handle only in a chemical fume hood with appropriate personal protective equipment.
-
6
Transfer the coated wafer onto a hot plate with tweezers. Soft-bake at 95 °C to evaporate the solvent and harden the photoresist (Fig. 3b).
Critical Step
The soft-baking time depends on the photoresist thickness. Optimize the process to ensure that no film 'wrinkling' occurs.
Critical Step
The hot plate must be leveled. Otherwise, the thickness of the photoresist on the wafer will not be uniform.
-
7
Cool down the wafer to room temperature. Align the photomask on top of the wafer and place a blank glass plate on the transparency photomask. Expose to UV light (energy density between 585 and 600 mJ cm−2) for 17–20 s to replicate the pattern into the photoresist (Fig. 3c).
Critical Step
The optimal exposure intensity and time depends on the photoresist thickness and the UV source.
Caution
UV radiation is harmful to eyes. Wear protective goggles or a face shield, and avoid directly looking at the UV source during exposure.
-
8
Immediately after exposure, bake the wafer on a hot plate at 95 °C to cross-link the exposed areas of the photoresist (Fig. 3d).
Critical Step
The post-baking time is determined by the photoresist thickness.
-
9
Cool down the wafer to room temperature. Submerge the wafer into SU-8 developer and manually agitate until all unexposed photoresist is removed. Briefly wash the tweezers with developer to remove the photoresist remaining on the tips (Fig. 3e).
Critical Step
The optimal development time varies with film thickness.
Caution
SU-8 developer is toxic and flammable. Handle only in a chemical fume hood with appropriate personal protective equipment.
-
10
Briefly rinse the wafer with isopropanol several times and then blow-dry it with a gentle stream of air (Fig. 3f).
-
11
When an ultrathick photoresist such as SU-8 2150 is used, hard-bake the wafer at 150 °C on a hot plate to improve the adhesion between the photoresist and wafer. Cool down the wafer before proceeding to the next step.
Critical Step
The optimal hard-baking time depends on the film thickness.
-
12
Inspect the master (i.e., photoresist patterned on the wafer) under a microscope to check whether the edges are sharp and the feature dimensions are the same as designed. Place the master in a closed 100-mm Petri dish for storage.
Pause point
The master can be stored in a dry and clean environment indefinitely.

Fabrication of PDMS devices
Timing 4.5 h plus overnight sterilization
-
13
Weigh PDMS prepolymer and curing agent at the ratio of 10:1 (RTV615A base: RTV615B curing agent) in a disposable polystyrene weighing dish. To ensure that the curing agent is evenly distributed, stir the mixture vigorously with a clean glass stirring rod until the mixture becomes milky. Avoid introducing dust particles into the PDMS mixture.
Critical Step
The ratio between the PDMS prepolymer components and thorough mixing are critical. If the curing agent is not sufficient and/or not mixed thoroughly, PDMS may not be completely cross-linked; such PDMS devices are easily torn upon insertion of tubing and electrodes.
Caution
Wear powder-free gloves when handling the PDMS prepolymer.
-
14
Place the weighing dish containing the PDMS mixture into a vacuum desiccator and evacuate the chamber. Degas under vacuum for 2 h until all bubbles disappear. Turn off the vacuum and slowly vent the desiccator.
-
15
Slowly pour the PDMS mixture over the master in a Petri dish. Take care not to introduce bubbles into the Petri dish. If there are still some bubbles remaining, remove them with a disposable transfer pipette or place the master/PDMS back under the vacuum for a while. For a 100-mm Petri dish, ∼30 g of the mixture is required to generate a ∼5 mm layer (Fig. 4a).
Figure 4: Schematic illustration of PDMS device fabrication using the silicon-wafer master. 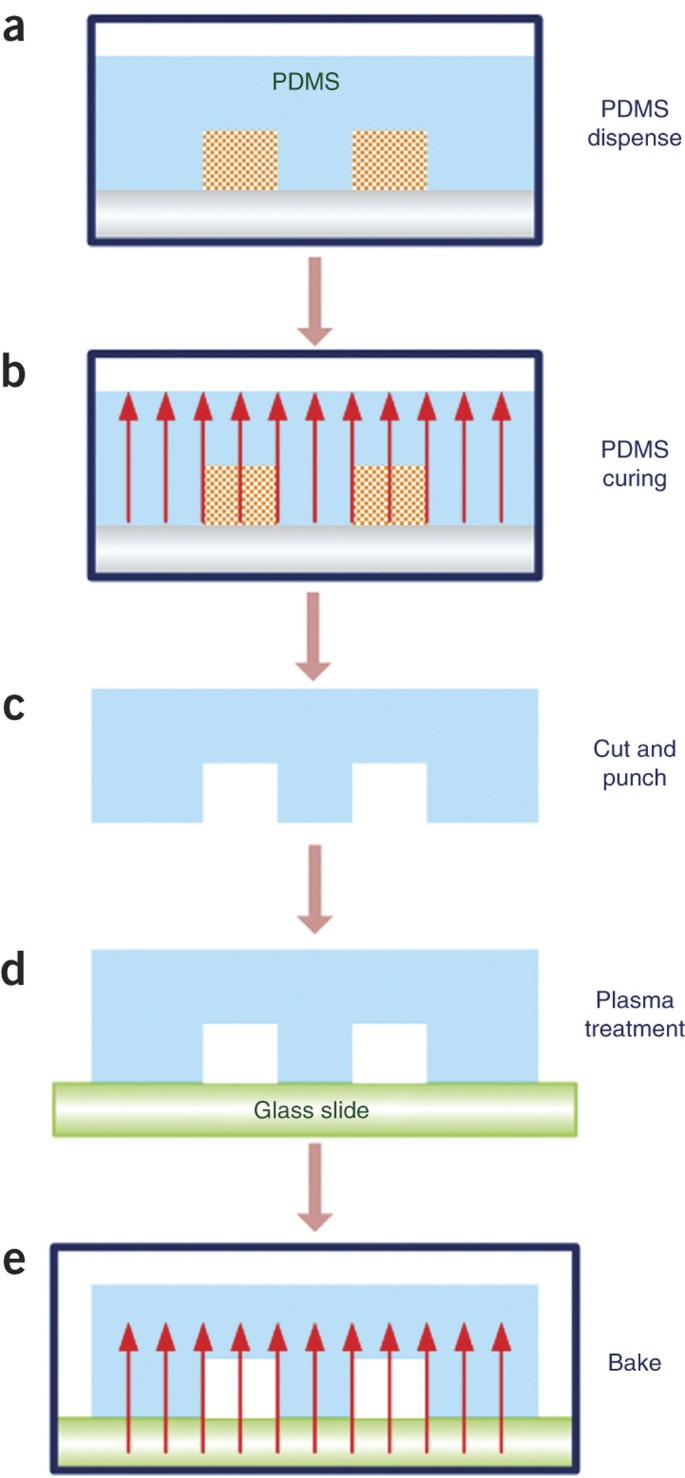
(a–e) Dispense degassed PDMS prepolymer and curing agent over the master that is placed in a Petri dish (Step 15) (a); cure PDMS in an oven at 80 °C (Step 16) (b); cut and punch access holes (Steps 17–19) (c); oxidize by plasma treatment and bond to a clean glass slide (Steps 20–22) (d); and bake to increase the bonding strength (Step 23) (e).
-
16
Cure PDMS in an oven at 80 °C for 1–2 h to generate a PDMS layer that is transparent and solid (Fig. 4b).
-
17
After cooling PDMS to room temperature, gently cut the patterned area of the cured PDMS replica with a razor blade and peel it from the master. Place it, with the feature side facing down, on a smooth bench surface covered by a clean sheet of aluminum foil. Cut the PDMS mold into the desired size. Avoid touching the PDMS surface with the feature (Fig. 4c).
Caution
The master is brittle and can be easily cracked by the razor blade. Do not exert excessive stress on the wafer when cutting.
-
18
Cut a thin slice of the PDMS device along the cross-section of the fluidic channel using a sharp razor blade. Place the slice onto a glass slide and measure the depth of the channel under a microscope with the help of a stage micrometer.
-
19
Punch an inlet hole (∼1 mm in diameter) and an outlet hole (∼5 mm to ∼10 mm in diameter for small-volume transfection; ∼1 mm in diameter for large-volume transfection) using a puncher of the correct size (Fig. 4c).
Critical Step
The punched holes should be slightly smaller than the outer diameter of the tubing to ensure a waterproof seal under fluidic pressure.
Pause point
The cured PDMS can be stored at room temperature for several days in a clean and closed container.
-
20
Remove dust particles from PDMS surface with paper tape. Use tweezers to place the PDMS and glass slide into the plasma cleaner chamber with the surfaces to be bonded facing up, and turn on the vacuum pump to evacuate the chamber for 5 min.
-
21
Turn on the plasma cleaner and set the RF (radio frequency) level to 'high' and open the needle valve slightly to let air into the chamber until a bright pink-violet glow is observed. Once it is stable, treat the PDMS and the slide with plasma for 1 min.
Critical Step
The oxygen plasma transforms Si-CH3 groups on the PDMS surface into Si-OH groups. The interaction between the plasma and the treated surfaces is determined by the intensity and frequency of the RF power, the pressure and flow rate of air, the treatment time and the characteristics of sample surfaces.
-
22
Set the RF level to 'off'. Turn off the plasma cleaner and vacuum pump. Open the needle valve slowly to vent the chamber. Remove the PDMS and glass slide with tweezers and avoid touching the surfaces that are to be bonded. Immediately bring the PDMS into contact against the slide to form closed channels. Press gently to remove air bubbles trapped at the interface between the PDMS and the glass if necessary (Fig. 4d).
-
23
Bake the whole device at 80 °C in the oven for another 1 h to enhance the bonding strength between PDMS and glass. (Fig. 4e)
Pause point
The PDMS devices can be stored at room temperature for several months in clean Petri dishes until use.
-
24
Sterilize the devices prior to experiments by UV irradiation in a laminar flow hood overnight or by flowing 70% (vol/vol) ethanol through the channel for at least 5 min and subsequently flowing ultrapure water for at least 5 min.

Cell and sample preparation
Timing ∼30 min
-
25
Harvest cells growing in exponential phase according to standard protocols (using trypsin-EDTA solution for adherent cells). Count cells with a hemocytometer. For CHO-K1 cells, culture to 80% confluence.
Critical Step
Cells to be transfected should be healthy and actively proliferating for best results, because the rapid cell division improves transport of DNA into the nucleus. Each cell line has a characteristic optimal confluency and should be regularly subcultured. CHO-K1 cells are passaged every 2 d at a ratio of 1:10. Approximately 2 × 10⁶ CHO-K1 cells are yielded in one 25 cm2 flask.
Critical Step
The number of cell passages is also essential for obtaining efficient gene transfer. The characteristics of cells (even immortalized cell lines) may change after repeated passages, leading to poor transfection.
Critical Step
Each cell type has its own optimal digestion time. Avoid overdigestion of cells, which reduces both transfection efficiency and cell viability.
Critical Step
If multiple culture flasks are used, mix all cell suspensions in one tube for cell counting to avoid variability.
-
26
Centrifuge the required number of cells at 300g for 5 min at room temperature.
-
27
Slowly aspirate and discard the supernatant, retain ∼50 μl of the liquid in the centrifuge tube to avoid cell damage. Add 4 ml of the electroporation buffer, and gently disperse the cell pellet by pipetting up and down until the cells are resuspended. Wash the cells by centrifuging at 300g for 5 min at room temperature and then resuspending in the electroporation buffer.
Critical Step
High shear stress induced by vigorous pipetting may damage cells and negatively affect cell transfection.
-
28
Repeat the wash step (Step 27) once.
-
29
Slowly aspirate and discard the supernatant and resuspend cells with an appropriate volume of the electroporation buffer to provide the required density of cells for experiments.
-
30
Combine the cell suspension with an appropriate amount of plasmid DNA solution to achieve the desired concentrations for cells and plasmid DNA. Gently mix the solution by pipetting several times.
Critical Step
Single cell suspension must be obtained at this point. Cell aggregates may reduce transfection efficiency and cell viability or even clog the channel.
Critical Step
The concentration of plasmid DNA affects transfection efficiency and cell viability. The optimal concentration depends on the target cell line and the type of DNA. Excessive amount of plasmids containing potent promoters such as the human cytomegalovirus (CMV) immediate early promoter are toxic to cells. Thus, we use 40 μg ml−1 of pEGFP-C1 plasmids (containing CMV promoter) and 2 × 10⁶ cells ml−1 of cells in the electroporation buffer.
-
31
Aliquot the mixture into microcentrifuge tubes with the volume for one experimental run in each tube. Leave them on ice.
Critical Step
In our hands, incubation of cells (suspended in the electroporation buffer) on ice decreases later cell death by electroporation. However, do not incubate cells on ice for longer than 1 h. Cells may become unhealthy after a long incubation on ice, resulting in reduced transfection efficiency and viability.
Flow-through electroporation
Timing 1–2 h
-
32
For flow-through electroporation (See system setup in Fig. 5a,b), two slightly different procedures can be used, depending on the transfected cell volume. Option A is for processing small volumes (≤500 μl) of cells (Fig. 5c). Option B is applied to large volumes (>500 μl) of cells (Fig. 5d). The electroporation should be performed in a laminar flow hood to reduce contamination. To observe the distribution of plasmid DNA on the cell surface after delivery, follow the procedure in Box 1 to stain the DNA with a fluorescent dye before electroporation. This is necessary when DNA delivery over the entire cell surface needs to be confirmed.
-
A
For small-volume (≤500 μl) cell transfection
-
i
Connect a length of 1/16-inch tubing to a 1-ml sterile Luer-tipped syringe with the help of the flangeless fittings system and a female Luer adaptor. Slide a 1/16-inch male flangeless nut and a 1/16-inch flangeless ferrule over the tubing in order. Finger-tighten the assembly into the female Luer adaptor. Insert the syringe into the Luer adaptor.
Critical Step
The tubing assembly is reusable and easy to replace. It should be sterilized by UV irradiation in a laminar flow hood overnight before the experiment.
-
ii
Draw the electroporation buffer into the syringe and tubing, and fix the syringe in a syringe pump.
-
iii
Insert the tubing filled with liquid into the device inlet as illustrated in Figure 5b. Extensively flush the channel with the electroporation buffer for at least 5 min to condition the channel and remove impurities. Prime the channel with the electroporation buffer. Gently pull out the tubing from the inlet.
Critical Step
Use a microscope to check whether there are air bubbles trapped in the channel, especially at the corners of the wide sections. The presence of bubbles may alter the electroporation conditions.
-
iv
Carefully insert one platinum wire into the inlet through the elastic PDMS wall. Connect the platinum wire to the negative terminal of the power supply by clipping the wire lead to the supporting copper wire prelinked with the platinum wire, as shown in Figure 5b.
-
v
Aspirate and discard the liquid in the outlet reservoir. Place the other platinum wire connected to the positive terminal of the power supply into the outlet reservoir (punched during fabrication, Step 19). Add a certain volume (depending on the size of the outlet reservoir) of the electroporation buffer into the outlet reservoir so that the platinum wire is in contact with the solution.
-
vi
Draw a short plug of air into the tubing by pulling the syringe piston carefully. Then draw the cell/DNA mixture into the tubing so that it is separated from the electroporation buffer in the tubing by the air plug. Fill the cell/DNA suspension to the end of the tubing and insert the end of the tubing into the inlet of the channel.
Critical Step
The volume of the air plug should be small enough to ensure accurate flow rate.
Critical Step
Before inserting tubing, ensure that the liquid reaches the end of the tubing to avoid introducing air bubbles into the channel. Bubbles may migrate with the flow, block the channel, and thus change the distribution of the electric field in the channel or even disconnect the current.
-
vii
Set the pump parameters (syringe diameter, infusion volume and flow rate) and the electric parameter (voltage). Turn on the DC power supply and the syringe pump simultaneously. Flow the cell/DNA solution through the device for electroporation, and collect cells from the outlet reservoir with a pipette. When the air plug reaches the channel inlet, turn off the pump and power supply promptly.
Critical Step
The applied voltage and flow rate can be determined using Equations (2) and (3).
Caution
Do not touch the leads of the power supply in order to avoid electric shock when the power is on.
-
i
-
B
For large-volume (>500 μl) cell transfection
-
i
Connect a length of 1/8-inch tubing to a 6-ml (or larger) sterile Luer-tipped syringe with the help of the flangeless fittings system and a female Luer adaptor. Slide a 1/8-inch male flangeless nut and a 1/8-inch flangeless ferrule over the tubing in order. Finger-tighten the assembly into the female Luer adaptor. Insert the syringe into the Luer adaptor. Insert a length of 1/16-inch tubing into the other end of 1/8-inch tubing to facilitate affixing to the inlet.
Critical Step
Use a syringe with the appropriate volume when working with large-volume cell samples.
-
ii
Draw the electroporation buffer into the syringe and tubing, and fix the syringe in a syringe pump.
-
iii
Insert the tubing filled with the buffer into the device inlet as illustrated in Figure 5b. Affix an additional length of 1/16-inch tubing to the outlet (which has a small punched hole instead of a reservoir), and place a tube (or other containers) at the other end of the outlet tubing to collect the transfected sample. Extensively flush the channel with the electroporation buffer for at least 5 min to condition the channel and remove impurities. Prime the channel with the electroporation buffer. The presence of bubbles may alter the electroporation conditions. Gently pull out the tubing from the inlet and outlet.
Critical Step
For large-volume transfection, the device outlet should have a small punched hole for affixing tubing, and cells are collected into a container.
-
iv
Carefully insert two platinum wires into the inlet and outlet, separately, through the elastic PDMS wall. Connect the platinum wire in the inlet to the negative terminal of the power supply and the one in the outlet to the positive terminal by clipping the wire leads to the supporting copper wires prelinked with the platinum wires, as shown in Figure 5b.
-
v
Draw the cell/DNA mixture into the tubing and the syringe. Fill the suspension to the end of the tubing and insert it into the inlet. Then also insert the other tubing into the outlet.
-
vi
Set the pump parameters (syringe diameter, infusion volume and flow rate) and the electrical parameter (voltage). Turn on the DC power supply and the syringe pump simultaneously. Flow the cell/DNA solution through the device for electroporation, and collect cells with a tube. When all liquid is infused, turn off the pump and power supply promptly. If the cell/DNA mixture has a substantial volume in the syringe and the processing time is longer than 5 min, place a small magnetic stir bar inside the syringe so that the solution can be periodically stirred by moving a magnet back and forth outside the syringe. This practice prevents settling of cells in the syringe.
-
i
Figure 5: The setup for flow-through electroporation. 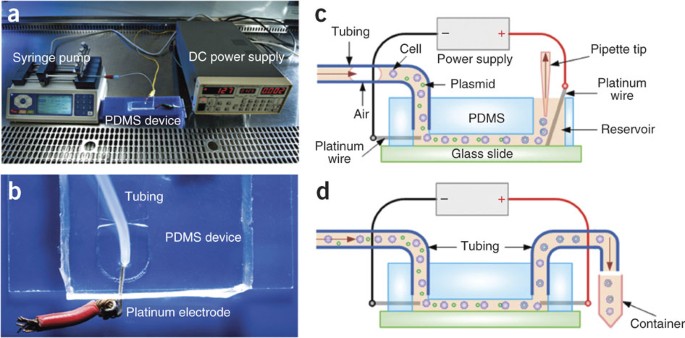
(a) The entire apparatus in operation. A mixture of cells and plasmid DNA in the electroporation buffer is introduced into the PDMS fluidic channel through plastic tubing affixed to the inlet, driven by a syringe pump. A power supply connected to two platinum wire electrodes establishes a constant voltage across the channel. The system is placed in a laminar flow hood during operation. (b) Details of the platinum electrode insertion into the channel. A platinum wire is used as an electrode and inserted into the inlet (and the outlet in the case of large-volume transfection) through elastic PDMS wall. A copper wire is prelinked with the platinum wire for connection with the wire leads of the power supply. The plastic tubing is inserted into a punched hole for transfer of the cell sample. (c) Schematic illustration of the setup for small-volume (≤500 μl) transfection. (d) Schematic illustration of the setup for large-volume (>500 μl) transfection.
-
A
-
33
Immediately transfer transfected cells to prewarmed culture medium in a culture plate or flask. Record the electric current for each run of electroporation for comparisons between experiments. A stable current indicates smooth operation.
-
34
If necessary, reload the syringe and repeat Steps 32 and 33 until the entire cell sample is treated.
Critical Step
It is advisable to use a new device for each run especially when a different DNA or cell type is used.


Transfection and viability assays
Timing 0.5 h per sample
-
35
For transient expression, examine cells at 24–72 h post-transfection to evaluate expression of the transfected gene and cell viability by staining with PI. Centrifuge the sample at 300g for 5 min at room temperature so that the floating cells settle at the bottom of wells or culture flasks.
Critical Step
The optimal assay time depends on the growth rate of the cell line and the specific expression characteristics of the transfected gene. The expression of EGFP in CHO-K1 cells reaches its peak at 48 h after electroporation.
-
36
Gently aspirate and discard the supernatant. Rinse the cells with prewarmed PBS.
-
37
Aspirate and discard the PBS. Add PI working solution (1 μg ml−1 of PI in PBS) and incubate at room temperature in the dark for 20 min to stain dead cells.
Caution
PI is a suspected carcinogen. Wear safety equipment when working with this dye and dispose of it properly.
-
38
Capture both phase-contrast and fluorescent images of cells at 10 different locations in each sample using an inverted phase-contrast/epifluorescence microscope equipped with an ×20 dry objective and a CCD camera. (For EGFP: excitation maximum = 488 nm; emission maximum = 507 nm. For PI: excitation maximum = 493 nm; emission maximum = 632 nm.)
-
39
Use image analysis software such as ImageJ to enumerate a population of at least 1,500–2,000 cells in each sample.
Critical Step
When working with a large number of cells, flow cytometry can also be used to analyze the transfection efficiency and the cell viability.
-
40
Calculate the transfection efficiency (the percentage of cells expressing EGFP among viable cells) and cell viability (the percentage of viable cells among the total cells processed).
Critical Step
Every data point should be based on at least three experimental trials, and expressed as percentage ± s.d.
Troubleshooting
Troubleshooting advice can be found in Table 2.
Timing
Steps 1 and 2, Design and printing of photomasks: 1 h for design and 1–4 d for printing
Steps 3–12, Fabrication of masters: 0.5–3.5 h, depending on the photoresist thickness
Steps 13–23, Fabrication of PDMS devices: 4.5 h
Step 24, Sterilization of PDMS devices: overnight
Steps 25–31, Cell and sample preparation: ∼30 min
Steps 32–34, Flow-through electroporation: typically 1–2 h, depending on the sample amount
Steps 35–40, Transfection and viability assays: 0.5 h per sample
Box 1, Observing plasmid DNA distribution on cell surface: 2 h
Anticipated results
This protocol enables continuous transfection of cells by flow-through electroporation in PDMS fluidic channels with alternating wide and narrow section(s). Here we show typical results for transfection of CHO-K1 cells by pEGFP-C1 plasmid DNA. Figure 6, panel c shows the transfection efficiency and cell viability when DNA delivery is conducted using a channel with its design in Figure 2a (having a depth of 480 μm and 5 narrow sections). The total voltage V of 763 V is applied (leading to 800 V cm−1 in the narrow sections and 53 V cm−1 in the wide sections), whereas the flow rate Q changes from 1.87 to 4.36 ml min−1 (corresponding to T2 ranging from 7.7 to 3.3 ms). Longer T2 increases the transfection efficiency while reducing the cell viability. An optimal transfection efficiency as high as 75% is achieved with T2 of 7.7 ms (with Q of 1.87 ml min−1). Figure 6d shows the results obtained with the device having a depth of 412 μm and five narrow sections as depicted in Figure 2b. The total voltage V of 784 V is applied (generating 800 V cm−1 in the narrow sections and 80 V cm−1 in the wide sections), whereas the flow rates are varied in the range of 3.94–19.7 ml min−1 (corresponding to T2 ranging from 5.5 to 1.1 ms). The cell viability under these conditions is very high (93–98%) and the highest transfection efficiency achieved is 36%.

(a–d) The typical phase-contrast image (a), fluorescent image (b) and results (c,d) of CHO-K1 cell transfection by pEGFP-C1 plasmids following our protocol. The data shown in a–c are obtained using the device in Figure 2a. The data in d are obtained using the device in Figure 2b. Cell images are taken at 48 h post-electroporation. The transfection efficiency and cell viability vary with the total duration in the narrow sections (T2) under the identical field intensity (E2 = 800 V cm−1). All data points are generated by triplicate experiments. Modified from ref. 35 with permission from Elsevier.
Figure 7 shows the effects of hydrodynamics on flow-through electroporation. Using the devices shown in Figure 2c (a microscale channel with one straight narrow section) and Figure 2d (a channel with the same dimensions as the one in Figure 2c except a spiral narrow section), fluorescently labeled DNA molecules are delivered for observing the difference in the uptake. The epifluorescence and reconstructed 3D confocal images in Figure 7a indicate that the delivery is limited to one pole of a cell when the flow-through electroporation is conducted in the device in Figure 2c with a short T2 of 0.5 ms. In comparison, when T2 is increased to 5 ms with the same device, the delivery occurs via a circular strip around the cell (Fig. 7b), revealing the fact that the permeabilization is no longer limited to the cell poles due to the cell rotation. Furthermore, when the device with a spiral narrow section (shown in Fig. 2d) is used, the generated secondary Dean flow gives rise to combined vortex motion and rotation that render the entire cell surface permeabilized and delivered with DNA (Fig. 7c), with the same electric parameters used as in the device with the straight narrow section. Figure 7d,e shows the transfection efficiency and cell viability when the devices in Figure 2c,d are used under the same operational parameters (Q = 150 μl min−1, V = 207–363 V and these conditions generate T2 of 5 ms and E2 of 400–700 V cm−1). The data indicate that the device with a spiral narrow section yields much higher transfection efficiency without seriously compromising cell viability.

(See designs shown in Fig. 2c,d). (a–c) Epifluorescence images (i) and 3D reconstruction images generated by confocal fluorescence imaging (ii) of CHO-K1 cells delivered with YOYO-1–labeled pEGFP-C1 plasmids. The images in (ii) focus on representative individual cells from the cell populations shown in (i). (a–c) Cells are processed in the device (a) with a straight narrow section (E2 = 900 V cm−1; T2 = 0.5 ms); (b) with a straight narrow section (E2 = 700 V cm−1; T2 = 5 ms); and (c) with a spiral narrow section (E2 = 700 V cm−1; T2 = 5 ms). The images are taken immediately after electroporation (see procedure detailed in Box 1). (d,e) The results on CHO-K1 cell transfection by pEGFP-C1 plasmid. The transfection efficiency (d) and cell viability (e) vary with E2 under the fixed flow rate Q of 150 μl min−1 and T2 of 5 ms. All data points are generated by triplicate experiments, and two-tailed Student's t test is applied to evaluate the data. (*) indicates significant difference at P < 0.05 and (**) indicates significant difference at P < 0.01. Modified from ref. 36 with permission from the Royal Society of Chemistry.
References
Blattman, J.N. & Greenberg, P.D. Cancer immunotherapy: a treatment for the masses. Science 305, 200–205 (2004).
Kershaw, M.H., Teng, M.W., Smyth, M.J. & Darcy, P.K. Supernatural T cells: genetic modification of T cells for cancer therapy. Nat. Rev. Immunol. 5, 928–940 (2005).
Gersbach, C.A., Phillips, J.E. & Garcia, A.J. Genetic engineering for skeletal regenerative medicine. Annu. Rev. Biomed. Eng. 9, 87–119 (2007).
Kumar, S., Chanda, D. & Ponnazhagan, S. Therapeutic potential of genetically modified mesenchymal stem cells. Gene Ther. 15, 711–715 (2008).
Wong, G.K. & Chiu, A.T. Gene therapy, gene targeting and induced pluripotent stem cells: applications in monogenic disease treatment. Biotechnol. Adv. 29, 1–10 (2011).
Hacein-Bey-Abina, S. et al. LMO2-associated clonal T cell proliferation in two patients after gene therapy for SCID-X1. Science 302, 415–419 (2003).
Hacein-Bey-Abina, S. et al. Insertional oncogenesis in 4 patients after retrovirus-mediated gene therapy of SCID-X1. J. Clin. Invest. 118, 3132–3142 (2008).
Yang, Y. et al. Cellular immunity to viral antigens limits E1-deleted adenoviruses for gene therapy. Proc. Natl. Acad. Sci. USA 91, 4407–4411 (1994).
Knowles, M.R. et al. A controlled study of adenoviral-vector-mediated gene transfer in the nasal epithelium of patients with cystic fibrosis. N. Engl. J. Med. 333, 823–831 (1995).
Raper, S.E. et al. Fatal systemic inflammatory response syndrome in a ornithine transcarbamylase deficient patient following adenoviral gene transfer. Mol. Genet. Metab. 80, 148–158 (2003).
Miller, D.G., Rutledge, E.A. & Russell, D.W. Chromosomal effects of adeno-associated virus vector integration. Nat. Genet. 30, 147–148 (2002).
Nakai, H. et al. Large-scale molecular characterization of adeno-associated virus vector integration in mouse liver. J. Virol. 79, 3606–3614 (2005).
Bell, P. et al. Analysis of tumors arising in male B6C3F1 mice with and without AAV vector delivery to liver. Mol. Ther. 14, 34–44 (2006).
Donsante, A. et al. AAV vector integration sites in mouse hepatocellular carcinoma. Science 317, 477 (2007).
Luo, D. & Saltzman, W.M. Synthetic DNA delivery systems. Nat. Biotechnol. 18, 33–37 (2000).
Segura, T. & Shea, L.D. Materials for non-viral gene delivery. Annu. Rev. Mater. Res. 31, 25–46 (2001).
Montier, T. et al. Non-viral vectors in cystic fibrosis gene therapy: progress and challenges. Trends Biotechnol. 22, 586–592 (2004).
Fedorov, Y. et al. Different delivery methods—different expression profiles. Nat. Methods 2, 241 (2005).
Chang, D.C., Chassy, B.M., Saunders, J.A. & Sowers, A.E. (eds). Guide to Electroporation and Electrofusion (Academic Press, 1992).
Neumann, E., Schaefer-Ridder, M., Wang, Y. & Hofschneider, P.H. Gene transfer into mouse lyoma cells by electroporation in high electric fields. EMBO J. 1, 841–845 (1982).
Prausnitz, M.R., Bose, V.G., Langer, R. & Weaver, J.C. Electroporation of mammalian skin: a mechanism to enhance transdermal drug delivery. Proc. Natl. Acad. Sci. USA 90, 10504–10508 (1993).
Rols, M.P. et al. In vivo electrically mediated protein and gene transfer in murine melanoma. Nat. Biotechnol. 16, 168–171 (1998).
Aihara, H. & Miyazaki, J. Gene transfer into muscle by electroporation in vivo. Nat. Biotechnol. 16, 867–870 (1998).
Weaver, J.C. & Chizmadzhev, Y.A. Theory of electroporation: a review. Bioelectroch. Bioener. 41, 135–160 (1996).
Teissie, J., Golzio, M. & Rols, M.P. Mechanisms of cell membrane electropermeabilization: a minireview of our present (lack of ?) knowledge. Biochim. Biophys. Acta. 1724, 270–280 (2005).
Huang, Y. & Rubinsky, B. Flow-through micro-electroporation chip for high efficiency single-cell genetic manipulation. Sens. Actuators A Phys. 104, 205–212 (2003).
Lu, H., Schmidt, M.A. & Jensen, K.F. A microfluidic electroporation device for cell lysis. Lab. Chip 5, 23–29 (2005).
Fei, Z. et al. Gene transfection of mammalian cells using membrane sandwich electroporation. Anal. Chem. 79, 5719–5722 (2007).
Valero, A. et al. Gene transfer and protein dynamics in stem cells using single cell electroporation in a microfluidic device. Lab. Chip 8, 62–67 (2008).
Marc, P.J., Sims, C.E., Bachman, M., Li, G.P. & Allbritton, N.L. Fast-lysis cell traps for chemical cytometry. Lab. Chip 8, 710–716 (2008).
Skelley, A.M., Kirak, O., Suh, H., Jaenisch, R. & Voldman, J. Microfluidic control of cell pairing and fusion. Nat. Methods 6, 147–152 (2009).
Andre, F. & Mir, L.M. DNA electrotransfer: its principles and an updated review of its therapeutic applications. Gene Ther. 11 (Suppl 1) S33–S42 (2004).
Tekle, E., Astumian, R.D. & Chock, P.B. Selective and asymmetric molecular transport across electroporated cell membranes. Proc. Natl. Acad. Sci. USA 91, 11512–11516 (1994).
Golzio, M., Teissie, J. & Rols, M.P. Direct visualization at the single-cell level of electrically mediated gene delivery. Proc. Natl. Acad. Sci. USA 99, 1292–1297 (2002).
Geng, T. et al. Flow-through electroporation based on constant voltage for large-volume transfection of cells. J. Control Release 144, 91–100 (2010).
Wang, J., Zhan, Y., Ugaz, V.M. & Lu, C. Vortex-assisted DNA delivery. Lab. Chip 10, 2057–2061 (2010).
Cavazzana-Calvo, M. et al. Gene therapy of human severe combined immunodeficiency (SCID)-X1 disease. Science 288, 669–672 (2000).
Morgan, R.A. et al. Cancer regression in patients after transfer of genetically engineered lymphocytes. Science 314, 126–129 (2006).
Luo, D. & Saltzman, W.M. Enhancement of transfection by physical concentration of DNA at the cell surface. Nat. Biotechnol. 18, 893–895 (2000).
Mueller-Hartmann, H. Method and circuit arrangement for treating biomaterial. US patent 2006/0094095 A1 (2006).
Riemen, G. et al. Buffer solution for electroporation and a method comprising the use of the same. US patent 2005/0064596 A1.
Muller-Hartmann, H. & Habig, M. Container and device for generating electric fields in different chambers. US patent 2006/0087522 A1 (2006).
Kim, J.A. et al. A novel electroporation method using a capillary and wire-type electrode. Biosens. Bioelectron. 23, 1353–1360 (2008).
Li, L.H. et al. Highly efficient, large volume flow electroporation. Technol. Cancer Res. Treat. 1, 341–350 (2002).
Wang, H.Y. & Lu, C. Electroporation of mammalian cells in a microfluidic channel with geometric variation. Anal. Chem. 78, 5158–5164 (2006).
Wang, H.Y. & Lu, C. Microfluidic electroporation for delivery of small molecules and genes into cells using a common DC power supply. Biotechnol. Bioeng. 100, 579–586 (2008).
Acknowledgements
This work was supported by Wallace H. Coulter Foundation Early Career Award, National Science Foundation grants CBET 1016547 and CBET 0967069, and United States Department of Agriculture grant USDA-NRI 2009-35603-05059. We thank K.G. Cornetta and V. Ugaz for helpful discussion and technical assistance.
Author information
Authors and Affiliations
Contributions
C.L. conceived the general design for flow-through electroporation with constant voltage. T.G., J.W., Y.Z. and C.L. designed the experiments. T.G. and Y.Z. performed experiments on large-volume transfection and analyzed the data. J.W. and Y.Z. performed experiments on vortex-assisted gene delivery and analyzed the data. T.G., Y.Z. and C.L. wrote the manuscript.
Corresponding author
Ethics declarations
Competing interests
The authors declare no competing financial interests.
Rights and permissions
About this article
Cite this article
Geng, T., Zhan, Y., Wang, J. et al. Transfection of cells using flow-through electroporation based on constant voltage. Nat Protoc 6, 1192–1208 (2011). https://doi.org/10.1038/nprot.2011.360
Published:
Issue Date:
DOI: https://doi.org/10.1038/nprot.2011.360
This article is cited by
-
On-chip multiplexed single-cell patterning and controllable intracellular delivery
Microsystems & Nanoengineering (2020)
-
Nanotechnologies in delivery of mRNA therapeutics using nonviral vector-based delivery systems
Gene Therapy (2017)
-
Immunomagnetic separation of tumor initiating cells by screening two surface markers
Scientific Reports (2017)
-
Mechanical oscillations enhance gene delivery into suspended cells
Scientific Reports (2016)
-
Paramagnetic Structures within a Microfluidic Channel for Enhanced Immunomagnetic Isolation and Surface Patterning of Cells
Scientific Reports (2016)
Comments
By submitting a comment you agree to abide by our Terms and Community Guidelines. If you find something abusive or that does not comply with our terms or guidelines please flag it as inappropriate.
