
Abstract
Here we present a detailed protocol for in situ multiple fluorescence monitoring of adenosine-5′-triphosphate (ATP) and guanosine-5′-triphosphate (GTP) in MCF-7 breast cancer cells by using graphene oxide nanosheet (GO-nS) and DNA/RNA aptamers. FAM-labeled ATP aptamer and Cy5-modified GTP aptamer are used to construct the multiple aptamer/GO-nS sensing platform through 'π-π stacking' between aptamers and GO-nS. Binding of aptamers to GO-nS guarantees the fluorescence resonance energy transfer between fluorophores and GO-nS, resulting in 'fluorescence off'. When the aptamer/GO-nS are transported inside the cells via endocytosis, the conformation of the aptamers will change on interaction with cellular ATP and GTP. On the basis of the fluorescence 'off/on' switching, simultaneous sensing and imaging of ATP and GTP in vitro and in situ have been realized through fluorescence and confocal microscopy techniques. In this protocol, we describe the synthesis of GO and GO-nS, preparation of aptamer/GO-nS platform, in vitro detection of ATP and GTP, and how to use this platform to realize intracellular ATP and GTP imaging in cultured MCF-7 cells. The preparation of GO-nS is anticipated to take 7–14 d, and assays involving microscopy imaging and MCF-7 cells culturing can be performed in 2–3 d.
Introduction
Simultaneous sensing and imaging of multiple molecules inside living cells is a powerful technique for exploring protein functions in biological systems or for elucidating dynamic biological processes such as metabolic activity, cell proliferation, apoptosis, receptor occupancy, reporter gene expression and antigen modulation1,2,3. Nucleotides have important roles in metabolism and in metabolic control. Among them, ATP and GTP are found as typical energy molecules regulating various biological processes. Accordingly, a suitable in situ analyzing platform for simultaneous ATP and GTP visualization in living cells is highly desirable. To this end, a variety of analytical approaches have been developed for highly selective and sensitive detection of ATP and/or GTP molecules4,5,6,7,8,9. However, the development of sensing agents for ATP and/or GTP detection still remains a major challenge in the field of molecular imaging.
Fluorescent probes used for ATP or GTP detection
At present, artificial fluorescent probes based on synthetic chemicals have been used for ATP or GTP detection. These include 2,2′-dipicolylamine-zinc(II), polythiophene derivative, benzimidazolium dyes, sandwich-stacking of pyrene-adenine-pyrene, and so on10,11,12,13,14,15,16,17,18,19,20. However, most of these sensing probes are only being used for in vitro assays, and their potential for live-cell imaging is highly limited because they are not able to go through the cell membrane. For example, it is difficult to apply the fluorescent polythiophene or trisulfonate derivative to image cellular ATP or GTP despite their selectivity in aqueous solution17,20. More recently, promising approaches for ATP and/or GTP detection based on aptamers have been developed. Aptamers are nucleic acids that are isolated from combinatorial oligonucleotide libraries by in vitro selection on the basis of their binding to a specific ligand of interest. The target versatility, the high binding affinity and specificity make aptamers fascinating as molecular tools for bioanalytical applications21,22,23. To date, ATP aptamer sensors that involve fluorescent, electrochemical and colorimetric methods have been reported in numerous studies24,25. Unfortunately, lack of intracellular transportation for aptamer probes restricts their further applications in cellular sensing in vivo.
Graphene oxide nanomaterials
By using the chemically modified graphene oxide nanomaterials, we and others have successfully performed graphene-based biosensing and biochemical analysis26,27,28,29,30,31,32,33,34,35. Recently, our group has developed a proof-of-concept analyzing assay for cellular ATP detection in living cells36. This method has fully used GO-nS as a multifunctional unit as a robust quencher for fluorescent dye, an efficient carrier for aptamer probes and also a strong protector regarding enzymatic cleavage. GO-nS is a chemically modified graphene oxide with a small size (<100 nm) and a narrow size distribution. As a functionalized nanomaterial, GO-nS features (i) efficient cell-membrane permeability, (ii) low toxicity and (iii) sensitive detectability by confocal microscopy. It is reported that nanomaterials are taken up by cells in different ways, including clathrin-mediated endocytosis, caveolae-mediated endocytosis and phagocytosis, which are highly dependent on cell types and physicochemical properties of nanomaterials such as size, charge, elemental composition, surface area and surface chemistry37. In the present protocol, the cell-membrane permeability and the aptamer probe transportation of GO-nS are mainly derived from its small size, good dispersing ability in physiological environment and chemical composition.
In addition, GO-nS has shown marked enzymatic cleavage protection for aptamer probe. As we know, most biological probes, such as mRNA and molecular beacons, are easily degraded by cellular enzymes or digested by cellular nucleases, which limits their applications in living-cell studies. Therefore, delivery of aptamer probes into cells while protecting the fluorescent aptamers from enzymatic cleavage is a key step toward facilitating the biological application of aptamers. To date, only a few nanomaterials (such as carbon nanotubes, silica nanoparticles and gold nanoparticles) have demonstrated protective capabilities during molecular transport. Agarose gel electrophoresis is included in the PROCEDURE (Box 1) so that the GO-nS–dependent protection of aptamer from enzymatic cleavage can be confirmed. We have also included the procedure for performing an enzymatic cleavage protection test. It is not necessary to do this routinely for cellular target monitoring or cell imaging, but if the cellular sensing performance is poor or if cell imaging has failed, this is an important quality control step for GO-nS.
GO-nS shows promise as an artificial nanomaterial in cell imaging and in situ monitoring, because of its ability to adsorb DNA coupled with its quenching capacity for fluorophores (FAM and Cy5, for example, when labeled to ATP aptamer and GTP aptamer) with a wide energy transfer range. In this protocol, we systematically summarize the preparation and characterization of GO-nS, and report the detailed procedures for applying this GO-nS–based sensing technology to the simultaneous cellular imaging of ATP and/or GTP38.

Monitoring and imaging multiple analytes
The results so far obtained using the present protocol indicate that GO-nS-based sensing system holds promise for the monitoring and imaging of multiple analytes in living cells. For example, on the basis of the principle of complementary base pairing or aptamer recognition ability, a dye-labeled DNA probe or aptamer probe could interact with the complementary target DNA sequences or target proteins, respectively, in the cells to be studied. With the formation of a DNA double helix (probe DNA/target DNA) or combinatorial structures (aptamer probe/target protein), the fluorescence of quenched dye molecules is recovered with the splitting of ds-DNA or combinatorial aptamer/protein structures from the GO-nS–sensing platform. These designs, with the help of the GO-nS–based sensing platform, will be capable of cellular simultaneous imaging studies of other analytes and biomarkers. One concern that needs to be pointed out here is the necessity of the cell viability assay (Box 2). We recommend using the cell viability assay for quality control of GO-nS before cell imaging, especially when using different cell lines. The cell viability assay is not a necessary step for cell experiments if the procedure works well.

Description of the method
To validate the utility of this technology in our study, we used fluorescent dye–labeled DNA/RNA aptamers and GO-nS to create the sensing platform36,38. By taking advantage of aptamers and GO-nS, we can load ATP- and GTP-selective aptamer probes onto GO-nS through self-assembly and realize the cellular delivering successfully. Owing to the electron acceptor effect of GO-nS, we can obtain an obvious fluorescent off/on switch and real-time target detection in living cells. In addition, GO-nS shows excellent protection for DNA/RNA from enzymatic cleavage and it shows good biocompatibility with living cells in studies. Figure 1 shows the workflow of the in situ molecular probing in living cells by using aptamer/GO-nS nanocomplexes.

The procedure comprises the preparation of specimens for analysis, preparation of GO-nS and imaging analysis.
Experimental design
Preparation of GO-nS. GO was synthesized by the Hummers and Hoffman method with some modifications, followed by strong sonication to disperse GO in water and centrifugation to remove large GO layers. It is worth mentioning that commercial graphene or GO materials are available for purchase, which would simplify the protocol; researchers could then skip ahead to 'Preparation of GO-nS' (Steps 15–21). To obtain graphene oxide particles that are of sufficiently small (<100 nm) and uniform size to form acceptable graphene oxide solutions, we use high-power sonication in a strong basic environment at low temperature. To demonstrate that GO-nS is more water-soluble and stable than chemically synthesized graphene oxide, we carried out the characterizations of prepared GO-nS materials and provided the details in supporting information. Detailed information and supporting experiments comparing GO and GO-nS can be found in Supplementary Figures 1,2,3,4,5,6,7,8 and in our previous study and its supporting information file (ref. 36; http://pubs.acs.org/doi/suppl/10.1021/ja103169v/suppl_file/ja103169v_si_001.pdf). It is important to check the quality of GO-nS on the basis of various characterization approaches, such as the dispersing ability in reaction buffer and cell culture medium with the naked eye, transmission electron microscopy (TEM), X-ray diffraction (XRD), and Raman and Fourier transform IR (FT-IR) spectroscopy.
Configuration of the DNA/RNA aptamer/GO-nS sensing platform. Figure 2 shows the basic concept of the proposed sensing platform. Aptamers are short, single-stranded oligonucleotides that are selected by an in vitro method known as SELEX (systematic evolution of ligands by exponential enrichment). At present, aptamers have been used in many applications ranging from fundamental studies to therapeutic research39,40. The first RNA aptamer with high specificity for the GTP molecule was reported by Szostak and co-workers in 2002 (refs. 41,42,43,44,45). This RNA aptamer is able to target GTP by forming a loop structure with Kd values ranging from 9 nM to 8 μM. Here we design the multiple sensing platform by loading the DNA/RNA aptamers on GO-nS.

Binding of ATP aptamer–FAM and GTP aptamer–Cy5 to GO-nS leads to fluorescence 'off' owing to the FRET between fluorophores and GO-nS. After incorporating the analytes (ATP or GTP), loop-structured assemblies of aptamer-ATP and aptamer-GTP are released from GO-nS and result in fluorescence 'on'. In situ simultaneous probing of ATP and GTP in living cells can consequently be done by using this fluorescence off/on switch concept.
GO-nS has a large surface-to-volume ratio, and the planar structure provides a suitable substrate for assembling multiple probes. By using carboxyfluorescein (FAM)-labeled ATP aptamer and cyanine-5 (Cy5)-modified GTP aptamers, we can achieve the multiple targeting of ATP and GTP simultaneously. Aptamers are strongly anchored onto the GO-nS surface through 'π-π stacking'34,36,38. As shown in Figure 2, binding of aptamers to GO-nS guarantees the close proximity of dyes to the graphene surface. The subsequent efficient long-range energy transfer from dye to GO-nS results in rapid and complete fluorophore quenching. In direct contrast, after interaction with ATP or GTP, the aptamers will change into stable and internal loop structures. The weak binding ability of the loop-structured assembly of the aptamer/target to GO-nS keeps fluorophores far away from the quencher surface, leading to fluorescence recovery of FAM or Cy5. As a result, fluorescence signals will appear again when the emission scan is acquired.
In situ molecular probing in living cells by using an aptamer/GO-nS nanocomplex. By referring to previous studies of drug delivery and tumor diagnostics using graphene derivates, we believe that GO-nS is a suitable tool for visualization of multiple nucleotides based on the fluorescent off/on switch mechanism. This can be demonstrated by incubating MCF-7 cells (a human breast cancer cell line) with aptamer/GO-nS complex consisting of ATP aptamer–FAM, GTP aptamer–Cy5 and GO-nS. We use a confocal microscope to capture the cell-imaging photos (Fig. 2). Fortunately, the pictures show bright fluorescent signals corresponding to FAM and Cy5 tagged on DNA or RNA aptamers released from the complex after interaction with cellular adenine derivates (including ATP, AMP and adenine) and guanosine derivates. In this protocol, we test the total amount of adenine derivates (including ATP, AMP and adenine) and guanosine derivates in living cells.
Advantages and limitations of this protocol to investigate in situ cellular nucleotides. There are a number of protocols available to investigate the live-cell imaging probes (see refs. 46,47,48,49 for instance). Here we only focus on the advantages and limitations of the present imaging method in comparison with some other methods reported previously for ATP or GTP detections and imaging (Table 1). We also discuss the advantages and specificity of this protocol for studying molecular probing in living cells in situ:
-
i
GO-nS is a 2D nanomaterial with a large surface/volume ratio. The GO-nS surfaces are considered as active surfaces for the loading of aptamer probes, as well as for immobilization. As a result, we could achieve multiple loading of aptamer probes with higher efficiency by using GO-nS in this protocol.
-
ii
Charge carriers in graphene obey a linear dispersion relation near the Fermi energy and behave as massless Dirac fermions, as observed in the quantum Hall effect and the ambipolar electric field effect. Because of these unique properties, GO-nS exhibits super-quenching ability during the FRET process. The high quenching efficiency makes GO-nS a sensitive sensing platform for fluorescence detection and monitoring of the target species.
-
iii
Generally, we use commercial transfection agents such as Lipofectamine to transfect either plasmids or DNA or RNA in a general molecular biology laboratory. However, such a lipid agent can only act as a carrier and realize the transportation of DNA or RNA through the cell membrane. In the protocol that we report, GO-nS not only enables transportation but also acts as a sensing platform with high fluorescence quenching efficiency and provides protection of the probe DNA against enzyme cleavage.
Although this protocol is aimed at introducing a universal living-cell sensing platform, it is worth mentioning that several concerns need to be pointed out and there may be a need to modify this protocol for specific studies. First, we have tested two different cell types, including mouse epithelial cells (JB6 Cl 41-5a) and human breast adenocarcinoma cells (MCF-7 cells, (ATCC,HTB-22)), using our probes, wherein the cell imaging procedure conditions such as working concentrations and incubation times are determined. Therefore, it is possible that for other cell types this procedure may not be optimal and need modification. Second, although toxicity is minimal at working concentration, the probes show some signs of toxicity at higher concentrations, especially after long cell culture time (>70 h). If the readers need to carry out long-term online monitoring, additional studies would be essential to establish a new working procedure. The third limitation concerns the synthesis and preparation of GO-nS, as well as the aptamer/GO-nS nanocomplex. Sufficient characterizations such as by TEM, XRD, Raman spectroscopy and so on should be carried out to confirm that the material is up to grade. Still, control of the size of GO-nS, as well as the size distribution, might be one of the foremost challenges for the protocol. For this reason, we limited our application of this protocol to ATP and GTP so far; modifications to this procedure might yet be necessary to satisfy the unique criteria of specific molecular profiling applications such as microRNAs and mRNAs.
Materials
REAGENTS
Caution
All chemicals and reactions used in this protocol are potentially harmful, and thus a lab coat, gloves and eye protection should be used.
-
Double-distilled water (from a Barnstead NANO Pure UV ultrapure water system)
-
Graphite powder (<45 μm, ≥99.99%; Sigma-Aldrich, cat. no. 496596-113.4G)
-
Sulfuric acid (H2SO4; Sigma-Aldrich, cat. no. 339741-100ML)
Sulfuric acid is highly corrosive.
-
Potassium peroxodisulfate (K2S2O8; Sigma-Aldrich, cat. no. P5592-500G)
-
Phosphorus pentoxide (P2O5; Sigma-Aldrich, cat. no. 431419-50G)
-
Potassium permanganate (KMnO4; Sigma-Aldrich, cat. no. 399124-25G)
-
Hydrogen peroxide solution (H2O2; 35 wt% solution in H2O, J&K Scientific, cat. no. 916404)
Hydrogen peroxide solution is highly toxic.
-
Hydrochloric acid (HCl; Sigma-Aldrich, cat. no. 84415-100ML)
HCl is highly volatile.
-
Sodium hydroxide (NaOH; Sigma-Aldrich, cat. no. S8045-500G)
-
Magnesium chloride (MgCl2; Sigma-Aldrich, cat. no. 208337-100G)
-
Potassium chloride (KCl; Sigma-Aldrich, cat. no. P5405-250G)
-
EDTA disodium salt, dihydrate (Sigma-Aldrich, cat. no. E9884-100G)
-
ATP disodium salt hydrate (Sigma-Aldrich, cat. no. A26209-1G)
-
GTP disodium salt hydrate (Sigma-Aldrich, cat. no. G8877-25MG)
-
Cytidine 5′-triphosphate disodium salt (CTP; Sigma-Aldrich, cat. no. C1506-10MG)
-
Thymidine 5′-triphosphate sodium salt (TTP; Sigma-Aldrich, cat. no. T0251-10MG)
-
Trypan blue (Cellgro, cat. no. 25-900-CI)
-
Agarose (Sigma-Aldrich, cat. no. A9414-10G)
-
Trypsin-EDTA (0.25% (wt/vol) solution; GIBCO, cat. no. 25300-054)
-
FBS (Invitrogen, cat. no. 10099133)
-
DNase I (Amp Grade 100 U; Invitrogen, cat. no. 18068-015)
-
SYBR Green nucleic acid gel stain starter kit (Invitrogen, cat. no. S-7580)
-
10-bp DNA ladder (Invitrogen, cat. no. 10821-015)
-
TrackIt cyan/orange loading buffer (Invitrogen, cat. no. 10482-028)
-
PBS buffer (10× concentrate; Sigma-Aldrich, cat. no. P5493-1L)
-
TBE buffer (Ambion 10× TBE solution, 44.5 mM Tris-borate and 1 mM EDTA (pH 8.3); Invitrogen, cat. no. AM9863)
-
Fluorophore carboxy fluorescein–labeled ATP aptamer (5′-FAM/AACCTGGGGGAGTATTGCGGAGGAAGGT-3′, ordered from Integrated DNA Technologies)
-
Cy5-labeled GTP aptamer (5′-Cy5/GGGACGAAGUGGUUGGGUGUGAAAACGUCCC-3′, ordered from Integrated DNA Technologies)
-
Alexa Fluor 546–labeled random DNA (Alex546N; 5′-AF546/TCTAAATCGCTATGGTCGC-3′, ordered from Integrated DNA Technologies)
-
MEM culture medium with Earle's salts and L-glutamine (GIBCO, cat. no. 11095-080)
-
MCF-7 cells (ATCC, HTB-22)
Human cell cultures are biohazardous and potentially infectious materials. Human cell cultures must be handled in biosafety level 2 (BSL-2) facilities by trained certified personnel. Proper personal protective equipment should be used while handling human cell cultures. Refer to local biosafety regulations for specific requirements.
EQUIPMENT
-
Glass beaker, 100 ml, 500 ml and 1 liter
-
Round-bottomed flask, 100 ml
-
Allihn condenser, 500 mm
-
Stirring bar with magnetic core, polytetrafluoroethylene-coated (Fisher Scientific)
-
Büchner funnel, 142 mm
-
Filter flask, 500 ml
-
Nylon film (142 mm, 0.2 μm; Pall, cat. no. 66604)
-
Membrane dialysis tubing
-
Hot plate magnetic stirrer with contact thermometer oil bath (Fisher Scientific)
-
Vacuum pump (Gast)
-
Glass-bottom six-well clear plates (Corning, cat. no. 3335)
-
Centrifuge tubes (1.5 ml; Eppendorf, cat. no. 31810)
-
Clear-bottom dishes, 96 wells, for fluorescent assays (Corning, cat. no. 3583)
-
Glass-bottom clear cell culture dishes, 20 mm diameter, for confocal imaging (Nest, cat. no. 801001)
-
Microcentrifuge (Thermo Scientific)
-
Eppendorf pipettes
-
NANO Pure UV ultrapure water system (Barnstead, model no. D11911)
-
Atomic force microscope (with Nanoscope III, Veeco)
-
Transmission electron microscope (JEOL TEM 2010)
-
X-ray powder diffraction meter (D8-Advance, Bruker)
-
Raman microprobe system (Renishaw, RM200)
-
FT-IR spectrometer (Perkin Elmer)
-
Enduro 7.7 horizontal gel box (Labnet, model no. E1007-7)
-
CO2 incubator (Thermo Scientific)
-
NucleoVision imaging system with UV irradiation (NucleoTech)
-
Laser-scanning confocal microscope (Zeiss, LSM 710 NLO)
REAGENT SETUP
Binding buffer for ATP and GTP assay
-
To 200 ml of binding buffer, add 180 ml of water and 20 ml of 10× PBS directly into a glass bottle with 2.984 g of KCl, 95.3 mg of MgCl2 and 7.45 mg of EDTA. Allow the powder to completely dissolve in PBS. This solution can be capped and stored at 4 °C for 2 weeks.
Critical
ATP, GTP, TTP and DTP solutions should be prepared with binding buffer (not water) to maintain the concentration of binding buffer during the binding reaction between aptamers and nucleotides.
TBE buffer for electrophoresis
-
To 500 ml of TBE buffer, add 450 ml of water and 50 ml of 10× TBE directly into a glass bottle with 0.372 g of EDTA. Allow the powder to completely dissolve in TBE. This solution can be capped and stored at 4 °C for 2 weeks.
Cells for imaging
-
MCF-7 cells should be cultured in a glass–bottomed microscope dish at 37 °C in a humidified 5% CO2 atmosphere such that they are ∼50–80% confluent on the day of imaging. Complete cell culture medium is combined with complete MEM medium, 0.01 mg/ml bovine insulin and 10% (wt/vol) FBS. For live-cell imaging experiments, seed 6 × 10⁴ cells in 500 μl of complete MEM medium into each glass–bottomed microscope dish, and incubate the dishes at 37 °C for 36 h to ensure that each well has reached ∼70% confluency before adding the aptamer/GO-nS complex.
Washing buffer for confocal imaging
-
To 200 ml of washing buffer in a glass bottle, add 180 ml of water and 20 ml of 10× PBS.
Critical
Washing buffer is used to replace the cell culture medium during confocal imaging. At this point, washing buffer should be prewarmed to 37 °C.
EQUIPMENT SETUP
Confocal microscope
-
Our Zeiss LSM 710 NLO laser-scanning confocal microscope is equipped with an upright Zeiss Axioexaminer stand. The objective is a W Plan-Apo 20× with a numerical aperture (NA) of 1.0 and a water-dipping objective. The laser excitation wavelength for ATP aptamer–FAM is 488 nm (green), for GTP aptamer–Cy5 it is 633 nm (red) and for random DNA sequence–Alex546N it is 561 nm (orange).
Procedure
Synthesis of graphene oxide
Timing 7–14 d
-
1
To a 250-ml round-bottomed flask, add 2 g of graphite powder, 3.0 g of K2S2O8, 3.0 g of P2O5, and then 12 ml of concentrated H2SO4.
-
2
Turn on the hot plate with a magnetic stirrer, and then set the oil-bath temperature to 80 °C.
-
3
Fit this round-bottomed flask to a condenser circulating with cold water, turn on the magnetic stirrer and heat the solution at reflux for 4.5 h.
Caution
The experiment should be handled carefully in a ventilated fume hood.
-
4
Allow the flask to cool down to room temperature (25 °C), and then dilute the reaction solution with 500 ml of water.
Pause point
The reaction solution can be allowed to cool for up to 12 h, or the solution can be stirred overnight (up to 12 h).
-
5
Remove the solvent by vacuum filtration using a Büchner funnel with a 0.2-μm Nylon film. Wash the solid products three times with water and dry them naturally.
-
6
Place a 500-ml round-bottomed flask in an ice bath. Keep the temperature at ∼0 °C. Put the solid products into a 500-ml round-bottomed flask and add 150 ml of H2SO4.
Caution
H2SO4 is a strong oxidizing agent, and it should be precooled to 0 °C before use.
-
7
Add 25 g of KMnO4 gradually into the reaction solution. Mix and stir the solution at 35 °C for 2 h.
-
8
Dilute the reaction solution with 250 ml of water, and keep the water-bath temperature under 50 °C.
Caution
H2SO4 is a strong oxidizing agent, and the reaction is vigorously exothermic.
Critical Step
The H2O2 should be added very slowly in a drop-by-drop manner.
-
9
Transfer the reaction solution into a 2-liter glass baker, add 1 liter of water gradually, and then add 30 ml of 30% (vol/vol) H2O2 drop by drop.
Critical Step
The H2O2 should be added drop by drop. Keep observing the mixture. The color of the solution is supposed to be light brown, and the reaction is supposed to produce vast bubbles.
-
10
Remove the solvent by vacuum filtration using a Büchner funnel with a 0.2-μm Nylon film. Wash the solid products three times with 1 liter of 10% (vol/vol) HCl and 1 liter of water several times, respectively. Dry the solid products naturally.
-
11
Prepare 0.5% (wt/vol) graphite oxide solution with water, and remove the free iron or oxidizing molecules from the solution by dialysis.
Pause point
Transfer the sample into dialysis tubing, tightly seal it and put it into a 2-liter beaker containing 1 liter of water. The dialysis bag should be sealed tightly to avoid leakage of the sample. The dialysis could last for 2 weeks.
-
12
Remove the solvent by vacuum filtration and dry it using a vacuum pump at or lower than 30 °C for 6 h.
-
13
Prepare 0.1 mg/ml graphite oxide dispersion with water and then sonicate it for 40 min to ensure exfoliation.
-
14
Remove the solvent by vacuum filtration, collect the resulting brown precipitate and dry it under vacuum overnight at 25 °C.
Pause point
At this point, the solid can be stored in the dryer for at least 2 months.
Preparation of GO-nS
Timing 7 h
-
15
Prepare a 0.2 mg/ml GO solution with water, and then sonicate it in a water bath for 2 h.
-
16
Transfer the solution into an ice bath, and turn on a strong sonification with power of 40 W (4 min/sonication × 5 sonications). The ice bath should be changed after each treatment to keep the sample temperature below 5 °C.
-
17
Add NaOH solution (14 mol per liter NaOH solution) to the resultant solution, to obtain a final concentration of 5M NaOH, and then sonicate it in a water bath for 2 h (sonicating power is 40 W).
-
18
Add 10 % (vol/vol) HCl until the solution is pH neutral.
-
19
Autoclave the resulting solution at 80 °C for 1 h.
-
20
Centrifuge the autoclaved solution at 1,6128g for 10 min at 25 °C, and designate the supernatant as GO-nS.
Critical Step
The resultant GO solution (Step 19) should be sterilized in order to be suitable for cell analysis, and the centrifugation steps should be carried out in a biology hood to ensure that the samples remain sterile.
-
21
Analyze the GO-nS samples using AFM, TEM (Supplementary Fig. 1), XRD (Supplementary Fig. 2), Raman spectroscopy (Supplementary Fig. 3) and FT-IR spectroscopy (Supplementary Fig. 4).
Pause point
At this point, the solid can be stored at 4 °C for at least 3–4 weeks.
In vitro detection of multiple nucleotides with the aptamer/GO-nS complex
-
22
Use option A for the single-aptamer/GO-nS complex, or use option B for the dual-aptamer/GO-nS complex. In addition, you could also perform an assay to demonstrate that the GO-nS complex protects the aptamers from endonuclease cleavage (Box 1 and Table 2).
-
A
Quenching ability test for single-aptamer and single-nucleotide detection based on the single-aptamer/GO-nS complex
-
i
To a 96-well, flat-bottomed polypropylene black plate, add 85, 86, 87, 88, 88.5, 89, 89.5 and 90 μl of binding buffer; next, add 0, 0.5, 1, 1.5, 2, 3, 4 and 5 μl of a 100 μg/ml GO-nS solution and 10 μl of 100 nM ATP aptamer or GTP aptamer stock solution in binding buffer (see Reagent Setup) to a final concentration of 0, 0.5, 1, 1.5, 2, 3, 4 and 5 μg/ml GO-nS with a total volume of 100 μl in each well. Shake the plate gently for 5 min to ensure good mixing. This test should be performed in triplicate; there should be three data points for each GO-nS concentration measured.
-
ii
Acquire the fluorescence intensity of FAM or Cy5 (excitation/emission) via a Tecan Safire 2 microplate reader 5 min after the mixing (Fig. 3a,b).
Figure 3: Fluorescence quenching ability test of GO-nS for single or multiple aptamer probes. 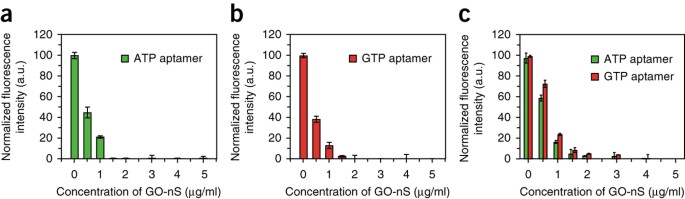
(a–c) Normalized fluorescence intensity of 100 nM ATP aptamer–FAM (a), 100 nM GTP aptamer–Cy5 (b) and the mixture of 100 nM ATP aptamer–FAM and 100 nM GTP aptamer–Cy5 (c) versus the concentration of GO-nS from 0.5 to 5 μg/ml in reaction buffer. Error bars show mean ± s.d. and were obtained from three parallel experiments. Excitation wavelength for FAM: 470 nm; for Cy5: 650 nm. a.u., arbitrary units. This figure is adapted with permission from our previously published work, copyright 2013 American Chemical Society38.
-
iii
By using a new plate, add 3 μl of 100 μg/μl GO-nS solution and 10 μl of 100 nM ATP aptamer or GTP aptamer stock solution in binding buffer to a final concentration of 100 nM single-aptamer/GO-nS complex. Add ATP or GTP stock solution (2 mM or 20 mM) to a final ATP or GTP concentration of 0, 0.01, 0.1, 0.5, 1, 1.5 and 2 mM, respectively (the total volume of the reaction solution is 100 μl in each well). Place the plate on a gentle shaker to ensure good mixing and then incubate the plate at 25 °C for 1 h.
-
iv
Acquire the fluorescence intensity of FAM or Cy5 (excitation/emission) via a Tecan Safire 2 microplate reader. This test should be performed in triplicate.
-
v
Analyze the data of ATP or GTP detection based on single-aptamer/GO-nS complex, as shown in Supplementary Figure 5. After incubation with ATP or GTP for 60 min, FAM or Cy5 fluorescence should be recovered linearly over the range of ATP or GTP concentrations.
Timing 100 min
-
i
-
B
Quenching ability test for dual-aptamer and multiple-nucleotide detection based on a multiple-aptamer/GO-nS complex
-
i
To a 96-well, flat-bottomed polypropylene black plate, add 75, 76, 77, 78, 78.5, 79, 79.5 and 80 μl of binding buffer, 10 μl of 100 nM ATP aptamer–FAM and 10 μl of 100 nM GTP aptamer–Cy5 simultaneously in binding buffer; next, add 100 μg/ml GO-nS solution to a final concentration of 0, 0.5, 1, 1.5, 2, 3, 4 and 5 μg/ml GO-nS with a total binding buffer of 100 μl in a 96-well plate. Shake the plate gently for 5 min to ensure thorough mixing. Perform the test in triplicate by representing each solution in three wells of the plate.
-
ii
Acquire the fluorescence intensity of FAM and Cy5 (Fig. 3c).
-
iii
By using a new plate, add 10 μl of 100 nM ATP aptamer–FAM and 10 μl of 100 nM GTP aptamer–Cy5 simultaneously in binding buffer; next, add 5 μl of a 100 μg/ml GO-nS solution to a final concentration of 5 μg/ml GO-nS. Repeat the option eight times to prepare eight sample wells.
-
iv
Next, add ATP, GTP, CTP or TTP stock solutions, respectively, to each well to make a final concentration of 0.5 mM and 2 mM for each nucleotide. Place the plate on a gentle shaker gently to ensure good mixing and then incubate it at 25 °C for 1 h.
-
v
Acquire fluorescence intensity of FAM and Cy5 (excitation/emission) via a Tecan Safire 2 microplate reader.
-
vi
Analyze the data obtained from the fluorescence spectrum, an example of which shown in Figure 4.
Figure 4: Selective response to ATP, GTP, CTP and TTP based on the aptamer/GO-nS sensing platform by recording the respective fluorescence channel. 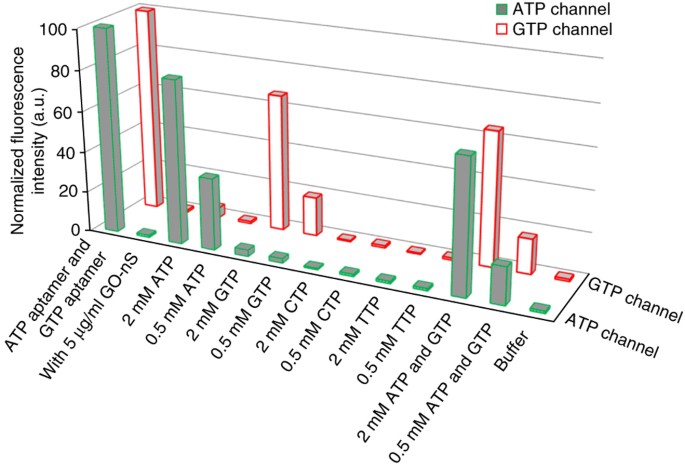
Green with gray fill indicates the FAM channel; red indicates the Cy5 channel. Normalized fluorescence intensity of the mixture of 100 nM ATP aptamer–FAM and 100 nM GTP aptamer–Cy5 in reaction buffer is shown in (ATP aptamer and GTP aptamer). After injection of GO-nS, fluorescence was quenched (with 5 μg/ml GO-nS). By incubating ATP aptamer–FAM/GTP aptamer–Cy5/GO-nS complexes with 0.5 and/or 2 mM ATP, GTP, CTP or TTP for 1 h at 25 °C, respectively (shown in the corresponding columns), fluorescence recovery was obtained. Excitation wavelength for FAM: 470 nm; for Cy5: 650 nm. This figure is adapted with permission from our previously published work, copyright 2013 American Chemical Society38.
Timing 2 h
-
i
Table 2 Experimental recommendations for electrophoretic reagent setup. Critical Step
As far as possible, keep the plates in a dark place (usually we use foil to wrap the bottle or the 96-well plate, and we place bottles or plates in a cabinet or in drawers) to protect the fluorophores from photobleaching.
-
A


In situ live-cell imaging of multiple nucleotides
Timing 1.5–2.5 d
-
23
For live-cell imaging experiments, seed 6 × 10⁴ cells in 500 μl of complete MEM medium into each glass–bottomed microscope dish, and incubate the dishes at 37 °C for 24–36 h to ensure that each well has reached 50–70% confluency before adding the GO-nS or aptamer/GO-nS complex (Step 24). Each dish contains 1 ml of culture medium. Keep the cell dish as a control, without any options, until confocal imaging.
-
24
Prepare 5 ml of cell culture medium (see Reagent Setup) with a GO-nS or aptamer/GO-nS complex to obtain a final concentration of 100 nM. For GO-nS incubated with cells, dilute the stock solution of GO-nS (Step 20) with cell culture medium to obtain a final concentration of 3 μg/ml. For the ATP aptamer/GO-nS complex, prepare a 100-μl solution of 100 nM ATP aptamer–FAM with 3 μg/ml GO-nS; for the GTP aptamer/GO-nS complex, prepare a 100-μl solution of 100 nM GTP aptamer–Cy5 with 3 μg/ml GO-nS; for a multiple aptamer/GO-nS complex, prepare a 100-μl solution of 100 nM ATP aptamer–FAM, 100 nM GTP aptamer–Cy5 and 100 nM random DNA–Alex546N with 5 μg/ml GO-nS. Because of the adsorption interaction between aptamers or single-stranded DNA and GO-nS, an aptamer/GO-nS nanocomplex can be formed through self-assembly while completely mixing (optional). At this point, you can also prepare samples to perform the cell viability assay (Box 2) to check that none of the components are toxic to cells.
-
25
When the cells have reached ∼50–70% confluency, remove the culture medium from each dish and wash the cells with 1 ml of PBS once.
Critical Step
The washing PBS buffer should be prewarmed to 37 °C.
-
26
Add different cell culture media into different cell dishes according to the table given below.
Table 4
Control test
Use the above-mentioned cell culture methods to grow the cells
Coculture with aptamer probe
Incubate the cells with 1 ml of complete MEM cell medium consisting of 100 nM ATP aptamer-FAM, 100 nM GTP aptamer–Cy5 and 100 nM random DNA–Alex546N for 6 h at 37 °C under 5% CO2
Coculture with multiple aptamer/GO-nS complexes
Mix ATP aptamer–FAM/GO-nS, GTP aptamer–Cy5/GO-nS and random DNA–Alex546N/GO-nS nanocomplex solutions to a final concentration of 100 nM with 5 μg/ml GO-nS. Incubate the cells with 1 ml of complete MEM cell medium consisting of 100 nM ATP aptamer–FAM/GO-nS, 100 nM GTP aptamer–Cy5/GO-nS and 100 nM random DNA–Alex546N/GO-nS for 6 h at 37 °C under 5% CO2
-
27
Incubate the cells at 37 °C, 5% CO2 for 6 h. Remove the culture medium from each dish and rinse the cells three times with fresh PBS buffer.
-
28
Turn on the Zeiss LSM 710 NLO laser-scanning confocal microscope and allow at least 60 min of warm-up time before use. Start the ZEN 2009 light program.
-
29
Obtain fluorescence images using an equal exposure time for all experiments with the appropriate filter. Expected imaging results can be found in Figure 5. The maximum excitation wavelength and maximum emission wavelengths for ATP aptamer–FAM are 495 and 520 nm (green), for GTP aptamer–Cy5 they are 650 and 670 nm (red) and for random DNA–Alex546N they are 556 and 573 nm (orange).
Figure 5: Confocal images of in situ visualization for ATP and GTP. 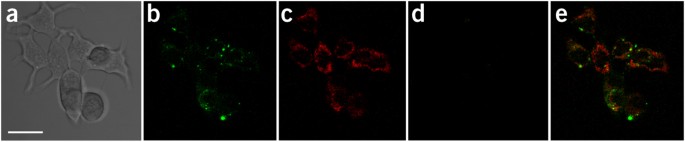
Images represent MCF-7 cells incubated in completed EME medium for 6 h with 100 nM ATP aptamer–FAM/GO-nS, 100 nM GTP aptamer–Cy5/GO-nS and 100 nM random DNA-Alex546N/GO-nS. (a–d) Panel a is the bright-field image of MCF-7 cells, panel b is the channel of FAM, panel c is the channel of Cy5 and panel d is the channel of Alex546N. The merged fluorescent panels for confocal images are shown in panel e. Images were captured by confocal microscopy after extensive washing of cells with PBS. Scale bar, 10 μm.
-
30
To perform an experiment in which cells are incubated with different concentrations of aptamer/GO-nS nanocomplex, prepare 5 ml of cell culture medium with the multiple aptamer/GO-nS complex to make a final concentration of 25, 50, 100 and 200 nM, respectively. Next, add different cell culture media into different cell dishes and incubate them at 37 °C, 5% CO2 for 6 h. Remove the culture medium from each dish and rinse the cells three times with fresh PBS buffer solution. Obtain fluorescence images using equal exposure time.
Critical Step
All of the imaging parameters should be kept the same in order to compare the signal in each image.

Troubleshooting
Troubleshooting advice can be found in Table 3.
Timing
Steps 1–14, synthesis of graphene oxide: 7–14 d
Steps 15–20, preparation of GO-nS: 7 h
Step 21, characterization of GO-nS: 8 h
Step 22A, GO-nS quenching ability test: 100 min
Step 22B, nucleotide detection and selectivity test: 2 h
Steps 23–30, in situ live-cell imaging of multiple nucleotides, pre–cell culture (1–2 d), co–cell culture (6–8 h) and confocal imaging (1–2 h)
Box 1, cleavage protection of aptamer probes by GO-nS (optional), 4.5 h
Box 2, determine the cell viability by performing trypan blue exclusion (optional), 3–6 d
Anticipated results
Preparation and characterization of the aptamer/GO-nS nanocomplex
Before using the aptamer/GO-nS nanocomplex for simultaneous bioimaging of cellular ATP and GTP, the aptamer/GO-nS nanocomplex should be characterized. Generally, GO-nS for biological applications should have a small and homogeneous size and good water solubility. GO-nS should also possess efficient fluorescence quenching performance to satisfy our sensing platform. A representative AFM and TEM images (Supplementary Fig. 1), an XRD (Supplementary Fig. 2), a Raman spectrum (Supplementary Fig. 3), and an FT-IR spectrum (Supplementary Fig. 4) are shown in the supplementary information.
ATP aptamer–FAM and/or GTP aptamer–Cy5 quenched with GO-nS are shown in Figure 3. As can be seen, a higher GO-nS concentration up to 5 μg/ml is ideal for quenching ATP aptamer–FAM and GTP aptamer–Cy5 concurrently (Fig. 3c). After incubation of 10 μM to 2.5 mM ATP or GTP, fluorescence recovery of up to 85.7% should be obtained owing to the specificity between aptamers and their targets. The loop-structured assembly of the aptamer and target no longer has good affinity for GO-nS; therefore, the fluorophores are further away from the quencher (GO-nS) surface and the fluorescence of the dyes can be detected.
We carried out a test of aptamer versus nucleotide specificity by specifically monitoring the appropriate excitation/emission wavelengths for FAM and Cy5 dyes (FAM excitation 495 nm/emission 520 nm; Cy5 excitation 650 nm/emission 670 nm). We observed selective release of ATP aptamer or GTP aptamer owing to the high specific interaction between the aptamer and the target. However, for CTP and TTP, no obvious change was obtained (Fig. 4). From Figure 4, we can confirm that multiple aptamers could be adsorbed onto GO-nS while retaining good specificity for their respective triphosphates to dissociate from the aptamer/GO-nS complex.
Incubation of cultured cells with multiaptamer/GO-nS complexes
By incubating MCF-7 cells with multiaptamer/GO-nS complexes consisting of ATP aptamer–FAM, GTP aptamer–Cy5 and random DNA–Alex546N for 6 h, typical confocal images of living MCF-7 cells can be obtained by following the described protocol for cellular ATP and GTP imaging, and examples are shown in Figure 5. Figure 5a shows the bright-field image of MCF-7 cells treated with the aptamer/GO-nS nanocomplex, whereas Figure 5b,c shows the fluorescence signal derived from ATP aptamer–FAM and GTP aptamer–Cy5. Figure 5d shows little or no fluorescence signal from the random DNA aptamer (random DNA–Alex546N was designed as a reference probe to evaluate the specificity of this platform in living cells). These images can be combined into a single image via the different color channels shown in Figure 5e. In addition, it is very hard to observe fluorescence signals in the cells incubated without GO-nS. From Figure 5, we can confirm that the GO-nS–sensing platform can deliver multiple aptamer probes into living cells and successfully realize the in situ visualization of ATP and GTP simultaneously. Moreover, application of aptamer-FAM/GO-nS in real-time monitoring demonstrates that the aptamer/GO-nS is evident in the intracellular region (Supplementary Fig. 6). On the basis of our design, as culture time elapses, more aptamers will enter into the cells and then form duplexes with cellular ATP, followed by fluorescence recovery. Real-time monitoring of cellular ATP in JB6 cells (mouse epithelial cells, JB6 Cl 41-5a) has been performed by using a wide-field microscope in our previous work36. When culture time took up to 4 h, the fluorescence intensity of JB6 cells incubated with aptamer-FAM/GO-nS increased notably compared to the cells cultured with GO-nS or aptamers only. In general, fluorescence intensity inside cells derived from aptamer-FAM/GO-nS increases as culture time elapses. Hence, real-time or even online observation of the intracellular transportation, as well as cellular ATP or GTP monitoring, can be performed for up to 8 h after incubation with the present protocol. The optimized time window for cell imaging is 8–8.5 h after incubation.
Stability to treatment with DNase
Further investigation of GO-nS for biosensing applications has been demonstrated using electrophoresis. DNase I, which can nonspecifically cleave single- and double-stranded DNA, is used to simulate enzymatic cleavage functions in living cells. As shown in Supplementary Figure 7, incubation of ATP aptamer–FAM with DNase I (0.2 units/μl) for 15 or 40 min shows a vivid migration due to the enzymatic cleavage (lanes 3 and 4), relative to ATP aptamer–FAM control without any DNase I (lane 2). In contrast, the ATP aptamer–FAM/GO-nS complex is difficult to cleave with DNase I after 15 or 40 min of incubation, as shown in lanes 6 and 7 (the aptamer-FAM/GO-nS without DNase is shown in lane 5). We use the 10-bp DNA ladder as marker and load it in lane 1. The results demonstrate that single-stranded DNA is effectively and promptly adsorbed onto GO-nS, and that the DNA is strongly restrained on a graphene oxide surface, which prevents the DNase from approaching the DNA molecule.
Cell viability assays
Meanwhile, for in situ target monitoring in living cells, the aptamer/GO-nS complex is expected to be of good biocompatibility and low toxicity. Consequently, we investigated whether GO-nS reduced cell viability in MCF-7 cells as an initial test case (Supplementary Fig. 8). GO-nS showed negligible effects on cell viability at concentrations ≤7 μg/ml. We observed toxicity at the highest concentration (9 μg/ml) by 72 h. The results demonstrate that GO-nS exhibited negligible effects on the growth of MCF-7 cells with concentrations lower than 7 μg/ml when the postculture time was <72 h.
References
Herschman, H.R. Molecular imaging: looking at problems, seeing solutions. Science 302, 605–608 (2003).
Baker, M. Cellular imaging: taking a long, hard look. Nature 466, 1137–1140 (2010).
Massoud, T.F. & Gambhir, S.S. Molecular imaging in living subjects: seeing fundamental biological processes in a new light. Genes Dev. 17, 545–580 (2003).
Imamura, H. et al. Visualization of ATP levels inside single living cells with fluorescence resonance energy transfer-based genetically encoded indicators. Proc. Natl. Acad. Sci. USA 106, 15651–15656 (2009).
Tsuboi, T., Lippiat, J.D., Ashcroft, F.M. & Rutter, G.A. ATP-dependent interaction of the cytosolic domains of the inwardly rectifying K+ channel Kir6.2 revealed by fluorescence resonance energy transfer. Proc. Natl. Acad. Sci. USA 101, 76–81 (2004).
Berg, J., Hung, Y.P. & Yellen, G. A genetically encoded fluorescent reporter of ATP: ADP ratio. Nat. Methods 6, 161–166 (2009).
Wang, W.U., Chen, C., Lin, K.H., Fang, Y. & Lieber, C.M. Label-free detection of small-molecule-protein interactions by using nanowire nanosensors. Proc. Natl. Acad. Sci. USA 102, 3208–3212 (2005).
Bell, C.J., Manfredi, G., Griffiths, E.J. & Rutter, G.A. Luciferase expression for ATP imaging: application to cardiac myocytes. Methods Cell Biol. 80, 341–352 (2007).
Jose, D.A. et al. Colorimetric sensor for ATP in aqueous solution. Org. Lett. 9, 1979–1982 (2007).
Lee, D.H., Kim, S.Y. & Hong, J.I. A fluorescent pyrophosphate sensor with high selectivity over ATP in water. Angew. Chem. Int. Ed. 43, 4777–4780 (2004).
Sancenón, F., Descalzo, A.B., Martínez-Mánñz, R., Miranda, M.A. & Soto, J. A colorimetric ATP sensor based on 1,3,5-triarylpent-2-en-1,5-diones. Angew. Chem. Int. Ed. 40, 2640–2643 (2001).
Mizukami, S., Nagano, T., Urano, Y., Odani, A. & Kikuchi, K. A fluorescent anion sensor that works in neutral aqueous solution for bioanalytical application. J. Am. Chem. Soc. 124, 3920–3925 (2002).
Schneider, S.E., O'Neil, S.N. & Anslyn, E.V. Coupling rational design with libraries leads to the production of an ATP selective chemosensor. J. Am. Chem. Soc. 122, 542–543 (2000).
Wang, S.L. & Chang, Y.T. Combinatorial synthesis of benzimidazolium dyes and its diversity directed application toward GTP-selective fluorescent chemosensors. J. Am. Chem. Soc. 128, 10380–10381 (2006).
McCleskey, S.C., Griffin, M.J., Schneider, S.E., McDevitt, J.T. & Anslyn, E.V. Differential receptors create patterns diagnostic for ATP and GTP. J. Am. Chem. Soc. 125, 1114–1115 (2003).
Kwon, J.Y. et al. Fluorescent GTP-sensing in aqueous solution of physiological pH. J. Am. Chem. Soc. 126, 8892–8893 (2004).
Neelakandan, P.P., Hariharan, M. & Ramaiah, D. A supramolecular ON-OFF-ON fluorescence assay for selective recognition of GTP. J. Am. Chem. Soc. 128, 11334–11335 (2006).
Xu, Z. et al. Unique sandwich stacking of pyrene-adenine-pyrene for selective and ratiometric fluorescent sensing of ATP at physiological pH. J. Am. Chem. Soc. 131, 15528–15533 (2009).
Ojida, A. et al. Bis(Dpa-Zn-II) appended xanthone: excitation ratiometric chemosensor for phosphate anions. Angew. Chem. Int. Ed. 45, 5518–5521 (2006).
Li, C., Numata, M., Takeuchi, M. & Shinkai, S. A sensitive colorimetric and fluorescent probe based on a polythiophene derivative for the detection of ATP. Angew. Chem. Int. Ed. 44, 6371–6374 (2005).
Nutiu, R. & Li, Y.F. Structure-switching signalling aptamers. J. Am. Chem. Soc. 125, 4771–4778 (2003).
Nutiu, R. & Li, Y.F. In vitro selection of structure-switching signaling aptamers. Angew. Chem. Int. Ed. 117, 1085–1089 (2005).
Li, N. & Ho, C.-M. Aptamer-based optical probes with separated molecular recognition and signal transduction modules. J. Am. Chem. Soc. 130, 2380–2381 (2008).
Liu, J. & Lu, Y. Fast colorimetric sensing of adenosine and cocaine based on a general sensor design involving aptamers and nanoparticles. Angew. Chem. Int. Ed. 45, 90–94 (2006).
Zayats, M., Huang, Y., Gill, R., Ma, C. & Willner, I. Label-free and reagentless aptamer-based sensors for small molecules. J. Am. Chem. Soc. 128, 13666–13667 (2006).
Geim, A.K. Graphene: status and prospects. Science 324, 1530–1534 (2009).
Liu, X.Q., Aizen, R., Freeman, R., Yehezkeli, O. & Willner, I. Multiplexed aptasensors and amplified DNA sensors using functionalized graphene oxide: application for logic gate operations. ACS Nano 6, 3553–3563 (2012).
Liu, B.W., Sun, Z.Y., Zhang, X. & Liu, J.W. Mechanisms of DNA sensing on graphene oxide. Anal. Chem. 85, 7987–7993 (2013).
Huang, P.J. & Liu, J.W. Molecular beacon lighting up on graphene oxide. Anal. Chem. 84, 4192–4198 (2012).
Chen, D., Feng, H. & Li, J. Graphene oxide: preparation, functionalization, and electrochemical applications. Chem. Rev. 112, 6027–6053 (2012).
Wang, Y., Li, Z.H., Wang, J., Li, J.H. & Lin, Y.H. Graphene and graphene oxide: biofunctionalization and applications in biotechnology. Trends Biotechnol. 29, 205–212 (2011).
Wang, Y., Lu, J., Tang, L.H., Chang, H.X. & Li, J.H. Graphene oxide amplified electrogenerated chemiluminescence of quantum dots and its selective sensing for glutathione from thiol-containing compounds. Anal. Chem. 81, 9710–9715 (2009).
Liu, Z., Robinson, J.T., Sun, X.M. & Dai, H.J. PEGylated nanographene oxide for delivery of water-insoluble cancer drugs. J. Am. Chem. Soc. 130, 10876–10877 (2008).
Lu, C.H. et al. Using graphene to protect DNA from cleavage during cellular delivery. Chem. Commun. 46, 3116–3118 (2010).
Chang, H.X., Tang, L.H., Wang, Y., Jiang, J.H. & Li, J.H. Graphene fluorescence resonance energy transfer aptasensor for the thrombin detection. Anal. Chem. 82, 2341–2346 (2010).
Wang, Y. et al. Aptamer/graphene oxide nanocomplex for in situ molecular probing in living cells,. J. Am. Chem. Soc. 132, 9274–9276 (2010).
Nel, A.E. et al. Understanding biophysicochemical interactions at the nano-bio interface. Nat. Mat. 8, 543–557 (2009).
Wang, Y. et al. In situ live cell sensing of multiple nucleotides exploiting DNA/RNA aptamers and graphene oxide nanosheets. Anal. Chem. 85, 6775–6782 (2013).
Liu, J., Cao, Z. & Lu, Y. Functional nucleic acid sensors. Chem. Rev. 109, 1948–1998 (2009).
Fang, X. & Tan, W. Aptamers generated from cell-SELEX for molecular medicine: a chemical biology approach. Acc. Chem. Res. 43, 48–57 (2010).
Huizenga, D.E. & Szostak, J.W. A DNA aptamer that binds adenosine and ATP. Biochemistry 34, 656–665 (1995).
Carothers, J.M., Oestreich, S.C. & Szostak, J.W. Aptamers selected for higher-affinity binding are not more specific for the target ligand. J. Am. Chem. Soc. 128, 7929–7937 (2006).
Davis, J.H. & Szostak, J.W. Isolation of high-affinity GTP aptamers from partially structured RNA libraries. Proc. Natl. Acad. Sci. USA 99, 11616–11621 (2002).
Carothers, J.M., Oestreich, S.C., Davis, J.H. & Szostak, J.W. Informational complexity and functional activity of RNA structures. J. Am. Chem. Soc. 126, 5130–5137 (2004).
Carothers, J.M., Davis, J.H., Chou, J.J. & Szostak, J.W. Solution structure of an informationally complex high-affinity RNA aptamer to GTP. RNA 12, 567–579 (2006).
Li, Q. & Chang, Y.T. A protocol for preparing, characterizing and using three RNA-specific, live cell imaging probes: E36, E144 and F22. Nat. Protoc. 1, 2922–2932 (2006).
Pittet, M.J., Swirski, F.K., Reynolds, F., Josephson, L. & Weisslede, R. Labeling of immune cells for in vivo imaging using magnetofluorescent nanoparticles. Nat. Protoc. 1, 74–79 (2006).
Zrazhevskiy, P., True, L.D. & Gao, X.H. Multicolor multicycle molecular profiling with quantum dots for single-cell analysis. Nat. Protoc. 8, 1852–1869 (2013).
Robinson, K.M., Janes, M.S. & Beckman, J.S. The selective detection of mitochondrial superoxide by live-cell imaging. Nat. Protoc. 3, 941–947 (2008).
Acknowledgements
This work was financially supported by the National Natural Science Foundation of China (no. 21235004, no. 21327806, no. 21305046), the National Basic Research Program of China (No. 2011CB935704) and the Tsinghua University Initiative Scientific Research Program. This work was also partially supported by a laboratory-directed research and development program at Pacific Northwest National Laboratory (PNNL). We are very grateful to T.J. Weber, D. Hu, C.-T. Lin and A.S. Lea (PNNL) for their help in experimental work and for helpful discussion.
Author information
Authors and Affiliations
Contributions
Y.W., Z.L., J.L. and Y.L. designed the protocol and carried out the experiments. Y.W., L.T. and J.L. wrote the manuscript.
Corresponding author
Ethics declarations
Competing interests
The authors declare no competing financial interests.
Integrated supplementary information
Supplementary Figure 1 Characterization of GO-nS.
(a) AFM images of GO-nS. (b) Cross-sectional plot indicated with the blue line, lateral average over 400 nm. (c) TEM image of GO-nS dispersed on a carbon film. (d) Size distribution histogram of GO-nS. This figure is reproduced with permission from our previously published work38, copyright 2013 American Chemical Society.
Supplementary Figure 2 XRD pattern of GO-nS.
Powder X-ray diffraction (XRD) measurements were performed on Bruker D8-Advance X-ray powder diffract meter using a graphite monochrometer with Cu Ka radiation (k = 1.5406 Å). This figure is reproduced with permission from our previously published work38, copyright 2013 American Chemical Society.
Supplementary Figure 3 Raman spectra of GO-nS.
Raman spectra were obtained using a confocal microprobe Raman system (Renishaw, RM2000). This figure is reproduced with permission from our previously published work38, copyright 2013 American Chemical Society.
Supplementary Figure 4 FTIR spectrum of GO-nS.
The FTIR spectrum (800-4,000 cm-1) was measured using a Perkin Elmer Fourier transform infrared spectroscopy spectrometer with pure KBr as the background. This figure is reproduced with permission from our previously published work38, copyright 2013 American Chemical Society.
Supplementary Figure 5 Single nucleotide detection based on single-aptamer/GO-nS complex.
(a) Fluorescence emission spectra of 100 nM ATP aptamer-FAM quenched with 3 μg/mL GO-nS (black bottom line) and fluorescence recovery by addition of ATP with concentration ranging from 10 μM to 2.5 mM (from bottom to top). Inset: linear relationship between (F-F0)/F0 (where F0 and F are the fluorescence intensity without and with the presence of ATP, respectively) and ATP concentration. (b) Fluorescence emission spectra of 100 nM GTP aptamer-Cy5 quenched with 3μg/mL GO-nS (red bottom line) and fluorescence recovery by addition of GTP with concentration ranging from 0.01 to 2 mM (from bottom to top) in reaction buffer for 1 h at 25 °C. Inset: linear relationship between (F-F0)/F0 (relative fluorescence intensity, where F0 and F are the fluorescence intensity without and with the presence of GTP) and GTP concentration. Error bars were obtained from three parallel experiments. This figure is reproduced from published work37,38. Copyright 2010 and 2013, American Chemical Society.
Supplementary Figure 6 High-resolution cell image.
MCF-7 cells were cultured with 100 nM aptamer-FAM/GO-nS for 6 h with recommended media at 37 °C. Picture A and B were captured from two parallel experiments under the same operation conditions, respectively.
(Fluorescence imaging was carried out on an intensified charge-coupled device(ICCD)-based real-time fluorescence microscopy system, which was composed mainly of a TE2000 inverted microscope (Nikon, Japan) with a Nikon 100× N.A. 1.3 oil objective, an I-PentaMAX Gen IV ICCD camera (Roper Scientific, USA), and an xenon arc lamp in the Lambda DG-4 Wavelength Switcher (Sutter Instrument, USA). Selective excitation was produced through a 484 ± 7.5 nm band-pass filter. Fluorescence was monitored and quantitatively analyzed with the MetaMorph software (Universal Imaging Co., USA). Excitation light was adequately attenuated. Photo bleaching and cell damage were minimized by auto-synchronizing the exciting shutter and the exposure shutter, i.e. cells were exposed to light only during exposure but not at the interval. This ICCD fluorescence micro-imaging system possessed the advantages of high-performance thermoelectric cooling function to reduce noise, and a gain high enough to detect extremely low light.)
Supplementary Figure 7 Cleavage protection assay of GO-nS.
Agarose gel electrophoresis image for enzymatic cleavage protection assay: lane 1, DNA size ladder for 100 bp; lane 2, aptamer-FAM; lane 3, aptamer-FAM reacted with DNase I for 15 min; lane 4, aptamer-FAM reacted with DNase I for 40 min; lane 5, aptamer-FAM/GO-nS; lane 6, aptamer-FAM/GO-nS incubated with DNase I for 15 min; lane 7, aptamer-FAM/GO-nS incubated with DNase I for 40 min. Aptamer concentration is 100 nM, GO-nS is 3 μg/mL, and DNase I is 0.2 units/μL. Excitation wavelength for SYBR Green I: 494 nm.
Supplementary Figure 8 Cell viability assay.
Cell viability determined using a trypan blue assay after treatment of MCF-7 cells with 1 – 9 μg/ml GO-nS for 12 h (red), 24 h (green) or 72 h (blue). Values represent the mean ± se, n=3. *Significantly different from control, p < 0.05. This figure is adapted with permission from our previously published work38, copyright 2013 American Chemical Society.
Supplementary information
Supplementary Figure 1
Characterization of GO-nS. (PDF 144 kb)
Supplementary Figure 2
XRD pattern of GO-nS. (PDF 66 kb)
Supplementary Figure 3
Raman spectra of GO-nS. (PDF 81 kb)
Supplementary Figure 4
FTIR spectrum of GO-nS.. (PDF 93 kb)
Supplementary Figure 5
Single nucleotide detection based on single-aptamer/GO-nS complex. (PDF 115 kb)
Supplementary Figure 6
High-resolution cell image. (PDF 499 kb)
Supplementary Figure 7
Cleavage protection assay of GO-nS. (PDF 112 kb)
Supplementary Figure 8
Cell viability assay. (PDF 110 kb)
Rights and permissions
About this article

Cite this article
Wang, Y., Tang, L., Li, Z. et al. In situ simultaneous monitoring of ATP and GTP using a graphene oxide nanosheet–based sensing platform in living cells. Nat Protoc 9, 1944–1955 (2014). https://doi.org/10.1038/nprot.2014.126
Published:
Issue Date:
DOI: https://doi.org/10.1038/nprot.2014.126
This article is cited by
-
Combination of multiple nucleic acid aptamers for precision detection of tumors based on optical methods
Journal of Cancer Research and Clinical Oncology (2023)
-
Homogeneous luminescent quantitation of cellular guanosine and adenosine triphosphates (GTP and ATP) using QT-LucGTP&ATP assay
Analytical and Bioanalytical Chemistry (2023)
-
Catalytic nanozyme Zn/Cl-doped carbon quantum dots as ratiometric fluorescent probe for sequential on-off-on detection of riboflavin, Cu2+ and thiamine
Scientific Reports (2022)
-
Simultaneous probing of dual intracellular metabolites (ATP and paramylon) in live microalgae using graphene oxide/aptamer nanocomplex
Microchimica Acta (2022)
-
A fluorescence nanoplatform for the determination of hydrogen peroxide and adenosine triphosphate via tuning of the peroxidase-like activity of CuO nanoparticle decorated UiO-66
Microchimica Acta (2022)
Comments
By submitting a comment you agree to abide by our Terms and Community Guidelines. If you find something abusive or that does not comply with our terms or guidelines please flag it as inappropriate.
