
Abstract
The genus Oryza is a model system for the study of molecular evolution over time scales ranging from a few thousand to 15 million years. Using 13 reference genomes spanning the Oryza species tree, we show that despite few large-scale chromosomal rearrangements rapid species diversification is mirrored by lineage-specific emergence and turnover of many novel elements, including transposons, and potential new coding and noncoding genes. Our study resolves controversial areas of the Oryza phylogeny, showing a complex history of introgression among different chromosomes in the young ‘AA’ subclade containing the two domesticated species. This study highlights the prevalence of functionally coupled disease resistance genes and identifies many new haplotypes of potential use for future crop protection. Finally, this study marks a milestone in modern rice research with the release of a complete long-read assembly of IR 8 ‘Miracle Rice’, which relieved famine and drove the Green Revolution in Asia 50 years ago.
Main
The genus Oryza stands out in its significance to human civilization and food security with two species having been independently domesticated as rice: Oryza sativa in Asia ~10,000 years ago and Oryza glaberrima in Africa ~3,000 years ago. Today, Asian rice is the staple food for half the world, contributing an estimated 20% of human dietary calories (FAO Fact Sheet; see URLs). As the global population is projected to increase by almost 3 billion by 2050, rice breeders urgently need to develop new and sustainable cultivars with higher yields, healthier grains and reduced environmental footprints. Because the wild relatives of rice are adapted to different biogeographic ranges (Fig. 1a) and can tolerate many biotic and abiotic stresses1,2,3,4,5,6, they constitute an important reservoir for crop improvement. Strategies to harness such traits for crop improvement show clear promise, as exemplified by the introgression of bacterial blight resistance (Xa21) from the wild species Oryza longistaminata7.

a, Geographic ranges of wild Oryza species and the outgroup species L. perrieri sequenced in this study. Dashed red lines show the limits of rice cultivation. Mapped ranges are adapted from IRRI’s Knowledge Bank (see URLs). b, Most frequently estimated species phylogeny in supermatrix and MP-EST analyses of each chromosome (inferred in 10 of 12 chromosomes and 11 of 12 chromosomes, respectively). Bootstrap proportions were obtained from 400 supermatrix bootstrap replicates, and MP-EST support values were obtained as described in the Methods. All clades were supported by both methods at 100%, except as indicated. Divergence times within the Oryza genus were estimated by PATHd8, assuming an age of 15 million years for the Oryza crown group. Bars on nodes represent the range of PATHd8 age estimates across all 12 chromosomes. Mya, million years ago.
The 27 Oryza species span ~15 million years of evolution, with 11 genome types, 6 of which are diploid (n = 12: AA, BB, CC, EE, FF and GG) and 5 of which are polyploid (n = 24: BBCC, CCDD, HHJJ, HHKK and KKLL). Cultivated rice belongs to the AA genome group, the primary germplasm pool for rice improvement8. To harness more distantly related species as genetic resources, a better understanding of genomic differences and similarities is essential.
As a first step toward a deeper evolutionary understanding of the genus, we developed a large array of publicly available genomic tools from BAC libraries9,10 and BAC-end sequences to physical maps11,12 and subgenome assemblies13. Comparisons of select orthologous regions have addressed the origin and evolutionary fate of genes14,15,16, as well as transposable element (TE) dynamics17,18,19,20,21,22 and the effects of polyploidy22,23. In addition, assemblies of several AA genomes24,25,26,27 and the O. brachyantha FF genome28 have already pointed to the power of complete genome comparisons.
Here we detail the generation and analysis of nine new reference assemblies that span cultivated and wild species in the Oryza genus and extend to the African outgroup species Leersia perrieri. Our comparative evolutionary genomics analysis includes these and four previously published genomes (O. sativa vg. japonica (AA)29 and indica (AA)30, O. glaberrima (AA)25 and O. brachyantha (FF)28), which were together reannotated using a common pipeline with the integration of baseline RNA-seq and bisulfite sequencing data.
Our analysis of this 13-genome dataset revealed several salient features of genome evolution in Oryza:
-
1.
A single-species phylogeny, supported by over 6,000 single-copy orthologs, places the ‘crown’ age of the AA clade at ~2.5 million years, implying a diversification rate (~0.50 net new species/million years) that is comparable to the high rates estimated for diverse plants in a variety of continental and island biodiversity hotspots31;
-
2.
Extensive interspecific gene flow, particularly between the South American Oryza glumaepatula and African AA species, underscores the semipermeable nature of Oryza species boundaries, at least within AA-genome species;
-
3.
The emergence of many putative taxonomically restricted gene families corresponds to higher lability, reduced coding length and higher rates of evolution than in ancient families. Along with long intergenic noncoding RNA (lincRNA) genes, members of new families are more likely to localize to repetitive regions of the genome, suggesting a possible role of TEs and reduced meiotic recombination in their origin;
-
4.
Rapid diversification and turnover of LTR-retrotransposons largely differentiate the AA, BB, FF and Leersia genome types;
-
5.
A significant preference of deletion over insertion mutations was detected across eight AA Oryza genomes, similar to in metazoan lineages;
-
6.
Analysis of thousands of candidate disease resistance genes shows an overabundance of heterogeneous gene pairs organized in head-to-head fashion and with atypical domains, extending support for the integrated decoy model of disease resistance function.
Results
The 13-genome data package
Chromosome-level reference assemblies for two domesticated (O. sativa vg. indica cv. IR 8 (also known as Miracle Rice) and the drought-tolerant aus variety N 22) and seven wild species (Oryza rufipogon, Oryza nivara, Oryza barthii, O. glumaepatula, Oryza meridionalis, Oryza punctata and L. perrieri) were generated using either long-read or short-read technologies, with extensive scaffold support from long-insert library reads, including BAC-ends, as summarized in Table 1 (Supplementary Note). Extensive assessments of the quality of each assembly (for example, sequence accuracy, genome completeness and gene-space coverage) are described in the Supplementary Note (Supplementary Fig. 1 and Supplementary Tables 1–22) and Supplementary Data 1 and 2. These assemblies, plus the four additional published assemblies described above, were annotated using a uniform annotation pipeline to minimize methodological artifacts (Table 1, Supplementary Figs. 2 and 3, Supplementary Tables 14–25 and Supplementary Note).
Species tree
The outline of the Oryza phylogeny is clear, but the exact relationship between AA genomes, including the two domesticated rice species, has remained elusive32,33,34 owing to extensive gene tree discordance35. Previous work has rarely used ‘species tree’ inference methods35 that explicitly incorporate gene tree discordance caused by factors such as incomplete lineage sorting, and, if it did, did so with only a few genes36. Using 6,015 single-copy orthologs from ten Oryza genomes including L. perrieri, we inferred strong support for a single-species phylogeny (Fig. 1b, Supplementary Fig. 4, Supplementary Table 26 and Supplementary Note), which supports two independent origins of japonica and indica rice. We note, however, that some gene tree conflicts cannot be explained by incomplete lineage sorting alone. For example, data for chromosomes 6 and 12 suggested that the South American AA species O. glumaepatula is the sister group only of African O. barthii and O. glaberrima, rather than of these two species plus the O. sativa complex, as inferred from the whole-genome tree (Fig. 1b and Supplementary Fig. 5).
With an inferred crown age of the AA species of less than 2.5 million years (Fig. 1b, Supplementary Fig. 4, Supplementary Table 27 and Supplementary Note), footprints of past gene flow among AA species might still be detectible. Regions with evidence of introgression based on a positive D statistic37 were found on all chromosomes, with ten having significant introgressions between O. glumaepatula and the African but not the Asian species (Fig. 2 and Supplementary Table 28).
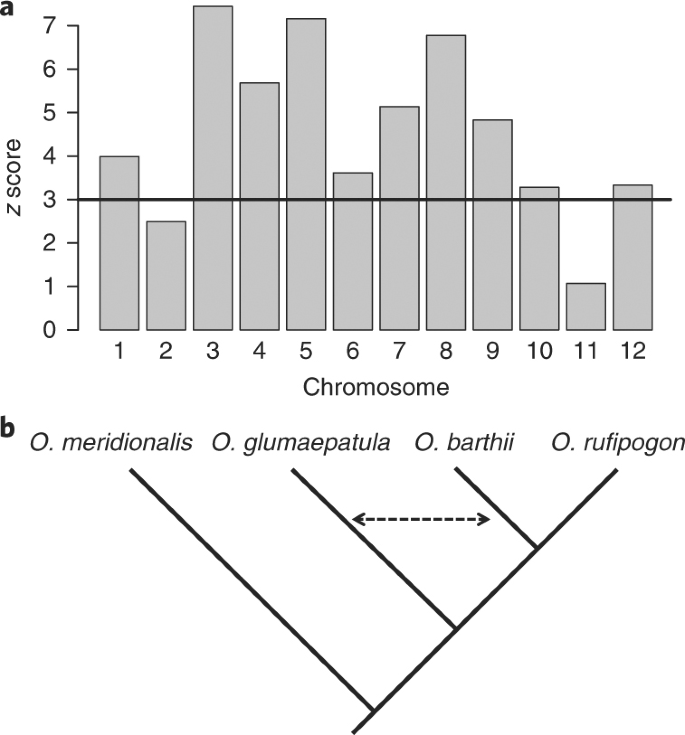
a, Plot of z scores for the D statistic for each chromosome. Values above 3.0 are highly significant. Each z score is signed, with positive values indicating that the introgression involved the pair of species on the species tree in b indicated by the dashed arrow. b, Subtree restricted to four species from the AA-genome clade.
Another source of topological incongruence is gene conversion between duplicated regions retained after the pan-grass polyploidy event. Such regions are particularly common on the distal regions of chromosomes 11 and 1214. Recent (<4.9 million years in age) large-scale conversion events were apparent on the distal 2.2-Mb regions of both of these chromosomes (Supplementary Fig. 6). From inter- and intraspecies comparisons, we inferred four independent conversion events, one in the L. perrieri lineage and one each in the AA, BB and FF lineages (Supplementary Tables 29 and 30; also see the Supplementary Note), with no further events since the divergence of the AA species. Dates calculated for O. meridionalis, the sister group to the other AA species analyzed, suggest that this common event occurred almost concomitantly with the divergence of the AA clade.
Karyotype conservation
The 12-chromosome karyotype in rice resulted from the pan-grass polyploidy event and has deviated little in rice in comparison to other extant grasses38,39,40. Using synteny maps and whole-genome alignments, we found that the outgroup species L. perrieri has many small inversions of five or more genes when compared to O. sativa29 (Supplementary Fig. 7). To estimate the rate of such events within Oryza, we focused on inversions shared by at least two consecutive species in the species tree, while discounting species-specific events as possible assembly errors. With Brachypodium distachyon as an additional outgroup, we identified nine paracentric inversions, ranging from 60 to 300 kb in length and involving up to 19 genes (Fig. 3 and Supplementary Table 31), from which we estimate that such inversions arise about once every 1.6 million years. However, this rate is not constant, as there was only one event between the divergence of FF genomes and the AA–BB ancestor. In contrast, there were at least six inversions in the branch leading to the common ancestor of the AA-type genomes, more than double the average rate.

a, An AA-genome-specific inversion (~170 kb, bearing 14 orthologous genes) took place approximately 4.4 million years after the split with BB-genome species (cladogram branch lengths not to scale). b, Placement of nine shared inversion events in the Oryza species tree. Inversions were detected as syntenic blocks of five or more genes in reverse orientation as compared to the O. sativa vg. japonica reference and were verified using the B. distachyon outgroup as representing the ancestral state. Nodes are labeled with letters as in Supplementary Fig. 4. The length of the branches (units million years; not drawn to scale) is indicated beneath the branches, while the number of scored inversion events is indicated above the branches. The approximate rate of inversion is shown in red.
TE diversification and rapid elimination
Selective amplification and loss of TEs has had a key role in Oryza genome and chromosome evolution17,20,21,41. Repeats, including TEs, constitute 27–50% of the genome assemblies (Table 1 and Supplementary Table 20), providing a unique basis for a comprehensive genus-wide comparison of TE dynamics. Each species was distinguished by its diversity of long terminal repeat–retrotransposons (LTR-RTs), the most abundant TE class26. Comparative annotation and phylogenetic analysis of LTR-RTs identified several lineage-specific transpositional bursts (Supplementary Figs. 8 and 9, and Supplementary Table 32), most within the last 2.5 million years (Fig. 4). Because of their young average age, the LTR-RT populations of the different species are distinct. For example, six families that amplified specifically in the BB species O. punctata (families 11, 26, 27, 36, 48 and 50; Supplementary Table 32) occupy almost 25 Mb (or 6.3% of the assembly). Even among the closely related Asian AA species, there are marked differences in RETRO 1/242 and Spip43 complements (family 7; Supplementary Fig. 10 and Supplementary Table 32).

Box-and-whisker plots show the median and upper and lower quartiles of insertion age, while the width of each ‘violin’ is proportional to element abundance (plots not scaled between superfamilies).
Rapid loss of LTR-RTs can greatly reduce TE diversity and limit genome size increases44,45,46. Tracking 75 orthologous LTR-RT loci across the eight most closely related AA species (Supplementary Data 3) yielded an average loss rate of 3.62 kb/million years per element. Applying this ratio to the whole genome predicts that approximately one-quarter of the O. sativa vg. japonica genome will be eliminated within the next 3–4 million years unless new waves of transposition occur during the same period. Similar to previous estimates44,45,46, our analysis extends these findings across the AA genomes of the Oryza genus.
These results reinforce the notion that TEs are important drivers of genome evolution because they fuel the rapid turnover of intergenic regions. However, not all TEs behave equally: the terminal-repeat retrotransposons in miniature (TRIMs), which are mostly located near genes, were highly conserved among all 13 genomes (Supplementary Fig. 11 and Supplementary Table 33).
Indels as drivers of genome evolution and domestication
Pairwise comparisons of the eight most closely related AA genomes identified 216,059–699,587 indels, depending on the genome comparison, with the ancestral state determined for about half of these (Supplementary Table 34). In agreement with previous work in Oryza26 and Arabidopsis47, short indels were strongly favored. In coding regions, in-frame indels at multiples of 3 bp were over-represented, as expected (Supplementary Fig. 12). There was a significant bias toward deletions (chi-squared test, P < 8.96 × 10⁻¹¹; Supplementary Table 35), similar to findings in metazoan lineages48.
To better understand indel population dynamics and the role of domestication, we expanded this study to include 20 accessions of cultivated O. glaberrima and 19 of its wild progenitor, O. barthii. From medium-depth resequencing24, we identified 162,267 additional indels in O. glaberrima and 448,000 in O. barthii. Pairwise diversity π was greater in O. barthii (0.622/kb) than in O. glaberrima (0.446/kb), consistent with a genetic bottleneck and strong selection during O. glaberrima domestication24,49. To further test this hypothesis, we plotted the derived site-frequency spectrum across 80,507 and 41,947 indels (>1 bp) within O. barthii or O. glaberrima, with the ancestral state inferred from O. sativa vg. japonica and O. glumaepatula as outgroups. A U-shaped frequency distribution was observed only in O. glaberrima (Supplementary Fig. 13), indicating a much higher fixation rate of polymorphic indels in the domesticated species than in its progenitor. O. glaberrima was previously shown to have been derived from subpopulations of O. barthii more than 3,000 years ago, with an attendant population bottleneck during early cultivation and domestication49. Thus, demographic history shaped by artificial selection could largely explain the high frequency of fixed mutations (984 insertions and 2,110 deletions) in O. glaberrima (Supplementary Table 35). Indels shared by >90% of individuals were enriched in 72 putative domestication loci24 as compared to genome background (5.2 versus 3.1 per 100 kb; t test, P < 0.01), pointing to indels as being particularly important during domestication. These observations broadly resemble observations with SNP data from Asian cultivated rice and its progenitor50.
To understand the evolutionary rates of indel formation in the non-cultivated species, we note that the single-genome comparisons (O. barthii versus O. sativa vg. japonica and O. barthii versus O. glaberrima) identified up to 170,903 and 46,846 indels in O. barthii, but none had become fixed since O. barthii split from O. glaberrima. This observation suggests that most indels inferred from comparisons of just single genomes (Supplementary Table 34) are still polymorphic within populations.
Oryzeae- and species-specific gene families
We identified 21,448 putative gene families, which were assigned to four age bins (Fig. 5a and Supplementary Fig. 14). The most ancient group, dated to at least the common ancestor of angiosperms, included 62% of genes but only 29% of families. The Poaceae age group, comprising a further 13% of genes and 9% of families, was enriched in defense response (GO:0006952) and wound response (GO:0009611) genes, including those encoding disease resistance receptors (see below) and enzyme inhibitors (Supplementary Table 36 and Supplementary Data 4). In addition, these families were enriched in genes encoding components of the ubiquitin–proteasome pathway51, including SKP1/BTB/POZ and F-box proteins, the latter of which are known to undergo lineage-specific expansions and rapid evolution in plants52. Also enriched in Poaceae were genes encoding two classes of proteins abundant in late embryogenesis, which function in dehydration and other stress tolerance53. Genes that emerged within the Oryzeae accounted for 60% of families and 19% of annotated loci and were enriched in seed storage proteins, defense-related genes and nucleic-acid-binding functions (GO:0003676), including various DNA-binding domains, histones and methyl-CpG DNA-binding proteins (Supplementary Table 37 and Supplementary Data 4). Species-specific families and orphans accounted for an average of 6% of annotated loci per species.

a, Assignment of annotated loci in O. sativa vg. japonica to age ranks by inference of most recent common ancestor based on Compara (Methods) gene families. b, Coding length and transcript expression are positively correlated with age (τ and p, Kendall’s correlation statistics). Box plots show distributions of mean coding length per family or the expression value of the locus with the highest expression per family, with trendlines connecting median values (n = 2,144, 409, 913, 1,222, 2,176, 1,551, 794, 223, 676, 171, 1,440 and 5,975 families assigned to age ranks 0 through 11, respectively. c, Ka/Ks ratio and Ka and Ks substitution rates are negatively correlated with age (τ and p, Kendall’s correlation statistics). Values were calculated relative to syntenic orthologs in O. nivara. Box plots show distributions of the lowest value per family, with trendlines connecting medians (n = 506, 556, 1,272, 923, 563, 153, 579, 142, 1,328 and 5,768 families assigned to age ranks 2 through 11, respectively).
While these analyses show that lineage-specific gene families can encode proteins with recognized biological functions, only 6% of species-specific and 10% of Oryzeae-specific loci have predicted InterPro domains, as compared to 63% in Poaceae and 91% in angiosperm-derived families. Despite some methodological concerns54, it is widely recognized that new genes arise continuously across all domains of life55,56,57. The fraction of Oryzeae-specific genes with syntenic orthologs in a second species was not substantially lower than for the two older groups, with 86% as compared to 93% and 97% for the Poaceae and angiosperm-derived families, respectively (Supplementary Table 38). This in turn provides unique opportunities to study patterns and mechanisms of putative new gene origination within a phylogenetic framework.
New functional genes likely evolve via transitory protogenes; while most are rapidly lost, a subset will be positively selected and gradually gain the characteristics of deeply rooted genes58,59,60. A key prediction is that properties such as coding length, expression, substitution rate and evolutionary stability change in an age-dependent manner58,61.
Coding length showed clear age dependence, with the median length increasing several fold from the youngest to the oldest group (Wilcoxon rank-sum test, P < 2.2 × 10⁻¹⁶) (Supplementary Fig. 15). This held true even when excluding genes shared throughout the angiosperms (Kendall’s tau, P < 2.2 × 10⁻¹⁶) (Fig. 5b). This observed age dependence, also found in Arabidopsis56,62, may indicate that longer initial coding lengths are more likely to survive over time or that coding sequences that survive gradually lengthen over time through chance removal of stop codons58.
Gene expression was also positively correlated with age, both when assessed qualitatively (Supplementary Fig. 14) and quantitatively (Fig. 5b). Again, the exclusion of angiosperm-derived genes from the analysis did not change this finding (Kendall’s tau, P < 2.2 × 10⁻¹⁶) (Fig. 5b). These findings are consistent with lower and more restricted expression of lineage-specific loci in plants63,64.
Relaxed negative selection is a common characteristic of lineage-specific genes57. Comparisons of syntenic orthologs confirmed a trend of relaxed selection in younger genes (for example, median Ka/Ks for Oryzeae (0.59) > Poaceae (0.42) > angiosperms (0.27)), concomitant with higher rates for both nonsynonymous and synonymous substitutions (Wilcoxon rank-sum test, P < 2.2 × 10⁻¹⁶) (Supplementary Fig. 16). Nevertheless, the median Ka/Ks value for Oryzeae-specific genes was well below neutral rates, suggesting that many encode functional proteins65. These observed trends also held true after fractionating over all nodes in the species tree. Using measurements for O. nivara (Fig. 5c), we found a significant negative correlation for Ka, Ks and Ka/Ks with age, even when restricting to nodes within the Oryzeae (Kendall’s tau, P < 1.7 × 10⁻⁶).
A final expectation is greater evolutionary stability of older genes. On average, any one species had 96% of families shared through the angiosperms but only 76% of Poaceae-specific and 15% of Oryzeae-specific families. Similarly, 75% of families shared through the angiosperms were present in all species but only 34% of Poaceae-specific and 15% of Oryzeae-specific families were (Supplementary Fig. 14). The oldest families were also the largest, consistent with expectations that fixed families diversify over time. Finally, Oryzeae-specific loci were more likely to be found near centromeres over low-recombination regions, and thus more likely to reside closer to LRT-RTs (Fig. 6 and Supplementary Fig. 17).

a, Each segment represents a stacked histogram of tiled windows of 100 loci. Species: 1, O. sativa vg. japonica; 2, O. sativa vg. aus (N 22); 3, O. sativa vg. indica (IR 8); 4, O. sativa vg. indica (93-11); 5, O. rufipogon; 6, O. nivara; 7, O. glaberrima; 8, O. barthii; 9, O. glumaepatula; 10, O. meridionalis; 11, O. punctata; 12, O. brachyantha; 13, L. perrieri. Recombination rate is shown in the outer ring, ranging from 0 to 9 cM/Mb, based on the integrated genetic/physical map of rice (constructed from data from Harushima et al.103 and McCouch et al.104) for O. sativa vg. japonica downloaded from http://archive.gramene.org/. Triangles show the position of rice centromeres (see URLs). b, Differential correlations in O. sativa vg. japonica of gene age group prevalence (calculated over 191 2-Mb non-overlapping windows) with chromosome recombination rate. Plots show individual points color-coded by chromosome fitted by simple linear regression. Pearson’s correlation coefficient (r) and P value are shown for each plot.
Chimeric genes are common in O. sativa, suggesting that new genes originate at a much higher frequency than in animals66,67. One mechanism of chimeric gene formation is the transposition of genic sequences captured by flanking MULE DNA transposons in rice68,69. MULE-derived loci (MDLs) accounted for 7% of Oryzeae- and species-specific genes. While this is a small minority, it is clearly much higher than for all genes (chi-squared test, P < 1 × 10⁻³²) (Supplementary Table 39). MDLs in AA genomes showed high rates of microsynteny (68–92%), indicative of conserved genomic position over periods of up to 2.4 million years. MDLs showed different characteristics from non-gene-containing MULEs, having for example higher GC content70 (Supplementary Fig. 18). Methylation levels of MDLs were also lower and changed with evolutionary age71 (Supplementary Fig. 19).
LincRNA genes as a source of genetic novelty
We found thousands of lincRNAs that did not overlap protein-coding genes. L. perrieri had more lincRNAs than any Oryza species (q ≤ 3 × 10–31) (Supplementary Fig. 20), while the two domesticated species, O. sativa and O. glaberrima, had significantly fewer than their wild ancestors (O. glaberrima versus O. barthii, q ≤ 5 × 10–20; O. sativa vg. japonica versus O. rufipogon, q ≤ 4 × 10−73). These differences cannot be explained by different RNA-seq coverage (Supplementary Fig. 21). Most lincRNA families have evolved very recently, with the majority being species specific (Supplementary Fig. 22). Of the 23,633 families identified in nine species, over 91% were species specific and only 101 lincRNA families (<0.5%) were detectable as far back as the common ancestor of Oryza and L. perrieri, indicating rapid emergence and turnover.
Similarly to vertebrates72,73, lincRNAs were enriched with TE-derived sequences, especially ones from DNA transposons and LTR-RTs (found in > 59%; Supplementary Fig. 23 and Supplementary Data 5). Whether this tolerance for TE sequence derives from non-functionality of the lincRNA transcripts or a modular structure that allows for large indels remains to be explored.
Evolution of disease resistance genes
Most plant disease resistance genes encode intracellular nucleotide-binding, leucine-rich repeat (NLR) receptors that directly or indirectly recognize pathogen effector proteins. NLR content is highly variable among rice populations, accounting for the majority of copy number and presence/absence polymorphisms affecting genes74,75,76, explained by rapid evolution and balancing selection77,78.
We identified 5,408 candidate NLR genes, ranging from 237 in O. brachyantha to 535 in O. sativa vg. indica (93–11) (Supplementary Table 40), distributed across 28 subfamilies (Fig. 7a and Supplementary Tables 41 and 42). Summation of duplication histories in gene trees showed that a previously reported expansion of NLR genes in the AA genomes26 can be more precisely placed at the common ancestor of Asian and African rice, after the split of O. meridionalis and O. glumaepatula (Supplementary Fig. 24). In addition, NLR expansion was markedly higher in both the indica and japonica varietal groups as compared to their wild progenitors, consistent with recent artificial selection for increased NLR diversity.

a, Maximum-likelihood tree of the NB-ARC domains of 1,000 NLR-type disease resistance genes in three species: O. sativa vg. indica (93-11) (green), O. punctata (purple) and L. perrieri (orange). Designated gene families are lettered. Sixteen characterized NLR genes are indicated, as cited in the Methods. b, The rice Pik1–Pik2 locus and encompassing heterogeneous NLR cluster showing a pattern of underlying conservation, including a prevalence of putatively coupled gene pairs (W:D pairs in head-to-head configuration, akin to RGA4–RGA592. Non-canonical C-terminal domains, such as WRKY, which function as integrated decoys that recognize pathogen avirulence gene products102, are found in 17 ‘D’ genes as labeled. The region shown corresponds to 11:27,594,830–27,990,888 on the O. sativa vg. japonica cv. Nipponbare RefSeq sequence29. Osj Nip, O. sativa vg. japonica; Osa N22, O. sativa vg. aus (N 22); Osi IR8, O. sativa vg. indica (IR 8); Osi 9311, O. sativa vg. indica (93-11); Orufi, O. rufipogon; Oniva, O. nivara; Oglab, O. glaberrima; Obart, O. barthii; Oglum, O. glumaepatula; Omeri, O. meridionalis; Opunc, O. punctate; Obrac, O. brachyantha; Lperr, L. perrieri.
As previously reported26,79,80, most NLR genes are positionally clustered (Supplementary Table 40), with the greatest density on chromosome 11, a finding now extended to the Leersia genus (Supplementary Table 43). One-third of the 1,046 clusters across 13 genomes had mixed subfamily composition (Supplementary Table 40) indicating that they did not arise simply by local duplications of single progenitor genes. Recent studies have shown that disease resistance sometimes requires the joint action of two side-by-side NLR genes78,81,82,83, suggesting that formation and maintenance of complex clusters may be driven by such functionally coupled pairs. As typified by rice RGA4–RGA578 and Pik-1–Pik-284, coupled NLRs are frequently distantly related, arranged in head-to-head formation (divergently transcribed) and include atypical domains that function as integrated decoy domains in pathogen recognition84.
To investigate the prevalence of these characteristics, we studied all 1,386 instances of adjacent NLR genes, of which over one-quarter were classified as heterogeneous (Supplementary Tables 44–46). Among these, the head-to-head configuration was significantly more prevalent than expected by chance (47% versus 25%; chi-squared test, P = 0.0001) and also more likely to show conserved synteny than other arrangements (Supplementary Fig. 25 and Supplementary Table 45). In contrast, homogeneous pairs showed significant bias for the head-to-tail arrangement (chi-squared test, P = 0.0001) (Supplementary Table 45), which may reflect underlying mechanisms of tandem duplication.
Across the phylogeny, we identified 230 NLR genes with unusual N-terminal domains and 239 NLR genes with unusual C-terminal domains, with 23 genes having both (Supplementary Data 5). The most common domains match known integrated decoy domains85,86, but many more rare types were also found. The presence of specific domains in different NLR subfamilies point to multiple, independent acquisitions of decoys by NLRs (Supplementary Table 42). Among adjacent NLR genes, putative integrated decoy domains were significantly more prevalent in heterogeneous pairs arranged in head-to-head configuration as compared to other classes (Supplementary Table 45; chi-squared test, P < 0.0001). These trends with the Pik-1–Pik-2 locus and adjacent cluster of RGA4–RGA5-like pairs are illustrated in Fig. 7b, with evidence for evolution of new specificities both within species and between species, by acquisition of WRKY, NAM, protein kinase, U-box and VQ domains. Finally, an analysis of the Pi-ta region (Supplementary Fig. 26) identifies an excellent candidate for the tightly linked R gene Pi-ta2, whose broader resistance spectrum encompasses that of Pi-ta87 but which has not been positively identified because of very low recombination in the Pi-ta region87.
Discussion
With two independently domesticated species, Oryza has had a significant role in advancing human civilization, leading some rice-dependent cultures to revere ‘rice is life’, as exemplified in dramatic fashion ~50 years ago with the release of IR8 in Asia. As the world population approaches 10 billion by 2050, rice breeders are faced with the challenge of producing crops that are high yielding and more nutritious while at the same time being more sustainable. How can we meet the challenge of producing more food and at the same time protecting the environment?
The premise of the International Oryza Map Alignment Project (IOMAP), initiated in 2003, was to develop a set of high-quality genomic resources for the wild relatives of rice that could be used as a foundational resource to discover and utilize novel genes, traits and/or genomic regions for crop improvement and basic research. IOMAP began with the generation of genomic tools (BAC libraries and physical maps) derived from wild accessions that have been actively used in breeding programs to introgress new traits into cultivated rice88. Only recently have viable F1 hybrids been developed for all 25 wild species crossed with O. sativa8.
Here we describe the generation of new reference assemblies for six wild Oryza species (O. nivara, O. rufipogon, O. barthii, O. glumaepatula, O. meridionalis and O. punctata), two domesticates (O. sativa vg. indica (IR 8) and O. sativa vg. aus (N 22)) and the closely related outgroup species L. perrieri. In combination with four previously published Oryza genomes, our dataset represents a genome-wide vista of the results of ~15 million years of both natural and artificial selection on a single genus. Over this time period, the Oryzeae have maintained a base chromosome number of 12, despite having adapted to different ecological conditions associated with their global distribution and withstanding bursts of TE diversification that, in some cases, led to doubling of genome sizes, as in O. australiensis20 and O. granulata21.
Our phylogenomic work illustrates both the challenges of inferring species phylogenies in closely related plant taxa—incomplete lineage sorting89, hybridization and introgression90—and the power of whole-genome sequences to untangle the resulting phylogenetic discordance. Combining recent tools for species tree inference with this massive dataset permitted us to construct a much more nuanced view of the species phylogeny in Oryza that reflects the mosaic history of different parts of the genome91. Not only does this allow a more complete framework for studies of the evolution of genes, chromosomes and genomes in Oryza, but it also leads to more accurate placement of Oryza species in an evolutionary and ecological context. For example, our genome-based estimate of the age of the AA genome clade implies a remarkably rapid diversification rate of ~0.50 net new species/million years, placing it on par with many rapidly diversifying taxa in island and continental hotspots31,33. This rapid species diversification among Oryza species in the AA clade likely provided special opportunities for cultivation and improvement by humans, resulting in two independent domestication events in this group.
Our analyses of TE-driven genome dynamics in Oryza point to a very high rate of TE turnover over long evolutionary periods. While this has been previously demonstrated in cultivated rice, it was unclear whether this pattern holds for the entire genus. We show that this process results from both recent lineage-specific TE amplifications and a high deletion rate of TE-related sequences. Even if Oryza genomes share many TE families, one could expect that the vast majority of TE insertions are polymorphic among wild rice species. Several recent studies have demonstrated the functional impact of TE-related sequences in rice92,93 and other crops94,95 on gene expression. TE polymorphisms in wild Oryza species could thus be exploited for breeding in addition to the diversity found in the genes themselves.
Comparative analysis of gene annotations across the Oryzeae revealed many apparent lineage-specific families that emerged in the common ancestor of grasses or within the Oryzeae clade. The latter exhibited characteristics typical of taxonomically restricted loci in plants and other domains of life, including shorter coding sequences, low expression, rapid evolution rates and family instability. Lack of recognizable functional domains also characterized these annotations, consistent with a de novo origin. Although such qualities can also be found in annotation artifacts54,65, the Oryzeae-specific loci (as distinguished from species-specific loci) showed a surprising degree of conserved synteny, even among more distantly related species, and we therefore focused on this subset to examine the effects of age on these characteristics. Our finding of a clear correlation toward more ‘gene-like’ characteristics with increasing age is consistent with Oryzeae-specific loci representing a pool of rapidly evolving sequences with adaptive potential. The observed continuum of characteristics over evolutionary time extended to the older, more established gene families, with characteristics of Poaceae-derived families intermediate to those of the very new and very old. However, the relatively high proportion of genes in Poaceae-derived families with conserved functional domains (63% as compared to 91% in ancient families) suggests that de novo origin accounts for a minority of these families. Indeed, among Oryza-derived loci, the small proportion (~10%) with recognizable domains would have greater potential for future survival as compared to loci from other families. In both Poaceae- and Oryzeae-specific families, genes that do have conserved domains are enriched for defense and stress response functions, suggesting that their rapid evolution was driven by adaptation to varied environmental pressures. Although few putative de novo–originated genes have so far been functionally characterized in plants, the rice OsDR10 gene, conserved only in the Oryzeae tribe, is notable in having apparent function in the regulation of pathogen defense responses96.
TEs make an important contribution to the formation of lineage-specific loci in plants, by exaptation63,64 or exon capture68. Here MDLs accounted for almost 7% of Oryzeae-derived and species-specific loci. We also found that lincRNA genes, which mostly arose in a species-specific manner, are associated with both DNA and LTR-RT-type transposons. Aside from these, we found a clear positional bias of putative new loci over retrotransposon-rich pericentromeric regions, suggesting that LTR-RT activity may contribute to the origination of new genes. Although yet to be confirmed, the observed rapid rates of insertion and excision of LTR-RTs may drive the generation of novel sequences at these sites with chance generation of ORFs97. An unanticipated finding is that the rate of silent site substitutions was elevated in new gene families as compared to older ones. Elevated synonymous substitutions may be caused by higher background mutation rates in pericentromeric regions as compared to gene-rich regions, as has been found in Arabidopsis98. A second hypothesis is that background mutations accumulate more rapidly owing to suppressed meiotic recombination in pericentromeres. High recombination rates in euchromatin provide opportunities for allelic gene conversion during meiosis, correcting mismatches caused by spontaneous mutation.
Disease pathogens remain a major threat to rice harvests worldwide, with yearly losses from the most serious disease, blast (Magnaporthe oryzae), having the potential to feed an estimated 60 million people99. Future forecasts may become dire as climate change alters or expands the geographic range of pathogens. Risk-reducing growing techniques and breeding of natural resistance have historically provided the most practical and effective means of control, with chemical fungicides as a last resort in some countries100. Yet, natural resistance is fragile owing to the rapid evolution of new pathovars that evade host recognition. Stacking of traits from the large array of resistance genes and haplotypes in existing rice germplasm is a realistic approach to build durable resistance101. Our sequencing of seven wild relatives of crop species opens a treasure trove of novel resistance haplotypes and loci to sustain this strategy. The practical utility of our resources is directly demonstrated by our identification of a strong candidate for the long-sought Pi-ta2 locus, which in combination with Pi-ta provides broad-specificity resistance to M. oryzae87.
Sequencing of the first two Asian rice genomes over a decade ago29,30,102 greatly accelerated the identification and characterization of genes important to breeders, as well as insights into selective pressures acting on their evolution. The availability of 13 high-quality reference genome assemblies, presented here, now permits exploration of the majority of orthologous loci and genomic regions at will for the AA, BB and FF genome types and L. perrieri. As more wild and cultivated Oryza genomes become available, this resource will become even more powerful.
Methods
The 13-genome data package: sequence, assembly and annotation
Detailed descriptions of genome sequencing, assembly, assembly validation and annotation are provided in the Supplementary Note under the same title.
Briefly, chromosome-level reference assemblies for two domesticated (O. sativa vg. indica cv. IR 8 (Miracle Rice) and the drought-tolerant aus variety N 22) and seven wild species (O. rufipogon, O. nivara, O. barthii, O. glumaepatula, O. meridionalis, O. punctata and L. perrieri) were generated using either long- or short-read technologies; most of these have extensive scaffold support from long-insert library reads, including BAC-ends, as summarized in Table 1. These assemblies, plus the four additional published assemblies25,28,29,30, were annotated using a uniform annotation pipeline to minimize biases associated with different methods for gene and repeat identification (Table 1).
Phylogenetic inference
Data preparation
For each chromosome, we used the BLAST-Overlap-Synteny (BOS) filtering protocol34 to identify clusters of single-copy orthologous loci. Only clusters containing a single sequence from each genome were used in further analyses (note: the IR 8 and N 22 genomes were not used in this analysis as they did not provide any meaningful phylogenetic signal beyond the Nipponbare RefSeq sequence). The coding regions of each locus were aligned at the nucleotide level using PRANK v.140110105 with the -F setting. For each chromosome, alignments containing sequences from all 11 genomes were concatenated to create 12 ‘supermatrix’ alignments.
Maximum-likelihood tree inference
Maximum-likelihood phylogenies were inferred for individual locus alignments and supermatrices using GARLI version 2.01106 (default settings except genthreshfortopoterm = 5000 and startoptprec = 0.01). For each individual gene alignment, the best fitting substitution model was chosen using ModelTest v3.7107 with the Akaike information criterion108. Supermatrix analyses were run using a partitioned likelihood substitution model that allowed each locus an independent relative substitution rate. A single general time-reversible nucleotide substitution model with gamma-distributed rate heterogeneity and an estimated proportion of invariable sites was shared by all loci within each supermatrix. Confidence estimates were obtained from 400 bootstrap search replicates computed on each supermatrix. In addition, 200 bootstrap tree searches were performed on each individual locus and used as input to species tree analyses. During bootstrap analyses, substitution model parameter values were fixed at the values estimated during the maximum-likelihood tree search, for computational efficiency. Branches with negligible maximum-likelihood branch length estimates (1 × 10⁻⁸) were collapsed, creating polytomies.
Species tree analyses
The MP-EST program v1.0109 was used to infer species trees from collections of gene trees using a multispecies coalescent model. Analyses were run independently for each chromosome. Polytomies in locus trees were first randomly resolved with zero-length branches. To account for uncertainty in the inference of gene trees for each locus and in the arbitrary resolution of polytomies, MP-EST was run multiple times using gene trees selected from bootstrap samples. For each chromosome, one tree was randomly selected for each locus from the bootstrap samples, and this collection of trees was used as input to MP-EST. This procedure was repeated 400 times. MP-EST support values for species tree branches were calculated as the proportion of replicates returning a species tree containing that branch.
Oryza divergence time estimation
Divergence times within Oryza were estimated using the supermatrix phylogenies inferred for each chromosome. The phylogenies were rooted using the outgroup L. perrieri, which was subsequently pruned from the trees. These pruned trees, with maximum-likelihood branch length estimates obtained from GARLI, were used as input to PATHd8 v1.0110. PATHd8 smooths substitution rates across branches to transform a tree with branch lengths measured as substitutions per site to an ultrametric tree with relative node ages. To convert the relative ages to absolute ages, the age of the crown group of Oryza (the root of the pruned tree) was fixed using a calibration consistent with several recent studies14,111,112 (15 million years).
Introgression among AA genomes
We sought evidence of introgression within the AA-genome species to understand further some of the gene tree discordance observed in the chromosome-level analyses. We used the D statistic113, which examines site patterns (so-called ABBA/ABAB patterns) in genome alignments for a specified four-taxon tree. A significant departure from zero of the difference in numbers of the two kinds of ‘introgression’ sites was tested with a block-jackknife procedure37,114, which is aimed at overcoming autocorrelations within the sequence. We focused on the case that seemed problematic in gene/species tree construction: the position of O. glumaepatula. We used the tree (O. punctata, (O. glumaepatula, (O. barthii, O. rufipogon))) to see whether there was evidence that O. glumaepatula has undergone introgression with either the African O. barthii or Asian O. rufipogon. As a ‘control’, we also considered the tree (O. punctata, (O. meridionalis, (O. barthii, O. rufipogon))), which replaces the problematic O. glumaepatula with another taxon in the AA clade, O. meridionalis, which is more distantly related to the Asian/African pair. Small alignment blocks sampled across the sequences of each chromosome were assembled using the program hakmer115, which identifies exactly matching syntenic single-copy k-mers (k = 32) found in all four taxa, extended by an ungapped 25-nt region up- and downstream of each k-mer. Typically, the final datasets included 10–15% of the original sequence data after this culling. D statistics were computed with a Perl script (available upon request), and block-jackknife estimates of the standard error of D were obtained using m = 20 blocks.
Concerted evolution in chromosomes 11 and 12
Whole-chromosome alignments of complete sequences of chromosomes 11 and 12 from O. sativa (Nipponbare RefSeq sequence), O. rufipogon, O. glaberrima, O. barthii, O. punctata, O. brachyantha and L. perrieri were carried out using a modification of the method described in Jacquemin et al.14 (note: the IR 8 and N 22 genomes were not used in this analysis as they did not provide any meaningful phylogenetic signal beyond the Nipponbare RefSeq sequence). Initial alignment was made with Mugsy116, using the parameters -d 100 -c 200 -nucmeropts -l 20, and alignments were refined with Mugsy itself. All subsequent analyses were encapsulated by in-house scripts. Multiple-sequence alignments (300 bp) were generated directly from the MAF file and converted into a nexus format. Sequences with a majority of undefined bases or that were < 50 bp in length were eliminated. Indels were coded with Indelcoder117 as described, and trees were generated with MRBAYES118 using the following parameters: Nst = 2 and Rates = Invgamma. The data were partitioned according to type: DNA and gap binary information. For the gap binary data partition, we selected the option coding = variable. The four chains were run for 100,000 generations, sampling trees every 100 generations, with the first 25% of trees sampled discarded as burn-in. Posterior probabilities were calculated from the remaining samples. Intra- and interspecies distances were calculated from the output consensus file. Trees containing sequences from at least five species were retained for analysis. Phylogenetic (n = 5,782) trees were retained and used for calculation of intra- and interspecies Bayesian distances using BioPerl modules. For AA-genome analysis, sequences of chromosomes 11 and 12 from O. sativa, O. rufipogon, O. glaberrima, O. barthii, O. nivara, O. glumaepatula, O. meridionalis and O. punctata were used. Divergence dates were calculated from the median nucleotide distance values as previously described14. Dates of divergence between species calculated by this method are consistent with published estimates.
Synteny maps and screen for chromosomal inversions
Syntenic relationships between orthologous genes were mapped for all 78 pairwise combinations of the 13 reference assemblies. We used DAGchainer119 to identify collinear gene pairs within syntenic blocks, with parameters requiring neighboring genes to be no more than ten genes apart and a minimum chain length of five collinear genes. As this method is strict, we additionally identified ‘in-range’ syntenies of orthologs that mapped no more than five genes distant from the expected collinear position120. Clustered sets of syntenic genes encompassing all species were identified by single-linkage clustering over the pairwise relationships. As a second approach, we conducted pairwise whole-genome alignments using LASTZ121 and applied a suite of programs to filter maximum-scoring chains and identify non-overlapping ‘nets’ corresponding to regions of synteny122.
To screen for chromosomal inversions, we first identified in each species the set of syntenic blocks (consisting of five or more collinear orthologs) having reverse orientation relative to the Nipponbare RefSeq sequence (note: the IR 8 and N 22 genomes were not used in this analysis as they did not provide any meaningful phylogenetic signal beyond the Nipponbare RefSeq sequence). Identified blocks were further screened to remove blocks associated with duplication or movement, by ensuring that the immediate upstream and downstream syntenic blocks were contiguous and in the forward orientation in both genomes. To increase confidence in our identification, we next screened for putative inversion events shared by two or more species. Putative inversions that overlapped with respect to IRGSP-1.0 coordinates were identified using BEDTools v2.17.0123. Shared events were also required to have LASTZ121 alignment breakpoints within 20 kb of one another in the IRGSP reference. The set of candidate inversion events was further refined to include only those that could be logically placed at a discrete internal branch of the species tree. Thus, the final set of inversion events was identified as synteny blocks found in reverse orientation in all outgroup species and in the forward orientation in all in-group species. A synteny map of IRGSP-1.0 with B. distachyon (built in the same manner as described above) was used as an additional outgroup to confirm the ancestral state of the region.
LTR–retrotransposon deletion rate
To estimate the deletion rate of LTR-RTs in rice, we first identified loci of the genomes that were absent from O. meridionalis but partly conserved in the remaining eight sequenced AA genomes and that contained deleted LTR-RTs. This was achieved in the following way. (1) All AA genomes were analyzed with RepeatMasker (see URLs) using a database of only full-length LTR-RTs to identify regions containing LTR-RT sequences. (2) To identify orthologous regions between the Nipponbare RefSeq sequence29,126 and all the other AA genomes (query), sequences were aligned with NUCmer from the MUMmer package (version 3.1)125 using the Nipponbare RefSeq sequence29 (IRGSP1.0 assembly) as the reference: nucmer -g 500 <reference> <query>, default for all other options. The NUCmer outputs were then parsed with the utility show-coords from the same package: show-coords -r -g -I 70 -T -H <nucmer output>. The -g option was used to secure the orthologous relationship between the conserved blocks, thereby allowing the identification of indels by the break between two adjacent alignments. These analyses allowed the identification of conserved blocks between O. sativa vg. japonica and each of the other AA genomes. Moreover, as mentioned above, the show-coords output from the O. sativa vg. japonica–O. meridionalis comparison led to the identification of indels between the two genomes (regions of O. sativa vg. japonica that were absent from O. meridionalis at orthologous positions). (3) Starting from the show-coords output, custom Perl scripts were used to identify regions that were common between O. sativa vg. japonica and one to five of the seven remaining AA genomes (O. sativa vg. indica, O. barthii, O. glaberrima, O. glumaepatula, O. nivara, O. rufipogon and O. meridionalis) and that overlapped regions identified as LTR-RT parts by the RepeatMasker analysis (note: all data extracted from O. sativa vg. indica were identical to the IR 8 RefSeq data and thus were not used in this analysis) and to extract the sequences corresponding to these orthologous regions in all AA genomes, including 500 bp before and after the break position in O. meridionalis, to create multifasta files for each selected locus.
The whole set of sequences from one multifasta file were aligned using MAFFT v6.940b126 as follows: mafft -op 5 -ep 0 < multifasta file > . Increasing the opening penalty (-op) as compared to the default options allowed identification of the deleted parts from each sequence. Custom Perl scripts were then used to remove alignments that contained at least one sequence displaying stretches of 100 or more N’s that could represent assembly gaps, to measure deletion lengths in each aligned sequence and to compare them to the length of the presumed initial complete element so that a deletion rate in kb/million years per element and a half-life could be calculated.
Assembly-based indel detection
We detected indels from eight comparisons among closely related species with easily alignable genomes (Supplementary Table 34): O. sativa vg. japonica (Nipponbare) versus each of O. sativa vg. indica (93-11, IR 8 and N 22), O. rufipogon and O. nivara (with O. barthii as the outgroup); O. sativa vg. japonica versus each of O. glaberrima and O. barthii (with O. glumaepatula as the outgroup); and O. glaberrima versus O. barthii (with O. sativa vg. japonica as the outgroup) (summarized in Supplementary Table 34). Genome assemblies were first soft masked with RepeatMasker. Chromosome all-to-all alignments were performed with LASTZ121 between the target and query genomes, with the following parameters: --strand=both --ambiguous=n --inner=2000 --gappedthresh=6000 --gapped --identity=90. The resultant alignment blocks were further parsed with the CHAINNET package122. Syntenic alignments between intact contigs in the top chain were used to detect indels. We further inferred indels by allowing a gap to cover adjacent alignments with Perl scripts, which permitted us to detect additional indel events.
Indel detection in population genome data
Sequence reads from O. glaberrima and O. barthii accessions were mapped onto the O. glaberrima (CG14) and O. barthii (version 1.3) genome assemblies using the Burrows–Wheeler aligner (BWA, version 0.7.12). Raw alignment files were further parsed by SAMtools (version 1.2) to remove duplicated reads that might be due to PCR amplification and reads that were mapped to multiple loci. Pindel (version 0.2.5b8)127 was then used to call indels with default parameters. Only indels detected in at least two individuals and without sequence gaps were subjected to further analysis. O. sativa vg. japonica and O. glumaepatula were used as outgroups to determine the ancestral state for each indel. If an indel was present in all O. glaberrima individuals, it was regarded as a ‘fixed indel’. If an indel was present between individuals in a species, it was defined as a ‘within-species indel’. Genome-wide genetic diversity (π) was calculated with indel markers using VCFtools v0.1.12128. Comparison of indels called using resequencing data versus the assembly-alignment-based approach identified a total of 23,372 ( > 1-bp) high-confidence indels that overlapped using both methods (1-bp indels were excluded to avoid false calls caused by sequencing errors) (Supplementary Table 35), a number much lower (~50%) than that estimated using the genome-alignment-based approach alone (46,307). This difference may be due to the low efficiency of the short-read mapping-based method to detect indels in repetitive genomic regions and the fact that many indels detected from single-genome comparisons were only detected in a single accession (Supplementary Table 35).
Comparative methods using Ensembl gene trees
The Ensembl Compara pipeline131 was implemented to define gene families, construct phylogenetic gene trees, and infer orthologs and paralogs. Updated protocols used in Ensembl version 75 software are detailed elsewhere (see URLs). Briefly, the longest encoded protein for each gene was subjected to an all-versus-all NCBI BLAST + alignment followed by clustering with hcluster_sg130. Each cluster, regarded as a gene family, was subjected to multiple-sequence alignment using several independent methods131,132,133,134, with a consensus alignment produced with M-Coffee135. TreeBest software was used to construct consensus phylogenetic gene trees incorporating five different tree-building methods: two were maximum-likelihood methods based on either protein alignment (WAG model) or codon alignment (phymal HKY model), and three were neighbor-joining methods that used p distance, dN distance or dS distance within codon alignments. The pipeline was run on the MAKER-P136 annotations for ten Oryza species and L. perrieri (Table 1). Also included were annotations of three outgroup species, Arabidopsis thaliana (version TAIR10)137, Sorghum bicolor (version Sbi1.4)138 and B. distachyon (version Brachy1.2)139, loaded from Gramene v40 Ensembl core databases140. Tree reconciliation to classify duplication and speciation nodes, and the assignment of taxon levels to nodes, made use of the following input species tree, which was devised on the basis of results described here (Fig. 1) and the NCBI Taxonomy database141
(((((((((((oryza_rufipogon,oryza_sativa_japonica)D,(oryza_sativa_indica,oryza_nivara)B)A,(oryza_glaberrima,oryza_barthii)C)E,Oryza_glumaepatula)F,oryza_meridionalis)I,oryza_punctata)J,oryza_brachyantha)O,leersia_perrieri)P,brachypodium_distachyon)L,sorghum_bicolor)M,Arabidopsis_thaliana)N
The Ensembl Compara pipeline was repeated to include annotations of the PacBio long-read assemblies using version 87 software (see URLs) and the following input species tree
(((((((((((oryza_rufipogon,oryza_sativa_japonica)D,((oryza_sativa_indica,oryza_sativa_IR8,oryza_nivara)B,oryza_sativa_N22)Q)A,(oryza_glaberrima,oryza_barthii)C)E,oryza_glumaepatula)F,oryza_meridionalis)I,oryza_punctata)J,oryza_brachyantha)O,leersia_perrieri)P,brachypodium_distachyon)L,sorghum_bicolor)M,Arabidopsis_thaliana)N
Results from the first run of the pipeline were predominantly used in downstream analyses, whereas results from the second run were used in the analysis of IR 8 and N 22 annotations. Gene family and syntelog designations are provided in Supplementary Data 1.
Because NCBI taxon identifiers were not available for most nodes of the species tree, we assigned each node an arbitrary letter name. Where available, the corresponding NCBI Taxonomies were as follows: N, Magnoliophyta (tax_id:3398); M, Poaceae (tax_id:4479); L, Pooideae (tax_id:147368); P, Oryzeae (tax_id: 147380); and O, Oryza (tax_id:4527).
Putative falsely split gene models were detected by an automated pipeline that identifies adjacent ‘paralogs’ that do not overlap in multiple-sequence alignments140.
Rates of synonymous and nonsynonymous substitutions relative to the Nipponbare RefSeq sequence29 were determined for the subset of annotated loci having syntenic orthologs in O. sativa vg. japonica. Amino acid sequences were aligned in a pairwise fashion using CLUSTALW version 1.83142. Alignments were back-translated to coding sequences, and gaps were removed using BioPerl143. Ka and Ks substitution rates were estimated using Codeml (F3X4 codon frequency model) within PAML package version 4.3144.
Repeat coverage in 2-kb upstream and downstream regions flanking genes was calculated using the intersectBED utility from BEDTools v2.17.0123 and evaluated for differences using the t.test function in R145.
GO functional enrichment of gene families grouped into the ‘Poaceae bin’ (families with root nodes of M and/or L) and the ‘Oryzeae bin’ (all other root nodes except N and leaf nodes) was analyzed using the online AgriGO Singular Enrichment Analysis tool146. For each taxon bin, corresponding genes in O. sativa vg. japonica with GO assignments were used as queries and tested for enrichment against a reference of all genes with GO assignments, using the hypergeometric statistical test option, applying the Hochberg FDR test for multi-test adjustment and requiring a minimum number of mapping entries of five. For InterPro domain enrichment, the number of genes possessing each InterPro domain was tallied in each taxon bin and among all genes overall across all 11 species. Enrichment was tested using R145 with the hypergeometric distribution function, phyper and Bonferroni correction using p.adjust.
For analysis of correlation of gene coding length, expression, and Ka, Ks and Ka/Ks with gene family age, we used O. sativa vg. japonica as the focal species. Age ranks for gene families were assigned, from youngest to oldest, on the basis of the root node taxon of the corresponding gene tree for each family, as follows: 0, species-specific families and orphans; 1, families at node D; 2, node A; 3, node E; 4, node F; 5, node I; 6, node J; 7, node O; 8, node P; 9, node L; 10, node M; and 11, node N (see “Compara input species tree” for node positions and Fig. 5). Because older gene families tended to have more genes (data not shown), which could bias results, we selected a single value to represent each family for each parameter. For coding length, we averaged the coding lengths of the longest predicted transcript for all genes in the family. For expression, we selected the FPKM value for the most highly expressed gene across tissues from within each family. For Ka, Ks and Ka/Ks, we used syntenic O. nivara loci (see below) as the reference, taking the lowest value to represent each family. Correlation between assigned age rank and each parameter was tested using Kendall’s tau rank correlation coefficient, as implemented using the cor.test function in R145.
The integrated genetic/physical map (constructed using data from Harushima et al.147 and McCouch et al.148) for O. sativa vg. japonica was downloaded from Gramene (see URLs)140. Recombination rates were calculated as cM/Mb over 2-Mb windows across each chromosome.
Ancestral state reconstruction of lincRNA families
LincRNA loci within and between species were grouped into families on the basis of sequence similarity. A set of non-redundant exons for each locus was generated from transcript GTF files using an R script (available upon request). Repeats and TEs were masked in genomes using the maskFastaFromBed utility in BEDTools v2.17.0123. Fasta files for non-redundant exons at each locus were then generated from repeat-masked genomes using the gffread utility in Cufflinks147. LincRNA families were first identified within each species using BLASTN v2.2.28148 (E value < 1 × 10⁻⁵). Families were then grouped across species using a best hit reciprocal BLASTN approach, with the full transcriptomes (protein-coding and all unannotated, intergenic loci) for each species used as the queried databases. Multi-locus families with linkage to multiple families in the same species were all grouped into a single family. Ancestral state reconstruction of lincRNA families within the Oryza phylogeny was performed with Mesquite v3.02 using a parsimony approach and an unordered evolutionary model for gains and losses149. When ambiguous, the lincRNA family at a particular node was assumed to be absent.
Transposable element content of lincRNAs
TE content for lincRNA loci was generated by cross-referencing a GFF file with all annotated TEs and a GFF file with non-redundant exons for lincRNA loci in each species using the intersectBed utility from BEDTools v2.17.0123.
Comparative analysis of resistance genes
A seed set of putative disease resistance genes was identified by screening for the NB-ARC nucleotide-binding adaptor domain (IPR002182) in predicted proteins. The list of candidate genes was further expanded to include any gene from the Compara-designated family from which the seed gene originated. These totaled 5,104 genes in 36 gene families. Among them, 381 falsely split gene models were reannotated, consolidating them into 180 genes. More consistent annotation of domain structure was accomplished by running PfamScan150, initially accepting domain hits with a p-score threshold of less than 0.001. We noted that this threshold was too stringent for a number of relevant Pfam domains, for example, LRRs and RPW8, resulting in false-negative detection. To increase sensitivity, we relaxed the stringency to a p score of 1 for these and any domain that, in the initial high-stringency screen, was detected in at least six genes and at least two species. Domains that met these criteria included the following: NB-ARC, LRR_1, LRR_2, LRR_3, LRR_4, LRR_5, LRR_6, LRR_8, LRR_9, LRRNT_2, RPW8, AAA_16, TIR_2, Jacalin, Pkinase, PPR_2, WRKY, zf-BED, Thioredoxin, B3, TAXi_C, TAXi_N, RPW8, UPF0261, TIR, PP2C, DUF3681, Myb_DNA-bind_4, DUF3877, C1_3, C1_2, BTB, AvrRpt-cleavage and ALIX_LYPXL_bnd. Coiled-coil domains were annotated using the Coils output of InterProScan.
The above procedure resulted in identification of 5,749 genes in 36 Compara families, of which 5,408 (94%) had detectable NB-ARC domains.
A phylogenetic analysis was performed using the NB-ARC domains extracted from the genes of L. perrieri, O. punctata and O. sativa vg. indica (93-11). Domains less than 200 amino acids in length were excluded as being likely fragments, resulting in 1,000 sequences (306 L. perrieri, 273 O. punctata and 421 O. sativa vg. indica (93-11)). To construct a multiple-sequence alignment, we first built a hidden Markov model (HMM) from 12 complete NB-ARC domains selected from genes of different families. A ClustalW alignment of these was fed into the hmmbuild program from the HMMER 3.0 package151. The resulting HMM model was then used to align the 1,000 sequences using hmmalign with the -trim option151. A maximum-likelihood phylogenetic tree was built using FastTree 2.0152 employing the WAG + CAT model and branch support was reported using the Shimodaira–Hasegawa method on 1,000 resampled alignments. Tree visualization used FigTree (see URLs).
To estimate rates of gene duplication, we focused on a subset of 28 Compara gene families having representatives from all species. Using Ensembl API scripts, Compara trees were traversed and nodes classified as duplication nodes were tallied according to the assigned taxonomy level (based on the most recent common ancestor). To reduce false positives, only nodes with a duplication consistency score129 greater than 0.5 were collected.
To map published disease resistance genes to R-gene families, the following GenBank protein fasta accessions were used as queries: BAK39922.1 (RGA4)78, BAK39930.1 (RGA5)78, ABI94578.1 (Pi37)153, BAH20864.1 (Pit)92, BAA76282.2 (Pib)154, ABB88855.1 (Pi9)155, ABC94599.1 (Pi2)156, ACN62383.1 (Pid3)157, ABI64281.1 (Pi36)158, ACJ54697.1 (Pi5-1)82, ACJ54698.1 (Pi5-2)82, BAJ25848.1 (Pb1)159, AAY33493.1 (pi54)160, CCD32366.1 (pi54), BAG72135.1 (Pik1)83, BAG72136.1 (Pik2)83, ABA92370.1 (NLS1)161, AAO45178.1 (Pi-ta)161, XP_015626818 (RLS1)162 and AB002266 (Xa1)163. NCBI BLASTP164 was performed, and significant hits (E value ≤ 1 × 10⁻¹⁰) were manually evaluated for quality and assigned to a gene family.
Visualization of R-gene loci for preparation of figures was made using the genoPlotR package165.
URLs
Genome sequences, annotation and comparative analyses used in this study are available for browsing and download at http://oge.gramene.org/. Gramene, http://archive.gramene.org/; RepeatMasker, http://www.repeatmasker.org/; Ensembl Compara 2014, http://Feb2014.archive.ensembl.org/info/genome/compara/homology_method.html; Ensembl Compara 2016: version 87, http://dec2016.archive.ensembl.org/info/genome/compara/homology_method.html; FigTree, http://tree.bio.ed.ac.uk/software/figtree/; IRRI Rice Knowledge Bank, http://www.knowledgebank.irri.org/images/docs/wild-rice-taxonomy.pdf; rice centromerers, http://rice.plantbiology.msu.edu/annotation_pseudo_centromeres.shtml; RepeatMasker, http://www.repeatmasker.org/.
Accession codes
All custom codes used in this study will be made available upon request.
Life Sciences Reporting Summary
Further information on experimental design is available in the Life Sciences Reporting Summary.
Data availability
Supplementary Data 1 (also available at the CyVerse Data Commons; https://doi.org/10.7946/P2FC9Z) contains FPC maps, BES alignment data, gene and repeat annotations and fasta, Trinity assemblies of RNA-seq data, Compara gene trees and gene family and synteny relationships, chromosome-feature distribution plots and quantitative gene expression data. All sequence data, except for the leaf and root RNA-seq data from O. brachyantha, have been deposited in GenBank. Additional O. brachyantha RNA-seq data from root and leaves, and all other data, are available from the corresponding authors upon reasonable request.
All BAC-end sequences were deposited at NCBI with the following accession numbers: O. barthii, 67,314 BESs (KS450671–KS517984); O. glumaepatula, 63,194 BESs (JM144568–JM170463, JY086207–JY123504); O. meridionalis, 30,567 BESs (JM114001–JM144567); L. perrieri, 66,421 BESs (JM429052–JM495472).
GenBank BioProject codes: O. sativa vg. indica (IR8), PRJNA353946; O. sativa vg. aus (N22), PRJNA315689; O. rufipogon (W1943), PRJEB4137; O. nivara (IRGC100897), PRJNA48107; O. barthii (IRGC105608), PRJNA30379; O. glaberrima (IRGC96717), PRJNA13765; O. glumaepatula (GEN1233_2), PRJNA48429; O. meridionalis (W2112), PRJNA48433; O. punctata (IRGC105690), PRJNA13770; O. brachyantha (IRGC101232), PRJNA70533; L. perrieri (IRGC105164), PRJNA163065.
INSDC and GenBank numbers of the reference genomes used: O. sativa vg. indica (IR 8): MPPV00000000.1, GCA_001889745.1; O. sativa vg. aus (N 22): LWDA00000000.1, GCA_001952365.1; O. nivara: AWHD00000000.1, GCA_000576065.1; O. rufipogon: CBQP000000000.1, GCA_000817225.1; O. barthii: ABRL00000000.2, GCA_000182155.2; O. glaberrima: ADWL00000000.1, GCA_000147395.2; O. glumaepatula: ALNU00000000.2, GCA_000576495.1; O. meridionalis: ALNW00000000.2, GCA_000338895.2; O. punctata: AVCL00000000.1, GCA_000573905.1; O. brachyantha: AGAT00000000.1, GCA_000231095.2; L. perrieri: ALNV00000000.2, GCA_000325765.3.
NCBI SRA whole genome shotgun sequence reads: O. nivara - SRX663049-SRX663053; O. rufipogon - ERX096841; O. barthii - SRX662937-SRX662945; O. glumaepatula - SRX663040-SRX663043; O. meridionalis - SRX663044-SRX663048; O. punctata - SRX662909-SRX662935; Leersia perrieri - SRX663039.
NCBI SRA accession numbers for RNA-seq data (Leaf, Panicle, Root): O. sativa vg. japonica - SRX477950, SRX477951, SRX477952; O. rufipogon - SRX512340, SRX512341, SRX512342; O. nivara - SRX472708, SRX472710, SRX472709; O. barthii - SRX471823, SRX472434, SRX472435; O. glaberrima - SRX474528, SRX474529, SRX474530; O. glumaepatula - SRX475002, SRX475003, SRX475004; O. meridionalis - SRX475006, SRX475007,SRX475008; O. punctata - SRX472098, SRX472099, SRX472100; O. brachyantha SRX475011; Leersia perrieri - SRX472913, SRX472914, SRX472915.
Change history
05 October 2018
This article was not made open access when initially published online, which was corrected before print publication. In addition, ORCID links were missing for 12 authors and have been added to the HTML and PDF versions of the article.
References
Atwell, B. J., Wang, H. & Scafaro, A. P. Could abiotic stress tolerance in wild relatives of rice be used to improve Oryza sativa? Plant Sci. 215–216, 48–58 (2014).
Giuliani, R. et al. Coordination of leaf photosynthesis, transpiration, and structural traits in rice and wild relatives (Genus Oryza). Plant Physiol. 162, 1632–1651 (2013).
Mizuta, Y., Harushima, Y. & Kurata, N. Rice pollen hybrid incompatibility caused by reciprocal gene loss of duplicated genes. Proc. Natl. Acad. Sci. USA 107, 20417–20422 (2010).
Garg, R. et al. Deep transcriptome sequencing of wild halophyte rice, Porteresia coarctata, provides novel insights into the salinity and submergence tolerance factors. DNA Res. 21, 69–84 (2014).
Iwamatsu, Y. et al. UVB sensitivity and cyclobutane pyrimidine dimer (CPD) photolyase genotypes in cultivated and wild rice species. Photochem. Photobiol. Sci. 7, 311–320 (2008).
He, R. et al. A systems-wide comparison of red rice (Oryza longistaminata) tissues identifies rhizome specific genes and proteins that are targets for cultivated rice improvement. BMC Plant Biol. 14, 46 (2014).
Song, W. Y. et al. A receptor kinase-like protein encoded by the rice disease resistance gene, Xa21. Science 270, 1804–1806 (1995).
Jena, K. K. The species of the genus Oryza and transfer of useful genes from wild species into cultivated rice, O. sativa. Breed. Sci. 60, 518–523 (2010).
Ammiraju, J. S. S. et al. The Oryza bacterial artificial chromosome library resource: construction and analysis of 12 deep-coverage large-insert BAC libraries that represent the 10 genome types of the genus. Oryza. Genome Res. 16, 140–147 (2006).
Ammiraju, J. S. S. et al. The Oryza BAC resource: a genus-wide and genome scale tool for exploring rice genome evolution and leveraging useful genetic diversity from wild relatives. Breed. Sci. 60, 536–543 (2010).
Kim, H. et al. Construction, alignment and analysis of twelve framework physical maps that represent the ten genome types of the genus Oryza. Genome Biol. 9, R45 (2008).
Kim, H. et al. Comparative physical mapping between Oryza sativa (AA genome type) and O. punctata (BB genome type). Genetics 176, 379–390 (2007).
Rounsley, S. et al. De novo next generation sequencing of plant genomes. Rice 2, 35–43 (2009).
Jacquemin, J. et al. Long-range and targeted ectopic recombination between the two homeologous chromosomes 11 and 12 in Oryza species. Mol. Biol. Evol. 28, 3139–3150 (2011).
Jacquemin, J., Laudié, M. & Cooke, R. A recent duplication revisited: phylogenetic analysis reveals an ancestral duplication highly-conserved throughout the Oryza genus and beyond. BMC Plant Biol. 9, 146 (2009).
Zhao, Y. et al. Identification and analysis of unitary loss of long-established protein-coding genes in Poaceae shows evidences for biased gene loss and putatively functional transcription of relics. BMC Evol. Biol. 15, 66 (2015).
Ammiraju, J. S. S. et al. Dynamic evolution of Oryza genomes is revealed by comparative genomic analysis of a genus-wide vertical data set. Plant Cell 20, 3191–3209 (2008).
Jacquemin, J. et al. Fifteen million years of evolution in the Oryza genus shows extensive gene family expansion. Mol. Plant 7, 642–656 (2014).
Sanyal, A. et al. Orthologous comparisons of the Hd1 region across genera reveal Hd1 gene lability within diploid Oryza species and disruptions to microsynteny in Sorghum. Mol. Biol. Evol. 27, 2487–2506 (2010).
Piegu, B. et al. Doubling genome size without polyploidization: dynamics of retrotransposition-driven genomic expansions in Oryza australiensis, a wild relative of rice. Genome Res. 16, 1262–1269 (2006).
Ammiraju, J. S. S. et al. Evolutionary dynamics of an ancient retrotransposon family provides insights into evolution of genome size in the genus Oryza. Plant J. 52, 342–351 (2007).
Lu, F. et al. Comparative sequence analysis of MONOCULM1-orthologous regions in 14 Oryza genomes. Proc. Natl. Acad. Sci. USA 106, 2071–2076 (2009).
Ammiraju, J. S. S. et al. Spatio-temporal patterns of genome evolution in allotetraploid species of the genus Oryza. Plant J. 63, 430–442 (2010).
Wang, M. et al. The genome sequence of African rice (Oryza glaberrima) and evidence for independent domestication. Nat. Genet. 46, 982–988 (2014).
Zhang, Y. et al. Genome and comparative transcriptomics of African wild rice Oryza longistaminata provide insights into molecular mechanism of rhizomatousness and self-incompatibility. Mol. Plant 8, 1683–1686 (2015).
Zhang, Q. J. et al. Rapid diversification of five Oryza AA genomes associated with rice adaptation. Proc. Natl. Acad. Sci. USA 111, E4954–E4962 (2014).
Zhang, J. et al. Extensive sequence divergence between the reference genomes of two elite indica rice varieties Zhenshan 97 and Minghui 63. Proc. Natl. Acad. Sci. USA 113, E5163–E5171 (2016).
Chen, J. F. et al. Whole-genome sequencing of Oryza brachyantha reveals mechanisms underlying Oryza genome evolution. Nat. Commun. 4, 1595 (2013).
International Rice Genome Sequencing Project. The map-based sequence of the rice genome. Nature 436, 793–800 (2005).
Yu, J. et al. A draft sequence of the rice genome (Oryza sativa L. ssp. indica). Science 296, 79–92 (2002).
Madriñán, S., Cortés, A. J. & Richardson, J. E. Páramo is the world’s fastest evolving and coolest biodiversity hotspot. Front. Genet. 4, 192 (2013).
Cranston, K. et al. Phylogenomic analysis of BAC-end sequence libraries in Oryza (Poaceae). Syst. Bot. 35, 512–523 (2010).
Zhu, T. et al. Phylogenetic relationships and genome divergence among the AA-genome species of the genus Oryza as revealed by 53 nuclear genes and 16 intergenic regions. Mol. Phylogenet. Evol. 70, 348–361 (2014).
Zwickl, D. J., Stein, J. C., Wing, R. A., Ware, D. & Sanderson, M. J. Disentangling methodological and biological sources of gene tree discordance on Oryza (Poaceae) chromosome 3. Syst. Biol. 63, 645–659 (2014).
Degnan, J. H. & Rosenberg, N. A. Gene tree discordance, phylogenetic inference and the multispecies coalescent. Trends Ecol. Evol. 24, 332–340 (2009).
Molina, J. et al. Molecular evidence for a single evolutionary origin of domesticated rice. Proc. Natl. Acad. Sci. USA 108, 8351–8356 (2011).
Durand, E. Y., Patterson, N., Reich, D. & Slatkin, M. Testing for ancient admixture between closely related populations. Mol. Biol. Evol. 28, 2239–2252 (2011).
Wang, X. et al. Genome alignment spanning major Poaceae lineages reveals heterogeneous evolutionary rates and alters inferred dates for key evolutionary events. Mol. Plant 8, 885–898 (2015).
Murat, F. et al. Ancestral grass karyotype reconstruction unravels new mechanisms of genome shuffling as a source of plant evolution. Genome Res. 20, 1545–1557 (2010).
Murat, F. et al. Shared subgenome dominance following polyploidization explains grass genome evolutionary plasticity from a seven protochromosome ancestor with 16K protogenes. Genome Biol. Evol. 6, 12–33 (2014).
Uozu, S. et al. Repetitive sequences: cause for variation in genome size and chromosome morphology in the genus Oryza. Plant Mol. Biol. 35, 791–799 (1997).
Bao, W., Kojima, K. K. & Kohany, O. Repbase Update, a database of repetitive elements in eukaryotic genomes. Mob. DNA 6, 11 (2015).
Vitte, C., Chaparro, C., Quesneville, H. & Panaud, O. Spip and Squiq, two novel rice non-autonomous LTR retro-element families related to RIRE3 and RIRE8. Plant Sci. 172, 8–19 (2007).
Ma, J., Devos, K. M. & Bennetzen, J. L. Analyses of LTR–retrotransposon structures reveal recent and rapid genomic DNA loss in rice. Genome Res. 14, 860–869 (2004).
Ma, J. & Bennetzen, J. L. Rapid recent growth and divergence of rice nuclear genomes. Proc. Natl. Acad. Sci. USA 101, 12404–12410 (2004).
Vitte, C., Panaud, O. & Quesneville, H. LTR retrotransposons in rice (Oryza sativa, L.): recent burst amplifications followed by rapid DNA loss. BMC Genomics 8, 218 (2007).
Schneeberger, K. et al. Reference-guided assembly of four diverse Arabidopsis thaliana genomes. Proc. Natl. Acad. Sci. USA 108, 10249–10254 (2011).
Gregory, T. R. Insertion–deletion biases and the evolution of genome size. Gene 324, 15–34 (2004).
Meyer, R. S. et al. Domestication history and geographical adaptation inferred from a SNP map of African rice. Nat. Genet. 48, 1083–1088 (2016).
Caicedo, A. L. et al. Genome-wide patterns of nucleotide polymorphism in domesticated rice. PLoS Genet. 3, 1745–1756 (2007).
Choi, C. M., Gray, W. M., Mooney, S. & Hellmann, H. Composition, roles, and regulation of cullin-based ubiquitin E3 ligases. Arabidopsis Book 12, e0175 (2014).
Navarro-Quezada, A., Schumann, N. & Quint, M. Plant F-box protein evolution is determined by lineage-specific timing of major gene family expansion waves. PLoS One 8, e68672 (2013).
Hincha, D. K. & Thalhammer, A. LEA proteins: IDPs with versatile functions in cellular dehydration tolerance. Biochem. Soc. Trans. 40, 1000–1003 (2012).
Bennetzen, J. L., Coleman, C., Liu, R., Ma, J. & Ramakrishna, W. Consistent over-estimation of gene number in complex plant genomes. Curr. Opin. Plant Biol. 7, 732–736 (2004).
Long, M., VanKuren, N. W., Chen, S. & Vibranovski, M. D. New gene evolution: little did we know. Annu. Rev. Genet. 47, 307–333 (2013).
Arendsee, Z. W., Li, L. & Wurtele, E. S. Coming of age: orphan genes in plants. Trends Plant Sci. 19, 698–708 (2014).
Schlötterer, C. Genes from scratch—the evolutionary fate of de novo genes. Trends Genet. 31, 215–219 (2015).
Carvunis, A. R. et al. Proto-genes and de novo gene birth. Nature 487, 370–374 (2012).
Neme, R. & Tautz, D. Phylogenetic patterns of emergence of new genes support a model of frequent de novo evolution. BMC Genomics 14, 117 (2013).
Palmieri, N., Kosiol, C. & Schlötterer, C. The life cycle of Drosophila orphan genes. eLife 3, e01311 (2014).
Wolf, Y. I., Novichkov, P. S., Karev, G. P., Koonin, E. V. & Lipman, D. J. The universal distribution of evolutionary rates of genes and distinct characteristics of eukaryotic genes of different apparent ages. Proc. Natl. Acad. Sci. USA 106, 7273–7280 (2009).
Guo, Y. L. Gene family evolution in green plants with emphasis on the origination and evolution of Arabidopsis thaliana genes. Plant J. 73, 941–951 (2013).
Donoghue, M. T., Keshavaiah, C., Swamidatta, S. H. & Spillane, C. Evolutionary origins of Brassicaceae specific genes in Arabidopsis thaliana. BMC Evol. Biol. 11, 47 (2011).
Wu, D.-D. et al. “Out of pollen” hypothesis for origin of new genes in flowing plants: study from Arabidopsis thaliana. Genome Biol. Evol. 6, 2822–2829 (2014).
Prabh, N. & Rödelsperger, C. Are orphan genes protein-coding, prediction artifacts, or non-coding RNAs? BMC Bioinformatics 17, 226 (2016).
Wang, W. et al. High rate of chimeric gene origination by retroposition in plant genomes. Plant Cell 18, 1791–1802 (2006).
Zhang, C. et al. High occurrence of functional new chimeric genes in survey of rice chromosome 3 short arm genome sequences. Genome Biol. Evol. 5, 1038–1048 (2013).
Jiang, N., Bao, Z., Zhang, X., Eddy, S. R. & Wessler, S. R. Pack-MULE transposable elements mediate gene evolution in plants. Nature 431, 569–573 (2004).
Hanada, K. et al. The functional role of pack-MULEs in rice inferred from purifying selection and expression profile. Plant Cell 21, 25–38 (2009).
Ferguson, A. A., Zhao, D. & Jiang, N. Selective acquisition and retention of genomic sequences by Pack-Mutator-like elements based on guanine–cytosine content and the breadth of expression. Plant Physiol. 163, 1419–1432 (2013).
Wang, J. et al. DNA methylation changes facilitated evolution of genes derived from Mutator-like transposable elements. Genome Biol. 17, 92 (2016).
Kapusta, A. et al. Transposable elements are major contributors to the origin, diversification, and regulation of vertebrate long noncoding RNAs. PLoS Genet. 9, e1003470 (2013).
Kelley, D. & Rinn, J. Transposable elements reveal a stem cell–specific class of long noncoding RNAs. Genome Biol. 13, R107 (2012).
Schatz, M. C. et al. Whole genome de novo assemblies of three divergent strains of rice, Oryza sativa, document novel gene space of aus and indica. Genome Biol. 15, 506 (2014).
Yu, P. et al. Genome-wide copy number variations in Oryza sativa L. BMC Genomics 14, 649 (2013).
Yao, W. et al. Exploring the rice dispensable genome using a metagenome-like assembly strategy. Genome Biol. 16, 187 (2015).
Leister, D. Tandem and segmental gene duplication and recombination in the evolution of plant disease resistance gene. Trends Genet. 20, 116–122 (2004).
Okuyama, Y. et al. A multifaceted genomics approach allows the isolation of the rice Pia-blast resistance gene consisting of two adjacent NBS-LRR protein genes. Plant J. 66, 467–479 (2011).
Zhou, T. et al. Genome-wide identification of NBS genes in japonica rice reveals significant expansion of divergent non-TIR NBS-LRR genes. Mol. Genet. Genomics 271, 402–415 (2004).
Yang, S. et al. Genome-wide investigation on the genetic variations of rice disease resistance genes. Plant Mol. Biol. 62, 181–193 (2006).
Cesari, S. et al. The rice resistance protein pair RGA4/RGA5 recognizes the Magnaporthe oryzae effectors AVR-Pia and AVR1-CO39 by direct binding. Plant Cell 25, 1463–1481 (2013).
Lee, S. K. et al. Rice Pi5-mediated resistance to Magnaporthe oryzae requires the presence of two coiled-coil–nucleotide-binding–leucine-rich repeat genes. Genetics 181, 1627–1638 (2009).
Ashikawa, I. et al. Two adjacent nucleotide-binding site–leucine-rich repeat class genes are required to confer Pikm-specific rice blast resistance. Genetics 180, 2267–2276 (2008).
Cesari, S., Bernoux, M., Moncuquet, P., Kroj, T. & Dodds, P. N. A novel conserved mechanism for plant NLR protein pairs: the “integrated decoy” hypothesis. Front. Plant Sci. 5, 606 (2014).
Sarris, P. F., Cevik, V., Dagdas, G., Jones, J. D. & Krasileva, K. V. Comparative analysis of plant immune receptor architectures uncovers host proteins likely targeted by pathogens. BMC Biol. 14, 8 (2016).
Kroj, T., Chanclud, E., Michel-Romiti, C., Grand, X. & Morel, J. B. Integration of decoy domains derived from protein targets of pathogen effectors into plant immune receptors is widespread. New Phytol. 210, 618–626 (2016).
Bryan, G. T. et al. A single amino acid difference distinguishes resistant and susceptible alleles of the rice blast resistance gene Pi-ta. Plant Cell 12, 2033–2046 (2000).
Jacquemin, J., Bhatia, D., Singh, K. & Wing, R. A. The International Oryza Map Alignment Project: development of a genus-wide comparative genomics platform to help solve the 9 billion-people question. Curr. Opin. Plant Biol. 16, 147–156 (2013).
Pease, J. B., Haak, D. C., Hahn, M. W. & Moyle, L. C. Phylogenomics reveals three sources of adaptive variation during a rapid radiation. PLoS Biol. 14, e1002379 (2016).
Fontaine, M. C. et al. Extensive introgression in a malaria vector species complex revealed by phylogenomics. Science 347, 1258524 (2015).
Maddison, W. Gene trees in species trees. Syst. Biol. 46, 523–536 (1997).
Hayashi, K. & Yoshida, H. Refunctionalization of the ancient rice blast disease resistance gene Pit by the recruitment of a retrotransposon as a promoter. Plant J. 57, 413–425 (2009).
Zhang, H. et al. Transposon-derived small RNA is responsible for modified function of WRKY45 locus. Nat. Plants 2, 16016 (2016).
Butelli, E. et al. Retrotransposons control fruit-specific, cold-dependent accumulation of anthocyanins in blood oranges. Plant Cell 24, 1242–1255 (2012).
Ong-Abdullah, M. et al. Loss of Karma transposon methylation underlies the mantled somaclonal variant of oil palm. Nature 525, 533–537 (2015).
Xiao, W. et al. A rice gene of de novo origin negatively regulates pathogen-induced defense response. PLoS One 4, e4603 (2009).
SanMiguel, P. et al. Nested retrotransposons in the intergenic regions of the maize genome. Science 274, 765–768 (1996).
Yang, L. & Gaut, B. S. Factors that contribute to variation in evolutionary rate among Arabidopsis genes. Mol. Biol. Evol. 28, 2359–2369 (2011).
Pennisi, E. Armed and dangerous. Science 327, 804–805 (2010).
Pooja, K. & Katoch, A. Past, present and future of rice blast management. Plant Sci. Today 1, 165–173 (2014).
Fukuoka, S. et al. Gene pyramiding enhances durable blast disease resistance in rice. Sci. Rep. 5, 7773 (2015).
Goff, S. A. et al. A draft sequence of the rice genome (Oryza sativa L. ssp. japonica). Science 296, 92–100 (2002).
Harushima, Y. et al. A high-density rice genetic linkage map with 2275 markers using a single F2 population. Genetics 148, 479–494 (1998).
McCouch, S. R. et al. Development and mapping of 2240 new SSR markers for rice (Oryza sativa L.). DNA Res. 9, 199–207 (2002).
Löytynoja, A. & Goldman, N. An algorithm for progressive multiple alignment of sequences with insertions. Proc. Natl. Acad. Sci. USA 102, 10557–10562 (2005).
Zwickl, D. J. Genetic Algorithm Approaches for the Phylogenetic Analysis of Large Biological Sequence Datasets under the Maximum Likelihood Criterion. PhD thesis, Univ. Texas, Austin (2006).
Posada, D. & Crandall, K. A. MODELTEST: testing the model of DNA substitution. Bioinformatics 14, 817–818 (1998).
Hirotugu, A. A new look at the statistical model identification. IEEE Trans. Automat. Contr. 19, 716–723 (1974).
Liu, L., Yu, L. & Edwards, S. V. A maximum pseudo-likelihood approach for estimating species trees under the coalescent model. BMC Evol. Biol. 10, 302 (2010).
Britton, T., Anderson, C. L., Jacquet, D., Lundqvist, S. & Bremer, K. Estimating divergence times in large phylogenetic trees. Syst. Biol. 56, 741–752 (2007).
Tang, L. et al. Phylogeny and biogeography of the rice tribe (Oryzeae): evidence from combined analysis of 20 chloroplast fragments. Mol. Phylogenet. Evol. 54, 266–277 (2010).
Zou, X. H. et al. Analysis of 142 genes resolves the rapid diversification of the rice genus. Genome Biol. 9, R49 (2008).
Green, R. E. et al. A draft sequence of the Neandertal genome. Science 328, 710–722 (2010).
Busing, F., Meijer, E. & Leeden, R. Delete-m Jackknife for Unequal m. Stat. Comput. 9, 3–8 (1999).
Sanderson, M. J., Nicolae, M. & McMahon, M. M. Homology-aware phylogenomics at gigabase scales. Syst. Biol. 66, 590–603 (2017).
Angiuoli, S. V. & Salzberg, S. L. Mugsy: fast multiple alignment of closely related whole genomes. Bioinformatics 27, 334–342 (2011).
Ogden, T. H. & Rosenberg, M. S. How should gaps be treated in parsimony? A comparison of approaches using simulation. Mol. Phylogenet. Evol. 42, 817–826 (2007).
Huelsenbeck, J. P. & Ronquist, F. MRBAYES: Bayesian inference of phylogenetic trees. Bioinformatics 17, 754–755 (2001).
Haas, B. J., Delcher, A. L., Wortman, J. R. & Salzberg, S. L. DAGchainer: a tool for mining segmental genome duplications and synteny. Bioinformatics 20, 3643–3646 (2004).
Youens-Clark, K. et al. Gramene database in 2010: updates and extensions. Nucleic Acids Res. 39, D1085–D1094 (2011).
Harris, R. S. Improved Pairwise Alignment of Genomic DNA. PhD thesis, Penn. State Univ. (2007).
Kent, W. J., Baertsch, R., Hinrichs, A., Miller, W. & Haussler, D. Evolution’s cauldron: duplication, deletion, and rearrangement in the mouse and human genomes. Proc. Natl. Acad. Sci. USA 100, 11484–11489 (2003).
Quinlan, A. R. & Hall, I. M. BEDTools: a flexible suite of utilities for comparing genomic features. Bioinformatics 26, 841–842 (2010).
Kawahara, Y. et al. Improvement of the Oryza sativa Nipponbare reference genome using next generation sequence and optical map data. Rice 6, 4 (2013).
Kurtz, S. et al. Versatile and open software for comparing large genomes. Genome Biol. 5, R12 (2004).
Katoh, K. & Toh, H. Recent developments in the MAFFT multiple sequence alignment program. Brief. Bioinform. 9, 286–298 (2008).
Ye, K., Schulz, M. H., Long, Q., Apweiler, R. & Ning, Z. Pindel: a pattern growth approach to detect break points of large deletions and medium sized insertions from paired-end short reads. Bioinformatics 25, 2865–2871 (2009).
Danecek, P. et al. The variant call format and VCFtools. Bioinformatics 27, 2156–2158 (2011).
Vilella, A. J. et al. EnsemblCompara GeneTrees: complete, duplication-aware phylogenetic trees in vertebrates. Genome Res. 19, 327–335 (2009).
Ruan, J. et al. TreeFam: 2008 update. Nucleic Acids Res. 36, D735–D740 (2008).
Katoh, K. & Standley, D. M. MAFFT: iterative refinement and additional methods. Methods Mol. Biol. 1079, 131–146 (2014).
Edgar, R. C. MUSCLE: multiple sequence alignment with high accuracy and high throughput. Nucleic Acids Res. 32, 1792–1797 (2004).
Lassmann, T. & Sonnhammer, E. L. Kalign—an accurate and fast multiple sequence alignment algorithm. BMC Bioinformatics 6, 298 (2005).
Magis, C. et al. T-Coffee: tree-based consistency objective function for alignment evaluation. Methods Mol. Biol. 1079, 117–129 (2014).
Wallace, I. M., O’Sullivan, O., Higgins, D. G. & Notredame, C. M-Coffee: combining multiple sequence alignment methods with T-Coffee. Nucleic Acids Res. 34, 1692–1699 (2006).
Campbell, M. S. et al. MAKER-P: a tool kit for the rapid creation, management, and quality control of plant genome annotations. Plant Physiol. 164, 513–524 (2014).
Lamesch, P. et al. The Arabidopsis Information Resource (TAIR): improved gene annotation and new tools. Nucleic Acids Res. 40, D1202–D1210 (2012).
Paterson, A. H. et al. The Sorghum bicolor genome and the diversification of grasses. Nature 457, 551–556 (2009).
International Brachypodium Initiative. Genome sequencing and analysis of the model grass Brachypodium distachyon. Nature 463, 763–768 (2010).
Monaco, M. K. et al. Gramene 2013: comparative plant genomics resources. Nucleic Acids Res. 42, D1193–D1199 (2014).
Sayers, E. W. et al. Database resources of the National Center for Biotechnology Information. Nucleic Acids Res. 37, D5–D15 (2009).
Thompson, J. D., Higgins, D. G. & Gibson, T. J. CLUSTAL W: improving the sensitivity of progressive multiple sequence alignment through sequence weighting, position-specific gap penalties and weight matrix choice. Nucleic Acids Res. 22, 4673–4680 (1994).
Stajich, J. E. et al. The Bioperl toolkit: Perl modules for the life sciences. Genome Res. 12, 1611–1618 (2002).
Yang, Z. PAML 4: phylogenetic analysis by maximum likelihood. Mol. Biol. Evol. 24, 1586–1591 (2007).
R Core Team. R: A Language and Environment for Statistical Computing (R Foundation for Statistical Computing, Vienna, 2014).
Du, Z., Zhou, X., Ling, Y., Zhang, Z. & Su, Z. agriGO: a GO analysis toolkit for the agricultural community. Nucleic Acids Res. 38, W64–W70 (2010).
Trapnell, C. et al. Transcript assembly and quantification by RNA-Seq reveals unannotated transcripts and isoform switching during cell differentiation. Nat. Biotechnol. 28, 511–515 (2010).
Altschul, S. F., Gish, W., Miller, W., Myers, E. W. & Lipman, D. J. Basic local alignment search tool. J. Mol. Biol. 215, 403–410 (1990).
Maddison, W. P. & Maddison, D.R. Mesquite: a modular system for evolutionary analysis, version 3.04 http://mesquiteproject.org/ (2015).
Li, W. et al. The EMBL-EBI bioinformatics web and programmatic tools framework. Nucleic Acids Res. 43 (W1), W580–W584 (2015).
Eddy, S. R. A new generation of homology search tools based on probabilistic inference. Genome Inform. 23, 205–211 (2009).
Price, M. N., Dehal, P. S. & Arkin, A. P. FastTree 2—approximately maximum-likelihood trees for large alignments. PLoS One 5, e9490 (2010).
Lin, F. et al. The blast resistance gene Pi37 encodes a nucleotide binding site leucine-rich repeat protein and is a member of a resistance gene cluster on rice chromosome 1. Genetics 177, 1871–1880 (2007).
Wang, Z. X. et al. The Pib gene for rice blast resistance belongs to the nucleotide binding and leucine-rich repeat class of plant disease resistance genes. Plant J. 19, 55–64 (1999).
Qu, S. et al. The broad-spectrum blast resistance gene Pi9 encodes a nucleotide-binding site–leucine-rich repeat protein and is a member of a multigene family in rice. Genetics 172, 1901–1914 (2006).
Zhou, B. et al. The eight amino-acid differences within three leucine-rich repeats between Pi2 and Piz-t resistance proteins determine the resistance specificity to Magnaporthe grisea. Mol. Plant Microbe Interact. 19, 1216–1228 (2006).
Shang, J. et al. Identification of a new rice blast resistance gene, Pid3, by genomewide comparison of paired nucleotide-binding site–leucine-rich repeat genes and their pseudogene alleles between the two sequenced rice genomes. Genetics 182, 1303–1311 (2009).
Liu, X., Lin, F., Wang, L. & Pan, Q. The in silico map-based cloning of Pi36, a rice coiled-coil nucleotide-binding site leucine-rich repeat gene that confers race-specific resistance to the blast fungus. Genetics 176, 2541–2549 (2007).
Hayashi, N. et al. Durable panicle blast-resistance gene Pb1 encodes an atypical CC-NBS-LRR protein and was generated by acquiring a promoter through local genome duplication. Plant J. 64, 498–510 (2010).
Sharma, T. R. et al. High-resolution mapping, cloning and molecular characterization of the Pi-k h gene of rice, which confers resistance to Magnaporthe grisea. Mol. Genet. Genomics 274, 569–578 (2005).
Tang, J. et al. Semi-dominant mutations in the CC-NB-LRR-type R gene, NLS1, lead to constitutive activation of defense responses in rice. Plant J. 66, 996–1007 (2011).
Jiao, B. B. et al. A novel protein RLS1 with NB-ARM domains is involved in chloroplast degradation during leaf senescence in rice. Mol. Plant 5, 205–217 (2012).
Yoshimura, S. et al. Expression of Xa1, a bacterial blight-resistance gene in rice, is induced by bacterial inoculation. Proc. Natl. Acad. Sci. USA 95, 1663–1668 (1998).
Camacho, C. et al. BLAST + : architecture and applications. BMC Bioinformatics 10, 421 (2009).
Guy, L., Kultima, J. R. & Andersson, S. G. genoPlotR: comparative gene and genome visualization in R. Bioinformatics 26, 2334–2335 (2010).
Acknowledgements
We gratefully acknowledge CyVerse and the Texas Advanced Computing Center (TACC) for consultation and provision of computational resources. This material is based on work supported by the US National Science Foundation under grants 0321678, 0638541, 0822284 and 1026200 to S.A.J., C.A.M., M.J.S., M.L., D. Ware and R.A.W., the Bud Antle Endowed Chair of Excellence in Agriculture and Life Sciences, the Alexander von Humboldt Research Award and the AXA Chair in Genome Biology and Evolutionary Genomics to R.A.W., DFG SFB 1101 to C.B. and D. Weigel, a University of Perpignan BQR grant to M.-C.C., E.L. and O.P., a Senior Chair from Institut Universitaire de France to O.P. and a CNPq grant to A.C.d.O. D. Ware was also funded by US National Science Foundation grant 1127112 and USDA–ARS 1907-21000-030-00D. Any opinions, findings, and conclusions or recommendations expressed in this material are those of the authors and do not necessarily reflect the views of the US National Science Foundation.
Author information
Authors and Affiliations
Contributions
J.C.S., M.C., B.H., R.H., Y.C.H., N.K., A.C.O., O.P., S.A.J., C.A.M., M.J.S., M.L., D. Ware, D. Weigel and R.A.W. conceived and contributed to all aspects of the project. Y.C.H., B.H. and R.A.W. led the O. nivara genome sequencing project with significant contributions from C.W., S.K., J. Zeng, F.W., Y.Y., D.K., J.L.G., J.S.S.A., S.H.L., J.T., L.F.R. and A.D.; N.K. and B.H. led the O. rufipogon sequencing project with significant contributions from Q.F. and Q.Z.; R.H., O.P., Y.Y. and R.A.W. led the O. meridionalis genome sequencing project with significant contributions from D.K., J. Zhang, J.L.G., J.S.S.A., S.H.L. and J.T.; O.P., A.C.O., Y.Y. and R.A.W. led the O. glumaepatula genome sequencing project with significant contributions from D.d.R.F., L.C.d.M., D.K., J. Zhang, J.L.G., J.S.S.A., S.H.L., J.T., L.F.R. and A.D.; Y.Y. and R.A.W. led the O. barthii genome sequencing project with significant contributions from J. Zhang, J.L.G., J.S.S.A., S.H.L., J.T., M.W., Y.Y., D.K., L.F.R. and A.D.; R.A.W. led the O. punctata genome sequencing project with significant contributions from J. Zhang, J.L.G., J.S.S.A., D.C., D.K., S.H.L., J.T., L.F.R. and A.D.; R.A.W. led the O. sativa vg. aus cv. N 22 genome sequencing project with significant contributions from J.S., D.F., D.C., J. Zhang, D.K., S.H.L., J.T., K.L.M., N.A. and R.M.; D.C. and R.A.W. led the O. sativa vg. indica cv. IR 8 genome sequencing project with significant contributions from D.K., S.H.L., J.T., K.L.M., N.A. and R.M.; R.A.W. led the L. perrieri genome sequencing project with significant contributions from Y.Y., D.K., J.L.G., X.S., S.H.L. and J.T. P.S. and K.K.J. grew and supplied plant material for the project. X.S. generated baseline transcriptome data with significant contributions from AGI’s Genome Sequencing Center. J.C.S., Y.Y. and J.L.G. performed all assembly validation analyses. C.B. and D. Weigel performed all bisulfite sequencing and data analysis. K.C. loaded and ran the MAKER-P annotation pipeline for the 13-genome dataset. D.C. and O.P. coordinated the repeat annotation effort with significant contributions from D.G., A.I., J.W., C.E.M.L., A.Z., M.E., C.F., S.A.J. and T.W. J.C.S., S.W. and C.N. performed analysis of gene families and disease resistance genes and interpretations. M.J.S. and D.J.Z. led all phylogenomics analyses and interpretations. M.-C.C., E.L., R.S.d.S., D.C. and O.P. performed LTR-RT half-life analysis and interpretation. J.J. and R.C. performed all chromosome 11 and 12 evolutionary analyses and interpretation. Y.L., M.L. and M.C. performed all indel analysis and interpretation. C.A.M. and K.G.N. performed all lincRNA analyses and interpretation. L.Z., C.Z., A.R.G., J.W., C.F. and M.L. performed all new gene evolution analysis and interpretation. J.C.S. and R.A.W. wrote the manuscript with significant writing contributions led by Y.Y., M.C., O.P., S.A.J., C.A.M., M.J.S., M.L., J.J., C.F., D. Ware and D. Weigel.
Corresponding author
Ethics declarations
Competing interests
The authors declare no competing financial interests.
Additional information
Publisher’s note: Springer Nature remains neutral with regard to jurisdictional claims in published maps and institutional affiliations.
Supplementary information
Supplementary Text and Figures
Supplementary Figures 1–26, Supplementary Tables 1–46 and Supplementary Note
Supplementary Data 1
Eight files associated with annotation and sequence quality assessment of the 13-genome data package: MAKER_genome_annotations; Repeat_Annotation; TRINITY_assembled_transcriptomes; iomap_fpkm_quantification.txt.txt; iomap_gene_info.txt; iomap_compara_trees.nwk; chromosome_feature_distribution_plots.pdf; BAC_physical_map_data
Supplementary Data 2
Twelve within-genus genome projects with genomes sizes 100 kb or greater
Supplementary Data 3
LTR-RT elimination rate data
Supplementary Data 4
Gene counts with InterPro fractionated by taxon bin
Supplementary Data 5
LincRNA supplementary data
Supplementary Data 6
Characteristics of NLR genes in Oryza, including gene family designation, syntenic relationships, domain organization and cluster formation
Rights and permissions
Open Access This article is licensed under a Creative Commons Attribution 4.0 International License, which permits use, sharing, adaptation, distribution and reproduction in any medium or format, as long as you give appropriate credit to the original author(s) and the source, provide a link to the Creative Commons license, and indicate if changes were made. The images or other third party material in this article are included in the article’s Creative Commons license, unless indicated otherwise in a credit line to the material. If material is not included in the article’s Creative Commons license and your intended use is not permitted by statutory regulation or exceeds the permitted use, you will need to obtain permission directly from the copyright holder. To view a copy of this license, visit http://creativecommons.org/licenses/by/4.0/.
About this article

Cite this article
Stein, J.C., Yu, Y., Copetti, D. et al. Genomes of 13 domesticated and wild rice relatives highlight genetic conservation, turnover and innovation across the genus Oryza. Nat Genet 50, 285–296 (2018). https://doi.org/10.1038/s41588-018-0040-0
Received:
Accepted:
Published:
Issue Date:
DOI: https://doi.org/10.1038/s41588-018-0040-0
This article is cited by
-
Are cereal grasses a single genetic system?
Nature Plants (2024)
-
Pan-evolutionary and regulatory genome architecture delineated by an integrated macro- and microsynteny approach
Nature Protocols (2024)
-
Evolutionary and synteny analysis of HIS1, BADH2, GBSS1, and GBSS2 in rice: insights for effective introgression breeding strategies
Scientific Reports (2024)
-
Plant pangenomes for crop improvement, biodiversity and evolution
Nature Reviews Genetics (2024)
-
Dysfunction of duplicated pair rice histone acetyltransferases causes segregation distortion and an interspecific reproductive barrier
Nature Communications (2024)
