
Abstract
As the major iron storage protein, ferritin stores and releases iron for maintaining the balance of iron in fauna, flora, and bacteria. We present an investigation of the morphology and iron loading of ferritin (from equine spleen) using aberration-corrected high angle annular dark field scanning transmission electron microscopy. Atom counting method, with size selected Au clusters as mass standards, was employed to determine the number of iron atoms in the nanoparticle core of each ferritin protein. Quantitative analysis shows that the nuclearity of iron atoms in the mineral core varies from a few hundred iron atoms to around 5000 atoms. Moreover, a relationship between the iron loading and iron core morphology is established, in which mineral core nucleates from a single nanoparticle, then grows along the protein shell before finally forming either a solid or hollow core structure.
Export citation and abstract BibTeX RIS

Original content from this work may be used under the terms of the Creative Commons Attribution 3.0 licence. Any further distribution of this work must maintain attribution to the author(s) and the title of the work, journal citation and DOI.
1. Introduction
Iron is an essential trace element in living organisms. It is vital to many fundamental cellular processes such as oxygen transport, DNA replication and cell division [1–3]. However, excess iron in the body has a potential toxicity due to its capacity to promote the formation of reactive oxygen species, which can lead to damage of the protein and DNA [4]. As such, all organisms need to regulate the amount of free iron available for fundamental cellular processes whilst avoiding iron-induced toxicity. Ferritin, the major iron storage protein, is central to this regulatory mechanism. It can store iron, in the ferric state, and upon cellular demand is mobilised [5–8]. Thus, ferritin is a protein critical to health. A deficiency of ferritin is associated with many diseases, such as Still's disease, Parkinson's disease, sideroblastic anemia, Friedreich's Ataxia and restless legs syndrome [8–10]. In addition, ferritin also commands a good deal of attention in the area of bionanotechnology due to its attractive architectural feature, such as its cage structure, stability, non-toxicity and the ability to mineralise other elements [8, 11–13]. Ferritin demonstrates potential for a number of applications, including drug delivery, magnetic recording, and quantum electronics [14–17]. Thus, a deeper understanding of ferritin is required from the perspective of public health and for the development of bionanotechnology.
X-ray structures of the ferritin shell have been known since the 1980s, and show that ferritin molecules in different mammals have very similar structures [2, 18–20]. The apoferritin shell (iron free form of the ferritin protein) has a hollow symmetrical structure formed by 24 sub-units. There are two types of sub-units, H and L, with different amino acid sequences. Apoferritin has an outer diameter of 12 nm and an 8 nm diameter hollow cavity inside, which is available to store mineralised iron. There are 2-fold, 3-fold and 4-fold symmetry axes in the apoferritin molecule. The hydrophilic channels along the eight 3-fold symmetry axes are normally regarded as the major channels for iton entrance [6–8]. The composition of the mineralised iron core is believed to be similar to ferrihydrite [20, 21], a hydrous ferric oxyhydroxide mineral. As the mineralised iron core varies in size and morphology from one ferritin molecule to the next, x-ray crystallography is not suitable for the characterisation of the ferritin core. Transmission electron microscopy is therefore especially useful in the study of the structure of the ferritin iron core.
Electron microscopic studies of ferritin can be traced right back to the 1950s. In 1954, Farrant first observed the iron-containing mineral core, reporting a 5.5 nm iron core diameter and suggesting that it consisted of 4 sub-units, each 2.7 nm in diameter [22]. Six years later, Muir presented a six-sub-unit structure based on his transmission electron microscope (TEM) observations, in which the six sub-units sit at the corners of an octahedron [23]. In 1965, Haggis reported several additional morphologies [24]. To achieve a higher resolution, in 1973, Massover et al employed ultrahigh voltage (1–3 MeV) dark field electron microscopy on the horse spleen ferritin and showed that a single core can contain more than one crystallite with different sizes and shapes [25]. The first dark field scanning transmission electron microscopy study of the ferritin core was conducted in 1979 by Crewe and his group [26]. They observed the lattice spacing of the mineral core directly, which, combined with the electron diffraction studies, lead to the conclusion that the core structure is similar to ferrihydrite. A quantitative study with electron energy loss spectra (EELS) in the STEM of individual cores was presented by Pan et al who determined the range of core sizes and led to a proposal of a new iron core morphology based on eight sub-units growing from the eight three-fold symmetry channels in the cavity [27–29].
Here we present a study of ferritin's mineral core using aberration-corrected STEM in the high angle annular dark field (HAADF) mode. Moreover, we employed the atom counting method, with size-selected gold clusters as the mass balances, to determine the number of iron atoms in each iron core. The iron loading of the ferritin molecules varies from a few hundred atoms to about 5000 atoms. A relationship between the core morphology and the iron loading is also observed, suggesting that the ferritin core grows from one small nanoparticle along the protein shell to finally form a full, either solid or hollow, iron-containing mineral core.
2. Experimental methods
The ferritin molecules investigated were sourced from Sigma Aldrich UK and are purified from the equine spleen in saline solution. The integrity and quality of the ferritin utilised in this study was verified using SDS PAGE gel electrophoresis and western blotting using polyclonal antibodies to ferritin (1:10 000 dilution, Abcam, rabbit AB69090) [30]. The iron content of ferritin was estimated using a ferrozine assay, a colourimetric assay which determines total iron concentrations post protein degradation and acid liberation of protein-stored iron [31]. This ferritin solution was drop cast onto one half of a 300 mesh TEM copper grid. The TEM grid is covered with a holey carbon film and then a graphene oxide film (EM Solutions) to maximise the contrast. Size-selected Au923±46 clusters were deposited on the other half of the grid from a magnetron sputtering, gas condensation cluster beam source and mass filtered by a lateral time-of-flight mass selector [32–34]. The cluster beam current was 30 pA and the deposition time was 150 s. The number of size-selected clusters deposited was ∼2.8 × 10¹⁰. Our 200 kV JEOL JEM2100F field emission gun STEM with a spherical aberration corrector (CEOS) was utilised in HAADF mode to image both the ferritins and size-selected gold clusters. The HAADF detector was operated with an inner angle of 62 mrads and outer angle of 164 mrads. The electron dose for each image was 4 × 10⁴ electrons Å−2 at 12 million times magnification. No beam shower was performed on the samples in this research to prevent any damage resolving to the sample.
3. Results and discussion
As the apoferritin shell of the ferritin is formed from low atomic number elements like hydrogen, oxygen and carbon, the contrast is not high enough to see the protein shell in the HAADF STEM images. However confirming the existence of the protein shell was crucial for this project. Both SDS PAGE gel electrophoresis (followed by Coomassie blue staining) and western blotting confirmed the integrity of ferritin employed within this study (online supplementary figure S1, table S1). Coomassie blue staining revealed a single band at ca. 20 kDa, which corresponds to the ferritin sub-units (19 kDa ferritin L-chain and 21 kDa H-chain). The Western blotting revealed a single immunoreactive band, which corresponds to a ferritin light chain (L-chain) at ca. 19 kDa. Based on these analysis, the Ferritin degradation was not evident.
The geometrical sizes of the ferritin cores were measured from the HAADF-STEM images. A histogram of the maximum lengths of a total of 114 mineral cores is shown in figure 1(a). We see a peak at 7.5 nm while no core is significantly longer than 8 nm. This implies that the molecule cavities have an inner diameter no greater than 8 nm, which is consistent with previous reports [2, 7, 18]. Furthermore, the most ferritin iron cores have the relative high maximum length, even though their average iron loadings are just close to the half of the maximum capacity (will be shown below), suggesting the iron cores did not grow evenly from small ball to bigger, but grow along the protein shell, so the low loaded ferritin iron cores can also have higher maximum length. As shown in figures 1(b)–(e), the same maximum core length is found independent of the different core morphology. This suggests that all core shapes are limited in size by the protein shell which persists under electron beam irradiation. The lowest maximum length of the iron cores observed is around 2.5 nm, but it does not mean no smaller iron core exists. The Z-contrast property of the HAADF-STEM limited the observation and characterisation of the ultra-small and light elemental cores. The smaller average iron content of the ferritin from chemical analysis comparing with the result from the HAADF-STEM based atom counting also implies that the existence of very small iron cores which did not characterised by the HAADF-STEM.

Figure 1. (a) Plot of the maximum length of the ferritin mineral cores. (b)–(e) Examples of HAADF STEM images in which the maximum lengths of the cores are all similar for different core morphologies.
Download figure:
Standard image High-resolution imageThe number of iron atoms in the ferritin cores, that is, the iron loading, has been obtained by the atom counting method, which compares the integrated HAADF intensity of iron cores to that of size selected Au923±46 clusters deposited in the same grid, which functions as the mass standards. Background subtraction was carefully performed to include the region adjacent to the mineral core so as to remove the contribution of both the graphene oxide support and the protein shell itself assuming a 3D spherical protein shell of 2 nm thickness. The HAADF intensity contribution by a single proton was obtained through the HAADF intensity of the size selected Au923±46 cluster divided by the number of protons in each cluster. Then, the number of protons in the ferritin core can be calculated by comparing the integrated HAADF intensities between the ferritin iron core and single proton [35–37]. The error in the iron loading calculation is ±4.36%, based on the mass resolution of size-selected clusters and the measurement error of the STEM intensity. A high resolution image of the iron core crystal structure is shown in figure 2(a), with d-spacings of 2.54 Å, 2.51 Å and 2.61 Å and interplanar angles of 61.1°, 59.06° and 60.05°, respectively. These values are consistent with the ferrihydrite crystal structure [38]. Assuming that the mineral cores are indeed ferrihydrite, then the contribution of hydrogen and oxygen atoms can be subtracted, and the actual number of iron atoms in the ferritin cores obtained. The resulting distribution of the iron loading of a total of 103 ferritin molecules is shown in figure 2(b), which shows that the number of iron atoms varies from a few hundred to around 5000. This is a little higher than the maximum iron loading capacity of 4500 iron atoms suggested by many previous researches [2, 7, 29, 39], but there were also studies that reported higher iron loading of about 5000 or higher [10, 40, 41]. This high maximum iron loading can be explained by: first, the 4500 iron capacity is from old experimental measurements, not a theoretical limit, so few hundreds iron atoms fluctuation on the maximum iron loading is acceptable; second, the error of the iron loading calculation also broadened the maximum iron loading about 200 iron atoms, which can also contribute the high maximum iron loading. A chemical analysis of ferritin iron content was also performed, which estimated an average iron content of 2499 ± 9 (SD) iron atoms per ferritin protein by using a ferrozine assay. The Ferrozine calibration curve which made from the standard iron concentrations is shown in figure 5.6. The detail of the estimation is performed in online supplementary figure S2. This value matches well with the average ferritin iron content in the STEM analysis (∼2922). The number of atoms estimated by the chemical analysis is slightly smaller, which is because the ferritin with very small iron loading cannot be imaged by the HAADF-STEM method.
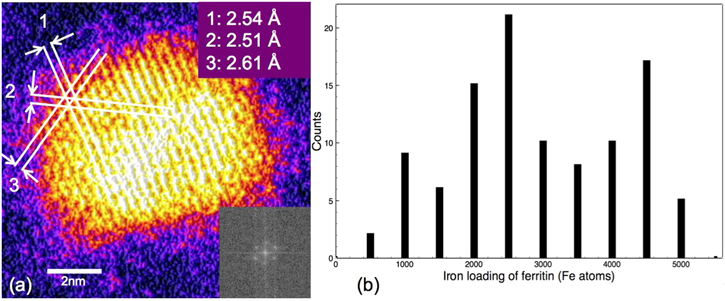
Figure 2. (a) Crystal structure analysis of ferritin iron core. The d-spacing and angles labelled are consistent with the ferrihydrite crystal structure. Inset, lower right: the corresponding FFT. (b) Distribution of iron loading in ferritin cores. The number of iron atoms varies from around 500–5000.
Download figure:
Standard image High-resolution imageAs detailed above, different types of morphology are observed in the ferritin cores. We classify them by their 2D projection shape as follows: 'small circle', 'dumbbell', 'crescent', 'doughnut' and 'full raft'. The difference between 'small circle' and 'full raft' is simply the maximum length, with the maximum length of the 'small circle' being lower than 4 nm, e.g. figure 3(a). The 'dumbbell' type is defined as an iron core with aspect ratio larger than 1.5, e.g. figure 3(c). The 'crescent' type cores are the ones that have low intensity at the centre and an imperfect outer shell, e.g. figure 3(e). The 'doughnut' types are the cores that also have low intensity at the centre, but in this case the outer shell is complete, e.g. figure 3(y). The different types of mineral cores are in the different regimes of iron loading. The 'small circle' cores are in the region of a few hundred to around one thousand iron atoms, whereas the 'dumbbell' cores contain from 1000 to 3000 iron atoms, while the 'crescent' cores contain from 1500 to 4000 iron atoms, the 'doughnut' cores contain from 2500 to 5000 iron atoms, and the 'full raft' cores contain from 1500 to 5000 iron atoms. The data indicates that each morphology seems to dominate in a specific regime of iron loading, which should be relevant to understanding the process of the growth of the mineral core. It should be noted that the regimes of different morphology overlap each other somewhat. This is because the STEM images have been classified by their 2D features, which means that in certain regimes of nuclearities, different morphology types can actually reflect the same 3D morphology with different 2D projections. For example, if a disk-like iron core contains around 2500 iron atoms (so the protein shell is half full) and has a hole in its centre, it will be considered as 'doughnut'. However, if it stands vertically on the surface, the image will show a 'dumbbell' type core.
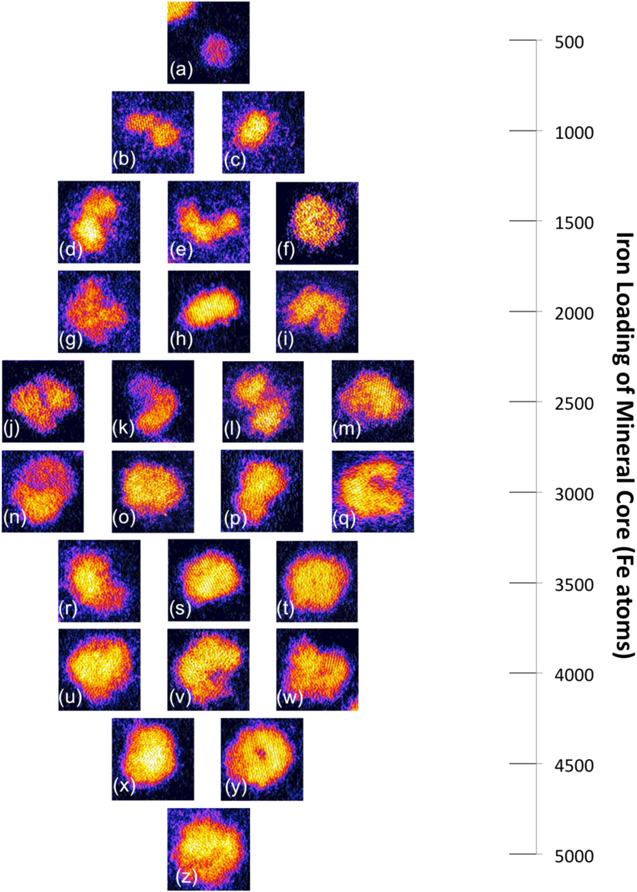
Figure 3. The morphology 'atlas' of the ferritin iron core with different iron loading regions. From (a) to (z) are the representative images for every type of morphology oberserved in dfferent size ranges. For example, there is only one morphologic 'small circle' found in the size range of ∼500 iron atoms, as shown in (a), while all four types of morphology, (j) 'doughnut', (k) 'crescent', (l) 'dumbbell' and (m) 'full raft', are observed in the size range ∼2500 iron atoms. The frame size of the ferritin example image is 8.24 × 8.24 nm.
Download figure:
Standard image High-resolution image
From the analysis of iron loadings and morphologies of the ferritin mineral cores, a morphology 'atlas' was generated and is shown in figure 3. This shows how the morphologies change with iron loadings. The smallest iron loading corresponds to the 'small circle' morphology, then as the iron loading increases, the morphology changes in the following sequence: from 1000 iron atoms, the 'dumbbell' type morphology appears up to 3000 iron atoms, from 1500 iron atoms, the 'crescent' type morphology emerges and persists up to 4000 iron atoms, the 'doughnut' is observed from 2500 to 4500 iron atoms; finally the 'full raft' appears from 1500 to 5000 iron atoms, with the largest iron loading matching the 'full raft' morphology.
The eight channels which correspond to the 3-fold symmetry axes of apoferritin are regarded as the main entrances for iron mineralisation. The dissolved Fe2+ ions are oxidised to form Fe3+ in the catalytic ferroxidase site, which is located in the centre of the helical bundle of ferritin sub-units and atom mineralisation takes place on the H sub-unit of the protein shell to form the initial mineral core [2, 7, 11, 19]. Previous research suggests that when the mineral core is formed, the surface of the growing core will act as a site for oxidation deposition [2, 42–45], such that deposition on the mineral core is faster than on the inside of the protein shell. This accounts for the well-defined quasi-spherical morphology of the cores at low iron loading. Many of the mineral core structures in figure 3 of higher mass can be rationalised as connected assembles of these 'small circle', formed nucleation at two (figure 3(b)), three (figure 3(e)) or more (figure 3(w)) different sites within the protein cavity. Moreover, the 'crescent' shapes observed, like in figures 3(e) and (q), suggest a tendency for these individual precipitates to nucleate on the inner surface of the protein shell. The observation of a quasi-hollow (almost) full mineral core can be seen as a further manifestation of the preferred nucleation in the inner wall of the protein shell.
In all electron microscopy research, there is the question of how much the electron beam itself affects the sample. In our work, the electron dose is 4 × 10⁴ electrons Å−2. Research on the electron beam damage to ferritin [27, 29] used EELS to detect the valence change of Fe in the ferritin iron core. At 200 kV in the TEM, Fe3+ began to be reduced to Fe2+ when the electron dose was above ∼105 electrons Å−2, so our ∼104 electrons Å−2 can be seen as a 'safe electron dose'. In a 100 kV STEM study, the electron beam had no influence on the iron valence state at an electron dose of 105 electrons Å−2, but the percentage of the Fe–O octahedral coordination did decrease from ∼75% at 10 electrons Å−2 to ∼63% at the dose we employed in our research. Overall, it is reasonable to deduce that the electron beam effect is not very significant in our study. Furthermore, the maximum length analysis in figure 1 showed that no ferritin core is larger than the ferritin protein shell inner diameter of 8 nm, which again suggests that the iron core and protein cavity morphology is not changed significantly by the electron beam.
4. Conclusion
The morphology of the ferritin mineral core has been investigated via aberration-corrected HAADF STEM. The iron loading of the ferritin cores has been determined by the atom counting method with size-selected Au clusters as mass balances. The number of iron atoms in the core varies from a few hundred to ∼5000 atoms. Analysis of the closest separation distances between the cores and their maximum length has confirmed the preservation of the ferritin protein shell. Different types of morphology of the iron-containing cores were identified and classified as a function of their iron loading. Growth of the mineral core begins with a small circle morphology. Nucleation and growth of further such nanoparticles on the internal surface of the protein shell accounts for the 'dumbbell' and 'crescent' morphologies observed before near complete filling of the cavity with a solid or hollow, quasi-spherical core. The mineralisation process we found will be helpful in a more accurate nanoparticle synthesis in ferritin protein and improve the performance of the ferritin based drug delivery system. The method we used to determine the iron loading of ferritin can be extended to other metal containing proteins and can also be a new medical test method to develop more specific therapies for the ferritin-related diseases.
Acknowledgments
We acknowledge financial support from the EPSRC, the TSB and the University of Birmingham. The cluster beam source and STEM instrument employed in this research was obtained through the Birmingham Science City project 'Creating and Characterising Next Generation Advanced Materials,' supported by Advantage West Midlands (AWM) and funded in part by the European Regional Development Fund (ERDF).