


Abstract
Remembering involves the coordinated recruitment of strategic search processes and processes involved in reconstructing the content of the past experience. In the present study we used a cueing paradigm based on event-related functional magnetic resonance imaging to separate activity in the initial preparation phases of retrieval from later phases during which retrieval search ensued, and detailed auditory and visual memories were reconstructed. Results suggest a dissociation among inferior temporal (IT) and parieto-occipital (PO) processing regions in how they were influenced by preparatory cues prior to remembering, and indicate a dissociation in how they were influenced by the subsequent validity of those cues during remembering. Regions in IT cortex appeared to show search-related activity during retrieval, as well as robust modality effects, but they were not influenced by preparatory cues. These findings suggest a specific role for IT regions in reconstruction of visual details during remembering. While dorsal regions in parietal and superior occipital cortex also appeared to show search-related activity as well as robust modality effects, they were also influenced by preparatory cues during the retrieval phase, and to a lesser degree during the cue phase. These findings indicate a role in integrating perceptual reactivation and search processes during remembering.
Introduction
Two broad classes of process are engaged during remembering to reinstate the perceptual details of the original experience — those associated with top-down strategic processes that are engaged during the search for the appropriate information and those associated directly with representing the reconstructed memory content (Koriat, 2000; Rugg and Wilding, 2000; Buckner and Wheeler, 2001; Buckner, 2003). Most theories of memory propose that perceptual mechanisms used to process the original event are ‘reactivated’ by top-down mechanisms in reconstructing the perceptual details of a remembered experience (James, 1890; Ungerleider and Mishkin, 1982; Damasio, 1989; Kosslyn, 1994; Roland and Gulyás, 1994). Recent neuroimaging studies of memory have found evidence for reactivation by showing that regions of parietal-occipital (PO), inferior occipital and inferior temporal (IT) cortex, which are active during perception of visual information, reactivate during retrieval of the same information from memory (Owen et al., 1996; Köhler et al., 1998; Wheeler et al., 2000; Vaidya et al., 2002; Wheeler and Buckner, 2003, 2004; Kahn et al., 2004; Slotnick and Schacter, 2004).
In some of these experiments, the class of retrieved information changed on a trial-by-trial basis, and therefore memory probes could provide clues about where or how to search for the necessary information, a process that may not be evident in paradigms in which only one source of information is retrieved across the experiment (e.g. standard recognition memory test using word stimuli). Therefore, memory probes could elicit a number of different effects on brain activity. (i) The memory probe could provide preparatory or planning information, prior to retrieval, about where or how to search for specific information. This effect could occur in situations in which a specific context or cue served to constrain retrieval options prior to retrieval (Jacoby et al., 1989, 2005). In support of this possibility, several neuroimaging studies of visual attention have shown preparatory increases of activity in regions of parietal (Shulman et al., 1999) and occipital (Kastner et al., 1999) cortex, in the absence of a change in visual stimulation, indicating that the expectation to make a decision about a particular type of information can influence neuronal activity in brain regions that process that information. (ii) Activity could also reflect distal effects of a search process that probes sensory regions for specific information (Damasio, 1989; Miller, 2000). This search process would occur during retrieval, and might reflect unsuccessful retrieval attempts as information is retrieved and judged inappropriate or insufficient. (iii) The memory probe could result in retrieval of specific information from memory, with brain regions that process the original events to some degree ‘reactivated’ during reconstruction of the perceptual details of the remembered experience (James, 1890; Mishkin, 1982; Damasio, 1989; Kosslyn, 1994; Roland and Gulyás, 1994; Buckner and Wheeler, 2001). Functional magnetic resonance imaging (fMRI) activity seen in PO and IT regions during visual retrieval could be related to preparatory processes that bias neuronal activity prior to retrieval, to the search for information during retrieval, to the perceptual reconstruction of retrieved information (during retrieval), or to any combination of these. Given the low temporal resolution of fMRI, relative to the underlying cognitive events being measured, it is advantageous to separate in time the preparation and retrieval stages so that distinct functional measures can be acquired in each phase.
Our goal here was to investigate the influence of top-down attentional control and memory retrieval processes on fMRI activity in regions of PO and IT cortex that have been associated with remembering of visual information (Wheeler et al., 2000; Wheeler and Buckner, 2003, 2004). To do this we used a novel combination of fMRI methods. A cuing paradigm, similar to those used in visual attention experiments (Shulman et al., 1999; Corbetta et al., 2000; Ollinger et al., 2001a,b), was combined with a memory retrieval paradigm that has been used to investigate neural bases of content-specific retrieval (Wheeler et al., 2000; Wheeler and Buckner, 2003, 2004). Using this rapid event-related paradigm, fMRI activity associated with preparation to retrieve auditory or visual information (prior to retrieval) could be separated from retrieval-based activity associated with search for (during retrieval) and the reconstruction of perceptual details.
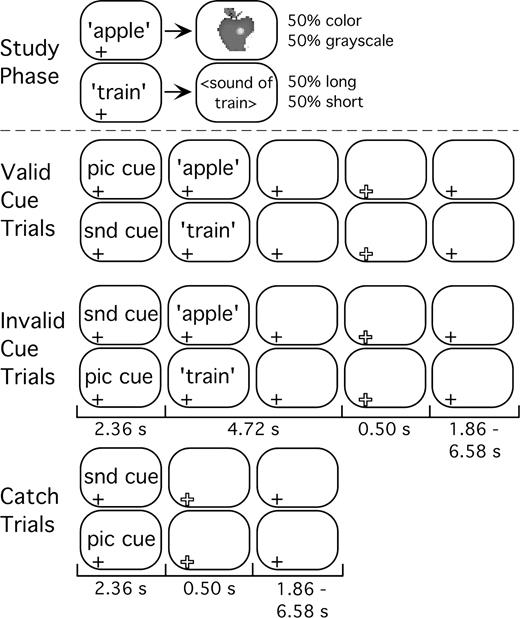
Auditory words were studied with picture or sound associates during an unscanned study phase (Fig. 1) (Wheeler et al., 2000). During a subsequent scanned testing session, the auditory words were presented again as memory probes, and participants were to remember if the words were previously paired with a color or grayscale picture, or with a long or short duration sound. This task encouraged retrieval of detailed auditory and visual content. A preparatory cue preceded each memory probe. Preparatory cues were brief auditory tones that indicated whether the words had been paired with pictures or sounds during the study session. Each test trial, or compound trial, consisted of a preparatory cue phase, during which the tones were presented, and a retrieval phase that was initiated by the presentation of an auditorily presented memory probe.
Schematic of trial types during study phase, and of valid cue, invalid cue and catch trials during the later memory test. The duration (seconds) of each test phase, end-of-trial signal and ITI are shown below each panel. Picture (pic) and sound (snd) cues were 100 ms tones. A plus-sign (+) at the bottom left of a frame indicates the presence of a centrally presented fixation point. End of trial indicated by a larger, open, plus sign.
To further explore the nature of possible preparatory activity, and to assess the degree to which participants attended to preparatory cues, cue validity was manipulated. Most often (75%), cues correctly (validly) predicted the upcoming modality of retrieval, but sometimes (25%) they were incorrect (invalid). Therefore, participants could most often correctly use the cue to inform their upcoming memory decision, but on invalid trials they would need to overcome their initial preparation in order to make a correct response, and this should be evident by changes in fMRI signal. It should be noted that participants would become aware of cue validity only after they retrieved pictures or sounds from memory, during the retrieval phase. If participants attend to the cues, then their responses should be faster and/or more accurate on valid than on invalid trials (Posner et al., 1978).
The preparatory cue could have two different effects on fMRI activity in the two different phases of a trial. (i) In the cue phase, it could elicit a modality-specific preparatory effect (e.g. difference in activity between sound and picture cues) as participants prepared to make a decision about retrieved auditory or visual content. Such a difference could indicate a role in directing processing resources toward auditory or visual processing regions. As demonstrated in several fMRI studies of visual attention, the expectation to process visual information can produce increased activity in visual processing regions, prior to, or in absence of, a change in visual stimulation (Kastner et al., 1999; Shulman et al., 1999; Ress et al., 2000). (ii) The cue could elicit a validity effect during the subsequent retrieval phase as retrieved picture or sound information would either validate or invalidate the initial preparatory set. In the latter case, retrieval preparation would require modification, which should be reflected by an increase in activity if the modifications involve additional processing in the same region (Ranganath et al., 2000; Buckner, 2003; Wheeler and Buckner, 2003). Evaluation of preparatory (cue phase) and validity (retrieval phase) effects in PO and IT regions allowed us to identify the extent to which activity in those regions was influenced by strategic processes in preparation for, and during, memory retrieval.
This paradigm also allowed us to address another issue. In other studies (Wheeler et al., 2000; Vaidya et al., 2002; Wheeler and Buckner, 2003, 2004; Kahn et al., 2004), test stimuli were presented visually. Increased activity in visual processing regions could have been due, in part, to the perceptual processing of the visual memory probes. This possibility introduces a degree of ambiguity in the interpretation of activity related to visual and auditory retrieval in visual processing regions. In the present experiment, all critical test stimuli were presented auditorily in order to reduce visual perceptual processing during the test and to more cleanly evaluate activity during retrieval. However, given the large number of conditions (see Materials and Methods), a second reason was to maintain statistical power, and to focus on visual processing regions which have shown robust and consistent reactivation effects across studies (Wheeler et al., 2000; Vaidya et al., 2002; Wheeler and Buckner, 2003, 2004; Kahn et al., 2004). Because preparatory cues and memory probes were presented auditorily, activity observed in visual processing regions could be attributed to top-down rather than perceptual processing. Increased activity in visual processing regions on auditory retrieval trials might then indicate the presence of an active or automatic top-down process searching for information, while a further modulation of this activity by cue validity could indicate that the search was influenced by initial preparation.
Materials and Methods
Participants
Twenty-six right-handed participants from the Washington University community participated. Two were excluded from data analysis because of too many non-responses (>10%), and one was excluded due to non-compliance. The remaining 23 participants (14 female) were aged 18–32 years (mean 23.6), had normal or corrected-to-normal vision, reported no significant neurological problems, and were native English speakers. Due to isolated occurrences of excessive movement, a total of five runs of MRI data were discarded from four participants. One run was discarded for three of the participants, and two runs for one participant. Behavioral data reflect percentages of remaining total trials for each trial type. Participants provided informed consent in accordance with the Washington University Human Studies Committee and were paid for their participation.
Test Stimuli
Stimuli were 240 digitally recorded words, each with a unique picture and sound associate. Words were divided into eight lists of 30 words each and equated for word length (range 3–12 letters, mean 5.97), word frequency (Francis and Kucera, 1982) (range 1–352, mean 23.68), and picture width (range 0.9–7.0° of visual angle, mean 3.2°). There were two lists each of words that could be paired with either color pictures or long duration sounds, of words that could be paired with either color pictures or short duration sounds, of words with grayscale pictures or long sounds, and of words with grayscale pictures or short sounds. Therefore, each word was paired with either a color or a grayscale picture associate, and with either a long or short duration sound. For example, the word ‘apple’ could be paired with either a color picture or a short duration sound for a given participant, but not with a grayscale picture or a long sound. The short and long sound lists were separately equated for sound duration (short sound range: 0.31–1.06 s, mean 0.82; long sound range 1.95–2.83 s, mean 2.39).
Study Phase
Participants studied the 240 auditory words three times, with a new word presented in random order every 5 s. A sound or picture followed each word, and participants were instructed to memorize the words and associated pictures and sounds for a later memory test (Fig. 1). Stimuli were arranged so that half of the words were associated with pictures, and half with sounds, and for a participant each word was paired with the same, unique, picture or sound throughout the study phase. Half of the pictures contained color, the other half were grayscale. Half of the sounds were short duration, the other half were long duration. Therefore, each participant studied 60 each of color and grayscale pictures, and long and short duration sounds. Sound or picture assignment for each word was counterbalanced across the original 26 participants. Central fixation was presented in black Geneva bold font, centered on a white background using a Macintosh G4 (Apple, Cupertino, CA) with PsyScope software (Cohen et al., 1993).
Cued-retrieval Test
The next day, participants performed a memory test in the scanner (Fig. 1). Each trial began with a cue, one of two 100 ms auditory tones that prepared the subject to retrieve either visual or auditory information. After 2.36 s, a word (memory probe) from the study session was presented auditorily. Participants were then given 4.72 s to make one of four possible responses based on whether the studied associate was a color or grayscale picture, or a long or short duration sound (Fig. 1). This decision process encouraged retrieval of detailed auditory and visual information.
For most test trials (75%), cues predicted the modality (picture or sound) of the studied associate (valid trials). For the remaining test trials, the incorrect modality was predicted (invalid trials; see Fig. 1). The valid to invalid ratio of 75:25 was initially determined based on a review of experiments in the literature. The efficacy of this ratio was then tested behaviorally in a series of four pilot experiments (unpublished) to determine whether valid cues produced reliable and significant decreases in response time relative to invalid cues. The pilot experiments were similar in procedure to the experiment designed here, with minor variations in number of times items were studied (1–3), and whether items were studied in one sitting, or in multiple sessions between successive tests.
Randomly intermixed among these 240 ‘cue-memory’ (compound) trials were 60 ‘catch’ trials in which cues were not followed by studied words, and for which no response was required (Fig. 1). Because retrieval phase onset occurred at a fixed interval after cue phase onset, catch trials (partial trials) were used to separate cue-phase from retrieval phase blood oxygen level dependent (BOLD) responses (Shulman et al., 1999; Ollinger et al., 2001a,b). The only visual stimulus during scanning was a black central fixation plus-sign that turned red for 500 ms at the end of each trial. Inter-trial intervals (ITIs) were 2.36, 4.22, or 7.08 s (1–3 frames of MR acquisition) in duration, and were distributed exponentially such that shorter ITIs occurred more frequently than longer ITIs (Dale, 1999).
Imaging Procedures
Functional imaging was conducted on a Siemens 1.5 T Vision System (Erlangen, Germany). Stimuli were presented with an Apple Power Macintosh G3 using PsyScope and visual stimuli were projected onto a screen positioned at the head of the magnet bore with a Sharp LCD PG-C20XU projector. Foam pillows and a thermoplastic face mask minimized head movements. The screen was viewed through a mirror attached to the head coil (the distance from mirror to screen was ∼164 cm). Auditory stimuli were presented through headphones (Commander XG system, Resonance Technology, Inc., Northridge, CA), which also dampened scanner noise. Participants responded by pressing one of four buttons, with the index and middle fingers of each hand, on a fiber optic light-sensitive key-press interfaced with a PsyScope Button Box.
In each session, structural images were acquired using a sagittal MP-RAGE T1-weighted sequence with the following parameters: repetition time (TR) = 9.7 ms, echo time (TE) = 4 ms, flip angle = 12°, inversion time (TI) = 300 ms, delay time (TD) = 0 ms. This was followed by eight functional runs of 167 whole-brain acquisitions of 16 contiguous 8 mm thick axial images using an asymmetric spin-echo echo-planar sequence sensitive to BOLD contrast (T2*; TR = 2.36 s, TE = 37 ms, 3.75 × 3.75 mm in-plane resolution) (Kwong et al., 1992; Ogawa et al., 1992). This sequence allows complete brain coverage at a high signal-to-noise ratio (Conturo et al., 1996). For each participant, image slices were aligned with the anterior and posterior commissures. To compensate for stabilization of the magnetic field, the first four images of each run were fixation trials, and were discarded from analysis.
Functional MRI Data Analysis
Functional data were first preprocessed to correct for odd/even slice intensity differences and motion, using a rigid-body rotation and translation correction (Snyder, 1996). Between-slice timing differences caused by slice acquisition order were adjusted using sinc interpolation, and the mode voxel value was normalized to 1000 to allow for across-subject comparison.
Data were then modeled using the general linear model (GLM) (Friston et al., 1994; Miezin et al., 2000). Critically, the cue phase and retrieval phase portions of each test (compound) trial were coded in the GLM as if they were separate trials (Shulman et al., 1999; Ollinger et al., 2001a,b), but will be referred to throughout the manuscript as ‘cue phase’ and ‘retrieval phase’ to keep the terminology consistent. We estimated the time course of the BOLD response to the cue and memory-probe without making an assumption concerning the shape of the hemodynamic response, using the following regression model. Each time a particular type of cue occurred, a set of eight delta functions, one function for each time point or TR, was coded into the design matrix, starting at the TR for cue onset. Similarly, each time a particular type of memory-probe occurred, another set of eight delta functions was encoded into the model, starting at the TR for the memory-probe onset. Therefore, on cue-only trials, only the cue set of eight delta functions was coded into the design matrix. On cue + memory-probe trials, both the cue set and the memory-probe set of delta functions were coded into the design matrix, with the first memory-probe time point regressor starting 1 TR following the first cue time point regressor, since the cue phase duration was 1 TR. The use of both cue-only trials and random ITI durations ensured that there were a sufficient number of independent linear equations to separately estimate the BOLD response to the cue phase and memory-probe phase for the different trial types. While it is also possible to estimate cue phase responses without making a shape assumption by varying the interval between the onsets of the cue and memory-probe, analogous to jittering the ITI between trial onsets, this latter method makes a very strong assumption, namely that the BOLD response to the cue is independent of the duration of the interval between the cue and memory probe. This assumption will not, in general, be met and is not made by the current catch-trial technique. A quantitative validation of the catch-trial method has been published, showing that it correctly estimates the cue and test phase time courses (Ollinger et al., 2001a,b) and this method has been used in a number of prior publications (Shulman et al., 1999; Corbetta et al., 2000).
We were thus able to extract separate time courses for the cue and retrieval phases of the test trials. Note that cues from catch trials and cue phases were coded in the GLM as if they were the same trial type, producing two cue conditions (picture cue and sound cue). Thus, the two ‘cue phase’ conditions encompassed all picture and sound cues presented in the study. There were three reasons to combine cue events from partial and compound trials: (i) subjects could not determine, in the cue phase, whether cues were of one type or the other; (ii) separate analyses of the cues produced nearly identical time courses; and (iii) combining the cues increased power.
Retrieval phases were categorized as Modality + Associate (M+A) if the color/grayscale or long/short response was correct, Modality-Only (M-O) if only the modality was correct, but the specific response was incorrect (e.g. responding grayscale if the studied stimulus was a color picture), and incorrect (INC) if modality was incorrect (e.g. responding long or short if the studied stimulus was a picture). These categories were further subdivided according to validity (valid, invalid) and modality (picture, sound), resulting in 12 retrieval phase conditions (e.g. the valid picture, M+A condition began with a cue for visual modality, was followed by a word that had been paired with a picture during study, and then was identified accurately with a color or grayscale response). Non-responses (300 > RT > 4720 ms) were coded separately and were not evaluated.
The eight separate runs of 163 frames/run were treated as a single time series, with the first four frames of each run discarded from analysis. Therefore, the GLM for each participant contained a time series of up to 1304 frames, coded with up to 15 different conditions (2 from the cue phase, 12 from the retrieval phase and 1 non-response), and included linear trend and baseline terms. The time courses of the hemodynamic response functions (HRF) for the 12 retrieval phase conditions were modeled with eight time points while the HRFs for the two cue phase conditions were modeled with nine time points because these conditions began one frame earlier. Each participant's data were transformed to 2 mm3 stereotactic atlas space (Talairach and Tournoux, 1988) during processing. Statistical maps were projected onto flat and inflated (lateral, ventral and posterior views) representations of the human brain (Van Essen et al., 2001; Wheeler and Buckner, 2003) (Fig. 2).
![Statistical maps show regions of the left hemisphere that reliably changed activity according to retrieved modality (z-score color scale left center). Sulci are indicated in gray, gyri in white. Regions previously associated with recognition memory are outlined in red (Wheeler and Buckner, 2004). Four different views of the same data projection are shown, a flattened view (center), and lateral, ventral and posterior views. (a) Time courses, in units of percent signal change, for each of six conditions (coded according to legend) from left superior intraparietal region [peak atlas coordinate x = −26, y = −65, z = +36 (Talairach and Tournoux, 1988)]. Stimulus onset in each phase indicated by the gray bars above the x-axis, with cue onset beginning at time 0 s and memory probe onset beginning at time 2.36 s. Time is plotted on the x-axis. (b) Left posterior parietal region (−30, −73, +32). (c) Left anterior occipital sulcus (−45, −62, −9). (d–f) Left fusiform gyrus (d, −29, −50, −17; e, −37, −56, −17; f, −26, −38, −18). M, reliable difference (picture > sound) in response magnitudes during the cue or retrieval phases; V, reliable validity difference (invalid > valid) during retrieval phase. Reference landmarks: CeS, central sulcus; PCS, post-central sulcus; IPS, intraparietal sulcus; STS, superior temporal sulcus; pITS, posterior inferior temporal sulcus; ITS, inferior temporal sulcus; FG, fusiform gyrus.](https://oup.silverchair-cdn.com/oup/backfile/Content_public/Journal/cercor/16/7/10.1093/cercor/bhj037/2/m_cercorbhj037f02_4c.jpeg?Expires=1716355018&Signature=x1RBM7s3m7euExco~qJcbs75Xgd0FPMfg7HxOSPWrKQdUEk-BIkSDniB24uPrZbXsJDpno9V7nkeU86~ZCNFrMrbuuIGSIYmlKrH5n-vLYUXMXJkRqKbBWFuZcMhnyfV8zP-tEMEv0-cuDluWMVB-zUFa6qKgD3-COWls55J4Avlf0RVgHq8CQl8Mt-5CtwcgKvQaY~RnrruwzjvrEVEsz44sfgYSXMJ2KZwncKOR~rq~aoinUYWClVblqGdkDgCxxXwEdwWLDcCqIPOlCnVaAwm8PGXq5yrvZtUs0i9awbVxpmCHrofsVPCGV9YK9x8gHE50BH~-1TkPkT8HcFfSw__&Key-Pair-Id=APKAIE5G5CRDK6RD3PGA)
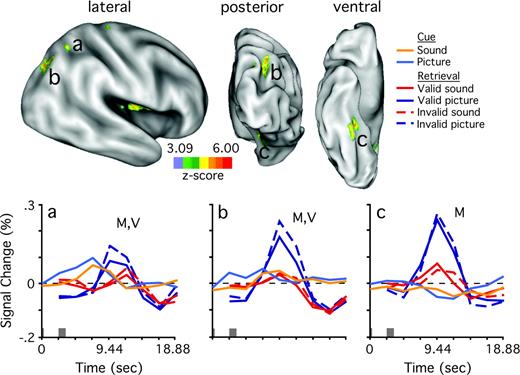
Statistical maps show regions of the left hemisphere that reliably changed activity according to retrieved modality (z-score color scale left center). Sulci are indicated in gray, gyri in white. Regions previously associated with recognition memory are outlined in red (Wheeler and Buckner, 2004). Four different views of the same data projection are shown, a flattened view (center), and lateral, ventral and posterior views. (a) Time courses, in units of percent signal change, for each of six conditions (coded according to legend) from left superior intraparietal region [peak atlas coordinate x = −26, y = −65, z = +36 (Talairach and Tournoux, 1988)]. Stimulus onset in each phase indicated by the gray bars above the x-axis, with cue onset beginning at time 0 s and memory probe onset beginning at time 2.36 s. Time is plotted on the x-axis. (b) Left posterior parietal region (−30, −73, +32). (c) Left anterior occipital sulcus (−45, −62, −9). (d–f) Left fusiform gyrus (d, −29, −50, −17; e, −37, −56, −17; f, −26, −38, −18). M, reliable difference (picture > sound) in response magnitudes during the cue or retrieval phases; V, reliable validity difference (invalid > valid) during retrieval phase. Reference landmarks: CeS, central sulcus; PCS, post-central sulcus; IPS, intraparietal sulcus; STS, superior temporal sulcus; pITS, posterior inferior temporal sulcus; ITS, inferior temporal sulcus; FG, fusiform gyrus.
Region Definition: Visual Retrieval
To identify voxels that responded differently during auditory and visual retrieval of the paired associates, a voxel-wise 2 × 2 × 8 ANOVA, with modality (picture, sound), validity (valid, invalid), and time (eight time points) as factors, was computed on the four M+A conditions (valid picture, valid sound, invalid picture and invalid sound) from the retrieval phase. This analysis produced three whole-brain images showing (i) an interaction of modality with time; (ii) validity with time; and (iii) a higher-order interaction of modality, validity and time. The focus of this report was on regions that changed activity over time as a function of the modality of retrieved auditory and visual associates; thus, the interaction image of modality by time was used to identify regions. This analysis is analogous to those used in our previous experiments, which identified more activity during visual than during auditory retrieval in IT and PO cortex (Wheeler et al., 2000; Wheeler and Buckner, 2003, 2004). The complexity of the design (2 phases, 15 conditions) and the abundance of data preclude a single report, though it should be emphasized that all pertinent findings concerning M+A effects from regions defined by the interaction of modality and time are included here. Data pertaining to the interaction images of cue by time (cue phase data) and validity by time (retrieval phase data) will be considered in a separate report. The retrieval phase interaction of modality by validity by time failed to produce consistent effects at the voxel level, and will not be considered further.
The uncorrected interaction (modality × time) image was smoothed using a 4 mm hard sphere kernel and an automated algorithm searched for the location of peaks exceeding P < 0.001 significance. Peaks separated by <10 mm were consolidated by averaging coordinates. A second statistical map of the modality × time interaction was computed with additional steps to correct for sphericity and multiple comparisons. The criteria for the latter correction were based on a previous simulation study using a Monte Carlo method with a cutoff of P < 0.05 at a 45 voxel extent (McAvoy et al., 2001). Regions were defined by including all voxels in the uncorrected modality × time image that were within a 10 mm radius of each peak, then excluding voxels in that region that failed to pass multiple comparisons and sphericity corrections (i.e. those that failed to appear in the corrected image). This process defined 16 regions of interest (ROIs) that changed activity reliably according to whether retrieval involved pictures or sounds (Table 2).
For each ROI, a 2 × 2 × 8 repeated-measures ANOVA, with modality, validity and time (eight time points, beginning with retrieval phase onset) as factors, was computed on the four M+A retrieval phase conditions in order to extract time courses from the retrieval phase. An additional 2 × 9 repeated-measures ANOVA was computed on the cue phase conditions, with modality (picture, sound) and time (nine time points, beginning with cue phase onset) as factors, to extract time courses from the cue phase. For both analyses, activity was averaged over all voxels in each region. Therefore, six separate time courses, two from the initial preparatory cue phase and four from the later retrieval phase, were extracted for each region. In order to statistically compare HRF peak magnitudes across participants, magnitudes were estimated using the value at the time point 4.72 s from cue onset for cue phase conditions, and at 9.44 s from cue onset for retrieval phase conditions (see Wheeler and Buckner, 2004). This choice of time points was made by averaging across all conditions in each phase, in all regions, and identifying the first peak time point in the averaged time course.
Results
Responses in M+A and M-O Conditions Were Faster after Valid Cues
Behavioral data indicated that participants attended to the cues and used them to guide decisions. Responses in M+A and M-O conditions were faster for picture and sound items when they were preceded by valid, relative to invalid, cues (Table 1). On average, across the trial types listed in Table 1, valid trials were 112 ms (Picture M-A), 259 ms (Picture M-O), 310 ms (Sound M+A) and 180 ms (Sound M-O) faster than invalid trials, reflecting savings of 5, 10, 12 and 7% RT, respectively (See Table 1).
Accuracy and response time results for picture and sound items
| Picture | Sound | |||||||||||||||||||||
|---|---|---|---|---|---|---|---|---|---|---|---|---|---|---|---|---|---|---|---|---|---|---|
| M+A | M-O | Incorrect | M+A | M-O | Incorrect | |||||||||||||||||
| Val | Inval | Val | Inval | Val | Inval | Val | Inval | Val | Inval | Val | Inval | |||||||||||
| Response (%) | 75.4 | 71.0 | 21.5 | 20.4 | 3.0 | 8.6 | 62.4 | 62.0 | 34.8 | 29.7 | 2.9 | 8.3 | ||||||||||
| SEM | 2.1 | 3.1 | 1.9 | 2.6 | 0.4 | 1.6 | 1.5 | 2.0 | 1.4 | 1.7 | 0.7 | 1.9 | ||||||||||
| RT (ms) | 2171 | 2283 | 2455 | 2714 | 3084 | 2955 | 2186 | 2496 | 2426 | 2606 | 3001 | 3197 | ||||||||||
| SEM | 53 | 53 | 64 | 112 | 115 | 120 | 57 | 71 | 76 | 76 | 143 | 161 | ||||||||||
| RTSavings (%) | +5 | * | +10 | * | −4 | * | +12 | * | +7 | * | +6 | * | ||||||||||
Picture, Sound = memory probe associate, at study, was a picture or sound, respectively; M+A, Modality+Associate; M-O, Modality-Only; Val, Valid; Inv, Invalid; RT, response time; Savings = (Invalid RT – Valid RT)/Invalid RT; *no value.
A 2 × 2 × 2 analysis of variance (ANOVA) on response times (RTs; Table 1), with accuracy classification (M+A, M-O), retrieved associate modality (picture, sound) and validity (valid, invalid) as factors, showed that responses were faster on valid than on invalid trials, independent of accuracy and retrieval modality [main effect of validity: F(1,21) = 43.67, P < 0.0001; one participant had zero trials in one cell, and was excluded from this analysis]. Incorrect trials were not included in this RT analysis because many participants had zero responses (and thus no mean RT value) in one or more incorrect cells.
This analysis also revealed a main effect of accuracy [F(1,21] = 56.27, P < 0.0001], indicating that M+A responses were faster than M-O responses. An interaction of modality by accuracy [F(1,21) = 7.15, P < 0.05] indicated that this effect was modulated by modality, with a larger increase in RTs, going from M+A to M-O, on sound than on picture retrieval trials. The analysis also revealed an interaction of validity, modality and accuracy [F(1,21) = 5.83, P < 0.05], indicating that the RT effect due to cue validity was modulated by modality (sound > picture) and by accuracy (M-O > M+A).
As shown in Table 1, participants were readily able to identify the source modality of the studied items, and most responses correctly identified the associate as a color/gray picture or a long/short sound (M+A). Participants were more likely to make an incorrect response when cues were invalid (Table 1; Response %), for both picture [t(22) = 3.60, P < 0.005] and sound [t(22) = 3.67, P < 0.005; paired t-test] conditions, indicating a tendency to respond according to the cued modality when uncertain.
PO and IT regions were preferentially active during visual retrieval. Our primary interest was to investigate fMRI activity related to cue, validity and reactivation effects in regions of PO and IT cortex. Regions that were preferentially involved in visual retrieval were identified by analyzing the retrieval phase data. To examine trials in which auditory and visual associates were most likely retrieved accurately and in detail, only M+A trials were examined. Note that there were relatively few M-O trials in the invalid conditions (∼8 trials per subject, on average) so M-O trials have been excluded from formal analyses. The four retrieval phase conditions included were all M+A trials: valid picture (picture cue followed by a word that was paired with a picture at study), invalid picture (sound cue followed by a word that was paired with a picture at study), valid sound (sound cue followed by a word paired with a sound at study) and invalid sound (picture cue followed by a word paired with a sound at study; Fig. 1).
To identify voxels in which BOLD fMRI activity was greater during picture than sound retrieval, a 2 × 2 × 8 repeated-measures ANOVA, with modality (picture, sound), validity (valid, invalid) and time (eight time points) as factors, was computed for each voxel using the four conditions of interest (also see Materials and Methods). Peak voxel coordinates from this analysis are shown in Table 2 and statistical activation maps are shown in Figure 2. This analysis identified four PO regions that were preferentially active during visual retrieval, two in each hemisphere (Figs 2 and 3). Also identified were five regions in or near IT cortex, four in the left hemisphere and one in the right. Other regions included bilateral posterior cingulate and precentral gyrus, and right insular cortex (see Table 2). All regions listed in Table 2 were more active during picture than sound retrieval. The relatively conservative voxelwise ANOVA failed to identify any regions that were preferentially active during auditory retrieval. This was not surprising. In order to reduce confounding activity in visual processing regions, all critical test stimuli were presented auditorily. This presumably resulted in recruitment of auditory and lexical processing areas during the perception of both cues and memory probes, and possibly reduced our ability to detect differences between sound and picture trials during the retrieval phase. Future experiments could explore auditory retrieval effects using visually presented test stimuli.
Statistical maps show regions of the right hemisphere that reliably changed activity according to retrieved modality. Format is similar to Figure 2. (a) Time courses for the six conditions of interest from right superior parietal region (peak atlas coordinate x = 26, y = −56, z = 44). (b) Right occipital/parietal region (30, −71, 38). (c) Right fusiform region (30, −39, −15).
Atlas coordinates of regions preferentially active during picture retrieval
| Region | ∼BA | x | y | z | z-score |
|---|---|---|---|---|---|
| L anterior occipital sulcus (2c) | 19/37 | −45 | −62 | −09 | 6.02 |
| R parietal (3b) | 19 | 30 | −71 | 38 | 4.50 |
| L fusiform (2d) | 37 | −29 | −50 | −17 | 4.29 |
| R anterior fusiform (3c) | 20 | 30 | −39 | −15 | 4.12 |
| R insula | NA | 28 | −22 | 12 | 3.92 |
| R insula | NA | 35 | −14 | 17 | 3.89 |
| L post cingulate | 23/31 | −10 | −57 | 17 | 3.52 |
| L anterior fusiform (2f) | 20 | −26 | −38 | −18 | 3.40 |
| R precentral gyrus | 4 | 22 | −24 | 66 | 3.33 |
| R sup parietal lobule (3a) | 7 | 26 | −56 | 44 | 3.30 |
| R post cingulate | 23/31 | 13 | −57 | 16 | 3.27 |
| L fusiform (2e) | 37 | −37 | −56 | −17 | 3.26 |
| L intraparietal sulcus (2a) | 39/40 | −26 | −65 | 36 | 3.17 |
| L lentiform nucleus | NA | −26 | −9 | 7 | 3.12 |
| L parietal/occipital (2b) | 19/39 | −30 | −73 | 32 | 3.12 |
| R frontal/subcortical | NA | 23 | 19 | 21 | 3.09 |
Regions are approximate; ∼BA, approximate Brodmann's area; x,y,z, Talairach atlas (Talairach and Tournoux, 1988) coordinates of voxel with peak activity; L, left; R, right; NA, not applicable; (2) = regions displayed in Figure 2; (3) = regions displayed in Figure 3.
Modality and Validity Effects During the Retrieval Phase
Left Hemisphere
The voxel-level results replicated previous findings that regions of PO and IT cortex are recruited during retrieval of visual objects, and extended the findings to include auditorily presented memory probes. To examine this finding further, we extracted time courses of the hemodynamic responses for the four retrieval conditions in those regions. 2 × 2 × 8 repeated-measures ANOVAs, with the same factors as the previous ANOVA, were computed for each region. This analysis extracted a time course for each of the four retrieval conditions, across eight time points. Response magnitudes were then estimated (see Materials and Methods) for each subject and each condition in each region, and entered into separate 2 × 2 ANOVAs for each region, with retrieved modality (picture, sound) and validity (valid, invalid) as fixed factors and subject as a random factor.
We first report results of the estimated magnitude analyses on the six regions in the left hemisphere, which were located in or near PO and IT cortex. As predicted by the voxel-level analysis, each region was significantly more active during retrieval of pictures than sounds [F(1,22) = 8.30, 7.82, 39.81, 24.31, 16.16, 17.29, Fig. 2a–f, respectively; all P < 0.05]. The two PO regions showed an additional effect of validity [F(1,22) = 13.87, 13.38; Fig. 2a,b, respectively; both P < 0.005], but this effect was not observed in the four IT regions [F(1,22) = 1.13, 0.20, 0.36 and 0.20; Fig. 1c–f, respectively; all P > 0.30]. None of the six regions showed an interaction of modality with validity (all P > 0.19), indicating that the combined modality and validity effects in PO were additive, perhaps reflecting multiple distinct roles in the current task.
To determine the reliability of these differences across regions, invalid-valid difference scores were computed for each subject for each of the four retrieval phase conditions and were entered into a 2 × 6 mixed-effects ANOVA with retrieved modality (picture, sound) and region (four IT and two PO regions) as fixed factors and participant as a random variable. Difference scores were computed for each subject by subtracting the magnitude estimates of valid trials from those of invalid trials. We opted to use difference scores in order to minimize the influence of absolute magnitude differences across regions, and also to minimize the number of post-hoc comparisons needed to explore the source of significant effects in the ANOVA. This analysis revealed a main effect of region [F(5,110) = 8.03, P < 0.0001], indicating that magnitude differences between invalid and valid trials differed across regions. Neither the main effect of retrieved modality [F(1,22) = 0.13, P = 0.72] nor the interaction between region and retrieved modality [F(5,110) = 0.47, P = 0.47] were significant. The region effects were explored further using post-hoc tests (Bonferroni–Dunn, P < 0.0033) that compared the difference score between valid and invalid trials in one region to the difference score in each other region. These comparisons showed that with one exception each IT region was significantly different (α = 0.05) from each PO region at the corrected significance threshold of P < 0.0033 or more. The exception appeared in the comparison between the left IT region shown in Figure 2f and the PO region shown in Figure 2a, which did not survive multiple comparisons corrections (P = 0.0063). None of the IT regions differed from one another in difference scores (all P > 0.20), and the two PO regions also did not differ (P = 0.76).
Interestingly, on M+A sound retrieval trials, response magnitude estimates were above baseline in PO and IT regions for both valid [one-sample t-tests; t(22) = 7.71, 3.57, 3.96, 6.08, 5.68, 5.95; Fig. 2a–f, respectively; all P < 0.001] and invalid [t(22) = 6.98, 4.24, 1.81, 4.89, 4.17, 3.69; Fig. 2a–f; all P < 0.005 except for the IT region shown in Fig. 2c (P = 0.08)] conditions, despite the absence of trial-level visual stimulation. IT regions therefore showed an increase in activity above baseline during auditory retrieval, and an additional level of activity during visual retrieval. The implications of auditory increases in IT activity will be addressed in the Discussion.
Right Hemisphere
We next report results of magnitude analyses on the three ROIs in the right hemisphere (Fig. 3), following the same analytic approach used for the left hemisphere ROIs. Initial 2 × 2 ANOVAs on magnitude estimates, with retrieved modality (picture, sound) and validity (valid, invalid) as factors showed that each region was more active during picture than sound retrieval by main effect [F(1,22) = 14.47, 24.47, 31.08; Fig. 3a–c, respectively; all P ≤ 0.001], as predicated by the voxel-wise analysis. The two right PO regions also showed modest but reliable main effects of validity [F(1,22) = 5.06, 4.63; Fig. 3a,b, respectively; both P < 0.05], but this effect was not evident in the right IT region [F(1,22) = 0]. The initial results from right hemisphere ROIs are consistent with results from left hemisphere ROIs.
To determine whether the validity differences would hold up in an across-region analysis, invalid–valid difference scores were computed for each subject in each region and entered into a 2 × 3 ANOVA with factors of retrieved modality (picture, sound) and region (one IT and two PO regions). This analysis identified trends toward a main effect for region [F(2,44) = 2.59, P = 0.09] and for retrieved modality [F(1,22) = 3.85, P = 0.06]. The interaction between region and retrieved modality was not significant [F(2,44) = 0.02, P = 0.98]. Thus, there was a trend for validity difference scores from right hemisphere ROIs to be greater during picture than sound retrieval, and for the degree of those differences to vary across regions. Because the effects did not reach significance, post-hoc analyses were not conducted.
Unlike the left hemisphere ROIs, the right hemisphere ROIs generally did not increase activity relative to baseline during accurate sound retrieval (all P > 0.29). The exception was the IT region, which increased activity on valid trials [t(22) = 2.67, P < 0.05] but not on invalid trials [t(22) = 1.08]. Thus, the right hemisphere IT and PO ROIs were more active during picture than sound retrieval, though they appeared to contribute less during auditory retrieval than the left hemisphere ROIs. Additionally, PO regions were influenced by cue validity during picture retrieval, but not sound retrieval, but this difference did not hold up in across-region analyses.
PO Regions Modulated According to Preparatory Modality During the Cue Phase
Next, we wanted to determine the extent to which the cues would have a preparatory influence on activity in PO and IT during the cue phase. Time courses in these regions were extracted for the two preparatory cue conditions (see Materials and Methods). Note that, because the regions were defined by modality effects during retrieval (i.e. picture > sound), this analytical approach is only biased to identify significant modality effects during retrieval. In other words, how the regions modulated (i) as a function of the modality of the preparatory cue in the cue phase and (ii) the realized validity of that cue in the retrieval phase (the latter results were reported in previous section), was not biased in terms of region selection.
The results indicated differences in the pattern of activity between left PO and left IT regions during the preparatory cue phase (Fig. 2). The two PO regions were modestly but reliably more active for picture cues than sound cues when comparing estimated response magnitudes [paired t-tests, two tailed; t(22) = 3.88, 2.42, both P < 0.05; Fig. 2a,b, light blue and orange lines; see Materials and Methods], indicating that PO regions were differentially influenced by early preparation, and that this influence depended on the modality of expected retrieval. Such modality effects during the cue phase were not observed in the four IT regions [t(22) = 1.03, 1.33, 1.19, 1.69; Fig. 2c–f].
This pattern was replicated in the right hemisphere. The two right PO regions were both modestly but reliably more active after picture than after sound cues [t(22) = 2.17 and 2.09, P < 0.05; Fig. 3a,b respectively], but the difference in the right IT region did not reach significance [t(22) = 1.46, P = 0.16; Fig. 3c]. Overall, the cue phase results indicate that early preparation selectively influenced activity in bilateral PO regions, but not in IT regions.
To test statistically whether PO and IT regions were differentially influenced by the cues, magnitude estimates from the ROIs were entered into two ANOVAs, one ANOVA for ROIs in the left hemisphere (2 × 6 factor) and another for ROIs in the right hemisphere (2 × 3 factor), with cued modality and ROI as factors. The left hemisphere ANOVA revealed main effects of cued modality [F(1,22) = 6.88, P < 0.05] and of ROI [F(5,110) = 4.86, P < 0.001], indicating that ROIs were generally more active after picture than sound cues, and that they differed in the magnitude of BOLD response. The interaction of cued modality and ROI was not significant [F(5,100) = 1.0], demonstrating that the individual ROI cue effects did not hold up across regions. A similar pattern was revealed in the ANOVA on right hemisphere ROIs. The main effect of cued modality was significant [F(1,22) = 6.60, P < 0.05] but the main effect of ROI was of marginal significance [F(2,44) = 2.92, P = 0.07]. As in the left hemisphere, the interaction between cued modality and ROI was not significant [F(2,44) = 0.06]. Overall, the analysis of cue phase data indicated that cues influenced BOLD fMRI activity in PO and not IT regions in the individual ROI analyses. However, these differences were not sufficiently reliable to hold up across regions, so PO activity was not different from IT activity. This latter finding is most likely due to the trend in left and right PO and IT regions toward greater activity following picture than sound cues.
The left PO regions were located near parietal regions that have been associated with successful memory retrieval in previous fMRI experiments (Henson et al., 1999; Donaldson et al., 2001; Wheeler and Buckner, 2003, 2004; Shannon and Buckner, 2004). Moreover, two of these reports have noted functional heterogeneity across parietal regions (Shannon and Buckner, 2004; Wheeler and Buckner, 2004). There are two pieces of evidence to indicate that the currently described PO regions are different from the more anterior parietal regions. One piece of evidence is the topographical relationship between the regions. To explore this relationship, regions of interest (outlined in red in Fig. 2) from several previous studies of recognition memory (Konishi et al., 2000; Velanova et al., 2003; Wheeler and Buckner, 2004) and the current experiment were overlaid onto the same flattened cortical surface (Van Essen et al., 2001) to determine the degree of overlap. As shown in Figure 2, the current PO regions were located posterior to the regions previously implicated in successful retrieval. The second piece of evidence is that the retrieval success regions identified in previous experiments were not sensitive to the modality of retrieved information (Wheeler and Buckner, 2003; Shannon and Buckner, 2004), whereas the current PO regions were sensitive to the modality of retrieved information in that they were more active during picture than sound retrieval.
Discussion
The behavioral data indicate that participants attended to the cues. RTs were faster after valid than invalid cues, in both the M+A and M-O conditions, but not in the Incorrect condition. The benefit of a valid cue on RT ranged from 112 to 310 ms, depending on the modality of retrieval and the accuracy of response, reflecting a 5–12% savings in RT relative to the invalid condition. Additionally, participants were more likely to make an incorrect response when cues were invalid than when they were valid, suggesting that they responded according to the cued modality when they were uncertain. The behavioral data indicate that participants did not ignore the cues.
The imaging data confirmed that regions in PO and IT cortex support retrieval of pictorial visual information (Köhler et al., 1998; Wheeler et al., 2000; Vaidya et al., 2002; Wheeler and Buckner, 2003, 2004; Kahn et al., 2004; Slotnick and Schacter, 2004). Bilateral PO and IT regions increased activity during retrieval of visual information more than during retrieval of auditory information, and this effect was observed using auditorily presented memory probes. The preparatory cue manipulation revealed that left IT and PO regions were functionally dissociated during the retrieval phase of the task, a discrimination that could not be made in previous experiments (Wheeler et al., 2000; Wheeler and Buckner, 2003). Left PO regions were influenced by retrieved modality and validity during the retrieval phase. These effects were additive, with more activity during visual than auditory retrieval, and more activity on invalid than on valid trials. In the cue phase, the cues differentially influenced activity in the four PO regions and not in the five IT regions, but activity in PO and IT regions did not differ from one another. Left PO regions (Fig. 2a,b) therefore displayed a somewhat complex pattern of responses; they were differentially active prior to retrieval of specific content, they were additionally recruited on invalid trials, and they were preferentially active during retrieval of visual information. It is possible that the PO regions were more integrated with the attentional demands of the task than were IT regions. Other evidence from the current experiment indicates that attentional effects were directed toward the later response selection stage, beyond the sensory processing stage (Wheeler et al., 2004), which is not surprising because cues indicated both retrieval modality and response hand. These findings, and findings from non-human primate single unit studies of limb movement planning (Andersen et al., 1997) and neuroimaging experiments of hand pointing (Connolly et al., 2000) suggest that PO regions process visuospatial information, and in this task were involved in computing (and recomputing, on invalid trials) visuospatial parameters required for the bimanual button presses.
IT Regions Did Not Modulate According to the Preparatory Cue
While IT regions showed robust modality effects during retrieval, it is interesting to note that there appeared to be almost no preparatory effects in these regions. This is in apparent contrast to visual attention studies that report attentional modulation effects in ventral visual processing regions (Kastner et al., 1999), and raises interesting questions about the neural source of the significant behavioral RT effects of cue validity in the present experiment. It could be that behavior simply reflects some combination of neural output from the PO and IT regions, or it could be that the specific demands of the current task do not direct strong selection processes at the level of sensory processing regions, but rather at some other level or levels of information processing. As mentioned, other data from this study indicate that cues influenced activity in response selection stages of processing.
The presence of robust modality effects in IT, coupled with minimal preparatory effects, indicates that in this experiment, greater picture than sound retrieval activity was not due to top-down attentional modulation or biasing effects that occurred prior to retrieval of specific information. This finding does not imply that IT regions are not susceptible to modulation by attentional processes. Rather, the finding provides evidence that differential IT activity during picture and sound retrieval was related to processing unrelated to a preparatory influence that biased activity prior to retrieval.
IT Activity Increased During Auditory Retrieval
As described in the Results (See Figs 2c–f and 3c), during trials in which sounds were ultimately retrieved, there was significant activity above baseline in visual processing IT regions. One possible explanation for this cross-modal increase is that auditory stimulus onset produced a general alerting signal. It is also possible that this activity reflects spontaneous visual imagery when auditory information is retrieved. That is, memory for the sound of a basketball bouncing may also invoke a visual image of a basketball. This explanation is consistent with a automatic spreading activation view of associative memory.
Another alternative is that activity in IT regions during auditory trials (e.g. Fig. 2c–f, red lines) indicates the distal influence of a controlled search process, and that picture retrieval activity (e.g. Fig. 2c–f, blue lines) above this level reflects the successful retrieval and reconstruction of specific visual information. Because of the initial ambiguity between preparatory cues and memory probes (e.g. on invalid sound trials, with preparatory cuing to the visual modality, auditory information was ultimately retrieved), there could have been some degree of search for, and retrieval of, veridical and false visual information during sound (and picture) retrieval. That is, even when sounds were ultimately retrieved, the search for appropriate information may have involved probing visual and auditory regions before a candidate sound associate was identified. The search process may have involved retrieval of visual information that would then become subject to a monitoring process (Fletcher et al., 1998). This account is similar to the spreading activation view, but is more attributable to a controlled, strategic, search process than it is to an automatic spreading of associative memory. A similar pattern of activity was observed in left PO regions, suggesting a similar role for these regions as well. The current data do not delineate between these possibilities, but further studies that vary the level of cue/retrieval ambiguity could help in evaluating whether or not this activity reflects search processing.
Role for IT Regions in Retrieval
This experiment identified five distinct regions in IT cortex, four in the left hemisphere and one in the right, that were associated with retrieval of visual object information. A previous study has shown that visual object retrieval is associated with greater activity in IT regions than retrieval of sounds and identification of new items (Wheeler and Buckner, 2003), indicating that the picture > sound retrieval effects in the current study are also related to retrieval processes. Unfortunately, the functional role of each IT region was not elucidated by the current data. A voxel-level ANOVA that compared color and non-color (grayscale) retrieval failed to identify clear occipital or temporal regions (using criteria described in Materials and Methods) that were differentially associated with retrieval with and without color (Hadjikhani et al., 1998). It is possible that there is too much variability across subjects to identify consistent group effects.
However, other studies have reported analogous inferior temporal regions, and provide insight into possible roles in the current experiment. For example, studies of visual memory (Köhler et al., 1998; Wheeler et al., 2000; Vaidya et al., 2002; Wheeler and Buckner, 2003; Kahn et al., 2004) and visual perception (Wheeler et al., 2000; Beauchamp et al., 2003) have reported a region located near the left anterior occipital region shown in Figure 2c. This region is located at the junction of the occipital and temporal lobes, near the anterior occipital sulcus. This anterior occipital region partially overlaps area MT+ (Wheeler and Buckner, 2003), a visual cortical area that responds preferentially to motion stimuli (Tootell et al., 1995), and also the lateral occipital complex (LO), which has been shown to preferentially respond to visual object stimuli (Malach et al., 1995; Grill-Spector et al., 2001). Activity observed in this region in the current study may be related to motion attributes (e.g. directional movement, rotation) applied to visual objects remembered via either controlled or automatic spreading processes.
The four, more ventral, IT regions (Fig. 2d–f, 3c) were located near visual processing regions that have shown more specialized response properties related to object processing. For instance, regions on the ventral surface of IT in or near the fusiform gyrus become differentially active during mental imagery of discrete classes of objects, such as houses, faces and chairs (Ishai et al., 2000; O'Craven and Kanwisher, 2000) and also during perception of such objects (Chao et al., 1999; Haxby et al., 2001; Kanwisher, 2003). There is also evidence that a subset of these regions modulate activity as a function of the degree of experience or expertise with objects (Gauthier et al., 1999; Tarr and Gauthier, 2000). In concert, these regions may process the visual information required to reconstruct the studied pictures to a sufficient level of detail to make the color versus grayscale distinction.
Summary
This experiment used a recently developed attention paradigm in order to separate fMRI activity associated with preparatory processing from activity associated with search and retrieval of specific sensory details. This allowed us to show a dissociation between two sets of regions that have been previously implicated in visual object retrieval. Ventral bilateral IT activity during visual retrieval likely reflected processing associated with the reconstruction of visual information. Dorsal PO regions, which showed modest modality effects, exhibited a markedly different pattern of activity. Left PO regions, which modulated activity as a function of cue modality during the cue phase, and also as a function of cue validity during the retrieval phase, appeared to interact more directly with attentional control processes. Future experiments using this paradigm should include new items at test in order to further examine the influence of the cue on retrieval activity. A task that decouples the cue-to-response relationship, so that the cue does not contain information about response parameters, will also be necessary to identify possible preparatory effects in IT regions.
We thank Abraham Snyder for providing pre-processing and automated region definition software, and Mark McAvoy and John Ollinger for providing imaging analysis software. Erbil Akbudak and Tom Conturo supplied imaging sequences. We thank the anonymous reviewers who provided thoughtful suggestions. Caret software was developed by David Van Essen. This research was supported by the National Institute of Health (NS46424) and the McDonnell Center for Higher Brain Function.
References
Andersen RA, Snyder LH, Bradley DC, Xing J (
Beauchamp MS, Lee KE, Haxby JV, Martin A (
Buckner RL (
Buckner RL, Wheeler ME (
Chao LL, Haxby JV, Martin A (
Cohen JD, MacWhinney B, Flatt M, Provost J (
Connolly JD, Goodale MA, Desouza JF, Menon RS, Vilis T (
Conturo TE et al. (
Corbetta M, Kincade JM, Ollinger JM, McAvoy MP, Shulman GL (
Damasio AR (
Donaldson DI, Petersen SE, Ollinger JM, Buckner RL (
Fletcher PC, Shallice T, Frith CD, Frackowiak RSJ, Dolan RJ (
Francis WN, Kucera H (
Friston K, Jezzard P, Turner R (
Gauthier I, Tarr MJ, Anderson AW, Skudlarski P, Gore JC (
Grill-Spector K, Kourtzi Z, Kanwisher NG (
Hadjikhani N, Liu AK, Dale AM, Cavanagh P, Tootell RBH (
Haxby JV, Gobbini MI, Furey ML, Ishai A, Schouten JL, Pietrini P (
Henson RN, Rugg MD, Shallice T, Josephs O, Dolan RJ (
Ishai A, Ungerleider LG, Haxby JV (
Jacoby LL, Kelley CM, Dywan J (
Jacoby LL, Shimizu Y, Velanova K, Rhodes MG (
Kahn I, Davachi L, Wagner AD (
Kanwisher NG (
Kastner S, Pinsk MA, De Weerd P, Desimone R, Ungerleider LG (
Köhler S, Moscovitch M, Winocur G, Houle S, McIntosh AR (
Konishi S, Wheeler ME, Donaldson DI, Buckner RL (
Koriat A (
Kosslyn SM (
Kwong KK, Belliveau JW, Chesler DA, Goldberg IE, Weisskoff RM, Poncelet BP, Kennedy DN, Hoppel BE, Cohen MS, Turner R (
Malach R, Reppas JB, Benson RR, Kwong KK, Jiang H, Kennedy WA, Ledden PJ, Brady TJ, Rosen BR, Tootell RBH (
McAvoy MP, Ollinger JM, Buckner RL (
Miezin FM, Maccotta L, Ollinger JM, Petersen SE, Buckner RL (
O'Craven KM, Kanwisher N (
Ogawa S, Tank DW, Menon R, Ellerman JM, Kim SG, Merkle H, Ugurbil K (
Ollinger JM, Shulman GL, Corbetta M (
Ollinger JM, Corbetta M, Shulman GL (
Owen AM, Milner B, Petrides M, Evans AC (
Posner MI, Nissen MJ, Ogden WC (
Ranganath C, Johnson MK, D'Esposito M (
Ress D, Backus BT, Heeger DJ (
Shannon BJ, Buckner RL (
Shulman GL, Ollinger JM, Akbudak E, Conturo TE, Snyder AZ, Petersen SE, Corbetta M (
Slotnick SD, Schacter DL (
Snyder AZ (
Tarr MJ, Gauthier I (
Tootell RBH, Reppas JB, Kwong KK, Malach R, Born RT, Brady TJ, Rosen BR, Belliveau JW (
Ungerleider LG, Mishkin M (
Vaidya CJ, Zhao M, Desmond JE, Gabrieli JD (
Van Essen DC, Dickson J, Harwell J, Hanlon D, Anderson CH, Drury HA (
Velanova K, Jacoby LL, Wheeler ME, McAvoy MP, Petersen SE, Buckner RL (
Wheeler ME, Buckner RL (
Wheeler ME, Buckner RL (
Wheeler ME, Petersen SE, Buckner RL (
Author notes
1Department of Radiology, Washington University, St Louis, MO 63110, USA, 2Department of Neurology, Washington University, St Louis, MO 63110, USA, 3Department of Psychology, Washington University, St Louis, MO 63110, USA, 4Department of Anatomy & Neurobiology, Washington University, St Louis, MO 63110, USA and 5Howard Hughes Medical Institute, Washington University, St Louis, MO 63110, USA