


Abstract
Modulation of the steady-state visual evoked potential (SSVEP) by attention was studied in detail using 15 ‘tag’ frequencies in the range of 2.5–20 Hz. The stimuli were two series of random disc search arrays superimposed on two concentric color-marked annuli respectively. Two series of arrays were updated independently; one updated at one fixed frequency (flicker) and the other updated randomly according to a white noise distribution (random broadband flicker, rbbf). On each trial, the observer was instructed to attend one annulus and to detect a target (a triangle) that occasionally appeared in a random disc array in the attended annulus. The SSVEP results show that the choice of flicker frequency selects which cortical network synchronizes to the flicker two distinct cortical networks showed different effects of attention. SSVEP power and the effects of attention on SSVEP power strongly depend on both flicker frequency and radial position of rbbf annulus. At flicker frequencies in the delta band (2–4 Hz), and in the upper alpha band (10–11 Hz), an occipital-frontal network appears to phase-lock to the flicker when attending to the flicker, increasing the magnitude of the SSVEP. At flicker frequencies in the lower alpha band (8–10 Hz), a global response to a peripheral flickering stimulus, that includes parietal cortex and posterior frontal cortex, has higher amplitude when attention is directed away from the flickering peripheral stimulus and towards a competing rbbf stimulus in the fovea. Increases in SSVEP power when attention is directed to peripheral flicker are always associated with increases in phase locking. By contrast, at frequencies in the lower alpha band, increases in SSVEP power when attention is directed away from the flicker and towards foveal stimuli are not associated with changes in phase-locking. Thus, whether attention to a flicker stimulus increases or decreases SSVEP amplitude and phase locking depends on which of two cortical networks, which have distinct spatial and dynamic properties, is selected by the flicker frequency.
Introduction
A number of electrophysiological (Mangun and Hillyard, 1988; Heinze et al., 1990; Yamaguchi et al., 1994; Clark and Hillyard, 1996; Hillyard and Anllo-Vento, 1998; Worden et al., 2000) and neurophysiological (Luck et al., 1997; Fries et al., 2001; McMains and Somers, 2004; Reynolds and Chelazzi, 2004) studies of spatial attention have demonstrated increases in neural activity elicited by a visual stimulus when the animal or human observer directs attention to the region of visual space containing the stimulus. These results are usually taken to lend support to the qualitative notion that attention acts as a ‘spotlight’ (Posner et al., 1980) or a ‘zoom lens’ (Eriksen et al., 1986), enhancing the cortical representation of stimuli presented in attended regions of visual space relative to stimuli presented in unattended regions of visual space.
Frequency-tagging is an experimental design for EEG or MEG experiments that has been used to isolate neural responses generated by stimuli presented in a specific portion of visual space in studies of attention (Morgan et al., 1996; Muller et al., 1998a,b, 2003), or specifically related to visual input presented to one eye in studies of binocular rivalry (Tononi et al., 1998; Srinivasan et al., 1999; Srinivasan, 2004). In these studies, two or more stimuli are presented simultaneously but flickered at different frequencies. Steady-state neural responses are elicited by the flicker and simultaneously detected at each stimulus frequency by Fourier analysis of EEG or MEG recordings. In EEG recordings, these steady-state responses are known as steady-state visually evoked potentials or SSVEPs (Regan, 1977). The power, phase and coherence of steady-state neural responses elicited by a specific stimulus and tagged by one frequency are analyzed and compared across states of attention and awareness.
When the observer attends to one visual field and ignores the other while performing a target detection task, SSVEPs elicited by flicker stimulation in the attended visual field have larger amplitude than SSVEPs elicited by the same stimulus in trials where the other field is attended. This result was obtained in experiments where the SSVEP was induced by successively presenting standards and targets at a fixed flicker frequency, and in experiments where the SSVEP was elicited by an irrelevant flicker in the same region of space superimposed on irregularly presented task-related stimuli. These studies have either employed frequencies in the alpha band (8 and 12 Hz) or frequencies in the beta band (20 and 24 Hz). In all four studies (Morgan et al., 1996; Muller et al., 1998a,b, 2003), attention increased SSVEP power at electrodes over both occipital and parietal cortex.
Modulation of SSVEP power by attention can also take place when two visual stimuli are present in the same region of a display. In one EEG study (Pei et al., 2003), using flicker at delta band frequencies (2.4 and 3 Hz), the first harmonic (steady-state response at double the stimulus frequency) was found to increase when attention was directed to one of two overlapping stimuli. Because of the symmetric oscillatory motion used in their stimulus, no response was detected at the flicker frequency. In a MEG study (Chen et al., 2003), two frequency-tagged orthogonal gratings were superimposed on the same location in visual space, to elicit steady-state responses in the lower alpha band (7.4 and 8.3 Hz). When attention was directed to over a wide region of one of the gratings (three bars spread over 5.5°), the corresponding steady-state MEG response was increased. However, when attention was directed to a narrower region (only the central bar), the steady-state MEG response decreases. To our knowledge, this is the only report of attention decreasing neural responses to a visual stimulus in human or animal studies.
The use of frequency-tagging to study attention has the obvious advantage of easily separating neural responses to two or more competing stimuli. However, by choosing a particular ‘tag’ frequency to assign to one stimulus, we also select for neural populations that receive the periodic visual input and are able to produce a synchronous response at that particular frequency. In the previous studies of attention, the choice of tag frequencies has been somewhat arbitrary; the investigators usually selected two frequencies in the same EEG frequency band, e.g. delta (Pei et al., 2002), alpha (Morgan et al., 1996; Chen et al., 2003), or beta frequencies (Muller et al., 1998a,b). The magnitude and spatial distribution of the steady-state response are known to depend strongly on stimulation parameters especially stimulus frequency, presumably reflecting the entrainment of distinct cortical networks at different frequencies (Regan, 1989; Srinivasan et al., 1999; Srinivasan, 2004).
How attention modulates the SSVEP response may depend on the stimulus frequency, with some frequency-tagged cortical networks being sensitive to attention and others relatively insensitive to attention. For example, in one study using stimuli reversing at 2.4 and 3 Hz, the harmonic response at 4.8 and 6 Hz was modulated by attention, while the response at 9.6 and 12 Hz was not modulated by attention (Pei et al., 2002).
In this study, we investigate in detail the modulation of SSVEP responses by attention over a wide range of flicker frequencies. Two series of random disc arrays are presented simultaneously in two concentric annuli. One array is fixed in one position (radius) and tagged by one flicker frequency, and the other is tagged with random broadband flicker and presented at foveal and peripheral positions (as compared to the flicker annulus). On each trial, the observer is instructed to attend one annulus and to detect a target (a triangle) that occasionally appeared in a random disc array in the attended annulus.
We tested 15 ‘tag’ flicker frequencies in the frequency range of 2.5–20 Hz. The results show that SSVEP power is strongly dependent on the flicker frequency, on the position of the annulus with random broadband flicker, and on attention. For flicker frequencies in the delta (f = 2–4 Hz) and upper alpha (f = 10–12 Hz) bands, attention to the annulus with flicker always increases SSVEP power. For flicker frequencies in the lower alpha band (f = 8–10 Hz), SSVEP power is enhanced when the annulus with random broadband flicker is presented in the fovea, and attention is directed to the fovea (away from the annulus with flicker).
Materials and Methods
Stimuli
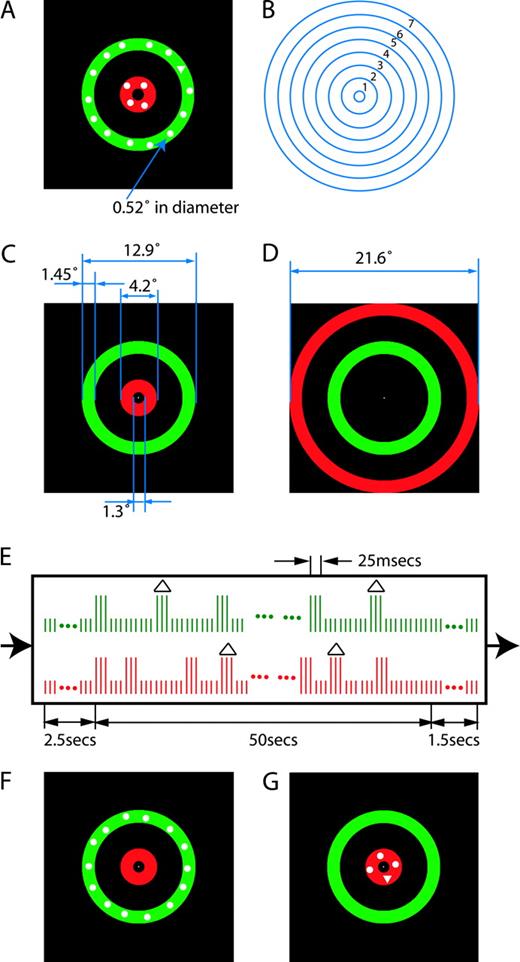
The stimuli consisted of two series of search arrays presented in two concentric annular regions, one green and one red. The two series of search arrays were updated independently, one updated regularly (flicker) and the other updated irregularly (random broadband flicker, rbbf). Figure 1A depicts an example frame of the sequence of stimuli. Each search array was composed of circular disks (0.52° in diameter), positioned randomly (both radius and angular position) over an annulus. Some of the search arrays also contained a triangle with the same area as a circular disk. The observer's task was to search for triangles (targets) amongst circular discs (distractors) in the attended annulus while ignoring both circles and triangles in the unattended annulus.
Stimuli. (A) A sample frame of the stimuli. Two circular arrays of discs are presented within the two annuli. The triangle in the green annulus has the same area as the disc (0.52° in diameter); it is a target only when the green annulus is attended. (B) Locations of seven concentric annuli (1–7). Each annulus is 1.45° in width; the innermost circle has diameter 1.3° and the outermost one has diameter 21.6°. The circular lines were not visible to the observer in the experiment. (C) The IR (interior random broadband flicker) stimulus configuration: annuli 1 and 4. Regularly updating search arrays (flicker) were superimposed on annulus 4, always on a green background. Irregularly updating search arrays (random broadband flicker, rbbf) were superimposed on annulus 1, always on a red background. (D) The ER (exterior random broadband flicker) stimulus configuration: annuli 4 and 7. Flicker was superimposed in annulus 4 on a green background and the rbbf was superimposed on annulus 7 on a red background. (E) A temporal sequence of stimulus frames. Each pair of vertically aligned green and red bars represents a video frame (8.3 ms), red for red annulus and green for green annulus. The green bars (upper trace) represent regular flicker; the red bars (lower trace) represent random broadband flicker (rbbf). The longer vertical bars represent annuli with search arrays superimposed (e.g. A, F and G) and the shorter vertical bars represent annuli without search arrays superimposed (C, D). A triangle above a longer vertical bar indicates that the search array contains a triangle. The stimuli were composed of four types of frames: frames in which a search array was (i) absent in both annuli (C), represented by a vertically aligned pair of short green and red bars, (ii) present in both annuli (A), represented by a pair of long bars, (iii) present in the green annulus but not in the red annulus (F), represented by a long green and a short red bar, and (iv) present in red annulus but not in the green annulus (G), represented by a short green and long red bar. Each trial begins with two colored concentric annuli (without superimposed search arrays) presented for 2.5 s (C or D). Then, for 50 s, search arrays are superimposed on the two annuli and updated independently. Finally, two colored concentric annuli without superimposed search arrays are presented for 1.5 s. The concentric red and green annuli are visible continuously, only the superimposed search arrays are updated.
As shown in Figure 1B, the screen was divided into seven concentric annuli, each 1.45° in width. In all experiments, the flicker was always presented in annulus 4, which was always marked green as in Figure 1C,D. In the main experiment, the rbbf was either in annulus 1 (interior rbbf, IR) or annulus 7 (exterior rbbf, ER), which were marked red as in Figure 1C,D. In one control experiment, all of the annuli positions, except annulus 4, were used for presenting the rbbf.
The stimuli were produced by a Power Mac G4 using Matlab (Natick, MA) and the Psychophysics Toolbox (Brainard, 1997; Pelli, 1997), and displayed on a 19 in. monitor (Viewsonic PF790) with a vertical refresh of 120 Hz.
Flicker Generation
Figure 1E shows a diagram indicating the timing of search array presentations within the structure of an example trial. Red and green vertical bars represent red and green annuli respectively; the longer ones represent annuli with search arrays superimposed, as shown by the example frames in Figure 1F,G, and the shorter ones represent annuli without search arrays superimposed (e.g. Fig. 1C). The example in Figure 1A is the result of the occasional coincidence of frames of the type shown in Figure 1F,G.
Flicker was generated by presenting the search array in annulus 4 for three video refreshes (120 frames/s, 25 ms), then restoring the background color for the number of video refreshes required to produce the desired flicker rate. For example, to produce 10 Hz flicker, the background color was restored for nine video refreshes (75 ms). Each time a new search array was presented, the distractors and possible target appeared in new randomly jittered locations. New search arrays were presented serially at regular intervals at 15 fixed intervals in the range T = 50–400 ms (flicker frequency f = 1/T = 2.5–20 Hz).
To generate random broadband flicker (rbbf), the search array was turned on for 25 ms (three refreshes) and then turned off for a random duration chosen from an exponential distribution in order to produce an approximately uniform frequency spectrum over the range of 2.5 to 20 Hz (random intervals in the range 50–400 ms); the mean rate was 11.25 Hz.
Generating two such independent flickering annuli required a complex sequence of four types of frames: frames in which a search array was absent in both annuli (e.g. Fig. 1C), present in both annuli (e.g. Fig. 1A), present in the green annulus but not in the red annulus (e.g. Fig. 1F), and present in red annulus but not in the green annulus (e.g. Fig. 1G).
Trial Types
Two stimulus configurations were used in all observers; in both configurations the flicker was presented on a green annulus and the rbbf was presented in the red annulus positioned foveal (IR, Fig. 1C) or peripheral (ER, Fig. 1D) to the flicker. For both configurations, the attention was directed on some trials to the flicker (attF) and on other trials to the rbbf (attR). For each of 15 test flicker frequencies (2.5–20 Hz), these four experimental conditions were randomly interleaved in one experimental session consisting of 60 trials of duration 50s each.
Control Experiment
To further examine how SSVEP power effects depend on the competing stimulus (rbbf) position, we ran a control experiment for two observers, in which the flicker was again presented on a green background in annulus 4, and the rbbf was presented in one of six other annuli (annulus 1, 2, 3, 5, 6, and 7). Each of these six configurations was tested with four flicker frequencies in the alpha band (f = 8.6, 9.2, 10 and 10.9 Hz) in one experimental session consisting of 48 trials of duration 50 s each.
Procedure
In each trial, the first video frame gave an attention instruction to the observer, e.g. ‘Attn. to Green’. Then, the observer clicked the mouse, and an image consisting of two colored concentric annuli (e.g. Fig. 1C), without superimposed search arrays was presented for 2.5 s. During this time, the observer prepared for the task by fixating at the center point and directing attention to one annulus, e.g. the green one, while ignoring the other annulus, e.g. the red one. The two independent series of search arrays were superimposed on green and red annuli respectively for 50 s, as schematically outlined in Figure 1E.
During the whole trial, the concentric red–green annuli were visible; only superimposed search arrays were updated. The target (triangle) could occur in any array, and the observer was asked to press a button in the response panel of the EEG system whenever a triangle target appeared in the attended annulus while ignoring triangles in the unattended annulus. The interval between two consecutive target occurrences was randomly chosen from an exponential distribution in order to make the number of targets of a trial following Poisson distribution with λ =14. The temporal density of targets was constant across trials with different flicker frequencies.
Before each experiment, there was a training session in which observers received feedback on the correctness of their responses. During the experiments themselves, there was no feedback.
Observers
Thirteen right-handed adults with normal or corrected vision consented to participate in this study as observers. Data from three observers were excluded from analyses because EOG recordings indicated the presence of substantial eye movements during the experiments, suggesting they did not maintain fixation during the trials. Results were examined in 10 observers (6 female) aged 22–40.
EEG Recording
Each observer was seated in front of the monitor in a dark room while EEG was recorded from electrodes that were attached to his or her scalp. The EEG was collected using a 128 channel Geodesic Sensor Net (Tucker, 1993), which provides uniform spatial sampling of the scalp surface subtending an angle of 120° from vertex. Eight electrodes were disabled to use the channels for synchronizing stimulus information with the EEG recording. Ten outer rim electrodes were discarded due to artifacts, reducing the number of available EEG channels to 110. The EEG signals were recorded with a vertex reference, analog low-pass filtered at 50 Hz, and sampled at 1000 Hz. The EEG was mathematically referenced to the average of the 110 channels. Although no EEG reference is ‘ideal’, the average reference enjoys the advantage of having some theoretical justification (Nunez and Srinivasan, 2005) and performs adequately as an approximation to reference-independent potentials in simulation studies with identical 128 channel electrode arrays (Srinivasan et al., 1998).
Photocells attached to the monitor allowed the EEG system to record the search array presentations. The observer's manual responses to targets were recorded by a switch connected to the EEG system.
Conventional Fourier Analysis
For each trial, ∼50 s of EEG data were Fourier analyzed using conventional FFT methods. The exact duration of the input data was always cropped to be an integer number of cycles at each stimulus frequency to obtain a narrow band spectrum (Δf ∼ 0.02 Hz) with one bin centered on the stimulus frequency. At each EEG channel, SSVEP power was calculated as the squared amplitude of the Fourier coefficient at each stimulus frequency. The noise power was estimated from the 100 bins in a narrow frequency band (±1 Hz) centered on the stimulus frequency but not including the stimulus frequency as the power of the fifth most powerful bin (95th percentile).
Single-cycle Fourier Coefficients
Statistical Analysis
The set of N single-cycle Fourier coefficients {Fm} at each channel was used to estimate the statistical significance of SSVEP power differences between attention directed to the annulus of flicker (attF) and attention directed to the annulus of random broadband flicker (attR) trials. We constructed a bootstrap estimate (Efron and Tibishirani, 1993) of the distribution of SSVEP power differences between attF and attR at each channel and each flicker frequency. A bootstrap sample was constructed by sampling (with replacement) N cycles from the set {Fm} and squaring the absolute value of the average Fourier coefficient to obtain an SSVEP power estimate for each condition. We used 5000 bootstrap samples obtained from attF and attR conditions to estimate the distribution of the SSVEP power difference between attF and attR. The power difference between attF and attR was considered significant if >95% of bootstrap samples showed the same sign as the observed power difference. If at one flicker frequency, the number of significant channels was <5% of the total number of channels (i.e. <6), no difference between attF and attR was considered significant for that flicker frequency.
To average SSVEP power across observers, SSVEP power on each trial was first normalized to the average SSVEP power across electrodes to yield relative power. Relative power at each electrode and the electrode-average SSVEP power were both averaged across observers. The observer-averaged relative power at each channel was then multiplied by the observer- and electrode-average SSVEP power to restore magnitude information. When testing the observer-averaged effects, the bootstrap estimates of the distribution of power difference were first calculated for each observer and similarly averaged across observers.
Phase-locking Index (PLI)
Uncorrelated EEG Power Spectrum
On each trial, we calculated the EEG power spectrum (linearly) uncorrelated with the flicker frequency and harmonics. We first removed the power at flicker frequency and its harmonic frequencies from the power spectrum obtained by the conventional FFT estimate with Δf = 0.02 Hz (example power spectra are shown in Figs 3 and 4), and replaced it with the average power in a 1 Hz band centered on that frequency (50 bins). The spectrum was then divided into 1 Hz bands from 1 to 50 Hz, and the power summed within each of these bands (50 bins). Obtaining an FFT of an entire 50 s record and summing power within bands of 50 bins (1 Hz) is identical to segmenting the record into 50 1 s epochs and averaging the power spectrum across epochs (Bendat and Piersol, 2001).
Results
Behavioral Results
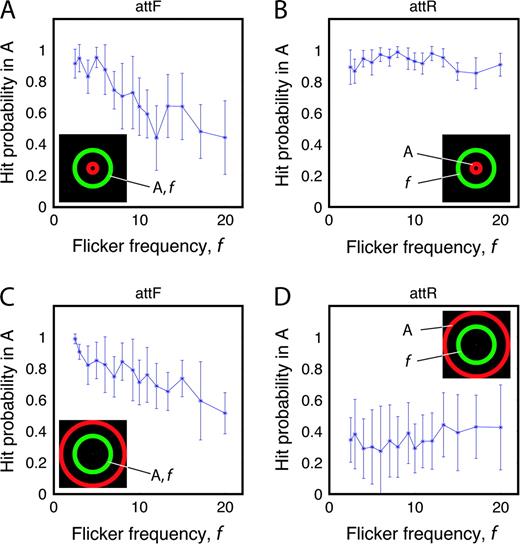
When a target-detection response occurred within 150–1000 ms after a target appeared, it was counted as a hit; otherwise, it was counted as a false alarm. To assess the success of an observer's allocation of attention, hit probability and false-alarm probabilities were calculated. Figure 2 shows the mean hit probability averaged over 10 observers as a function of flicker frequency for two different stimulus configurations. The error bars indicate standard errors. For all observers, false-alarm probability was <5%.
Average of 10 observers' hit probability as a function of flicker frequency. The error bars indicate standard errors. Inserted icons indicate experiment conditions: ‘A’ indicates the attended annulus and ‘f’ indicates the annulus superimposed with flicker. Hit probability is calculated in the attended annulus. (A, B)The hit probability for the stimulus configuration with interior random broadband flicker (IR); (C, D) the hit probability for the stimulus configuration with exterior random broadband flicker (ER). When attending to an annulus with flicker (A and C), hit probability decreases as the flicker frequency increases. When attending to an annulus with random broadband flicker (B and D), the hit probability is uncorrelated with the frequency of the unattended flicker stimulus.
In the configuration of Figure 2A, a small inner red annulus has random broadband flicker (rbbf) and is unattended; it is surrounded by an intermediate green attended annulus. Search arrays were updated at the flicker rate; thus, there are more new arrays per unit time as flicker rate increases. Therefore, we expected and observed hit probability to decrease as flicker frequency increased. When the rbbf annulus was attended in the same configuration (Fig. 2B), hit probability was independent of the flicker frequency of the unattended annulus.
In the configuration of Figure 2C, the same intermediate green annulus as in Figure 2A was now surrounded by a large red annulus. Moving the unattended annulus from an interior to an exterior position produced no significant changes in detection performance in the attended stimulus. However, when attending to the large, peripheral, rbbf annulus (Figure 2D), target detection was greatly impaired relative to a small central annulus (Figure 2B), which contained many fewer distractors.
SSVEP Power
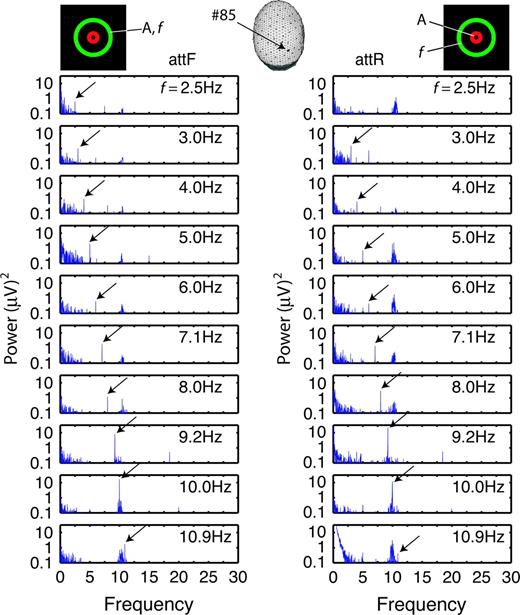
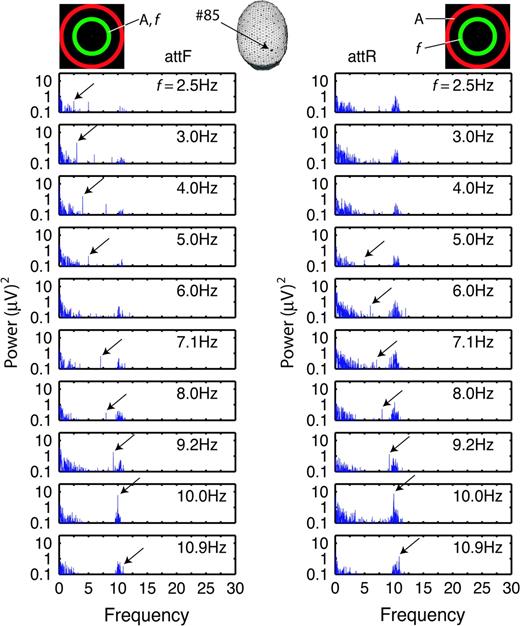
Figure 3 shows power spectra obtained at one channel located over the right occipital lobe for one observer for the IR (interior random broadband flicker) configuration. Each spectrum in the column on the left corresponds to a different flicker frequency in the attF (attention to annulus of flicker) condition. The corresponding spectra on the right are from the attR (attention to annulus of random broadband flicker) condition. The only difference between the left and right columns is where attention was directed. Power is plotted on a log scale to make results at different flicker frequencies visible. An arrow is used to indicate a peak at the flicker frequency. When no arrow is shown, power at the flicker frequency is below the noise power (estimated from neighboring frequencies). In these data, SSVEP power at the flicker frequency is greater when the flicker was attended than unattended (attF > attR) at most frequencies except for the reverse (attR > attF) at f = 8.0 and 9.2 Hz.
Power spectra at one channel (#85 of the Geodesic Sensor Net, Electrical Geodesics, Inc.) of one observer (S13) for the stimulus configuration with interior random broadband flicker (rbbf). The head in the top-middle indicates the channel located over the right occipital cortex. Inserted icons indicate experiment conditions: ‘A’ indicates the attended annulus and ‘f’ indicates the annulus superimposed with flicker. The left and the right columns show power spectra for attention to the annulus with flicker (attF) and attention to the annulus with rbbf (attR) conditions respectively. Flicker frequency f increases from top (2.5Hz) to bottom (10.9Hz). The arrows indicate the flicker frequency in each spectrum in which the flicker-frequency peak could be distinguished from surrounding noise.
Figure 4 shows power spectra in the same channel as Figure 3 for the ER (exterior random broadband flicker) configuration. For flicker frequencies in the delta band (f = 2.5, 3, and 4 Hz), SSVEP power was stronger for attF than attR. In fact, for the attR trials, power at the flicker frequency could not be distinguished from spontaneous EEG peaks at surrounding frequencies. For flicker frequencies in the alpha band, the effect of attention depended on stimulus frequency; at f = 9.2 and 10 Hz, attF increased SSVEP power, but at f = 8 and 10.9 Hz, attR increased SSVEP power. For still higher flicker frequencies (f = 12–20 Hz, not shown), SSVEP power was too weak to reliably discriminate from noise.
Power spectra at one channel (#85) of one observer (S13) for the stimulus configuration with exterior random broadband flicker (rbbf). Conventions are same as in Figure 3.
Frequency Dependence of SSVEP Power
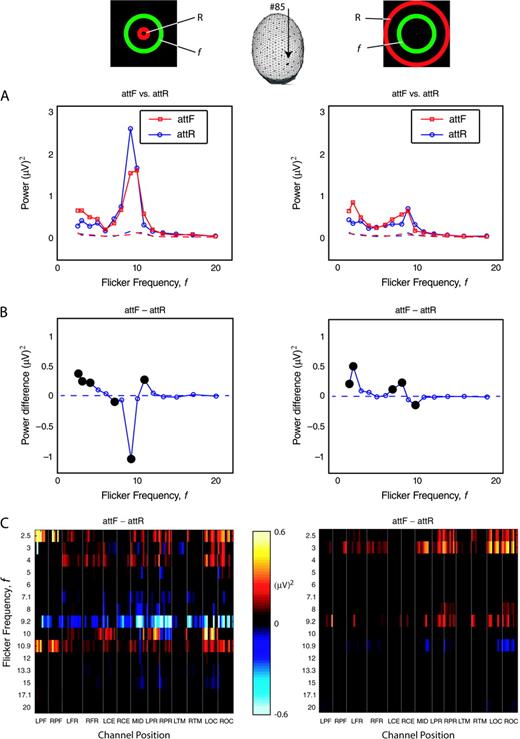
Over the range of tested frequencies, SSVEP power depends strongly on both flicker frequency and stimulus configuration (IR versus ER). Figure 5A shows SSVEP power as a function of flicker frequency averaged across 10 observers at one channel located over right occipital cortex as shown by the arrow pointing to the head. Averaged across all 10 observers, SSVEP power reaches a local maximum for flicker frequencies in the delta band (f = 2.5, 3 and 4 Hz) and in the alpha band (f = 8, 9.2, 10 and 10.9 Hz). By comparison, SSVEP power was much smaller (and often indistinguishable from the noise power) for flicker frequencies in the theta (f = 5, 6 and 7 Hz) or beta (f = 12, 13, 15, 17, 20 Hz) bands. For both stimulus configurations (IR and ER), SSVEP power increased during attF (red solid line) in comparison to attR (blue solid line) for flicker frequencies in the delta band. In the IR configuration (left), the SSVEP power for attF peaked at f =10 Hz while the response for attR had a much higher peak at f =9.2 Hz. In ER configuration, SSVEP power peaked at f =10 Hz in the alpha band for both attF and attR conditions but was much smaller than SSVEP power at f = 10 Hz for either attF or attR in the IR configuration. Frequency dependence of noise power estimates for the same bandwidth as the SSVEP (Δf ∼ 0.02 Hz) are plotted as dashed lines in the corresponding colors. Below 12 Hz, noise power was negligible (by an order of magnitude) compared to SSVEP power in both IR and ER configurations. Above 12 Hz, SSVEP power became comparable to noise power in both IR and ER configurations.
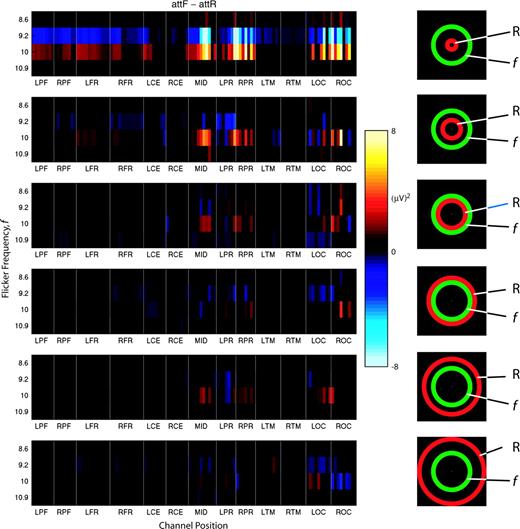
Attention-dependent SSVEP power and SSVEP power difference averaged over 10 observers for flicker frequencies f ranging from 2.5 to 20 Hz. In the inserted icons, ‘f’ indicates the annulus superimposed with flicker, and ‘R’ indicates the annulus superimposed with random broadband flicker (rbbf). The left column shows the results for the interior rbbf (IR) stimulus configuration; the right column shows the results for the exterior rbbf (ER) stimulus configuration. The head indicates that channel 85 is located over right occipital cortex. (A) SSVEP power versus flicker frequency f for attF (red solid curves) and attR (blue solid curves). The noise is estimated in a narrow frequency band (±1 Hz) centered at the flicker frequency and is plotted as a dashed line for attF (red) and attR (blue). (B) SSVEP power difference (attF minus attR) versus flicker frequency. Flicker frequencies with significant SSVEP power difference are indicated by large filled circles. (C) SSVEP power difference averaged over 10 observers is plotted for all channels and all flicker frequencies. The x-axis represents channels' positions, and the y-axis represents flicker frequency. Channels' positions are organized according to channel groups: LPF, left prefrontal; RPF, right prefrontal; LFR, left frontal; RFR, right frontal; LCE, left central; RCE, right central; MID, midline, order from the frontal to occipital pole; LPR, left parietal; RPR, right parietal; LTM, left temporal; RTM, right temporal; LOC, left occipital; ROC, right occipital. Only statistically significant differences are plotted, others are masked (black).
Modulation of SSVEP Power by Attention
Figure 5B shows the SSVEP power difference between attF and attR averaged across 10 observers at the same channel (red solid curve – blue solid curve in Fig. 5A). Large filled circles indicate significantly different frequencies. For flicker frequencies in the delta band (f = 2.5, 3 and 4 Hz), there was greater SSVEP power for attF versus attR. For flicker frequencies in the alpha band (f = 8, 9.2, 10 and 10.9 Hz), both significant positive and significant negative power differences were observed.
Figure 5C shows the distribution of observer-averaged power difference in all channels for each frequency and for each configuration (IR and ER). The EEG channels are sorted into regional groups as indicated by the figure legend. Only significant differences are shown, all other differences are masked. Corresponding to the tuning curves shown in Figure 5A, significant SSVEP power effects are mainly in the delta and alpha bands. For flicker frequencies in the delta band (f = 2.5, 3 and 4 Hz), attF increased SSVEP power at almost all channels. This effect was strongest at f = 2.5 Hz in the IR configuration and strongest at f = 3 Hz in the ER configuration. In the alpha band, stronger SSVEP power modulations were observed, but the direction depended on stimulus frequency for the IR configuration. At f = 9.2, Hz, SSVEP power decreased during attF at almost all channels while at f = 10.9 Hz power increased during attF at almost all channels. At f = 10 Hz some channels increased power and other channels decreased power. In the ER configuration SSVEP power generally increased during attF, but these effects were much weaker as compared to the delta band effects.
Phase Distribution of Single-Cycle-Fourier Coefficients
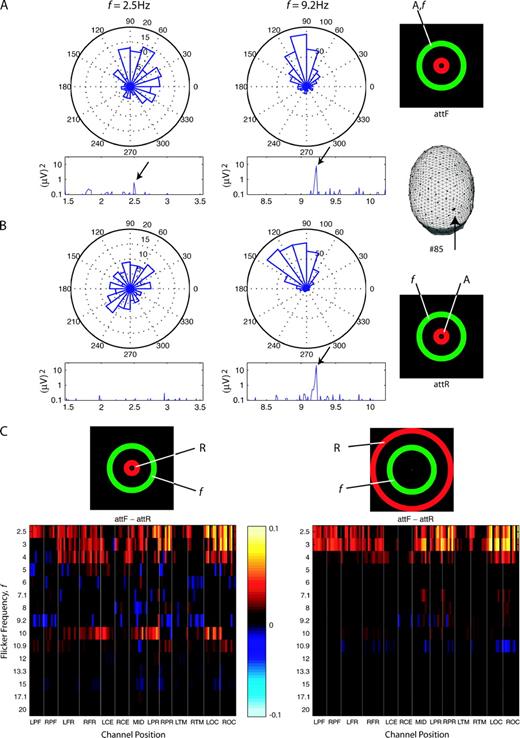
The amplitude and phase of the single–cycle Fourier coefficients (equation 1) varied from cycle to cycle within each trial. Figure 6A,B shows example phase histograms at flicker frequency and corresponding power spectrums in a 2–Hz band centered at flicker frequency for one observer at one channel (#85) for IR stimulus configuration. When the flicker frequency was f = 2.5 Hz (left), the phase histograms are concentrated over a narrower range for attF (Fig. 6A) than attR (Fig. 6B). For attF, most single-cycle Fourier coefficients have phase between 0 and 90°. For attR, phase was distributed evenly across 0 to 360°, and many pairs of cycles were 180° out of phase with each other (effectively canceling in the SSVEP power measure); therefore, no power peak could be observed at f = 2.5 Hz in the power spectrum in Figure 6B. The single–cycle Fourier coefficients were relatively phase-locked during attF as compared to attR, that is, they are distributed over a narrower range; the power at f =2.5 Hz in the power spectrum in Figure 6A (attF) is larger than that in Figure 6B (attR). However, when f = 9.2 Hz (right), the width of the phase histograms is not significantly different between attF and attR; at this frequency, attention apparently has no significant effect on phase locking, even though there is a large decrease in SSVEP power (by >50%) during attF for the IR stimulus configuration (Fig. 6A versus Fig. 6B).
Attention-dependent phase histograms and phase-locking index (PLI) differences. (A, B) Phase histograms of single-cycle Fourier coefficients and corresponding power spectra at one channel (#85) for one observer (S13). Inserted icons indicate experiment conditions: ‘A’ indicates the attended annulus and ‘f’ indicates the annulus superimposed with flicker. When the flicker frequency was at 2.5 Hz (left column), the phase histograms are more uniformly distributed during attR (B) than during attF (A). At 9.2Hz (right column), there are no significant differences in phase histograms between attF and attR. Below each phase histogram, the corresponding power spectrum is also shown. When the phase histograms are uniformly distributed (left column in B), no peak at the flicker frequency is observed. (C) Phase-locking index (PLI) difference (attF minus attR). PLIs were averaged across 10 observers, only statistically significant PLI differences are shown. Conventions are same as in Figure 5.
We calculated a phase-locking index (PLI) from equation (2) to obtain a summary measure of the width of the phase distribution across single cycles at each channel. Higher values of PLI indicate narrower width of the phase distribution; when PLI = 1 all cycles are fixed at one phase angle. The frequency dependence of PLI is similar to that of SSVEP power; it reaches a local maximum in the delta band (f = 2.5, 3 and 4 Hz) and in the alpha band (f = 8, 9.2, 10 and 10.9 Hz) for both stimulus configurations (data not shown).
Similar to the SSVEP power difference (Fig. 5C), we calculated the PLI difference between attF and attR shown in Figure 6C. For both stimulus configurations (IR and ER), PLI differences are similar to the SSVEP power differences for stimulus frequencies in the delta band (f = 2.5, 3 and 4 Hz). All significant PLI differences are positive. In addition, there are more significant channels for PLI difference than for SSVEP power difference. For stimulus frequencies in the lower alpha band (f = 9.2 Hz), for IR stimulus configuration, channels that exhibit large negative SSVEP power difference show negligible PLI differences. At f = 10 Hz, PLI goes up at some channels during attF, corresponding to increasing SSVEP power. Overall, for flicker frequencies in the alpha band, modulation of the PLI by attention appears weaker than the modulation of SSVEP power for both stimulus configurations.
Topographic Distribution of SSVEP Power
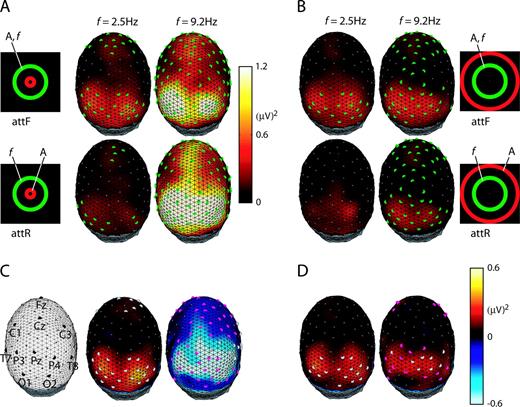
Topographic distributions of SSVEP power over 111 scalp channels averaged across 10 observers at f = 2.5 and 9.2 Hz are shown for the IR (Fig. 7A) and ER (Fig. 7B) configurations. Channels that had large signal–to–noise ratio (SNR > 3) are marked by filled green circles in Figure 7A,B. At electrodes over occipital cortex, most channels had large SNR at all flicker frequencies <12 Hz. Over frontal electrodes a smaller response could be recorded at stimulus frequencies in the delta band including f = 2.5 Hz (Fig. 7A,B left). The topographic distributions for stimulus frequencies in the lower alpha band (f = 9.2 and 10 Hz) showed differences in magnitude and spatial distribution, as shown at f = 9.2 Hz (Fig. 7A,B right). In addition to elevated occipital and frontal responses, robust SSVEP power was also observed at channels over parietal cortex (close to midline). At these parietal electrodes, robust SSVEP responses were observed only at 9.2 and 10 Hz and were strongest at 9.2 Hz. This response depended strongly on stimulus configuration, with elevated response in occipital, parietal and frontal electrodes in the IR configuration (Fig. 7A right) as compared to the ER configuration (Fig. 7B right). For stimulus frequencies in the upper alpha band (f = 10.9 Hz), the distribution and magnitude of the response (not shown) was similar to 2.5 Hz with robust SSVEP power only at occipital and frontal electrodes.
Attention-dependent topographic distributions of SSVEP power and SSVEP power differences. Inserted icons indicate experiment conditions: ‘A’ indicates the attended annulus and ‘f’ indicates the annulus superimposed with flicker. Topographic distributions of SSVEP power are shown for interior (A) and exterior (B) rbbf (random broadband flicker) configurations at flicker frequency f = 2.5 Hz (left column in A and B) and f = 9.2 Hz (right column in A and B). The filled green circles indicate channels at which the signal-to-noise ratio (the ratio of SSVEP power to noise power) was greater than 3. (C, D) Topographic distributions of SSVEP power difference of attF minus attR (first minus second row). The channels with significant attention modulation are marked: filled gray circles indicate significant attention differences in both SSVEP power and PLI, magenta circles indicate only significant SSVEP power differences.
SSVEP power differences are shown in Figure 7C,D. Two categories of channels are identified: (i) filled gray circles represent significant modulation of both SSVEP power and PLI; (ii) filled magenta circles represent significant modulation of only SSVEP power. At some frequencies, we also observed some channels with only significant PLI difference (not shown); these electrodes typically exhibited very low SNR, and were at the edges of groups of electrodes that exhibited both PLI and SSVEP power differences. For flicker frequencies in the delta band (f = 2.5, 3 and 4 Hz) topographic distributions of SSVEP power modulation were similar (sample distributions are shown at f = 2.5 Hz), with increased SSVEP power during attF in both occipital and frontal areas. Most channels showed significant increases in both SSVEP power and PLI. By contrast, when the flicker frequency was f = 9.2 Hz, for the IR stimulus configuration, the power modulation was negative for all channels (Fig. 7C left), and most of them only had significant SSVEP power modulation (and no significant PLI modulation) by attF. The significant negative power modulation (Fig. 7C left) was pronounced at the midline parietal sites that show robust SSVEP power response only at lower alpha band flicker frequencies (f = 9.2 and 10 Hz). At all other flicker frequencies in IR configuration and at any flicker frequency in the ER configuration, SNR was very low at midline parietal electrodes and no significant modulation could be observed.
Stimulus Configuration Effects on SSVEP Power
For stimulus frequencies in the lower alpha band (f = 9.2 and 10 Hz), both the magnitude and spatial distribution of SSVEP power and power modulation by attention depended on the stimulus configuration (IR versus ER), even though the annulus with flicker was held fixed at annulus 4 (see Fig. 1B). We carried out a control experiment in two observers at stimulus frequencies in the alpha band, varying the position of the random broadband flicker (rbbf) annulus from annulus 1 to 7 except 4 (Fig. 1B and inserted icons in Fig. 8), fixing the position of the flicker annulus in annulus 4. Only four flicker frequencies in the alpha band (f = 8.6, 9.2, 10 and 10.9 Hz) were investigated in this control experiment. The results from two observers were very similar. Figure 8 shows one observer's power difference between attF and attR for all channels when the position of rbbf annulus changed from innermost (top) to outermost (bottom). We found that both SSVEP power (not shown) and power differences were largest when the rbbf annulus was in the innermost position (with outer circle of 4.2 degrees in diameter), and decreased as its position moved outside. The large negative SSVEP power differences at 9.2 Hz could only be observed when the rbbf annulus was in the innermost position, and were much weaker when the rbbf annulus was moved to annulus 2. The positive power difference at 10 Hz also decreased when the rbbf annulus was moved to annulus 2. When the rbbf annulus was placed in annulus 3, 5, 6 or 7 (corresponding to the ER condition), SSVEP power differences became negligible. Thus, SSVEP power modulation for flicker frequencies in the alpha band occurred only if the competing rbbf annulus was presented foveally.
Attention-dependent SSVEP power differences in alpha band for one observer (S13) for six positions of the random broadband flicker (rbbf) annulus. Inserted icons indicate different stimulus configurations; ‘f’ indicates the annulus superimposed with flicker, and ‘R’ indicates the annulus superimposed with rbbf. For each stimulus configuration, significant SSVEP power differences (attF minus attR) are plotted for flicker frequencies in the alpha band (8.6, 9.2, 10 and 10.9 Hz).The x-axis represents channels' positions, and the y-axis represents flicker frequency. Conventions are the same as in Figure 5.
Uncorrelated EEG Power
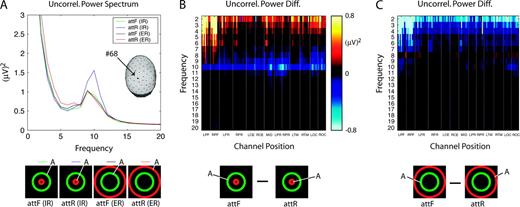
The SSVEP power modulation by attention showed strong dependence on flicker frequency and stimulus configuration. We investigated the broadband EEG spectrum to determine if corresponding modulations are observed. EEG power, uncorrelated with the stimulus flicker frequency (and harmonics), was calculated and averaged across 10 observers. Uncorrelated power is the power in the EEG spectrum remaining after the flicker frequency and its harmonics have been removed. Uncorrelated power is computed in each 1–Hz frequency band. We averaged uncorrelated power over all flicker conditions for each stimulus configuration and attentional condition. Figure 9A shows uncorrelated power spectra for each experimental condition at a midline parietal channel (#68), located as indicated. The uncorrelated alpha power (centered on 10 Hz) was much stronger when attention was directed to the innermost annulus (attR in IR configuration, blue line) than when attention was directed to the middle annulus (attF in both IR and ER configurations, green and black lines) or to the outermost annulus (attR in ER configuration, red line). Similar to the representation for SSVEP power in Figure 5C and for PLI in Figure 6C, we plotted uncorrelated power difference (attF minus attR) in Figure 9B,C for both IR configuration (B) and ER configuration (C). When attention moved to annulus 4 from annulus 1 (attF versus attR in Fig. 9B), uncorrelated power decreased in the alpha band at channels over parietal and occipital areas. When attention moved to annulus 4 from annulus 7 (attF versus attR in Fig. 9C), uncorrelated power was only slightly modulated in the alpha band. Uncorrelated delta/theta (2–7 Hz) power was also modulated by attention and stimulus configuration. In the IR configuration (Fig. 9B) delta/theta power increased during attF and was largest at frontal, prefrontal, temporal, and occipital channels. In the ER configuration (Fig. 9C), the opposite effect was observed, with higher delta/theta power during attR. By contrast, for flicker frequencies in the delta band, SSVEP power always increased when attention was directed to the annulus with flicker.
Uncorrelated power spectrum and power difference. The uncorrelated power spectrum is calculated by setting the power at flicker frequency and its harmonic frequencies to zero and summing in each 1-Hz band. Inserted icons indicate experiment conditions; ‘A’ indicates the attended annulus. (A) Uncorrelated power spectrum averaged over all flicker frequencies for each experiment condition, and averaged across all 10 observers for one channel (#68) is plotted for four experimental conditions: attF (IR) (green line), attR (IR) (blue line), attF (ER) (black line) and attR (ER) (red line). The head indicates that channel 68 is located in the middle parietal. (B, C) Uncorrelated power difference (attF minus attR) for interior rbbf (B) and exterior rbbf (C) configurations averaged across 10 observers. The x-axis represents channels' positions, and the y-axis represents frequency. Conventions are the same as in Figure 5.
Discussion
We applied the frequency-tagging design to isolate SSVEP responses to one of two competing stimuli in a spatial attention task. Our objective was to investigate the effects of choice of flicker frequency f on SSVEP power differences between (i) attention to annulus flickering at a fixed frequency f (attF); and (ii) attention to a competing annulus with random broadband flicker (rbbf) (attR). The flicker annulus radial position was held fixed while the radial position of the competing random broadband flicker (rbbf) stimulus was either foveal (interior, IR) or peripheral (exterior, ER) to the flicker annulus. We found that SSVEP power and the effects of attention on the SSVEP strongly depend on both flicker frequency and radial position of the rbbf annulus.
Frequency-tagging Cortical Networks by Flicker Frequency
Background
Frequency-tagging provides a means to study functional brain networks that process sensory inputs by using a periodic stimulus. Early studies of steady-state responses using EEG electrodes positioned over occipital and parietal cortex in humans (Tyler, 1978; Regan, 1989), and local field potentials recorded within monkey visual cortex (Nakayama and Mackeben, 1982) demonstrated that SSVEPs recorded over visual cortex depend not only on temporal frequency of the visual input but also on other physical parameters of stimulus such as spatial frequency, modulation depth, color, etc. The dependence of the magnitude of the SSVEP response on the input frequency is characterized by at least three different ‘resonance’ frequencies, i.e. a peak in the response amplitude at the stimulation frequency, in the 7–10 Hz (alpha), 15–30 Hz (beta) and 40–50 Hz (gamma) bands (Regan, 1989). Even at a single electrode site, individual observers can show multiple peaks within these resonant bands. Studies of multi-unit activity in the cat visual cortex with periodic stimulation have also shown a similar banded structure with peaks in the magnitude of the response at multiple stimulus frequencies in the theta (4–7 Hz), beta (16–30 Hz) and gamma (30–50 Hz) ranges (Rager and Singer, 1998). None of these previous studies of SSVEP responses to different flicker frequencies investigated preferred frequencies in the delta band (2–4 Hz) that were observed in the present experiment. SSVEP responses in these different frequency bands show quite different sensitivities to physical parameters of the flicker suggesting that they reflect the entrainment of functionally distinct although spatially overlapping cortical networks (Regan, 1989).
Because of the limited number of electrodes used in the studies referred to above, not much information was available on the spatial properties of these different frequency bands. More recently, the power, phase, and coherence of the steady-state response have been studied with large numbers of EEG electrodes and MEG sensors covering the whole scalp in a number of cognitive tasks such as binocular rivalry (Srinivasan et al., 1999; Srinivasan, 2004), selective attention (Chen et al., 2003) and working memory (Silberstein et al., 2001), demonstrating task-related modulations of steady-state responses to visual input at many scalp locations including temporal, frontal and prefrontal regions far from primary visual cortex. These experiments also have shown that the amplitude and spatial distribution of the steady-state EEG or MEG over the scalp is an extremely sensitive function of driving frequency, e.g. sensitive to 1–2 Hz changes. We may reasonably expect that small changes in input frequency will not change the spatial location of inputs to the cortex (Silberstein, 1995; Srinivasan, 2004). Thus, the evidence of spatiotemporal tuning of EEG and MEG responses suggests the presence of cortical resonance phenomena that depend on both spatial location and input frequency. Thus, by changing the flicker frequencies in a frequency-tagging experiment we potentially select for different functional networks whose natural frequencies match the flicker frequency.
Spatial Aspects
In our pilot experiments for this study, we found that the relationship between SSVEP power and flicker frequency depended on stimulus position. SSVEP power exhibited maxima at different flicker frequencies when the flicker occurred in annuli with different radii. As a consequence, we kept the flicker in a fixed position in the middle annulus (annulus 4), and changed only attention instructions and the position of the rbbf (random broadband flicker) annulus. Under these fixed conditions, we find here that attention does not change which frequencies have maximum SSVEP power: flicker frequencies in the delta (2–4 Hz) and alpha (8–12 Hz) bands always produce higher responses than theta (4–8 Hz) or beta (12–20 Hz) bands. However, the magnitude of these responses depends on the position of the competing rbbf stimulus and on attention.
For almost every flicker frequency, SSVEP responses were observed at occipital electrodes. For delta and alpha band frequencies, SSVEP responses were observed at frontal/prefrontal electrodes. In addition, a distinct functional network responds with very high SSVEP power when the flicker frequency is in the lower alpha band (f = 9.2 and 10 Hz). Whether or not the flicker is attended, at these flicker frequencies, SSVEP power is elevated at occipital and frontal/prefrontal electrodes as compared to SSVEP power for flicker frequencies in the delta band (f = 2.5, 3, 4 Hz) and upper alpha band (f = 10.9 Hz). Furthermore, parietal and posterior medial frontal sites that show negligible SSVEP power at all other flicker frequencies show very high SSVEP power for flicker frequencies in the lower alpha band when the flicker is not attended and attention is directed to the foveal rbbf stimulus. Due to the limitations of scalp recording of EEG, we cannot specify exactly which cortical areas respond over this narrow frequency range. It is apparent that a different response is taking place for flicker at lower alpha band frequencies involving parietal cortex and extending to areas of posterior frontal cortex that receive visual input.
Unlike frequency-tagging experiments in binocular rivalry (Srinivasan et al., 1999; Srinivasan, 2004), very little response is detected at temporal electrodes at any stimulus frequency in this experiment. This may reflect differences in both the physical stimulus (small discs that change in position versus large colored gratings at fixed positions in binocular rivalry) and in the use of a visual search task in this attention experiment as compared to a passive report of perceived form and color in binocular rivalry.
Phase-locking to the Flicker Is Enhanced by Attention
SSVEP power is usually measured in a narrow frequency band surrounding the stimulus frequency. In this experiment, by using a 50 s trial, Δf was determined to be 0.02 Hz. This narrow bandwidth is useful in segregating the SSVEP response from the rest of the EEG spectrum and artifacts. However, the implication of this choice is that SSVEP power depends on the consistency of the phase of the response over a very long interval consisting of many stimulus presentations (at 10 Hz, 500 stimuli are presented). SSVEP power is a statistical measure that combines average amplitude and phase consistency over a large number of cycles of the flicker. SSVEP power can be increased by increasing the amplitude on each cycle, but can also be increased by reducing the variability of the phase of the response between cycles.
We used a PLI to measure phase synchronization to the stimulus flicker over each trial. Like the SSVEP power, PLI is measured in a narrow frequency band by averaging a large number of cycles of EEG responses at the flicker frequency. The main difference is that the PLI forces constant unit amplitude on each cycle. Thus, PLI is a measure of the width of the phase distribution across cycles and can be used to assess the contribution of phase-locking to SSVEP power. SSVEP power and PLI will behave similarly if the consistency of the phase of the steady-state response over the recording interval is the major contribution to SSVEP power differences. However, SSVEP power may be modulated independently of the PLI if the average amplitude of the response to each stimulus in the flicker is increased without changing the dispersion of phase.
In this experiment, the PLI showed similar frequency dependence as SSVEP power with maximum phase-locking observed for flicker frequencies in delta and alpha bands. At all flicker frequencies, increases in SSVEP power by attention to the flicker were always associated with increased PLI. When the observer attended to the flicker annulus and ignored the rbbf annulus (in either spatial location), both PLI and SSVEP power increased for flicker frequencies in the delta band. Thus, the SSVEP power effects in the delta band are reflected in the similarity of phase from cycle to cycle. By contrast, for flicker frequencies in the lower alpha band (f = 9.2 Hz) SSVEP power reduced when attending to the flicker, but PLI was not modulated by attention. The phase distribution was very narrow whether or not the flicker was attended, and the lower-alpha-band PLI was higher than the delta band. The dramatic increase in SSVEP power when attention was directed away from the flicker does not appear to correlate to changes in the phase distribution, and presumably reflects amplitude modulation of the SSVEP response.
The phase-locking mechanism of generation of evoked responses has been demonstrated in a number of studies. Phase-resetting of ongoing oscillations in the theta and alpha bands has been shown to contribute significantly to the generation of the transient visual evoked potential (VEP), and in particular the P1–N1 complex (Gruber et al., 2005). Measures of phase-locking such as the PLI (Schack and Klimesch, 2002; Schack and Weiss, 2005) and intertrial coherence (Stapells et al., 1987) have all provided evidence that phase modulation of ongoing EEG delta, theta and alpha contributes to the magnitude and latency of the VEP. VEP characteristics (latency and amplitude of components) have also been shown to be strongly influenced by the amplitude and phase of theta and alpha oscillations at stimulus presentation (Jansen and Brandt, 1991). While in studies of spatial attention, P1 and N1 potentials in ERP are increased (see review by Luck et al., 2000), the contributions of phase-locking to these effects have not been directly investigated. In the present SSVEP experiment, increased SSVEP power is always associated with increased PLI.
Distinct Topographic Distribution at Lower Alpha Band Flicker Frequencies
Robust SSVEP power was observed in the lower alpha band with a distinctly ‘global’ spatial pattern involving a much larger number of electrodes (almost the entire array), many of which show minimal response at other flicker frequencies in the upper alpha band or in the delta band. Electrodes over parietal and posterior medial frontal cortex, which showed negligible responses at all other frequencies, show robust SSVEP power for flicker frequencies in the lower alpha band. Much higher SSVEP power is also observed at occipital and frontal/prefrontal electrodes for lower alpha band frequencies than at other flicker frequencies. A distinct large-scale network appears to be engaged only by flicker in the lower alpha band frequencies, with spatial distribution reminiscent of the global distribution of the alpha rhythm (Nunez, 1995).
Reversed Effects of Attention at Lower Alpha Band Flicker Frequencies
The strong SSVEP response in the lower alpha band is also reflected in elevated PLI, and is strongly dependent on the position of the rbbf annulus; highest SSVEP power to peripheral flicker is observed when the attended rbbf annulus is in fovea (annulus 1). Only SSVEP power is modulated by attention to flicker at these lower alpha band frequencies; the PLI (and hence the distribution of phase) is unchanged. For lower alpha band frequencies, attending to the flicker stimulus reduces SSVEP power, contrary to all other frequencies. That is, SSVEP power increases when attending to the rbbf annulus in the foveal position (and ignoring the flicker annulus). The increase in SSVEP power by attending away from the lower alpha band flicker stimulus is produced by an increased average amplitude of each single cycle without significantly influencing the phase distribution.
The attentional modulation of SSVEP power in the lower alpha band is systematic with respect to the position of the attended rbbf stimulus. Only when attention is directed to the fovea does the SSVEP response to a peripheral flickering stimulus increase in amplitude. This has some parallels to the only earlier report of negative power modulation of steady-state MEG power by attending to the flicker at 7.4 and 8.3 Hz (Chen et al., 2003). As in this study, the MEG study shows increased SSVEP power to an unattended flickering stimulus only when attention is directed to fovea (in that experiment, <2°).
Spontaneous Alpha is Not the Main Cause of the Reversed Attention SSVEP Power Effect
The reversed attention SSVEP power effect is paralleled by the reduction of a broadband (Δf ∼ 1 Hz) uncorrelated EEG power centered on the same lower alpha band frequencies when the peripheral flicker annulus is attended versus when the competing foveal rbbf annulus is attended. When attention is fixed on the flicker annulus, uncorrelated power in the lower alpha band is unchanged when the rbbf annulus changes position. Can the reversed attention SSVEP power effect result from simple addition of this (mainly) parietal alpha rhythm to the SSVEP response? Four factors suggest this is not possible:
In the narrow frequency band (Δf ∼ 0.02 Hz) where SSVEP is measured, spontaneous alpha power is extremely small.
Even in a wider frequency band (1–2 Hz band), the modulation of the alpha rhythm is much smaller than the SSVEP power modulation.
In delta band (2–4 Hz), uncorrelated EEG power changes are inconsistent with SSVEP power modulation. If the presence of additive spontaneous activity were to influence our SSVEP power measure, large negative uncorrelated EEG power differences in the delta band (Fig. 9C) would also influence SSVEP power differences. The direction of these uncorrelated delta-band power effects is reversed from positive to negative when the rbbf is moved from foveal (IR) (Fig. 9B) to peripheral (ER) (Fig. 9C) locations, while the SSVEP power for flicker in the delta band always increases with attention (Fig. 5C).
Decline in alpha rhythm would produce an increase in phase locking, but no such increase was observed. If alpha rhythm was simply being added to the SSVEP, the PLI should decline since alpha rhythm power will have random phase with respect to the stimulus. We have no evidence of difference in PLI between attF and attR for lower alpha band frequencies.
Global Circuits Respond Preferentially to the Unattended Peripheral Flicker
When attention is directed to the foveal rbbf stimulus, parietal and posterior medial frontal cortex appear not only to generate more alpha rhythm power, but also to respond more strongly to flicker at the same frequencies. In engineering systems, it is well known that when a network of oscillators is forced at close to its natural frequencies it produces a much larger response than when forced at other frequencies (Bendat and Piersol, 2001). Thus, one interpretation of the enhanced SSVEP power in the lower alpha band is that global circuits that include parietal and posterior medial frontal cortex with natural frequencies in the alpha band respond preferentially to the unattended peripheral flicker when attention is directed to fovea.
Modulation of Global Cortical Resonances
In the lower alpha band, a global circuit response to the peripheral flicker is decreased when attention is directed to it as compared to when attention is directed away to the fovea -- the reverse-attention of the usual effect. We note that in binocular rivalry a similar global resonance was identified in the lower alpha band, identically at f = 9.2 and 10 Hz (Srinivasan, 2004). However, in rivalry, when the observer reported awareness of the stimulus flicking in the lower alpha band, SSVEP power was increased as compared to when the observer reported awareness of its rival stimulus. Attention and dominance-in-rivalry apparently have opposite effects on SSVEP at lower alpha-band frequencies.
Conclusions
In this frequency-tagging EEG experiment on spatial attention, the choice of flicker frequency and spatial configuration selects for cortical networks that can oscillate at the flicker frequency. These networks have different sensitivities to attention. At low flicker frequencies in the delta band, and in the upper alpha band, an occipital-frontal network appears to phase-lock to the flicker when attending to the flicker, increasing the steady-state response. When attention is directed away from the flicker in the lower alpha band and towards a competing stimulus in the fovea, a global resonance, including parietal cortex and posterior frontal cortex, responds preferentially to the unattended flicker.
This research was supported by a grant from the National Institute of Mental Health, R01-MH068004-01.
References
Bendat JS, Piersol AG (
Clark VP, Hillyard SA (
Chen Y, Seth AK, Gally JA, Edelman GM (
Eriksen CW, St. James JD (
Fries P, Reynolds JH, Rorie AE, Desimone R (
Gruber WR, Klimesch W, Sauseng P, Doppelmayr M (
Heinze HJ, Luck SJ, Mangun GR, Hillyard SA (
Hillyard SA, Anllo-Vento L (
Jansen BH, Brandt ME (
Luck SJ, Chellazzi L, Hillyard SA, Desimone R (
Luck SJ, Woodman GF, Vogel EK (
McMains SA, Somers DC (
Mangun GR, Hillyard SA (
Morgan ST, Hansen JC, Hillyard SA (
Muller MM, Picton TW, Valdes-Sosa P, Riera J, Teder-Salejarvi WA, Hillyard SA (
Muller MM, Teder-Salejarvi WA, Hillyard SA (
Muller MM, Malinowski P, Gruber T, Hillyard SA (
Nakayama K, Mackeben M (
Nunez PL, Srinivasan R (
Pelli DG (
Posner MI, Snyder CRR, Davidson BJ (
Rager G, Singer W (
Reynolds JH, Chelazzi L (
Schark B, Klimesch W (
Schark B, Weiss S (
Silberstein RB (
Silberstein RB, Nunez PL, Pipingas A, Harris P, Danieli F (
Srinivasan R, Nunez PL, Silberstein RB (
Srinivasan R, Russell DP, Edelman GM, Tononi G (
Srinivasan R (
Stapells DR, Makeig S, Galambos R (
Tononi G, Srinivasan R, Russell DP, and Edelman GM (
Tucker DM (
Tyler CW, Apkarian P, Nakayama K (
Worden MS, Foxe JJ, Wang N, Simpson GV (