


Abstract
Spatial knowledge about an environment can be cued from memory by perception of a visual scene during active navigation or by imagination of the relationships between nonvisible landmarks, such as when providing directions. It is not known whether these different ways of accessing spatial knowledge elicit the same representations in the brain. To address this issue, we scanned participants with fMRI, while they performed a judgment of relative direction (JRD) task that required them to retrieve real-world spatial relationships in response to either pictorial or verbal cues. Multivoxel pattern analyses revealed several brain regions that exhibited representations that were independent of the cues to access spatial memory. Specifically, entorhinal cortex in the medial temporal lobe and the retrosplenial complex (RSC) in the medial parietal lobe coded for the heading assumed on a particular trial, whereas the parahippocampal place area (PPA) contained information about the starting location of the JRD. These results demonstrate the existence of spatial representations in RSC, ERC, and PPA that are common to visually guided navigation and spatial imagery.
Introduction
A critical component of navigation is establishing one's bearings—that is, determining one's current location and heading. Extensive evidence indicates that humans and animals can use visual input to orient themselves in space (Morris 1981; Etienne et al. 1996; Hartley et al. 2004). In addition, humans can reorient at will, by imagining themselves somewhere else, as one would do when providing directions to a friend. Do both of these kinds of spatial orientation ultimately access the same spatial representations? Under some theoretical accounts, the same neural machinery used for spatial orientation in response to visual input should also be used for spatial orientation in the imagination (Byrne et al. 2007). However, conclusive evidence for common neural representations underlying visually guided orientation and spatial imagery has not yet been provided. It is this issue that we address here.
Neuropsychological data provides some support for the idea of a common mechanism and some insight about the brain regions involved. Patients with damage to a set of structures including the medial temporal lobe, parahippocampal cortex, retrosplenial cortex, and posterior parietal lobe exhibit difficulties with visually guided navigation (Habib and Sirigu 1987; Takahashi et al. 1997; Aguirre and D'Esposito 1999; Barrash et al. 2000). In some cases, these difficulties include problems with spatial imagination. For example, patients with damage to the retrosplenial/medial parietal cortex are unable to orient themselves in familiar environments despite being able to recognize the surrounding landmarks, and they are also unable to orient in their imagination. As a result of this deficit, they cannot describe routes between familiar places even though they can correctly describe what those places look like from memory (Takahashi et al. 1997). Imagery deficits are also observed after damage to other parts of the navigation network. For example, patients with damage to medial temporal lobe regions such as the hippocampus have problems imagining detailed spatial scenes (Hassabis, Kumaran, Vann et al. 2007; although see Squire et al. 2010), although their ability to imagine routes between familiar locations is sometimes unimpaired (Teng and Squire 1999).
Neuroimaging work provides even stronger support for the idea of a common mechanism for spatial navigation and spatial imagery involving the medial temporal lobe (MTL), retrosplenial region, and parahippocampal region. For example, the retrosplenial complex (RSC) and the parahippocampal place area (PPA) activate strongly when subjects view scenes and landmarks and also when they create mental images of landmarks (O'Craven and Kanwisher 2000). These regions, along with the hippocampus, posterior parietal cortex, and ventromedial prefrontal cortex, have been described as a “scene construction network” that activates when subjects vividly imagine spatial scenes (Hassabis, Kumaran and Maguire 2007) or recall spatial routes from memory (Ghaem et al. 1997; Maguire et al. 1997). These regions are also believed to be involved in episodic memory recall more generally (Buckner and Carroll 2007; Schacter and Addis 2007; Ranganath and Ritchey 2012). Recent studies have increased our understanding of the function of these brain regions by using fMRI adaptation and multivoxel pattern analyses to identify representations of heading, location, and views that are engaged when orienting in response to visual stimuli (Baumann and Mattingley 2010; Vass and Epstein 2013; Chadwick et al. 2015) or when constructing imagined spatial scenes in response to verbal cues (Marchette et al. 2014). However, no previous study has directly compared representations engaged during perception with those engaged during imagery.
To test whether the same spatial representations are accessed when subjects orient based on visual information or orient in the imagination, we scanned subjects with fMRI while they performed a judgment of relative direction (JRD) task in response to either pictorial or verbal cues. This task requires subjects to place themselves in a familiar location while facing a specific direction on each trial and to indicate whether a target item would be on their left or right given the indicated view. Subjects were students from the University of Pennsylvania, and the locations and targets were familiar places and landmarks from the university campus. In the pictorial version of the task, subjects were presented with a photograph and had to orient relative to the depicted view, a problem similar to what a navigator might face in the real world if they were lost and had to reestablish their bearings based on visual perception of the environment. In the verbal version, subjects were presented with verbal input (e.g., “at X facing Y”) and were required to create the indicated spatial view in their imagination. We then looked at multivoxel activity codes corresponding to the heading (i.e., facing direction) and location established on each trial to determine whether similar codes were elicited in the 2 versions of the JRD task. To anticipate, we observed representations of heading in RSC and entorhinal cortex that generalized across the pictorial and verbal versions of the JRD task and representations of location in PPA that also showed cross-version generalization.
Materials and Methods
Subjects
Sixteen healthy right-handed subjects (9 female, mean age = 22 ± 0.2 year) with normal or corrected-to-normal vision were scanned with fMRI. All subjects had at least 2 years of experience with the University of Pennsylvania campus and were either current undergraduate students or recent graduates. Subjects provided written informed consent in compliance with procedures approved by the University of Pennsylvania Institutional Review Board.
MRI Acquisition
Scanning was performed at the Hospital of the University of Pennsylvania using a 3T Siemens Trio scanner equipped with a 32-channel head coil. High-resolution T1-weighted anatomical images were acquired using a three-dimensional magnetization-prepared rapid-acquisition gradient-echo pulse sequence (repetition time [TR] = 1620 ms; echo time [TE] = 3 ms; inversion time = 950 ms; voxel size = 0.9766 × 0.9766 × 1 mm; matrix size = 192 × 256 × 160). T2*-weighted images sensitive to blood oxygenation level-dependent contrasts were acquired using a gradient-echo echo-planar pulse sequence (TR = 3000 ms; TE = 30 ms; voxel size = 3 × 3 × 3 mm; matrix size = 64 × 64 × 44).
Procedure
Prescreening Session
At least 1 day before the fMRI scan, subjects were brought in for an extensive prescreening appointment to confirm their knowledge of the Penn campus. In order to be eligible for the scan session, subjects were required to successfully complete 5 computerized tests of spatial knowledge.
First, we assessed subjects' familiarity with the 77 campus landmarks used in the experiment. For each landmark, subjects were presented with the name of the landmark and asked to i) indicate whether they were familiar with that place (yes/no), ii) rate how vividly they could imagine that place using a 5-point scale, and iii) rate their confidence that they could navigate to that place from their home using a 4-point scale.
Second, we tested subjects' explicit knowledge of the allocentric directional relationships between campus landmarks. On each trial, subjects were presented with a statement of the form “X is ______ of Y,” where X and Y were the names of landmarks. Subjects indicated whether the correct directional relationship was North (N), East (E), South (S), or West (W). This test consisted of 72 trials total, 16 trials which queried the converse of directional relationships that subjects would later retrieve in the fMRI experiment (e.g., subjects responded “X is North of Y” and were later asked in the scanner to imagine standing at X facing Y, i.e., facing South), and 56 trials whose directional relationships were not probed in the scanner.
Third, subjects were trained on the 2 versions of the judgment of relative direction (JRD) task that were used in the fMRI experiment. In the verbal version of the JRD task, subjects were presented with the names of 3 campus landmarks (X, Y, Z) and were asked to imagine they were at X facing Y and then indicate whether Z would be on their left or right given that imagined viewpoint. In the picture version of the JRD task, subjects were shown a photograph of what it looks like to stand at X facing Y, with the name of the target landmark (Z) superimposed onto the photograph; they then indicated whether Z would be on their left or right given the view shown in the photograph. Subjects completed 200 practice trials of each version of the task, with no time limit imposed for responding. All practice trials started from 1 of 4 locations (statue, bridge, 2 intersections) and asked subjects to imagine or perceive headings to the N, E, S, or W. These trials were non-overlapping with those used in the main fMRI experiment, which consisted of N, E, S, and W views from 4 different campus locations. This procedure allowed subjects to gain practice with the task itself without exposing them to the stimuli of interest.
Fourth, subjects completed 72 trials of each version of the JRD task presented at the same rate as in the fMRI experiment (5.5 s + 0.5 s interstimulus interval; ISI); these trials were drawn from the same stimulus set as the unspeeded practice trials.
Finally, to confirm subjects' familiarity with the 77 campus landmarks, they were presented with the name of a campus landmark and were asked to select the matching photograph of that landmark from a deck of cards. The landmarks were grouped into four decks: open spaces (e.g., intersections, N = 14), academic buildings (N = 18), dormitories and recreational facilities (N = 26), and restaurants (N = 19). Subjects completed all trials corresponding to the first deck before proceeding to the second, third, and fourth decks in turn.
Subjects that successfully completed all 5 tests of spatial knowledge (16 out of 25 subjects screened) were subsequently scanned with fMRI. This required correct photo identification of all 77 landmarks and at least 80% accuracy on all other measures.
Experimental Session
In the main experimental session, each subject completed 8 functional scan runs followed by a high-resolution anatomical scan. The functional scan runs were acquired in the following order: 3 runs in which subjects performed a verbal version of the JRD task, 2 functional localizer runs to identify scene-selective regions, and 3 runs in which they performed a picture version of the JRD task. The verbal version was always performed before the picture version to ensure that subjects could not imagine the specific photographic stimuli during the verbal version of the task. JRD scan runs were 10.8 min in length and consisted of 93 or 94 6-s stimulus trials interspersed with 5 or 6 12-s null trials. There was an additional 18-s null trial at the end of each run to capture the hemodynamic response of the final stimulus trial.
On each trial of the verbal version of the JRD task, subjects viewed a multicolored texture (1024 × 768 pixels) overlaid with the names of 3 campus landmarks for 5.5 s, presented centrally on separate lines and flanked by nonsense characters that extended to the full width of the screen. They were instructed to imagine themselves standing at the landmark indicated in the first line while facing the landmark indicated in the second line, and to respond via button press whether the target landmark on the third line would be to their left or right. On each trial of the picture version of the JRD task, subjects viewed a photograph of a view on the Penn campus (1024 × 768 pixels) for 5.5 s, overlaid with the name of a target landmark, which was centrally presented. They were instructed to indicate whether the target landmark would be on their left or right from the depicted view. In both versions, subjects made a “left” response by pressing a button with their left thumb and a “right” response by pressing a button with their right thumb. Visual stimuli remained on the screen throughout the entire trial and there was a 0.5-s blank gray screen before the next trial. Responses from the verbal runs of one participant were not collected due to a technical error. Null trials consisted of 12 s of a gray screen, during which subjects made no response.
Trials in both versions of the task were drawn from the same set of 32 JRD problems, which were constructed by using 4 campus locations (2 statues, a courtyard, and a large compass inlaid in a walkway) as starting points, 4 cardinal directions (N, E, S, W) as headings, and 1 target to the left, and 1 target to the right for each of the 16 possible views. Heading-indicating landmarks used in the verbal version (16 total, corresponding to the 16 possible views) were selected so that the bearing from the starting point was as close as possible to the cardinal directions as defined by the campus grid (mean deviation = 10 ± 1°). Color photographs corresponding to the 16 possible views (e.g., starting at the center of the courtyard, facing E) were shown in the picture version. The same set of 32 target landmarks was used in both versions, which were selected so that their relative bearing from the indicated heading direction was within 70° of 90° or 270° (mean deviation from 90 or 270 = 19 ± 3°). Heading-indicating and target landmarks were non-overlapping, with one exception: the south-indicating heading cue at Location 3 was also a target landmark when facing E at that location.
Over the course of the experiment, subjects performed 272 trials of the verbal task and 272 trials of the picture task, corresponding to 17 instantiations of the 16 possible views in each case. Note that this meant that each JRD problem was presented either 8 or 9 times in each task. To ensure that each trial in the verbal version was visually unique, landmark names in each instantiation of a view were presented in a different font, and a unique multicolored background texture was used on each trial. To ensure that each trial in the picture version was visually unique, 17 different photographs of each of the 16 views were shown, and target landmark names were presented in 17 fonts that were different from the fonts used in the verbal version. We randomised the assignment of fonts and images separately for each subject such that each view was paired with each font and each image (17 photographs of the view or 17 different textures) exactly once. This randomization procedure was used to minimize the possibility that the spatial variables of interest could be confounded with regularities in the text, textures, or photographs.
Trials were ordered using a Type 1 n 1 sequence (Aguirre 2007), which fully counterbalanced the trials at the level of the JRD's campus view (e.g., Location 1 facing N) such that each view was presented before and after every other view including itself exactly once. Subjects completed one full counterbalanced sequence for each task, which was spread across 3 scan runs. Because this created an interruption of the sequence between runs, each run began with the last 3 trials from the end of the previous run (or in the case of the first run, the last 3 trials from the end of the third run), which were subsequently removed and not analyzed.
In addition to the experimental runs, subjects also completed 2 functional localizer runs (5.25 min each), during which subjects performed a one-back repetition task. Stimuli were presented for 800 ms with 200 ms ISI and consisted of images of scenes, objects, and scrambled objects, which were presented in 15-s blocks.
Data Analysis
fMRI Preprocessing
Functional images were corrected for differences in slice acquisition timing using VoxBo's sliceacq function (http://www.nitrc.org/projects/voxbo, last accessed December 24, 2015), which resamples slices in time using sinc interpolation to match the first slice of each volume. Data from each scan were then preprocessed using FSL's FEAT 5.98 (Jenkinson et al. 2012), which included prewhitening to account for autocorrelation in time, high pass temporal filtering at a period of 100 s, and motion correction using MCFLIRT (Jenkinson et al. 2002). Outlier volumes, in which global signal values were >3.5 SD away from the mean or subject motion exceeded 3 mm, were identified using the Artifact Detection Tools (http://www.nitrc.org/projects/artifact_detect, last accessed December 24, 2015). Data from the functional localizer scans were smoothed with a 5-mm full-width-half-maximum (FWHM) Gaussian filter; data from the experimental runs were not smoothed. We discarded the first 3 trials (i.e., 6 volumes) of each experimental scan run as these trials served to re-instantiate the continuous carryover sequence from the previous scan run.
Functional Regions of Interest
Data from the functional localizer scans were used to identify 2 scene-responsive regions of interest (ROIs), the parahippocampal place area (PPA) and retrosplenial complex (RSC), which have been previously implicated in place recognition and navigation (Epstein and Vass 2014). PPA and RSC were defined for each subject using a contrast of scenes > objects in a general linear model run in FEAT 5.98 and a group-based anatomical constraint of scene-selective activation derived from 42 independent subjects previously scanned by our lab (Julian et al. 2012). For each hemisphere of PPA and each hemisphere of RSC, we selected the 100 voxels within the group-based mask that showed the strongest scenes > objects effect. This method defines regions in a threshold-free manner and ensures that ROIs of equal size can be defined for each hemisphere and ROI for all subjects.
Anatomical Regions of Interest
We anatomically defined 6 ROIs within the medial temporal lobe (anterior hippocampus, posterior hippocampus, presubiculum, entorhinal cortex, perirhinal cortex, and parahippocampal cortex) based on data from the high-resolution T1-weighted structural scan. The hippocampus and presubiculum were defined using the fully automated segmentation protocol in FreeSurfer 5.1 (Van Leemput et al. 2009). This technique uses Bayesian inference on an upsampled version of the T1 structural image to determine the likely hippocampal subfield identify of each 0.5 × 0.5 × 0.5 mm voxel. We first assigned a subfield identity to each “mini-voxel” by selecting the subfield with the highest probability. We then assigned the identity of each 3 × 3 × 3 mm functional voxel according to the most commonly occurring subfield across the 216 mini-voxels. The hippocampus ROI was defined as the union of the CA1, CA2/3, CA4/Dentate Gyrus, and subiculum subregions. Note that because presubiculum is a small region relative to our voxel size, this ROI may contain some activity from neighboring regions (i.e., subiculum, entorhinal cortex). We then divided the hippocampus into anterior and posterior subregions at the middle coronal slice of each subject's hippocampus. Entorhinal, perirhinal, and parahippocampal cortices were defined based on manual parcellation of the T1 anatomical image in ITK-SNAP (http://www.itksnap.org) following the protocol in Pruessner et al. (2002). We also created an ROI based on the anatomically defined retrosplenial cortex (i.e., Brodmann Areas 29/30). We isolated BA 29/30 from the template provided with MRIcron (http://www.nitrc.org/projects/mricron , last accessed December 24, 2015), excluding the parts of BA 30 ventral to Z = 2, as these correspond to Brodmann Area 36. We then transformed this region to each subject's native anatomical space using FLIRT 5.5 (Jenkinson and Smith 2001; Jenkinson et al. 2002). Note that because the boundaries of BA 29/30 are defined cytoarchitectonically and are not visible with MRI, the ROI is necessarily an approximation of this anatomically defined region.
Cross-Task Decoding of Location and Heading
To determine whether each ROI coded location or heading in a manner that generalized across task, we calculated the cross-task correlations between the multivoxel patterns elicited in the 2 tasks (Haxby et al. 2001). First, for each ROI in each subject, we determined activation patterns for the 32 JRD problems (4 starting locations × 4 heading directions × 2 responses) in each task using a general linear model (see below). Second, we separately normalized the patterns from each task by calculating the mean pattern across JRDs from that task (i.e., the cocktail mean) and subtracting this mean pattern from each of the 32 individual JRD patterns. Third, we created a 32 × 32 correlation matrix by calculating the cross-task Pearson correlation between all pairs of JRDs. Each cell of the correlation matrix was assigned to 1 of 8 possible groups based on whether the pair of JRDs shared the same location (Same Location, SL; Different Location, DL), heading (Same Heading, SH; Different Heading, DH), or response (Same Response, SR; Different Response, DR). Finally, we averaged over correlation values for cells corresponding to each of the 8 groups to obtain a mean value for each condition for each subject, and we submitted these values to additional analyses described in the Results to identify location and heading codes.
General linear models were run using FEAT 5.98 in each subject's native space. There were 6 first-level models, 1 for each scan run, and 2 higher-level models that computed the fixed effects across the 3 scan runs from each task. Each model contained 32 regressors of interest, one for each JRD problem, which modeled the presentations of a given JRD as a 6-s boxcar convolved with a double gamma hemodynamic response function and were high-pass-filtered at a period of 100 s. First-level models also contained nuisance regressors corresponding to the 6 motion parameters calculated by MCFLIRT and stick functions for any volumes identified as outliers by the Artifact Detection Tools.
Searchlight Analyses
To test for cross-task coding of location or heading across the entire brain, we implemented a searchlight procedure (Kriegeskorte et al. 2006) to perform pattern analyses in small spherical ROIs (radius = 5 mm) centered on every voxel of the brain in turn. The procedure was identical to that described earlier. Values corresponding to the strength of the location and heading code within each searchlight were calculated as described in the Results and assigned to the center voxel of the spherical ROI, generating whole-brain maps for each subject. These individual subject maps were then transformed into standard space using FLIRT 5.5 and smoothed with a 9-mm FWHM Gaussian filter before performing higher-level random effects analyses to identify voxels that reliably coded for location or heading across subjects. Finally, to estimate the true Type 1 error rate for each type of spatial coding, we performed permutation testing (Nichols and Holmes 2002) using FSL's randomise function with 12-mm variance smoothing and 10 000 permutations per contrast. We report voxels that are significant at P < 0.05, corrected for multiple comparisons across the entire brain. Foci that survived significance testing were also used as ROIs in representational similarity analyses (described below). For these analyses, we created masks consisting of the voxels that were significant at an uncorrected threshold of P < 0.001 and transformed these masks to each subject's native space before extracting pattern similarities.
Representational Structure Analyses
To characterize the location and heading codes identified in the ROI and searchlight analyses, we separately examined coding of each specific location and each specific direction. For each region, we generated matrices that consisted of the average pattern similarity for each pair of locations (4 × 4) and each pair of directions (4 × 4). Elements on the diagonal of the matrix represent cross-task correlations for the same location (e.g., Verbal Location 1–Picture Location 1) or the same direction (e.g., Verbal N–Picture N), and elements on the off-diagonal of the matrix represent cross-task correlations for different locations (e.g., Verbal Location 1–Picture Location 2) or different directions (e.g., Verbal N–Picture E). We then compared the magnitude of coding across the 4 directions or 4 locations using repeated-measures ANOVAs as described in Results. All reported t tests are two-tailed.
Results
Behavioral Performance
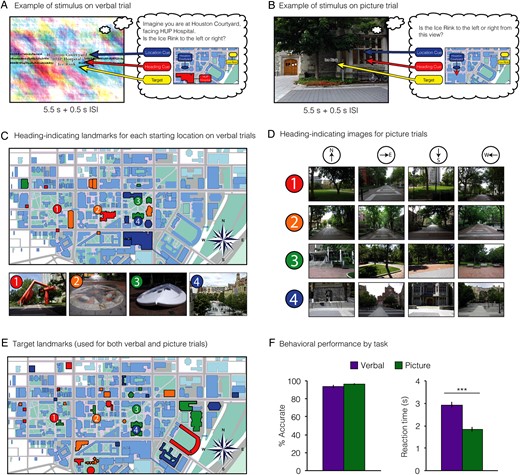
During the fMRI experiment, subjects performed verbal and picture versions of a judgment of relative direction (JRD) task (Fig. 1). Subjects performed both versions of the task rapidly and accurately, which was expected given the extensive prescreening and the prescan practice session in which they performed the same task on a different set of stimuli (% Correct Verbal: 93.6 ± 0.02; % Correct Picture: 96.2 ± 0.01; difference t14 = 1.4, P = 0.19). They responded significantly more quickly in the Picture version of the task than in the Verbal version (Picture: 1.8 ± 0.1 s; Verbal: 2.9 ± 0.1 s; difference t14 = 8.3, P < 0.001), which likely reflects the additional time necessary to reconstruct the view from spatial memory in the Verbal case.
Experimental design and task. (A) Example stimulus from a verbal scan run. On each trial, subjects indicated whether a target would be on their left or right given an imagined starting location (“Location Cue”) and heading (“Heading Cue”). (B) Example stimulus from a picture scan run. On each trial, subjects indicated whether a target landmark would be on their left or right given the view shown in the photograph. Note that both (A,B) depict the same JRD, but with different visual cues. Maps illustrate the landmarks and spatial quantities retrieved in each case but were never shown to the subjects. (C) Map showing starting locations (numbered circles) used for both verbal and picture trials and heading-indicating landmarks used for verbal trials (highlighted buildings). Locations 1 and 3 were defined by statues, location 2 by a compass inlaid on the sidewalk, and location 4 was the center of a courtyard. Photographs of these location-defining entities are shown for illustrative purposes but were never shown to subjects. Each starting location was assigned a unique set of 4 landmarks to serve as North, East, South, and West heading cues on verbal trials; colors indicate the correspondence between heading-indicating landmarks and locations. (D) Examples of heading-indicating images used on picture trials (which also implicitly indicated the starting location). For each starting location (1–4), subjects viewed photographs facing North, East, South, or West. We collected 17 photographs of each view (1 shown for each). (E) Map showing the 32 target landmarks used for both verbal and picture trials plotted relative to the corresponding locations. For each view (N = 16), one target was to the left and one target to the right. Colors indicate correspondence between target cues and locations. (F) Behavioral performance by task. Subjects were equally accurate on both versions of the task, but were significantly faster for JRDs cued with picture stimuli. Error bars indicate mean ± SEM. ***P < 0.001.
We also tested whether reaction times varied as a function of starting location and allocentric heading to explore the possibility that some locations or headings might be more easily accessible in spatial memory (Shelton and McNamara 1997; Montello et al. 2004). In both versions of the task, reaction times differed significantly across starting locations (one-way repeated-measures ANOVA; Verbal: F3,42 = 3.2, P = 0.03; Picture: F3,45 = 3.6, P = 0.02) and allocentric headings (Verbal: F3,42 = 6.9, P = 0.001; Picture: F3,45 = 21.9, P < 0.00001). Specifically, subjects were faster for views at Location 1 than for views in other locations, although not all post hoc pairwise comparisons were significant (Verbal: Location 1 vs. 2 t14 = 2.2, P = 0.046; Verbal Location 1 vs. 3 t14 = 1.9, P = 0.08; Verbal Location 1 vs. 4 t14 = 3.6, P = 0.003; Picture Location 1 vs. 2 t15 = 2.6, P = 0.02; Picture Location 1 vs. 3 t15 = 3.2, P = 0.007; Picture Location 1 vs. 4 t15 = 0.7, P = 0.47). Subjects also responded significantly faster for views facing North than for views facing other directions in both tasks (East, South, and West; all Ps < 0.02); in the Picture version, subjects were also faster for S than for E (t15 = 2.3, P = 0.03). Thus, although all of our subjects had extensive real-world experience with the campus, which no doubt included experience with all 4 locations and all 4 headings, their behavioral performance indicated a privileged representation of North-facing headings and, to a lesser extent, 1 of the 4 campus locations.
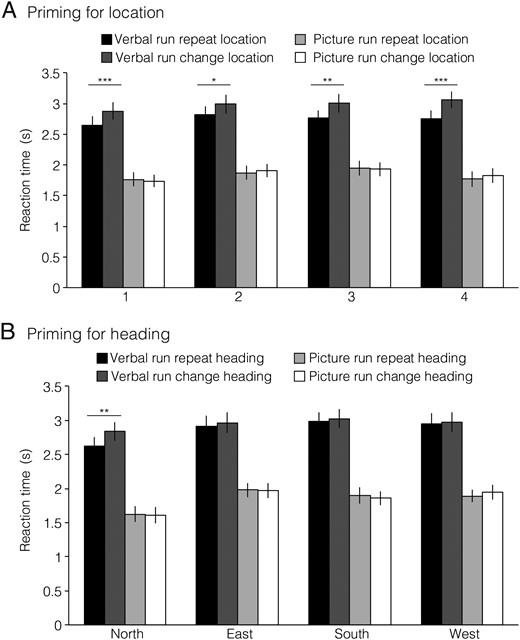
Finally, we examined reaction times for evidence of location or heading priming across successive JRD trials (Fig. 2). Specifically, we tested whether response was speeded on trials that shared either the same starting location or same allocentric heading as the immediately preceding trial. To ensure that these tests were independent of each other, we restricted analyses of location priming to successive trials facing different headings and restricted analyses of heading priming to successive trials from different locations. We observed significant location priming in the Verbal version of the task (t14 = 6.3, P = 0.00002; individual locations all Ps < 0.04), but not the Picture version (t15 = 0.2, NS; individual locations all Ps > 0.4). However, location priming in the Verbal version should be interpreted with caution since it may simply reflect visual or lexical priming due to repetition of the name of the starting location across trials. There was no overall direction priming in either version of the task (Verbal: t14 = 0.6, P = 0.59; Picture: t15 = 0.6, P = 0.58), but when we examined each direction separately, we observed priming for North in the Verbal version (t14 = 3.2, P = 0.007).
Behavioral priming. (A) Priming for location. Trials were sorted based on starting location (1–4) and the starting location on the immediately preceding trial, which could either be the same (“Repeat”) or different (“Change”). To ensure a pure measure of location priming, only trial pairs that differed in heading were included in the analysis. In the verbal runs, subjects showed significant priming for all 4 locations, which may reflect lexical priming when the name of the starting location was repeated. There was no location priming in the picture runs. (B) Priming for heading. Trials were sorted based on heading (N, E, S, W) and the heading on the immediately preceding trial, which could either be the same (“Repeat”) or different (“Change”). To ensure a pure measure of heading priming, only trial pairs that differed in location were included in the analysis. There was significant heading priming for North, but only in the verbal runs. *P < 0.05; **P < 0.01; ***P < 0.001.
Cross-Task Coding of Location and Heading
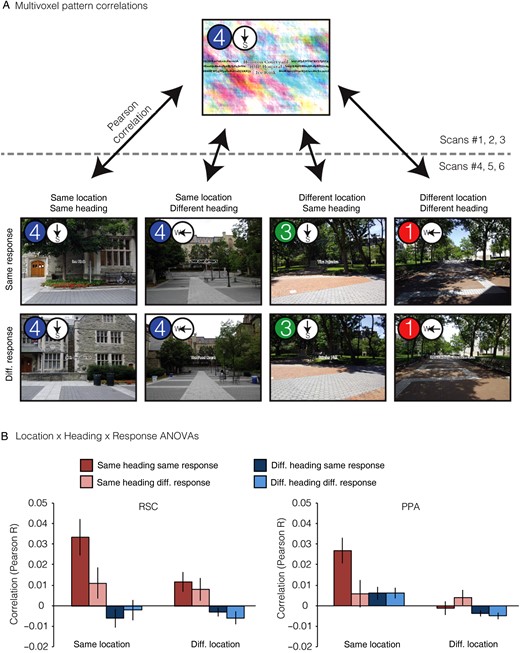
Next, we turned to our primary question: are there brain regions that support location and heading representations that abstract across the verbal and picture versions of the JRD task? This would indicate coding of spatial quantities in a manner that is independent of the specific experimental stimulus (i.e., verbal or photograph) and at least partially independent of the exact cognitive processes used to access spatial memories (i.e., spatial imagery or visual inspection of the scene). To test this, we measured the pattern similarity (i.e., Pearson correlation) between all pairs of JRD problems across tasks (Fig. 3). We then grouped the resulting 1024 (32 × 32) pattern similarity values into 8 conditions based on 3 crossed factors: whether the pair of JRDs were from the Same or Different Location (SL or DL), faced the Same or Different Heading (SH or DH), or demanded the Same or Different Response (i.e., target to the left or right; SR or DR). We reasoned that if a brain region encoded information about a particular spatial quantity (e.g., allocentric heading), then JRD problems that share that spatial quantity (e.g., both heading N) should elicit multivoxel activity patterns that were more similar than JRD problems that differ on that spatial quantity (e.g., heading N vs. heading E).
Multivoxel pattern correlations in PPA and RSC. (A) Coding of location and heading was assessed by measuring pattern similarities between JRD trials in verbal runs and JRD trials in picture runs. We first calculated the mean pattern of voxelwise activity for each JRD problem in each version of the task. We then obtained pairwise similarity between all verbal JRDs and all picture JRDs by calculating the Pearson correlations between these voxelwise activity patterns. Finally, we grouped JRD pairs based on whether they shared the same starting location, heading, or response and calculated the average pattern similarity for each of these 8 groups (1 example pair of each shown). (B) Pattern similarity was greater in RSC for JRDs sharing the same heading, whereas pattern similarity was greater in PPA for JRDs sharing the same starting location. Beyond this, JRDs corresponding to the same problem (i.e., the same combination of starting location, heading, and target) had an addition degree of similarity in both regions.
We first report results from the functionally defined scene-selective regions, Retrosplenial Complex (RSC), and Parahippocampal Place Area (PPA; Fig. 3) before considering other brain regions. We focused on these regions because the previous neuroimaging work has implicated them in navigation (Ghaem et al. 1997; Maguire et al. 1998; Rosenbaum et al. 2004; Spiers and Maguire 2006; Epstein 2008; Sherrill et al. 2013), spatial memory (Wolbers and Buchel 2005; Epstein et al. 2007; Brown et al. 2010), and spatial orientation (Vass and Epstein 2013; Marchette et al. 2014; Sulpizio et al. 2014).
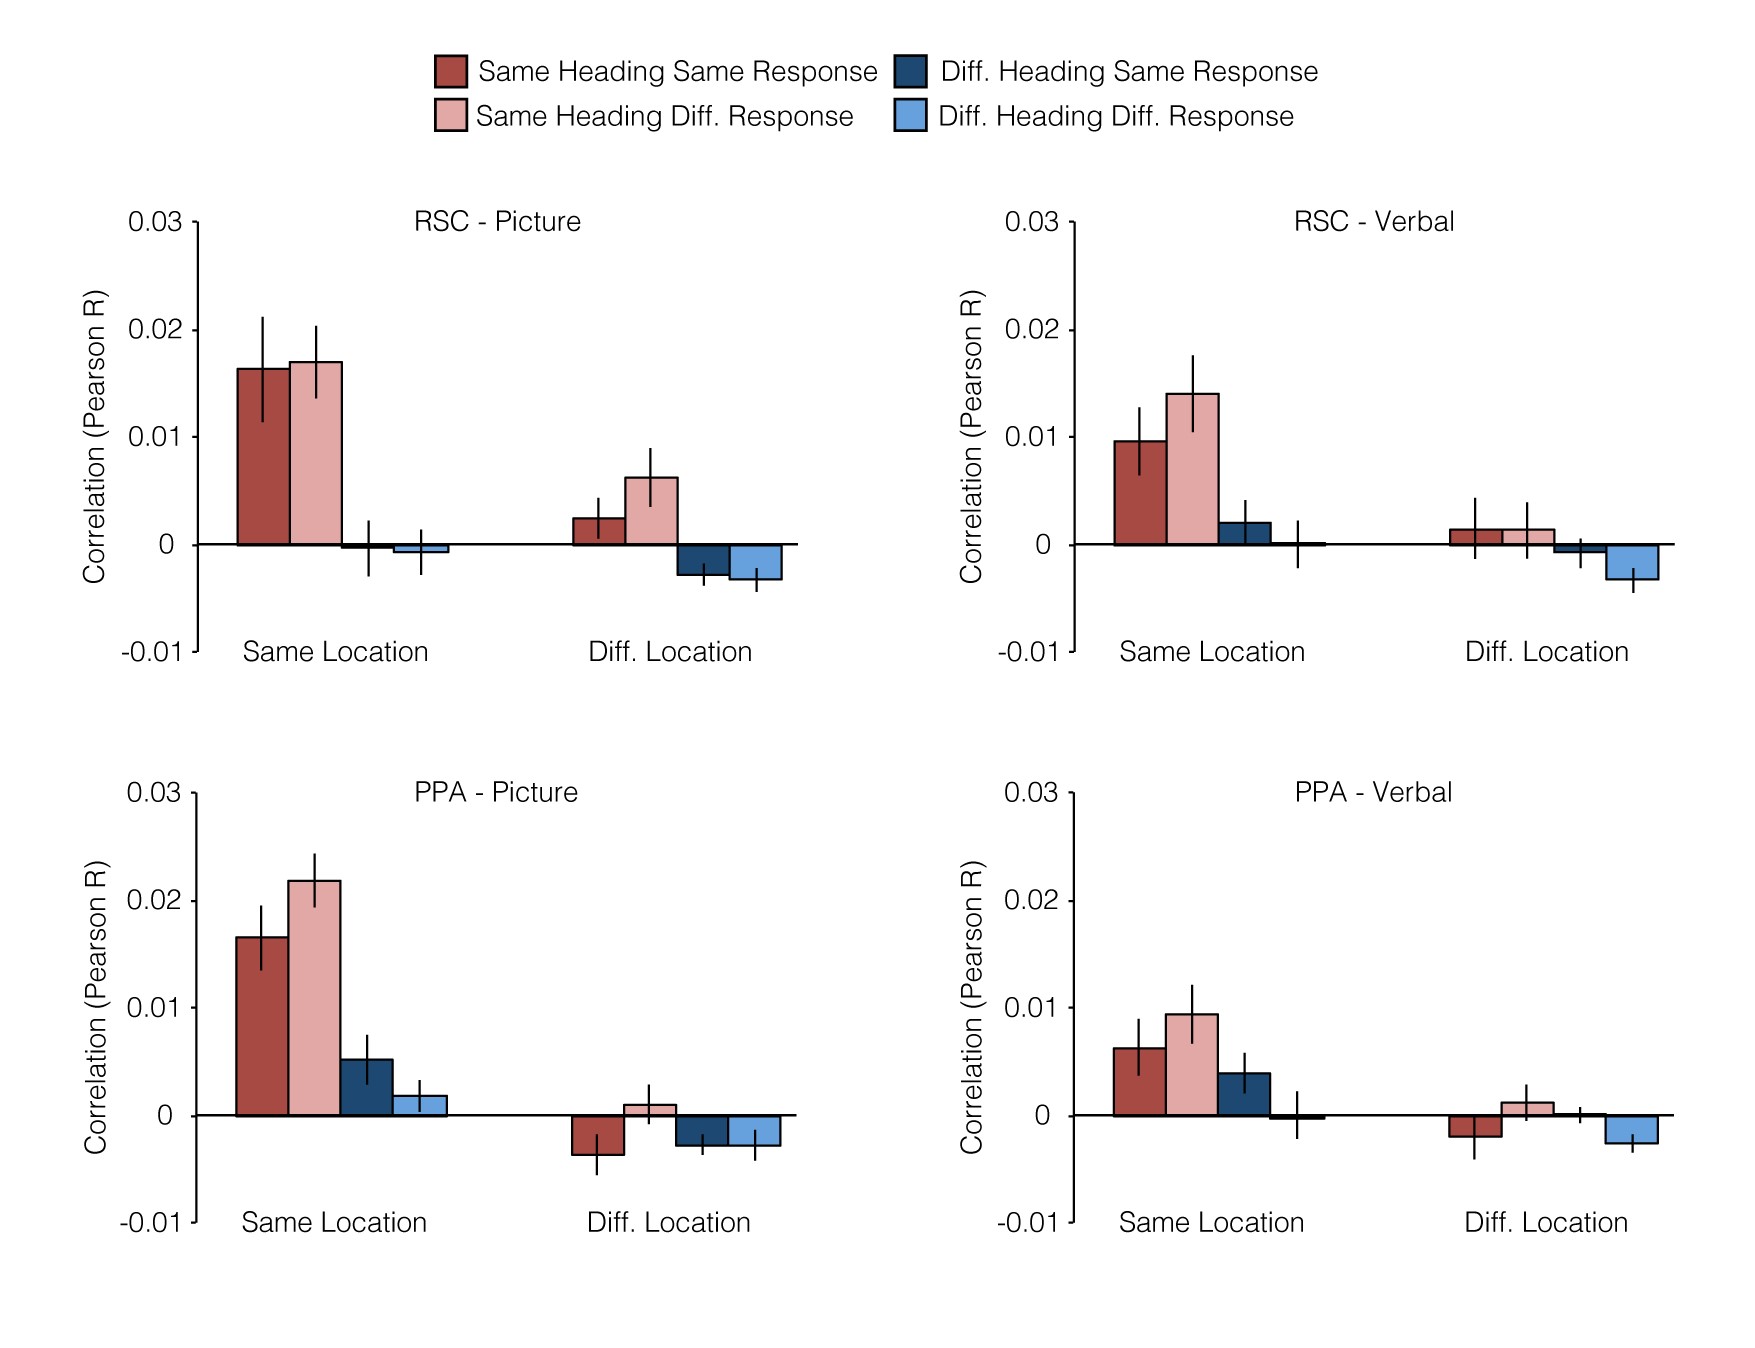
In our first set of analyses, we submitted the similarity values to a Location (Same, Different) × Heading (Same, Different) × Response (Same, Different) repeated-measures ANOVA to investigate whether pattern similarity within each region of interest (ROI) was modulated by any of these factors (Fig. 3; see also Supplementary Fig. 1). Based on the previous work (Vass and Epstein 2013), we predicted that RSC would be sensitive to the spatial quantities associated with the JRD problems. Consistent with this expectation, pattern similarities in RSC were significantly greater for JRDs that shared the same allocentric heading (main effect of heading: F1,15 = 14.5, P = 0.002), an effect that was modulated by response (interaction between heading and response: F1,15 = 6.9, P = 0.02) such that pattern similarity was higher for JRDs that elicited the same response, but only when they also shared the same heading. Pattern similarity in RSC was not significantly modulated by location (main effect: F1,15 = 2.6, P = 0.13), and there was no interaction of location with heading (F1,15 = 2.1, P = 0.16) or response (F1,15 = 0.56, P = 0.47); nor was there a main effect of response (F1,15 = 2.0, P = 0.18). We also observed evidence for spatial coding in the PPA: pattern similarities in this region were significantly greater for JRDs that shared the same location (main effect: F1,15 = 8.5, P = 0.01), the same heading (main effect: F1,15 = 5.8, P = 0.03), or the same response (main effect: F1,15 = 6.0, P = 0.03). The main effect of location was modulated by heading and response (interaction between location and response: F1,15 = 18.6, P = 0.0006; interaction between location, heading, and response: F1,15 = 9.7 P = 0.007); no other interactions were significant (all Ps > 0.16).
At first glance, these results suggest that RSC encodes heading (with some modulation by response) and PPA encodes location, heading, and response. However, the interpretation of these results is complicated by the inclusion of the SL-SH-SR condition, which may have a special status because it reflects similarity between trials in which subjects performed the exact same JRD problem. Moreover, an additional confound is the fact that trials being compared in this condition share visual information (i.e., the word indicating the target) even though they are in different formats. Indeed, a cursory examination of the mean pattern similarities by correlation type (Fig. 3) shows that PPA and RSC exhibited very high correlations for the same JRD problem across tasks (i.e., SL-SH-SR correlation type). Pattern similarity in PPA was significantly higher for this correlation type than for any of the other 7 correlation types (two-tailed t-tests; all Ps < 0.007). Similarly, pattern similarity for same problem was significantly higher than all but one other correlation type in RSC (two-tailed t-tests; Ps < 0.03, except for the SL-SH-DR condition). Thus, to better assess heading and location coding, we performed an additional set of analyses following the approach used in our previous study (Vass and Epstein 2013). Specifically, we performed separate 2 × 2 repeated-measure ANOVAs on Location × Response, restricted to different headings only, and on Heading × Response, restricted to different locations only. These analyses exclude the problematic SL-SH-SR condition; moreover, they provide “pure” measures of heading coding uncontaminated by location coding and location coding uncontaminated by heading coding. Note that this is the same approach that we used to analyze the behavioral priming data in the preceding section.
In these analyses, RSC still exhibited a significant main effect of heading (F1,15 = 7.3, P = 0.02), but there was no longer an interaction with response (F1,15 = 0.01, P = 0.92). As before, location effects in RSC were not significant (main effect: F1,15 = 0.01, P = 0.92, interaction with response: F1,15 = 0.70, P = 0.41). PPA once again exhibited a main effect of location (F1,15 = 9.8, P = 0.007) but in this case with no modulation by response (F1,15 = 0.13, P = 0.72); there were no main effects of heading in this region (F1,15 = 2.6, P = 0.13) or heading × response interactions (F1,15 = 1.5, P = 0.24). There were no main effects of response in either region in either analysis (all Ps > 0.28). Thus, the results of the constrained ANOVAs indicate that patterns in RSC coded for allocentric heading across stimulus types whereas patterns in PPA coded for starting location across stimulus types (see Supplementary Results for analyses of spatial coding within each task version). Interestingly, this is somewhat different from the results of our previous study (Vass and Epstein 2013), in which RSC coded location and (to a lesser extent) heading, while no clear evidence of location or heading coding was observed in the PPA. We consider possible reasons for this discrepancy in the discussion.
It is important to note that these effects were observed in the functionally defined PPA and RSC. These regions partially overlap with anatomically defined parahippocampal cortex (PHC) and anatomically defined retrosplenial cortex (i.e., Brodmann Areas 29/30), regions that have been implicated in spatial processing and memory retrieval (Mullally and Maguire 2011; Auger et al. 2012; Wang et al. 2013). On average, 32% of PHC voxels fell within the PPA ROI and 25% of PPA voxels fell within the PHC ROI. On average, 13% of BA 29/30 voxels fell within the RSC ROI and 12% of RSC voxels fell within the BA 29/30 ROI. To determine whether the results we observed in PPA and RSC could be attributed to processing in PHC and BA 29/30, we performed separate analyses on these anatomically defined regions. When we analyzed the anterior portion of PHC that did not overlap with the voxels that were included in the PPA, we did not find any significant effects in the 2 × 2 ANOVA (all Ps > 0.16). On the other hand, when we analyzed the portion of BA 29/30 that did not overlap with the voxels that were included in RSC, we found that it responded similarly to RSC (main effect of heading: F1,15 = 14.4, P = 0.001; all other Ps > 0.17). Thus, our results indicated that BA 29/30 and RSC responded in a functionally similar manner, but the PPA and the portion of PHC anterior to the PPA did not.
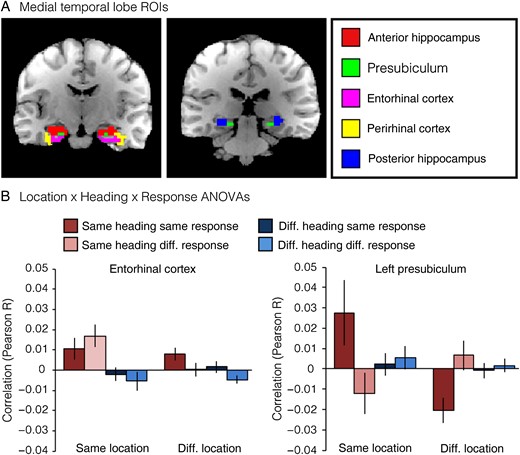
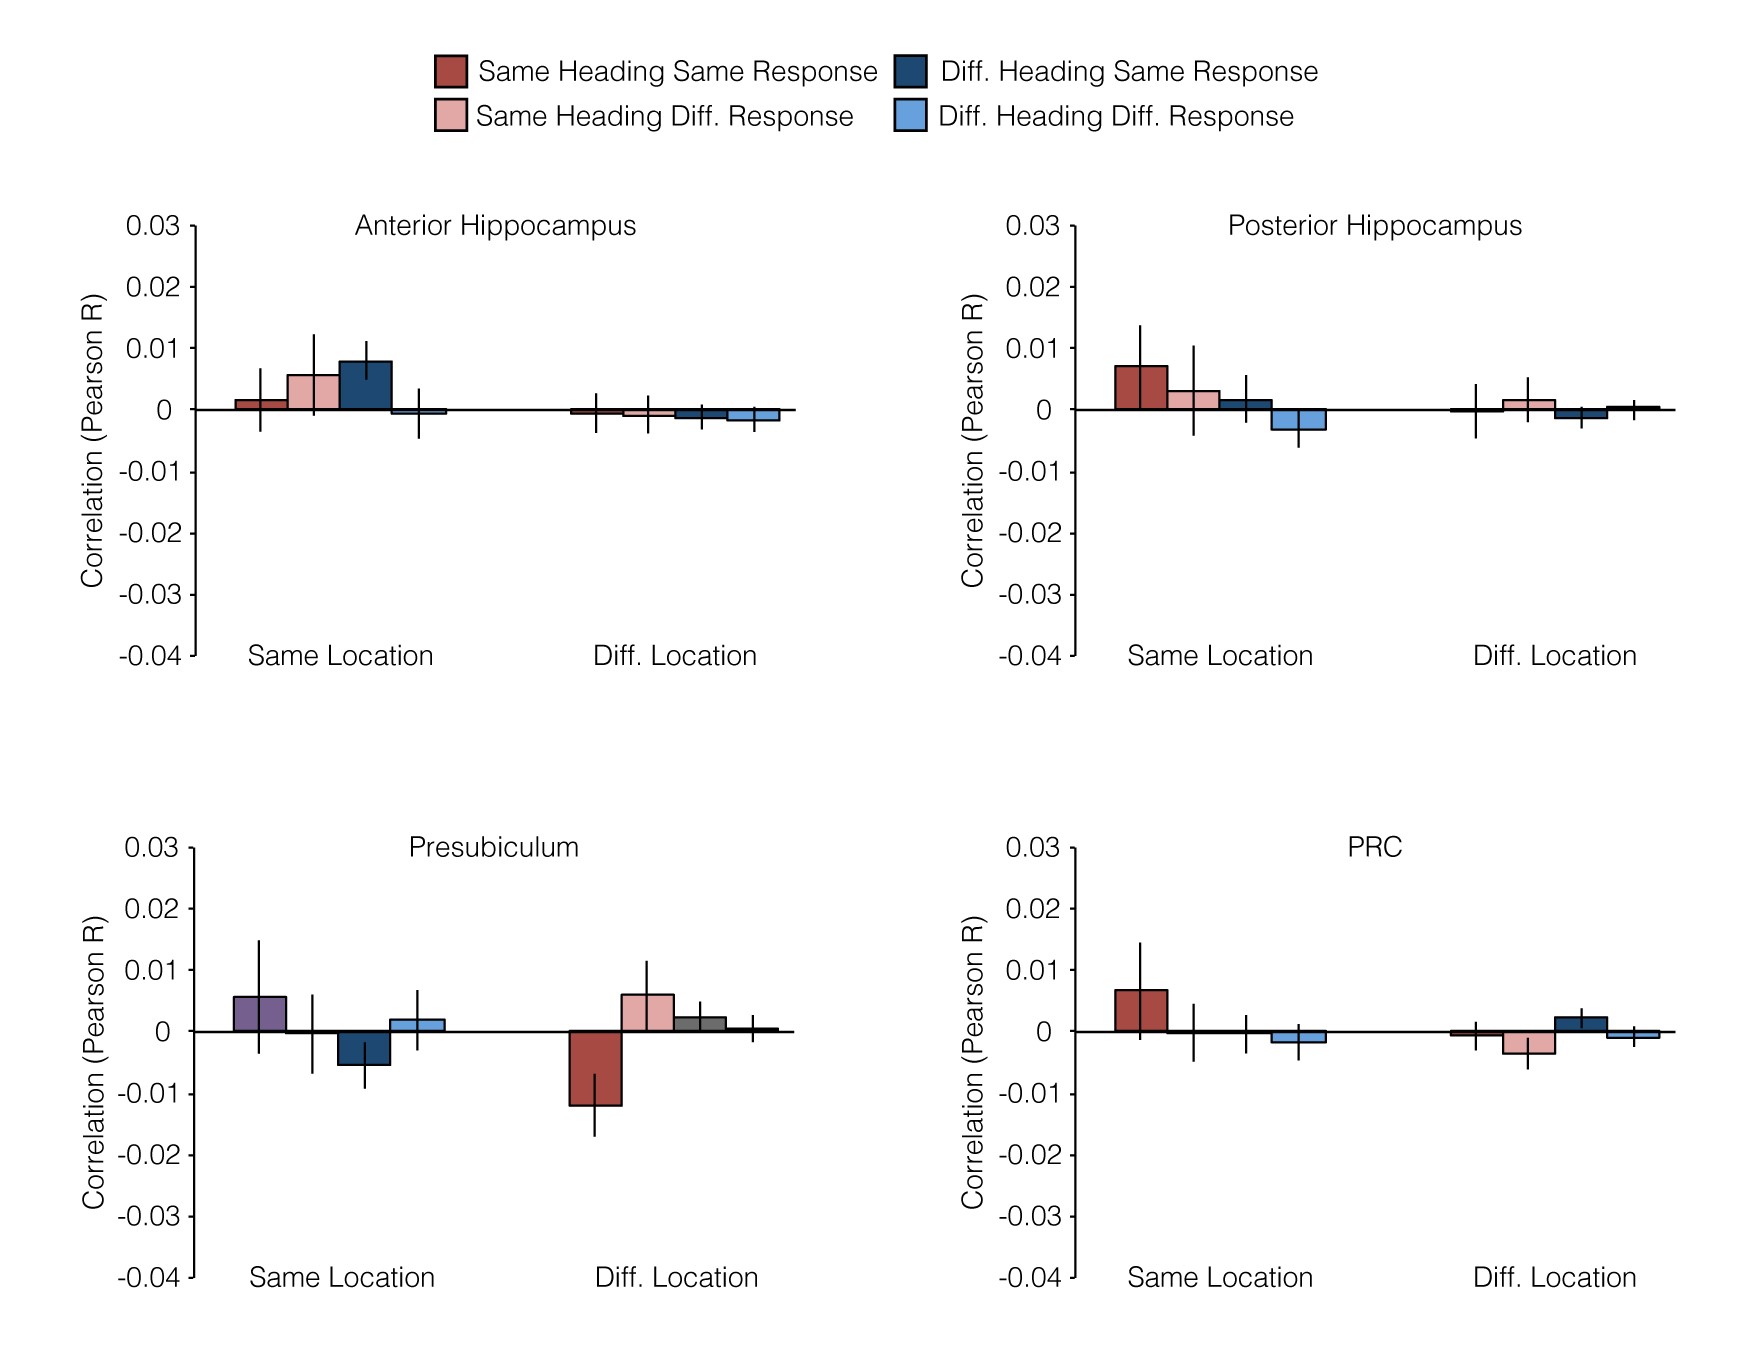
We next consider pattern similarities within 5 anatomically defined regions within the medial temporal lobe (MTL): anterior and posterior hippocampus, presubiculum, entorhinal cortex (ERC), and perirhinal cortex (PRC). These regions were selected based on prior human (Ekstrom et al. 2003; Hassabis et al. 2009; Doeller et al. 2010; Jacobs et al. 2010, 2013; Miller et al. 2013; Vass and Epstein 2013; Howard et al. 2014; Chadwick et al. 2015) and animal (O'Keefe and Dostrovsky 1971; Taube et al. 1990; Georges-Francois et al. 1999; Robertson et al. 1999; Cacucci et al. 2004; Hafting et al. 2005; Boccara et al. 2010) studies of spatial memory, which have implicated these regions in coding of spatial quantities. We submitted pattern similarities from each of these regions to Location × Heading × Response ANOVAs and report effects using a threshold of P < 0.01, which is equivalent to P < 0.05 after Bonferroni correction for multiple comparison across the 5 regions (Fig. 4; see also Supplementary Fig. 2). At this conservative threshold, we observed only one significant main effect: pattern similarities in ERC were greater for JRDs that shared the same heading than for JRDs with different headings (F1,15 = 10.0, P = 0.0065). ERC also exhibited a trend for the interaction between location and heading (F1,15 = 5.1, P = 0.04) such that heading coding was stronger for JRDs from the same location than for JRDs from different locations. There were no main effects of either location or heading in presubiculum, even at more lenient thresholds (all Ps > 0.73), in contrast to our previous work (Vass and Epstein 2013). Because we previously observed hemispheric differences in presubiculum, whereby the left presubiculum coded location while the right presubiculum coded heading (Vass and Epstein 2013), we also performed the Location × Heading × Response ANOVAs separately for each hemisphere. We observed a significant interaction between location and response in left presubiculum (F1,15 = 9.9, P = 0.0067): JRDs from the same location showed greater pattern similarity when they elicited the same response, but JRDs from different locations showed less pattern similarity when they elicited the same response. There were no significant effects in right presubiculum.
Multivoxel pattern correlations in medial temporal lobe ROIs. (A) Example ROIs from one subject. (B) Multivoxel pattern correlations for medial temporal lobe ROIs. Entorhinal cortex exhibited a significant main effect of Heading and a marginal interaction effect between Location and Heading. Left presubiculum exhibited a significant interaction between Location and Response. Effects in other MTL regions were not significant (see Supplementary Fig. 2).
Because ERC exhibited a significant effect of heading in the 2 × 2 × 2 ANOVA, we analyzed this effect further by performing a 2 × 2 Heading × Response ANOVA in which we restricted comparisons to trials from different locations, as we did above for PPA and RSC. Under these more restricted conditions, we no longer observed a main effect of heading in ERC (F1,15 = 2.9, P = 0.11); there was a marginal main effect of response (F1,15 = 4.1, P = 0.06) and no interaction (F1,15 = 0.1, P = 0.72). The absence of a significant heading effect in this region using this more restricted analysis is consistent with our previous observation of a Location × Heading interaction in this region. Specifically, inspection of the pattern of results (Fig. 4) suggests that Heading coding in ERC may be local: it is found within a location but is not significant across locations.
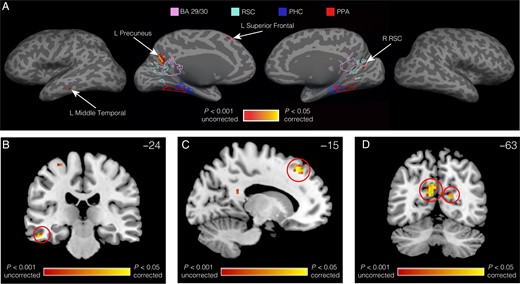
Finally, to test whether regions outside of our predefined ROIs showed multivoxel coding of starting location or allocentric heading, we performed searchlight analyses (Kriegeskorte et al. 2006), in which we calculated the main effect of location and the main effect of allocentric heading from the restricted 2 × 2 location and heading ANOVAs in spherical regions centered on every voxel of the brain in turn (Fig. 5). We used the restricted two-way ANOVAs rather than the three-way ANOVA because—as explained above—this analysis provided the most straightforward way to identify pure heading and pure location codes. The searchlight analysis for the main effect of heading revealed a cluster in left precuneus (−9, −63, 21) that was distinct from RSC (only one subject's RSC overlapped with the cluster and only by 2 voxels) and located more medial (mean difference in center of gravity: 7.2 ± 0.4 mm), posterior (4.8 ± 1.0 mm), and dorsal (20.4 ± 0.7 mm) than RSC. Heading codes were also observed in right RSC at lower thresholds. There were additional smaller clusters in left superior frontal gyrus (−15, 33, 48) and left middle temporal gyrus (−51, −24, −21). No region showed a main effect of location at levels exceeding the permutation-corrected threshold (Nichols and Holmes 2002).
Searchlight analysis for heading. (A) Regions in medial parietal, left temporal, and left frontal cortex coded for headings in a manner that abstracted across locations and tasks. Results are plotted on the inflated surface of one subject's brain, where dark gray represents sulci and light gray represents gyri. Yellow voxels are significant at P < 0.05 after correction for multiple comparisons across the entire brain. Outlines display the boundaries of the display subject's PPA, PHC, RSC, and BA 29/30. (B) Heading effect in left middle temporal gyrus, displayed on a coronal slice (Y = −24) of the MNI standard brain. (C) Heading effect in left superior frontal gyrus, displayed on a sagittal slice (X = −15) of the MNI standard brain. (D) Heading effects in left precuneus and right RSC, displayed on a coronal slice (Y = −63) of the MNI standard brain.
To summarize, we observed that specific regions in medial temporal and medial parietal cortex coded for spatial quantities in a way that generalized across the nature of the stimulus and the cognitive processes required to access long-term spatial memory. In particular, we observed abstract coding of location in PPA and abstract coding of heading in RSC and to a lesser extent ERC. We now present analyses that aim to characterize the location and heading codes that we observed in these regions.
Characterization of Location and Heading Codes
To better understand the location codes in PPA and the heading codes in RSC, ERC, and the 3 regions identified by the heading searchlight, we examined the strength of coding for each location (i.e., 1, 2, 3, 4) and each heading direction (North, East, South, West) separately. To do this, we quantified the average similarity for each heading direction pair and each location pair and plotted them in matrix form (Figs 6 and 7). For each heading direction and location, we compared the appropriate on-diagonal cell of the 4 × 4 matrix (e.g., N–N) with the average of the corresponding off-diagonal cells (e.g., average of N–E, N–S, N–W, E–N, S–N, W–N). The resulting correlations were then submitted to 4 × 2 repeated-measures ANOVAs with Specific Location (1, 2, 3, 4) and Location Similarity (Within-Location, Between-Location) as factors in the first analysis and Specific Direction (N, E, S, W) and Direction Similarity (Within-Direction, Between-Direction) as factors in the second analysis. Additionally, we performed the same type of analyses on a restricted set of comparisons to characterize pure location and heading codes. That is, when calculating the 16 (4 × 4) cells of the heading matrix in this case, we excluded similarities between JRD problems that had the same starting location, and likewise when calculating the 16 (4 × 4) cells of the location matrix, we excluded similarities between JRD problems that had the same heading. Both versions yielded qualitatively similar results.
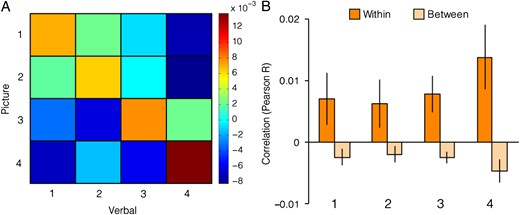
Location coding in PPA. Left, mean cross-task Pearson correlation for all pairs of locations. Rows correspond to locations in the picture runs and columns correspond to locations in the verbal runs. Right, similarities broken down by location. Within-location correlations correspond to elements on the diagonal of the correlation matrix and between-location correlations correspond to the average of rows and columns of off-diagonal elements in the correlation matrix. Location coding (within-location vs. between-location) did not significantly differ across locations.
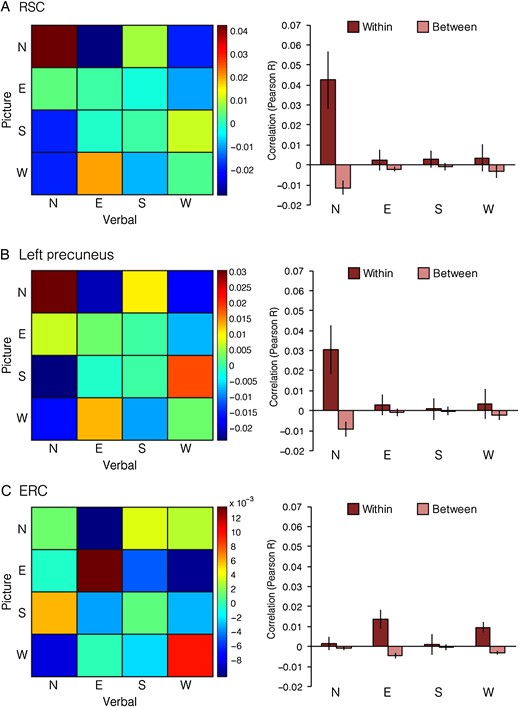
Direction coding in RSC, ERC, and left precuneus. Left, mean cross-task Pearson correlation for all pairs of directions. Rows correspond to headings in the picture runs and columns correspond to headings in the verbal runs. Right, similarities broken down by heading. Within-direction correlations correspond to elements on the diagonal of the correlation matrix, and between-direction correlations correspond to the average of rows and columns of off-diagonal elements in the correlation matrix. RSC and Left Precuneus exhibited preferential coding of North. ERC exhibited a trend toward preferential coding of East and West.
We were especially interested in the interaction terms of the ANOVAs, as this indicates whether the strength of location or heading coding differed across locations or heading directions (Figs 6 and 7). In the PPA, where we previously found coding of location, there was no variation of this effect across locations (interaction effect: F3,45 = 0.9, P = 0.45) indicating that this region exhibited equivalent coding of all locations. We observed similar results when trials facing the same heading were excluded from the analysis.
In RSC, on the other hand, where we previously observed coding of heading, we found that these codes varied in strength across the 4 heading directions (interaction effect: F3,45 = 4.5, P = 0.008). To characterize this interaction effect, we calculated the strength of coding for each direction by computing 4 direction-specific indices. These were calculated by taking the mean correlation between JRDs facing a direction (e.g., N–N) and subtracting the mean correlation between JRDs facing that direction and the 3 other directions (e.g., the average of N–E, N–S, N–W, E–N, S–N, W–N). This direction index was higher for JRDs facing North than for JRDs facing East (t15 = 2.2, P = 0.04), South (t15 = 2.3, P = 0.04), or West (t15 = 3.8, P = 0.002; all other pairwise comparisons Ps > 0.83), indicating that North was more strongly coded than the other directions. We observed similar results when trials from the same location were excluded from the analysis. We observed a similar pattern of results for the region in left precuneus identified by the heading searchlight. Like RSC, the strength of heading coding in left precuneus differed across directions (interaction effect: F3,45 = 2.8, P < 0.05), with N showing the strongest heading effect. However, direct comparisons between direction indices were only marginal (N vs. E: t15 = 2.1, P = 0.056; N vs. S: t15 = 2.1, P = 0.054; N vs. W: t15 = 1.9, P = 0.08; all other pair-wise comparisons Ps > 0.71).
In ERC, we also observed a trend for heading coding to vary with direction, although the effect fell just short of significance (F3,45 = 2.8, P = 0.054). When we examined the magnitude of heading coding for each direction individually by comparing Within-Direction pattern similarity with the mean Between-Direction pattern similarity, we observed significant coding of East (t15 = 3.3, P = 0.005) and West (t15 = 3.8, P = 0.002), but not North (t15 = 1.1, P = 0.29) or South (t15 = 0.4, P = 0.85). Some of the pairwise comparisons between direction indices were significant or nearly so (East vs. North: t15 = 2.0, P = 0.06; East vs. South: t15 = 2.6, P = 0.02; West vs. North: t15 = 1.5, P = 0.14; West vs. South: t15 = 1.9, P = 0.08). We observed a similar pattern of results, though weaker in magnitude, when we excluded trials from the same location (recall however that we did not observe significant heading coding in ERC under these restrictions). In the remaining 2 regions defined by the searchlight analysis, we did not find evidence of a difference in the magnitude of heading coding across directions (left temporal: F3,45 = 0.4, P = 0.78; left frontal: F3,45 = 1.6, P = 0.21).
These results suggest the possibility of an intriguing difference between heading codes in RSC and heading codes in ERC. Whereas RSC preferentially represented North-facing headings on the Penn campus, ERC seemed to preferentially represent East- and West-facing headings that were aligned with the principal axis of the environment. To confirm that heading representations significantly differed between RSC and ERC, we compared the pair of ROIs by analyzing the unrestricted dataset with an ROI × Specific Direction × Direction Similarity repeated-measures ANOVA. The overall strength of heading coding did not differ between RSC and ERC (ROI × Direction Similarity interaction effect: F1,15 = 2.0, P = 0.17). However, tuning by direction in ERC was significantly different from that observed in RSC (three-way interaction effect: F3,45 = 6.1, P = 0.001).
In sum, these analyses characterized the heading and location codes observed in the original ANOVAs. RSC and ERC coded for heading, but in different ways: RSC only represented North whereas ERC preferentially coded East and West. Of the 3 additional regions exhibiting heading coding in the searchlight analysis, left precuneus exhibited a pattern similar to RSC, insofar as it primarily encoded North, whereas the strength of coding in the left temporal and left frontal ROIs did not differ between directions. PPA represented all locations equally well.
Discussion
In this experiment, we tested whether orienting oneself to the visible environment activates the same neural representations as orienting oneself in the imagination. To address this issue, we scanned subjects with fMRI while they solved JRD problems, which require retrieval of spatial relationships from memory. We cued these problems using either photographs or written words. Multivoxel pattern analyses revealed several regions of the brain that represented spatial information in a way that abstracted across the picture and verbal versions of the JRD task. Specifically, multivoxel patterns in RSC and ERC contained information about the heading assumed on each trial, whereas multivoxel patterns in PPA contained information about the starting location. These results demonstrate the existence of spatial representations in RSC, ERC, and PPA that are common to visually guided navigation and spatial imagery.
Previous studies of spatial coding have measured patterns during either scene perception (Vass and Epstein 2013; Chadwick et al. 2015) or during spatial imagery (Marchette et al. 2014), but no previous study has tested whether the spatial codes elicited when perceiving a space are consistent with those elicited when imagining the same space. By demonstrating this commonality in the spatial domain, our results provide an important extension to the previous work that has shown consistency in multivoxel patterns across visual perception and visual imagery (Stokes et al. 2009; Cichy et al. 2012). Unlike visual properties, the cross-modality spatial codes we measure cannot be directly ascertained from the stimulus image itself. Moreover, these codes exhibit abstraction across multiple stimuli: codes for the perception of a particular view apply not only to imagery of that view but also to imagery of other views that share location or heading. Thus, our results are consistent with the previous work indicating that neural activity during memory retrieval and imagery reflects a recapitulation of the activity patterns instantiated during memory encoding and perception (Polyn et al. 2005; Gelbard-Sagiv et al. 2008) but move beyond it in important ways.
The observation that RSC and ERC represent heading is not surprising, as the previous work from neuroimaging, neuropsychology, and human intracranial recordings indicates that these regions code the direction that one is heading or facing. For example, RSC is strongly activated in fMRI studies when subjects are asked to retrieve heading information (Epstein et al. 2007) and recent work has shown that this region codes heading when subjects orient relative to a visual scene (Baumann and Mattingley 2010; Vass and Epstein 2013) or reinstantiate a spatial scene from memory (Marchette et al. 2014). Patients with damage to this region exhibit “heading disorientation,” an inability to retrieve directional information from landmarks despite preserved knowledge of landmark identities (Aguirre and D'Esposito 1999). Similar findings have been reported for ERC, where one recent fMRI study showed that multivoxel activity patterns contained information about heading within a small virtual environment (Chadwick et al. 2015) and another showed that activity levels during virtual navigation exhibited a directional sensitivity with six-fold symmetry, consistent with a population of direction-modulated grid cells (Doeller et al. 2010). Direct recordings of ERC neurons from human neurosurgical patients navigating a virtual environment have revealed cells that are sensitive to the direction the subject is facing and also cells that are sensitive to the direction traveled along a circular path (Jacobs et al. 2010). Although each of these experiments provides support for the basic observation of heading codes in these regions, no previous study has directly tested whether the same representations are elicited when orienting in response to visual inputs and orienting in the imagination.
Interestingly, and unexpectedly, we found different kinds of heading representations in RSC and ERC. In RSC, only North was represented in a consistent manner across the 2 versions of the JRD task. In contrast, ERC primarily represented East and West. The observation of North-coding in RSC is intriguing because it dovetails with the previous behavioral work indicating that subjects establish a single reference direction when retrieving information from spatial memory (for a review, see McNamara 2003). Although these reference direction effects have been most commonly studied using small tabletop displays of objects, they have also been reported for large environmental spaces for which subjects have long-term navigation experience such as a college campus (Marchette et al. 2011; Frankenstein et al. 2012). Indeed, in the current study, we observed behavioral evidence for a privileged representation of North insofar as subjects' reaction times were significantly faster for JRDs headed North. Thus, our results suggest that even highly familiar environments are represented in memory according to a particular reference direction; moreover, they suggest that RSC acts as the neural locus of this reference direction code, consistent with earlier results from our lab (Marchette et al. 2014). The reason for preferential coding of East and West in ERC, on the other hand, is less clear. We can offer 2 possible explanations, although both remain speculative. First, these representations may have been mediated by the previously mentioned “path cells,” which code for the direction of travel along a path (Jacobs et al. 2010). Three out of 4 locations in the current experiment were on the same path, Locust Walk, which runs East–West along the length of campus. A second possibility is that these representations were mediated by a population of HD cells for which East and West are overrepresented, though this seems unlikely given that recordings in the rodent brain indicate that all directions are represented equally within a population of HD cells (Taube 2007).
We also observed a possible difference in the scale of the heading representations in RSC and ERC: heading codes generalized across locations in RSC but were tied to the specific locations in ERC. The location-specific nature of ERC heading codes could explain why heading representations have been inconsistently observed in this region in human neuroimaging studies. Previous studies using small environments for which the same distal cues are available at all locations have observed such effects (Doeller et al. 2010; Chadwick et al. 2015), but previous studies using large environments for which heading codes would not be consistent across locations have not (Baumann and Mattingley 2010; Vass and Epstein 2013). For example, in a previous study, we observed heading codes that generalized across campus locations in RSC and a locus of the presubiculum posterior to ERC, but not in ERC itself (Vass and Epstein 2013).
The differences between heading representations in ERC and RSC suggest that these regions may play distinct roles in reorientation. One possibility is that RSC may establish the reference direction that is used to anchor the heading codes (which is North in the current environment), whereas ERC tracks deviations (i.e., rotations) from that reference direction. This idea could be tested by measuring activity in ERC and RSC during active navigation and determining whether there is a reliable relationship between the reference direction represented in RSC and the grid orientation observed in ERC (see Doeller et al. 2010). In any case, future work is needed to more carefully delineate the precise role of ERC and RSC in spatial reorientation.
Our second main finding was that activity patterns in PPA were consistent across JRD problems that used the same starting location. This finding was surprising to us because the previous work indicates that PPA primarily represents scenes (Epstein 2005, 2008) and does so in a viewpoint-specific manner (Epstein et al. 2003; Park and Chun 2009; Howard et al. 2011). Indeed, in an earlier study using a similar paradigm, we found little similarity between PPA activity patterns for views taken from the same location but facing different directions (Vass and Epstein 2013). What accounts for this apparent discrepancy?
One possibility is that the “location” effects in the current study might in fact be driven by overlapping visual features. Inspection of the images suggests that views taken at the same location have a high degree of visual similarity. The previous work implicates the PPA in both perceiving scenes (Epstein and Kanwisher 1998; Epstein et al. 1999) and imagining scenes (Ghaem et al. 1997; O'Craven and Kanwisher 2000; Summerfield et al. 2010), so subjects might represent the same visual features in both the verbal and picture tasks. Indeed, previous studies examining representations in PPA have identified sensitivity to both low-level (Watson et al. 2014) and high-level visual features including spatial boundaries (Park et al. 2011), expansiveness (Kravitz et al. 2011), and co-occurrence statistics of objects (Stansbury et al. 2013).
A second possibility is that “location” effects were driven by overlap in the landmarks perceived or retrieved on each trial. In contrast with our previous study (Vass and Epstein 2013), in which locations were defined by street intersections, here each location was defined by a single landmark. Although this landmark was not visible in the picture trials, the fact that the picture task was always performed after the verbal task may have led to subjects bringing it to mind. Moreover, the fact we observed an additional amount of pattern similarity for trials that shared the same starting location and the same target (i.e., SL-SH-SR trials) provides additional support for this idea, as these trials had 2 overlapping landmarks rather than just one. Additionally, some of the location effects might have been driven by overlap in the landmarks used as heading cues, as landmarks named as heading cues in verbal trials were visible in the picture trials 10.2% of the time for JRD pairs with the same starting location but only 2.6% of the time for JRD pairs with different starting locations. Thus, the location effects observed in the PPA might be driven by overlapping landmarks rather than location coding per se. Consistent with this view, recent work from our lab indicates that PPA represents familiar landmarks using an abstract identity code that generalizes across specific perceptual instantiations of the same landmark (Marchette et al. 2015).
As a general point, comparison of the results of the current study to those observed previously suggests that there is some degree of flexibility in the representations supported by the PPA and RSC. For example, in the current study, RSC activation patterns were organized primarily by heading: JRD problems corresponding to North-facing headings elicited similar patterns, even if they had different starting locations, and there was no grouping of patterns according to location. In contrast, in the aforementioned previous study using similar stimuli (i.e., images from the Penn Campus), RSC activation patterns were grouped by location, and there was only weak consistency across different locations for patterns corresponding to the same heading (Vass and Epstein 2013). These results can be reconciled by positing that RSC exhibits heading codes that are specific to individual navigational contexts. Depending on the task, the scope of these contexts might be single intersections (as in the previous study) or an entire campus (as in the current study). With smaller contexts, one observes distinctions between locations; with larger contexts, one observes generalization of heading codes across locations. Similarly, in the current study, PPA activation patterns were organized by location, whereas in the previous study, PPA distinguished between individual views, but showed only weak commonality across different views obtained at the same location. Again, these results can be reconciled by assuming that the PPA represents either visual features or landmarks, which were more common across the various views at a location in the current experiment than in the former experiment. Thus, it may be too simplistic to say that these brain regions support pure representations of “location” or “heading”. Rather, RSC may represent headings in a manner that can either distinguish between locations or generalize between them, whereas PPA may represent landmarks and environmental features in a manner that distinguishes between some locations but not between others. Future work could test this idea by using virtual environments and explicitly controlling the features that define a location and the landmarks used to orient within different parts of the environment.
In summary, we have shown that specific regions of medial temporal and medial parietal cortex engage the same representations when reorienting in response to visual scenes and when reorienting in the imagination. Patterns in RSC and ERC represented allocentric headings whereas patterns in PPA exhibited similarity across trials from the same location, which may reflect coding of landmarks or visuospatial features across perception and imagery. These findings are consistent with theoretical models that have proposed that the same neural machinery used for navigation also underlies a host of different processes involving the imagination including self-projection (Buckner and Carroll 2007), constructive episodic memory (Schacter and Addis 2007), scene construction (Hassabis and Maguire 2007), and episodic simulation (Ranganath and Ritchey 2012). Our results take this idea a step further by providing the first direct evidence that the same representations are engaged across visually guided reorientation and spatial imagination.
Supplementary Material
Supplementary material can be found at: http://www.cercor.oxfordjournals.org/.
Funding
This work was supported by the National Institutes of Health (R01-EY016464 to R.A.E. and F31-NS074729 to L.K.V.) and the National Science Foundation (SBE-0541957).
References