


Abstract
The AthaMap database generates a map of potential transcription factor binding sites (TFBS) and small RNA target sites in the Arabidopsis thaliana genome. The database contains sites for 115 different transcription factors (TFs). TFBS were identified with positional weight matrices (PWMs) or with single binding sites. With the new web tool ‘Gene Identification’, it is possible to identify potential target genes for selected TFs. For these analyses, the user can define a region of interest of up to 6000 bp in all annotated genes. For TFBS determined with PWMs, the search can be restricted to high-quality TFBS. The results are displayed in tables that identify the gene, position of the TFBS and, if applicable, individual score of the TFBS. In addition, data files can be downloaded that harbour positional information of TFBS of all TFs in a region between −2000 and +2000 bp relative to the transcription or translation start site. Also, data content of AthaMap was increased and the database was updated to the TAIR8 genome release.
Database URL:http://www.athamap.de/gene_ident.php
Introduction
The bioinformatic identification of cis-regulatory sequences is important to investigate gene expression regulation by transcription factors (TFs) (1, 2). For this, several online databases can be used. Putative regulatory sequences can be identified by submitting a sequence to databases such as TRANSFAC, PlantCare and PLACE (3–5). The completion of genome sequencing projects permitted the identification of regulatory sequences for whole genomes. Towards these ends, the AthaMap database was developed. AthaMap is a database that generates a genome-wide map of predicted transcription factor binding sites (TFBS) for Arabidopsis thaliana (6, 7). Compared to similar databases for A. thaliana like AGRIS, Athena and ATTED-II (8–11), AthaMap covers the whole-genome sequence and includes predicted TFBS that were identified with positional weight matrices (PWMs). Tools for the use of AthaMap comprise: (i) a search function to determine which binding sites occur at defined genomic positions or in defined genes (6); (ii) a colocalization function to identify combinatorial binding sites (12); and (iii) a gene analysis function to determine which TFBS occur in a set of user-provided genes (13). Recently, the database was extended with target sites for small RNAs to identify post-transcriptionally regulated genes (14).
The databases available rely on the submission or selection of specific genes or sequences. They display regulatory sequences or TFBS within the submitted sequences but the identification of genomic positions of TFBS for selected TFs is not possible. However, such a tool is highly desirable to identify target genes of TFs. In the AthaMap database, this was so far only indirectly possible with the colocalization tool (12). This tool permits the selection of two TFs for which binding sites occurring in close vicinity with a maximum spacer of 50 bp between each other are determined. This tool is based on the idea that TFs often act synergistically or by forming heterodimers (12). Another tool, PatMatch, available at the TAIR homepage enables the identification of genomic positions of short sequence motifs in A. thaliana (15). This requires information about the cis-regulatory sequence to be identified and is not based on the selection of specific TFs. To facilitate target gene identification of TFs, the new AthaMap function ‘Gene Identification’ was developed. This permits the identification of all genes that harbour target sites for user-selected TFs in a defined region. This web tool will be valuable to identify genes potentially regulated by specific TFs.
The ‘Gene Identification’ Web Tool
The goal of the AthaMap ‘Gene Identification’ function is the identification of all binding sites of pre-selected TFs in all A. thaliana genes. The tool can be accessed by selecting ‘Gene Identification’ at http://www.athamap.de. Figure 1 shows a schematic overview of the new tool with parameters that the user can select (red), results obtained (yellow) and some further options for analysis of the obtained data (green). It is possible to select a specific TF from a list of all annotated TFs. To facilitate selection, one can first select the TF family. This restricts the number of selectable factors to these family members. The user can also define specific search parameters. The default upstream and downstream region of all genes to be searched is −500 and 50 bp, respectively. Positions are relative to either the transcription start site or the translation start site, depending on the annotation. The default region of −500 bp already covers the area in which most of the regulatory sequences are found within the upstream region of A. thaliana genes. A recent study on the distribution of sequences corresponding to known regulatory elements revealed a localized distribution pattern upstream of the transcription start site (16). For example, the G-box, CACGTG shows a peak position at −80 and a peak width of 273 bp. Hexamer sequences corresponding to regulatory sequences show peak positions between −62 and −138 and a peak width between 182 and 366 bp. Based on this study, a default region of −500 to +50 bp seems to cover the promoter region most likely harbouring the relevant TFBS for gene expression regulation. Nevertheless, these values can be changed, and a maximum window of 6000 bp, 2000 bp upstream and 4000 bp downstream can be selected around either start site. For TFs with binding sites determined with PWMs, the minimal threshold can be increased to detect only genes with highly conserved TFBS (12). Furthermore, it is possible to exclude genes regulated by small RNAs. This may be useful to exclude genes that are potentially post-transcriptionally regulated. The results can be displayed in two different sort modes. ‘Gene’ will list the results according to the genome identifier (AGI); ‘Distance’ will sort the results according to the distance of the TFBS to the start site of the gene. Results comprise a set of non-redundant genes (gene IDs) harbouring a potential TFBS of the selected TF including positional information and orientation of the TFBS relative to the putative target gene (Figure 1, yellow). Also genes putatively regulated by small RNAs are identified. Additional information that can be obtained with the data is indicated in green (Figure 1). For example, each result can be viewed in a sequence display window to analyse the genomic context of the identified TFBS. The gene set can also be submitted to the Gene Analysis function of AthaMap for detecting other TFs regulating these genes. Furthermore, the gene IDs can be used for analysis in microarray expression databases to determine whether these are coregulated. As an example for a result display, Figure 2 shows a partial screen shot with ABF1 and the default parameters. A total of 821 different genes (gene IDs) harbouring TFBS for ABF1 in the selected region were identified. If a gene harbours two TFBS within the selected region or if the TFBS is palindromic, the gene ID is shown twice. Palindromic sites can occur on both, the upper and lower strand (relative orientation, Figure 2). A non-redundant gene list can be displayed by selecting the underlined number of genes detected (Figure 2). The result table also shows the relative distance to the start site and the score of the particular binding site detected. Gene names and positions are linked to the respective AthaMap sequence display window to explore the genomic context of the binding site. For some TFs, the number of sites to be searched had to be restricted. This applies to 13 TFs with putative binding site numbers of more than 200 000. In these cases, the threshold score used is displayed in a ‘table of restriction scores’, which can be accessed on the web interface (Figure 2). For further data processing of results, binding sites detected around annotated genes can be downloaded as a file containing all sites detected for the selected TF between 2000 bp upstream and 2000 bp downstream of each gene (Figure 2, download). On special request, the complete unrestricted positional information of TFBS in the A. thaliana genome will be provided.
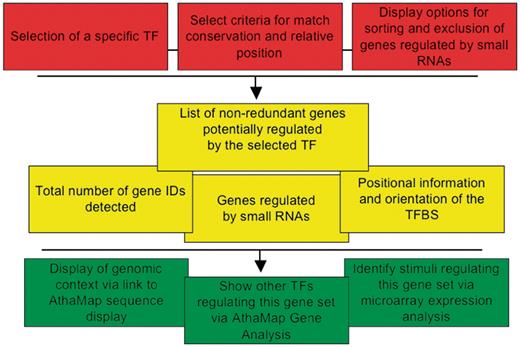
Schematic representation of the ‘Gene Identification’ function. The first level (red) shows user-selected parameters, the second level (yellow) shows results and the third level (green) shows further options for data analysis.
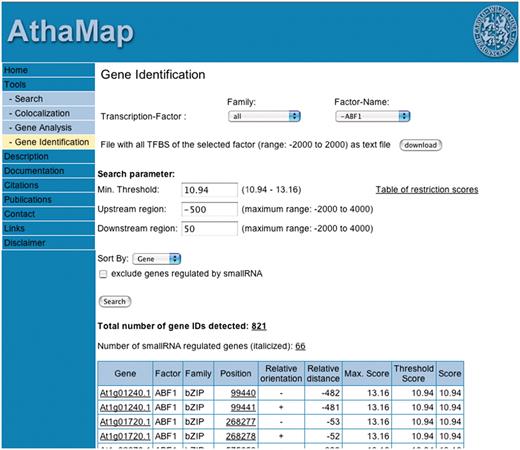
The web interface of the AthaMap ‘Gene Identification’ function. The result obtained with TF ABF1 is partially shown.
Athamap update
AthaMap had recently been updated to TAIR7 (14, 17). Genomic sequence and gene annotation data of AthaMap was now updated to the TAIR release 8. The annotation of the gene structure is based on five chromosomal XML flat files downloaded from the TAIR web site (release 8). These files were parsed using a Perl script and positional information for 5′ and 3′ UTRs, exons and introns were annotated to AthaMap. These regions are displayed in AthaMap with a colour code similar to the one used by TAIR. All TFBS and small RNA target sites have been screened again according to the previously described methods (6, 7). Putative TATA- and CAAT-boxes have been determined by restricting their identification to upstream regions as described earlier (12).
Recently published binding sites for the Arabidopsis TFs WRKY6, WRKY11, WRKY26, WRKY38, WRKY43, WRKY62 and EIN3 were annotated to AthaMap (18–20). These factors belong to the WRKY and AP2/EREBP TF families. Detection and annotation of binding sites was done as described earlier (7). WRKY6 binding sites had been annotated before and were now updated (7, 19, 21).
To give users of AthaMap examples of how the database can be employed for their research, the new menu item ‘Citations’ was included on the web site (Figure 2). Here, a link to all citing publications within the PubMed database was implemented. This information will be regularly updated.
Funding
This work was supported by the German Federal Ministry for Education and Research (BMBF Grant No. 0315459A). Results have been achieved within the framework of the Transnational (Germany, France, Spain) Cooperation within the PLANT-KBBE Initiative, with funding from Ministerio de Ciencia e Innovación, Agence Nationale de la Recherche (ANR) and BMBF. Funding for open access charge: Technical University at Braunschweig.
Conflict of interest. None declared.
Acknowledgement
We would like to thank Markus Klemme for TFBS screenings and annotation.
