


Abstract
The analysis of a lymphoblastoid cell line (5106), derived from a rare individual of normal intelligence with an unmethylated full mutation of the FMR1 gene, allowed us to reconstruct the chain of molecular events leading to the FMR1 inactivation and to fragile X syndrome. We found that lack of DNA methylation of the entire promoter region, including the expanded CGG repeat, correlates with methylation of lysine 4 residue on the N-tail of histone H3 (H3-K4), as in normal controls. Normal levels of FMR1 mRNA were detected by real-time fluorescent RT–PCR (0.8–1.4 times compared with a control sample), but mRNA translation was less efficient (−40%), as judged by polysome profiling, resulting in reduced levels of FMRP protein (∼30% of a normal control). These results underline once more that CGG repeat amplification per se does not prevent FMR1 transcription and FMRP production in the absence of DNA methylation. Surprisingly, we found by chromatin immunoprecipitation that cell line 5106 has deacetylated histones H3 and H4 as well as methylated lysine 9 on histone H3 (H3-K9), like fragile X cell lines, in both the promoter and exon 1. This indicates that these two epigenetic marks (i.e. histone deacetylation and H3-K9 methylation) can be established in the absence of DNA methylation and do not interfere with active gene transcription, contrary to expectation. Our results also suggest that the molecular pathways regulating DNA and H3-K4 methylation are independent from those regulating histone acetylation and H3-K9 methylation.
INTRODUCTION
Gene expression is regulated by several molecular complexes that activate or repress transcription, which locally remodel chromatin structure (1,2) and change the epigenetic marks on both DNA and associated histones. DNA methylation at CpG sites represents the prototype of epigenetic changes and has been extensively investigated. Methylation of DNA promoter sequences is usually associated with gene silencing (3) and is accompanied by a number of histone modifications in their N-tail (4,5). DNA methylation is also involved in the transcriptional repression of the abundant parasitic and structural repetitive elements scattered throughout the genome (6). On the other hand, actively transcribed genes in their promoters typically have demethylated DNA and acetylated lysines in the N-tail of histones H3 and H4 (5,6). Several enzymes are involved in the epigenetic regulation of gene transcription: at least three different DNA methyltransferases have been characterized in mammals (7) and the existence of an active DNA demethylase has been suggested (8). Histone acetylation is mediated by histone acetyltransferases, often associated with transcription factors (9), whereas deacetylation is performed by at least 10 different histone deacetylases (HDAC) associated with various transcriptional repressor complexes (10). Recently, attention has been focused on histone methylation at both lysine (11) and arginine (12) residues and histone methyltransferases (HMT) have been characterized in yeast and vertebrates (11). Histone H3-K9 methylation is a widespread marker for inactive heterochromatin (11,13), but it is impaired in the presence of histone H3-K4 methylation (14). Histone H3-K4 methylation is an early marker of transcriptional activity (15). It is established by the specific HMT Set9 (14,16), associated with coactivator complexes (17), and its presence is critical for transcription of most genes in yeast (18). Furthermore, H3-K4 methylation inhibits binding of the nucleosome remodelling and deacetylase repressor complex (14,16). The histone code is thought to serve as a local ‘memory’ (4) for chromatin by allowing or inhibiting the binding of yet more effector proteins like the heterochromatin protein 1 (HP1) that selectively recognizes methylated H3-K9 tails through its chromodomain (19).
The fragile X syndrome is the prototype of triplet repeat disorders, caused by the expansion of a CGG repeat in the 5′ UTR of the FMR1 gene (20), eventually causing promoter methylation and transcriptional silencing of the gene, when the expansion exceeds ∼200 CGG repeats. Loss of the RNA-binding protein FMRP results in translational dysregulation of several target mRNAs, affecting synaptic plasticity (21,22). Interestingly, in the premutation range of ∼60–200 repeats, transcription of the FMR1 gene is actually increased (23), in an apparent attempt to compensate the reduced translational efficiency of the mutant transcript (24,25), and mRNA accumulation may result in a distinct neurodegenerative condition in otherwise healthy carriers (26).
The mechanisms of CGG expansion as well as of DNA methylation, which follows expansion, are still unclear. We showed previously that if DNA methylation is removed by pharmacological treatment with 5-azadeoxycytidine (5-azadC), the fully mutated FMR1 gene is reactivated (27,28). Furthermore, we found that when HDAC inhibitors are combined with 5-azadC, the reactivation of the gene is synergistically increased (29). Coffee et al. (30) reported that histones H3 and H4 are acetylated on the normal FMR1 gene, but not on the inactive fragile X full mutation. They also reported that treatment with 5-azadC, while reactivating transcription, causes histones H3 and H4 to regain acetylation and H3-K4 to become methylated as in a normal cell line (31). However, they observed only a transient demethylation of H3-K9, which is thought to represent the heterochromatic mark of the silenced FMR1 gene (31).
We now report a detailed epigenetic analysis of a rare cell line (5106) established from a normal male carrying an unmethylated full mutation. We found that this cell line has deacetylated histones and methylated H3-K9 like fragile X cell lines, but high levels of H3-K4 methylation as normal controls, correlating with active transcription.
RESULTS
Description of cell line 5106
The 5106 lymphoblastoid cell line was established from the normal grandfather of a fragile X boy and reflects the blood DNA status of this individual (32). We repeatedly checked by Southern blotting the size of the CGG expansion after HindIII and EagI double digestion (Fig. 1A) and always found one single unmethylated band at 3.7 kb, corresponding to a 1.2 kb expansion or 400 CGG repeats. We also performed a Southern blot analysis after PstI or PstI and Fnu4HI double digestion (Fig. 1B), which showed a complete digestion by Fnu4HI of the expanded 2.6 kb band. This latter enzyme recognizes and cuts at the GCGG sequence, but is inhibited by cytosine methylation and indirectly proves that most (if not all) cytosines in the CGG tract itself are also demethylated in cell line 5106. On the contrary, CGG methylation in a fragile X cell line (Fig. 1B) results in persistence of some bands (∼2.3 kb long) after Fnu4HI digestion. Furthermore, we performed bisulphite sequencing on the promoter region, as previously described (28), in order to verify the methylation status of each individual CpG site in the FMR1 promoter and found that all sequenced clones were completely unmethylated as in a wild-type, opposite to a fully mutated cell line, in which all 52 CpG sites were methylated (Fig. 1C).
We then measured the FMR1 mRNA levels in the 5106, fragile X and normal cell lines by real-time RT–PCR levels, using the ABI Prism 7700 and specific TaqMan probes already described by Pietrobono et al. (28). No FMR1-specific mRNA was detected in the fragile X cell line, the threshold cycle being 40. Six different measurements were obtained from six independently extracted RNA samples and the corresponding cDNAs, showing that the cell line 5106 had ∼1.14 (range 0.8–1.4) more mRNA, when compared with a normal control (Fig. 2).
To evaluate FMRP levels, western blotting was performed four times, twice with the ECF kit (Amersham Pharmacia) and a specific polyclonal anti-FMRP antibody (rAM2) and twice with the ECL kit (Amersham Pharmacia) and the monoclonal antibody T1a/1C3. Quantification was obtained by direct luminescence scanning densitometry (for ECF) or by densitometry of autoradiographic films (for ECL). A representative ECF experiment (with rAM2 antibody) is shown in Figure 3A, whereas in Fig. 3B the FMRP signals were normalized to that of ribosomal protein S6, showing that the FMRP level of 5106 is 20–30% that of a normal control. The experiments with the ECL and T1a/1C3 monoclonal antibody also indicated that FMRP is ∼23% in cell line 5106 compared with the wild-type control (data not shown).
Finally, to verify if the reduced protein level was due to a reduced translational efficiency, we performed polysome/mRNPs distribution analysis. Figure 4 illustrates an example for cell line 5106 compared with a normal control. The percentage messenger on polysomes (PMP) is clearly similar in the control gene encoding S6 ribosomal protein (60% in the control versus 63% in cell line 5106), whereas it is significantly reduced for the FMR1 mRNA (83% in the control versus 51% in cell line 5106). This indicates a reduced translation efficiency of the expanded FMR1 mRNA, in line with the results of Primerano et al. (24) and Kenneson et al. (25).
ChIP analysis
The epigenetic marks on the N-terminal tails of histones H3 and H4 were detected by chromatin immunoprecipitation (ChIP) followed by fluorescent real-time PCR on the ABI Prism 7700 with TaqMan probes specific for three different regions of the FMR1 gene, i.e. promoter, exon 1 (just downstream of the CGG repeat) and the distant exon 16. Table 1 summarizes the results obtained for a total of six cell lines, i.e. two normal controls, the 5106 and three fragile X cell lines (S1, E3 and E6). For each of the three gene regions tested, the mean amount of immunoprecipitated (IP) DNA (± standard deviation) associated with histones with different modifications is indicated. Wild-type and fragile X cell lines clearly differ in their histone epigenotype: full mutation cell lines (S1, E3 and E6) have strikingly lower acetylated histones and methylated H3-K4 than normal controls, but higher H3-K9 methylation. This is true for the promoter and exon 1 region, while all histone modifications are reduced to a minimum in distant exon 16. Cell line 5106 has low histone acetylation levels like fragile X cell lines and high H3-K4 methylation levels like normal controls. Levels of histone H3-K9 methylation in cell line 5106 are intermediate between fragile X and control cell lines.
A graphical representation of the amount of IP-DNA associated with acetylated histones H3 and H4 in a control (wild-type 2), 5106 and a fragile X (S1) cell lines is depicted in Figure 5. Only the control cell line has significantly elevated levels of acetylated H3 in the promoter (mean value ∼80 ng), and in the exon 1 (mean value ∼800 ng) as illustrated in the Figure 5A. The same is true for acetylation of histone H4 (Fig. 5B), although the amount of IP-DNA is less than in the case of acetylated H3 (promoter ∼30 ng, exon 1 ∼90 ng). No significant acetylation was detected in exon 16 on both histones H3 and H4 tails.
Likewise, Figure 6A depicts the amount of IP-DNA associated with histone H3 with methylated lysine 9 (H3-K9) and shows an increase in the fragile X full mutation (S1) and 5106 cell lines compared with a normal control (wild-type 2), once again more evident in the promoter and exon 1 region. Figure 6B depicts the IP-DNA associated with histone H3 with methylated lysine 4 (H3-K4). Interestingly, cell line 5106 resembles transcriptionally inactive fragile X cell lines as to histone acetylation and H3-K9 methylation, whereas the pattern of H3-K4 methylation is similar to that of the transcriptionally active normal cell lines. This epigenetic mark typical of active chromatin is significantly abundant in the promoter and exon 1 of the FMR1 gene of 5106 and normal controls, but is virtually absent in fragile X cell lines as well as in exon 16 of all tested cell lines.
DISCUSSION
We investigated the epigenetic marks and the resulting transcriptional activity and translational efficiency in a rather unique cell line (5106) derived from one of two brothers with normal intelligence, harbouring an unmethylated full mutation of the FMR1 gene, as reported by Smeets et al. (32). Although these brothers were mosaic for a premutation in the blood leukocytes, the 5106 lymphoblastoid cell line contains only a single band of ∼400 CGG repeats with no evidence of mosaicism. We confirmed by bisulphite sequencing that the FMR1 promoter is completely unmethylated, like in a normal control, and we obtained indirect evidence that also the CGG expansion is not methylated. We tested the size of the unmethylated full mutation on several occasions by Southern blotting and found no evidence of instability, as previously suggested by Wohrle et al. (33). The finding of an unmethylated full mutation in two brothers (32) suggests that they may be homozygous for a recessive trait allowing the expanded FMR1 gene to escape DNA methylation. Even if the normal phenotype of both brothers did not suggest a global DNA methylation defect, we tested the methylation status of the Prader-Willi/Angelman imprinting centre on chromosome 15 and found no abnormalities (data not shown). A similar investigation had been carried out by Burman et al. (34) on the cell line of a normal individual with a hypomethylated full mutation and also showed no global DNA methylation defect. Furthermore, we can exclude a cis effect due to local sequence variation, because the grandson of the individual from whom cell line 5106 was derived, is a fragile X patient with a methylated full mutation.
The FMR1 mRNA levels in the normal range that we measured in cell line 5106, coupled to the reduced translational efficiency, confirm that the CGG expansion leads to a defective mRNA translation and to lower FMRP levels. Smeets et al. (32) already showed by immunocytochemistry that FMRP was diminished when compared with controls. Although we cannot exclude that mosaicism for a premutation (e.g. in the brain) may explain the normal IQ of these two brothers, it is also possible that 20–30% of FMRP in brains cells may be sufficient for normal intellectual functioning. In any case, we wish to stress once more that cell line 5106 harbours only an unmethylated full mutation, proving that the CGG expansion per se does not block transcription and only partly reduces translation efficiency in the absence of DNA methylation.
By ChIP assay coupled to quantitative PCR, we found high levels of H3-K4 methylation in the promoter and exon 1 region of the FMR1 gene in the 5106 and normal cell lines, whereas no H3-K4 methylation was detected in the fragile X cell lines. On the other hand, cell line 5106 showed histones H3 and H4 deacetylation as well as slightly increased H3-K9 methylation, similar to fragile X cell lines. Only the control cell lines displayed a clear acetylation mark on histones H3 and H4, higher in exon 1 compared with the promoter region. It is worth noting that we did not detect any significant epigenetic mark in exon 16 in any of the tested cell lines. This indicates that the promoter and exon 1 regions are the critical portions for epigenetic regulation of the FMR1 gene. Rougeulle et al. (35), who employed a ChIP-based approach similar to ours, also reported the presence of an increased level of H3-K4 methylation in promoters of active genes, particularly those on the active X chromosome, as well as autosomal imprinted genes.
It has been hypothesized that the CGG expansion, as other repetitive DNA sequences, may trigger histone H3-K9 methylation, which is recognized by the HP1 protein that, in turn, recruits the DNA methyltransferase (13). Methylated DNA is then bound by MECP2 or other MBD proteins, that recruit a complex containing HDAC1 and 2, causing histone deacetylation. New evidence suggests involvement of the RNA interference machinery in directing the local heterochromatin formation, which silences the FMR1 gene (13,36). CGG-binding proteins may also play a role in detecting the repeat expansion and triggering the inactivation. Heard et al. (37) showed that H3-K9 deacetylation and subsequent methylation, accompanied by loss of H3-K4 methylation, are early events during X-inactivation. The rare individuals with an unmethylated full mutation might have escaped a narrow time window during embryonic development in which the CGG expansion becomes methylated. However, cell line 5106 actively transcribes the unmethylated FMR1 gene with a clear H3-K4 mark, as if it was a normal control, in spite of histone deacetylation and H3-K9 methylation. This indicates that the latter epigenetic marks can occur in the absence of DNA methylation and in the presence of active transcription. Interestingly, Fuks et al. (38) showed that MECP2 can directly interact with the K9-specific HMT, potentially linking histone H3-K9 methylation to histone deacetylation in a DNA methylation-independent manner. As shown in Figure 7, our results suggest that the earliest events in the cascade leading to inactivation of an expanded FMR1 gene are histone deacetylation and H3-K9 methylation (37), which are then followed by DNA methylation and H3-K4 demethylation. We conclude that a block in this chain of events occurred before the establishment of DNA methylation in cell line 5106. Further experiments, focusing on regulatory proteins such as HP1 or CBP/P300, will be needed to establish the molecular cause of the uncoupling of the epigenetic marks in the rare carriers of unmethylated full mutations. These studies may eventually uncover potential targets for an effective transcriptional therapy of the fragile X syndrome.
MATERIALS AND METHODS
Cell lines and culture conditions
Lymphoblastoid cell lines were established by Epstein–Barr virus (EBV) transformation from peripheral blood lymphocytes. Experiments were performed on three fragile X cell lines with methylated full mutation (E3, S1 and E6, with CGG expansions of ∼250–400 repeats), a rare cell line (5106) established from a normal male with an unmethylated full mutation of ∼400 CGG repeats, first reported by Smeets et al. (32), and two control cell lines from normal males. Cells were grown in RPMI1640 medium with 10% fetal calf serum and penicillin/streptomycin at 37°C with 5% CO2. Cell medium was changed every 48 h.
Bisulphite sequencing
Bisulphite sequencing was performed as previously described (28). Briefly, a 5 M sodium bisulphite solution (pH 5.0) was prepared dissolving 9.5 g of bisulphite in 12 ml of distilled water, 3.5 ml NaOH 2 N and 2.5 ml hydrochinone 1 M. Water was added to the final volume of 20 ml. Then 5 µg of genomic DNA was diluted in 50 µl of water, denatured at 95°C for 10 min, then incubated 30 min at 37°C with 1.5 µl of NaOH 10 N (0.3 N final concentration). We then added 310 µl of sodium bisulphite 5 M, 2.5 µl of hydrochinone 0.1 M and 136 µl of water (final volume 500 µl). This mixture was incubated overnight at 55°C and DNA was then purified with Promega columns, denatured with NaOH 0.3 N for 15 min at 37°C and precipitated with ammonium acetate pH 7 (final concentrated 3 M) and four volumes of cold ethanol. The pellet was then resuspended in 50 µl water. The bisulphite-treated DNA of each sample (0.1 µl out of 50 µl) was then amplified in several independent PCR reactions of 25 µl to minimize PCR artifacts. PCR reactions were performed as follows: 30 cycles (30 s 95°C—30 s 63°C—30 s 72°C) with 10% DMSO, 200 µM dNTPs, 1 unit of Taq polymerase, 2.5 mM MgCl2, 1 pmol of primers 1F: 5′-GGAATTTTAGAGAGGTC/TGAATTGGG-3′ and 5aR: 5′-CACACCCCCTAACAAC-3′. A second PCR reaction was then performed with 1 µl of the first reaction as follows: 35 cycles (30 s 95°C—30 s 60°C—1 min 72°C) with 200 µM dNTPs, 1 unit of Taq polymerase, 3 mM MgCl2, 1 pmol of primers 2F: 5′-GTTATTGAGTGTATTTTTGTAGAAATGGG-3′ and 5aR. After the second round of nested PCR, the independent reactions of each sample were pooled, separated on an agarose gel and the bands recovered with the GIBCO-BRL Concert Rapid Gel extraction system (11456-019). The purified PCR products were then ligated with the TOPO TA cloning kit by Invitrogen (K460001) and used to transform bacterial cells. After plating and incubating, colonies were picked and minipreps prepared with GIBCO-BRL Concert rapid plasmid miniprep system (11453-016). PCR products were cleaned on spin columns and 3–5 out of 30 µl was used for the sequencing reaction. We used the Amersham-Pharmacia Thermosequenase Dye Terminator kit (US79765) with primers M13F and M13R of the TOPO TA vector. Every clone was sequenced in both directions with an ABI 310 machine. For each cell line (wild-type, full mutation and 5106) nine clones were sequenced.
Methylation-sensitive DNA restriction and Southern blot analysis
Approximately 8 µg of genomic DNA was digested with PstI alone or with PstI and Fnu4HI overnight at 37°C. The digested samples were separated on a 0.8% agarose gel with 1×TAE buffer, blotted on the Amersham Hybond N+ nylon membrane and hybridized with the radioactive XhoI–PstI fragment of the StB12.3 XX probe (corresponding to positions 13898–14462 of GenBank accession no. L29074). After overnight hybridization and subsequent washing, radioactive filters were exposed to films at −80°C with reinforcing screens before development.
Quantitative RT—PCR analysis
Total RNA from wild-type, full mutation and 5106 cell lines was extracted with the single-step acid phenol method, using Trizol (Invitrogen). RNA was reverse transcribed by MoMLV-reverse transcriptase (Gibco-BRL). For a quantitative estimate of the FMR1 mRNA levels, we adapted the technique described by Tassone et al. (23), using an ABI 7700 Sequence Detector with dual-labelled TaqMan probes. The FMR1 amplicon is a 89 bp product spanning the junction between exon 13 and 14 of the gene (positions 1432–1520 of GenBank accession no. NM_002024). The following primers and TaqMan probe were employed: forward 5′-GGAACAAAGGACAGCATCGC-3′, reverse 5′-CTCTCCAAACGCAACTGGTCT-3′; TaqMan probe 5′-(FAM)-AATGCCACTGTTCTTTTGGATTATCACCTGAA-(TAMRA)-3′. The relative amount of FMR1 mRNA was assessed by comparison with the human HPRT mRNA detected with the Pre-Developed TaqMan Assay Reagent ABI 4310890E (huHPRT endogenous control). Final reaction volume was 25 µl in the TaqMan Universal PCR Master Mix (ABI 4304437) with 900 nM of each primer and 100 nM of dual-labelled probe for FMR1. Cycle parameters were 2 min at 50°C and 10 min at 95°C, followed by 40 cycles of 15 s at 95°C for denaturation and 1 min at 60°C for annealing/extension. Relative FMR1 levels were calculated as follows: 2−[ΔCt(fragile X)−ΔCt(control)]=2−ΔΔCt, where ΔCt equals Ct(FMR1)−Ct(HPRT) as discussed by Tassone et al. (23).
Western blotting analysis
Proteins from normal, fragile X and 5106 lymphoblastoid cell lines were resuspended in Laemli buffer, boiled, separated by 8% polyacrylamide gel electrophoresis, and transferred to Immobilon-P membrane (Millipore), immunostained and visualized using the ECF Western Blotting Kit (Amersham Pharmacia Biosciences) according to the manufacturer. Primary antibodies were used at the following concentrations: 1 : 500 anti-FMRP-rabbit polyclonal antibody rAM2 (22), 1 : 1000 anti-ribosomal protein S6 polyclonal antibody (cell signaling). Two additional independent blots were also hybridized with 1 : 200 anti-FMRP-mouse monoclonal antibody T1a (39) and 1 : 10 000 anti-tubulin mouse antibody (Sigma-Aldrich) and visualized with the ECL Western Blotting Kit (Amersham Pharmacia Biosciences). Signal intensity was measured either by a phosphorimager (ECF) or by densitometry after film exposure (ECL).
Polysomes/mRNPs distribution analysis
WT and 5106 lymphoblastoid cell lines at a density of 106 cells/ml, were washed in PBS, and lysed with 500 µl of lysis buffer (100 mM NaCl, 10 mM MgCl2, 30 mM Tris–HCl, p. 7.5, 0.5% Triton X-100, 1 mM dithiothreitol, 30 U/ml RNase inhibitor Pharmacia). After 5 min of incubation on ice, the lysates were centrifuged for 8 min at 12 000 g at 4°C. The supernatants were sedimented in a 5–70% (w/v) sucrose gradients by centrifugation for 135 min at 37 000 r.p.m. in a Beckman SW41 rotor. Each gradient was collected in 10 fractions, monitoring the optical density at 254 nm. RNA was extracted from gradient fractions and analyzed by RT–PCR as already described (22). Briefly, RNA samples were extracted using the proteinase K method, DNase treated and reverse transcribed into cDNA using 100 U of MoMLV RTase (RNaseH−, Invitrogen). An equal amount (10 pg) of an internal control RNA was added to each fraction before RNA extraction. This RNA was obtained by in vitro transcription (Ambion, Austin, TX, USA) of the Xenopus ribosomal protein L22 sequence (accession no. X64207) and amplified with oligonucleotides annealing to the vector and the coding region. An aliquot (2 µl) of the RT reaction was amplified by PCR in a final volume of 50 µl, using 20 pmol of each primer, 0.5 U of Taq DNA Polymerase (Amersham Pharmacia Biotech), 100 µM of dTTP, dATP, dGTP, 10 µM of dCTP and 0.2 µCi of [α-[32P]dCTP (Amersham Pharmacia Biotech; 3000 Ci/mmol). The amount of template and the number of amplification cycles were preliminarily optimized for each PCR reaction, so as to avoid saturation: 20 cycles for the ribosomal protein S6 mRNA, 14 cycles for the β-actin mRNA and 25 cycles for the FMR1 mRNA. Primers 5′-GATGCTGCTTTTGATGATGTC-3′ and 5′-GCTTTCTTCTGTGTTGTTTGC-3′ were used for S6 and primers 5′-CCAACAAACCTGCCACAAAAG-3′ and 5′-CCTGATCCTCTCCATAAATAT-3′ were used for FMR1 (spanning exons 5-8). Products were run on a 5% polyacrilamide gel and quantified by a Phosphoimager. The PMP was calculated by normalizing the amount of mRNA present in each fraction to the L22 RNA, summing the first five fractions (corresponding to polysome-associated mRNA), dividing by the sum of all fractions and multiplying by 100.
ChIP assay
We employed the ChIP Assay Kit and antibodies from Upstate Biotechnology (NY, USA) and followed the manufacturer's protocol. Histone acetylation was studied by ChIP with antibodies directed against histone H4 acetylated at lysines 5, 8, 12 and 16 (17–229) and histone H3 acetylated at lysines 9 and 14 (17–245). Histone methylation analysis was performed using two different antibodies against histone H3 dimethylated at lysine K9 (07–441) or at lysine K4 (07–030). After ChIP and prior to quantitative fluorescent PCR analysis, DNA was extracted with a standard procedure (phenol/chloroform/isoamilic alcohol 25 : 24 : 1) and digested with XhoI in order to separate the CGG repeats that could interfere with the amplification efficiency.
Quantification of IP-DNA
The levels of acetylation of histones H3 and H4 and of methylation of lysines H3-K9 and H3-K4 of both FMR1 and HPRT were measured by fluorescent PCR with the ABI 7700 Sequence Detector (Perkin Elmer Applied Biosystems) with dual labelled TaqMan probes. Primers and probes employed for PCR analysis were designed to amplify three different portions of the FMR1 gene: the promoter region (positions 13376– 13448 of GenBank accession no. L29074), exon 1 near the CGG repeat tract (positions 13940–14012 of GenBank accession no. L29074) and exon 16 (positions 47305–47386 of GenBank accession no. L29074). The HPRT amplicon overlapped exon 6 (positions 34946–35022 of GenBank accession no. M26434). The sequences of primers and probes were as follows: 5′-AACTGGGATAACCGGATGCAT-3′ forward, 5′-GGCCAGAACGCCCATTTC-3′ reverse and 5′-(FAM)TGATTTCCCACGCCACTGAGTGCAC (TAMRA)-3′ probe for the promoter region; 5′-CGCTAGCAGGGCTGAAGAGA-3′ forward, 5′-CTTGTAGAAAGCGCCATTGGA-3′ reverse and 5′-(FAM)ATGGAGGAGCTGGTGGTGGAAGTGC (TAMRA)-3′ probe for exon 1; 5′-AATATTCTCATAGGAAACGACGATCA-3′ forward, 5′-CTGTTGTTCTTCCTTTAGCCTCTCTT-3′ reverse and 5′-(FAM) TCCCGAACAGATAATCGTCCACGTAATCC (TAMRA)-3′ probe for exon 16; 5′-TGACACTGGCAAAACAATGCA-3′ forward, 5′-CCTTGCGACCTTGACCATCT-3′ reverse and 5′-(VIC)TTTGCTTTCCTTGGTCAGGCAGTATAATCCA (TAMRA)-3′ probe for HPRT exon 6. Cycle parameters were 2 min at 50°C and 10 min at 95°C, followed by 40 cycles of 15 s at 95°C, for denaturation and 1 min at 60°C for annealing/extension.
A standard curve for the three FMR1 and for the single HPRT amplicon was constructed with five different DNA dilutions of known concentration (x axis=log[x]) and the corresponding Ct values (y-axis). The unknown amount of acetylated and methylated IP-DNA of FMR1 and HPRT (x-axis=log[x]) was calculated from Ct values, through the standard curve plot. Normalized FMR1 levels were estimated dividing the amount of FMR1 IP-DNA by the amount of HPRT. The acetylation and methylation levels of cell line 5106 have been compared with the levels of a fragile X and control male cell lines.
Statistical analysis
All variables were analyzed by means of descriptive statistics (mean, median, standard deviation and standard error of mean). We tested the null hypothesis that no real difference or correlation in acetylation and methylation levels existed between the three cell lines in the three regions of the FMR1 gene analyzed. The Pearson test was employed to define the possible correlation between the three cell lines. If Pearson test was near 1 and the significance was ≤0.05, a real correlation between the three cell lines existed and consequently the null hypothesis was rejected. In the present study, Pearson test was near 1 and the level of significance was <0.05. The collection and analysis of data were performed using the Statistical Package for Social Sciences Release 6.0 (SPSS; Chicago, IL, USA).
ACKNOWLEDGEMENTS
We gratefully acknowledge the financial support of Fondazione Telethon (GGP 030202), Conquer Fragile X Foundation and MIUR, Italy (COFIN 2002 n.2002062858_003 and FIRB 2001) to G.N. This research was also supported by the Human Frontier Science Program grant (RGP0052/2001-B) and Telethon-Italy (GGP 02357) to C.B. and by NIH (R01 HD38038) to B.A.O.
The authors wish it to be known that, in their opinion, the first two authors should be regarded as joint First Authors.
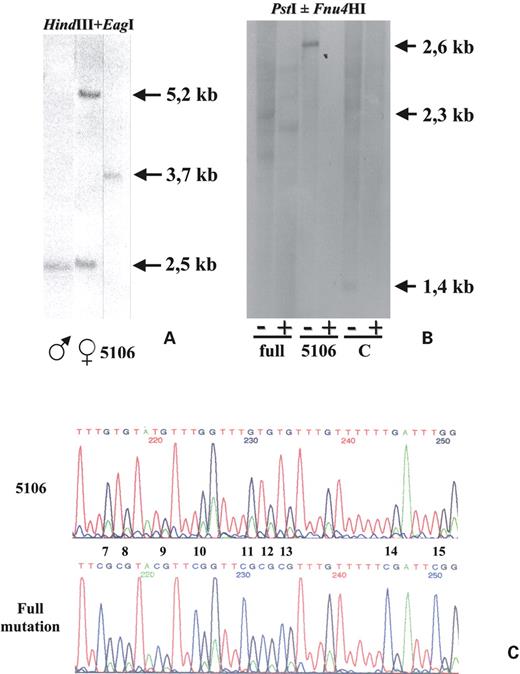
Figure 1. Southern blot analysis and bisulphite sequencing of the FMR1 promoter region. (A) Assessment of size and methylation by Southern blot analysis, using the Ox1.9 probe on a double digestion with restriction enzymes HindIII and EagI. A normal male (first lane) shows a 2.5 kb band, whereas a normal female (second lane) shows an additional band at 5.2 kb, corresponding to the methylated FMR1 gene on the inactive X chromosome. Cell line 5106 (third lane) has a single band at ∼3.7 kb, corresponding to an unmethylated full mutation with ∼400 CGG repeats. (B) Indirect assessment of the extent of methylation in the expanded CGG repeat by Southern blot analysis, using as probe the XhoI–PstI fragment corresponding to positions 13898–14462 of GenBank sequence L29074. Odd and even lanes correspond to DNA samples digested with PstI alone (−) or PstI and Fnu4HI (+), respectively. Lanes 1 and 2 correspond to a fragile X male (full), lanes 3 and 4 and lanes 5 and 6 correspond to the 5106 and a control (C) cell lines, respectively. (C) Partial sequence of the FMR1 promoter region of 5106 (top) and of a full mutation cell line (bottom), from CpG site 7 to 15. CpG sites are numbered as in (28). After bisulphite treatment the cytosines of the CpG sites were transformed into thymines in the unmethylated 5106, whereas in the methylated full mutation cell line they remained unmodified.
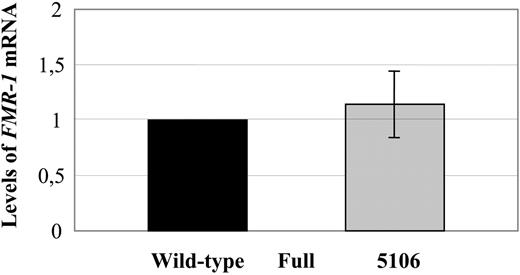
Figure 2. Quantitative estimate of FMR1 mRNA levels by real-time fluorescent RT–PCR in the methylated full mutation (mean±SD: 0.003±0.0004) and the 5106 (1.14±0.30) cell lines, normalized to the wild-type.
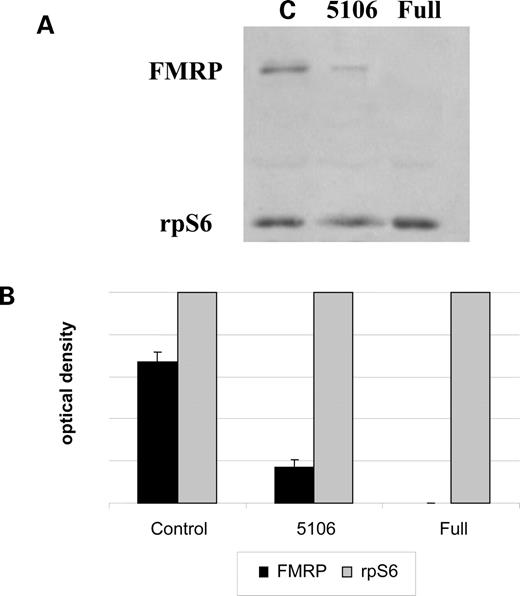
Figure 3. FMRP levels estimated by western blot analysis. (A) Protein extracts from a normal control (C), 5106 and a fragile X cell line (full) were loaded and probed with a specific polyclonal antibody against FMRP (rAM2) and one against the ribosomal protein S6 (rpS6). (B) Relative protein levels corresponding to FMRP were normalized to rpS6 in the control, 5106 and fragile X (full) cell lines. The amount of FMRP in cell line 5106 was estimated to be 20–30% compared with a control cell line (on two independent experiments).
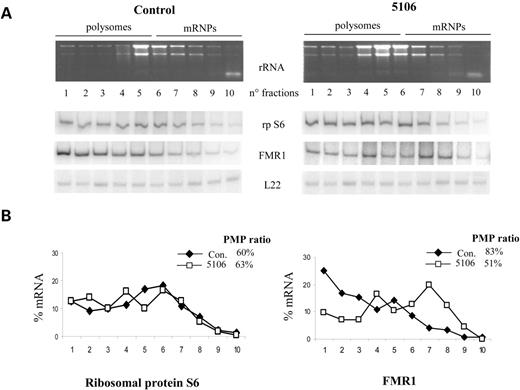
Figure 4.FMR1 mRNA translational efficiency in normal control and 5106 lymphoblastoid cell lines. (A) Polysomes/mRNP distribution analysis of the FMR1 mRNA. Cytoplasmic extract was fractionated by sucrose gradient centrifugation. Each gradient was collected in 10 fractions checking the rRNA profile in each fractions. Quantitative radioactive RT–PCR analysis of gradient fractions with primers specific for ribosomal protein S6, FMR1 and L22 RNAs was performed. The amount of template and the number of amplification cycles were preliminary optimized for each PCR reaction to avoid conditions of saturation. (B) PMP values reported as a graphic profile for control (Con.) or 5106 cytoplasmatic extracts; each point corresponds to the PMP value of each fraction for S6 and FMR1 mRNAs, normalized for the signal of L22 RNA. The PMP ratio of the first five fractions over the total 10 is indicated next.
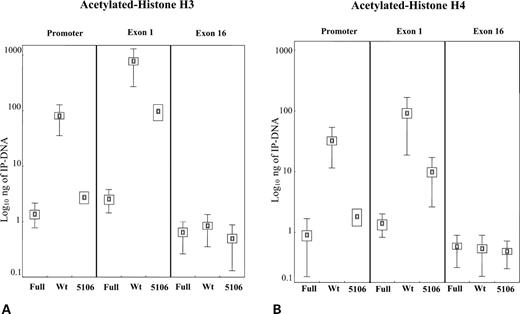
Figure 5. ChIP analysis of histone H3 (A) and histone H4 (B) acetylation in the S1 fragile X (Full), wild-type 2 (Wt) and 5106 cell lines in the promoter, exon 1 and exon 16 regions of the FMR1 gene. Box-plots indicate the mean (small box) of at least nine independent measurements and the corresponding standard error (larger box) and standard deviation (thin lines). Standard deviation is not reported in those instances where it approximates zero. Note that the amount of IP-DNA (nanograms) is indicated with a logarithmic scale.
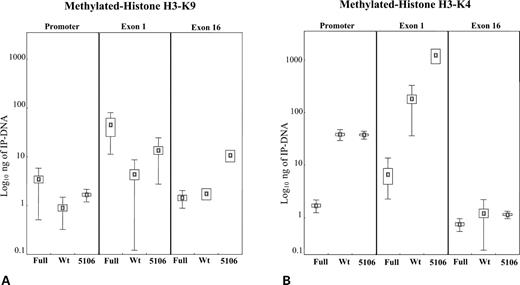
Figure 6. ChIP analysis of histone H3-K9 (A) and histone H3-K4 (B) methylation in the S1 fragile X (Full), wild-type 2 (Wt) and 5106 cell lines in the promoter, exon 1 and exon 16 regions of the FMR1 gene. Box-plots indicate the mean (small box) of at least nine independent measurements and the corresponding standard error (larger box) and standard deviation (thin lines). Standard deviation is not reported in those instances where it approximates zero. Note that the amount of IP-DNA (nanograms) is indicated with a logarithmic scale.
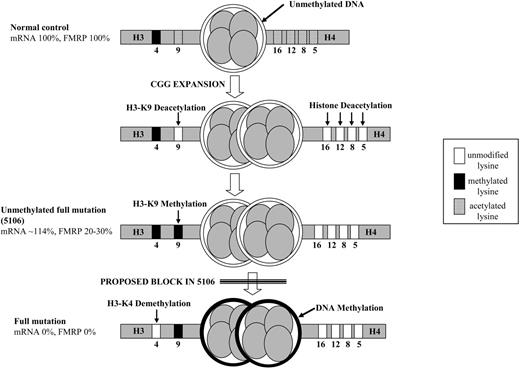
Figure 7. Diagram illustrating the epigenetic marks in the promoter and exon 1 region of a normal control, unmethylated full mutation (5106) and a fragile X cell line. After CGG expansion (schematically indicated by the double nucleosome), the early epigenetic modifications are histone tail deacetylation and H3-K9 methylation, followed by DNA methylation and H3-K4 demethylation. The proposed block explaining the epigenetic status of line 5106 is indicated by the double line. Lysine modifications are indicated with their positions on histone H3 (left) and histone H4 (right) tails. Levels of mRNA and FMRP are indicated next to each heading.
Amount of IP-DNA (nanograms±standard deviation) associated with the variously modified histones (acetylated H3, acetylated H4, methylated H3-K9 and methylated H3-K4) in tested regions of the FMR1 gene (promoter, exon 1 and exon 16)
| Wild-type 1 | Wild-type 2 | 5106 | Full S1 | Full E3 | Full E6 | |
|---|---|---|---|---|---|---|
| Promoter | ||||||
| H3 acetylation | 63.4325±45.2543 | 81.3453±45.9915 | 2.7460±2.8342 | 1.1248±0.2724 | 1.8076±1.967 | 0.799±0.3332 |
| H4 acetylation | 28.6721±11.0107 | 32.5079±21.0206 | 1.8435±2.4068 | 0.9593±0.8579 | 2.3797±2.0909 | 2.5649±1.0382 |
| H3-K9 methylation | 0.2873±0.0691 | 0.9035±0.5805 | 1.6661±0.4821 | 3.3416±2.8145 | 3.6954±1.3452 | 7.386±0.8224 |
| H3-K4 methylation | 58.0232±23.3469 | 38.2102±9.0318 | 37.5245±6.3887 | 1.6654±0.3492 | 3.6491±0.7072 | 3.5359±0.6467 |
| Exon 1 | ||||||
| H3 acetylation | 469.0791±111.5729 | 784.3908±513.5031 | 97.0532±131.0073 | 2.6046±0.6559 | 6.1264±4.5735 | 4.6042±5.1028 |
| H4 acetylation | 321.2154±116.0786 | 92.6896±73.9999 | 9.8795±7.2593 | 1.4389±0.6665 | 5.5323±2.9653 | 17.0421±17.9903 |
| H3-K9 methylation | 1.2726±0.9063 | 4.384±4.263 | 13.617±10.871 | 51.2349±39.6919 | 6.342±3.682 | 40.2684±7.6439 |
| H3-K4 methylation | 93.3792±78.9014 | 181.553±145.491 | 1217.175±1587.993 | 6.702±4.7938 | 5.404±2.803 | 8.237±1.0476 |
| Exon 16 | ||||||
| H3 acetylation | 0.8813±1.0225 | 0.8484±0.4952 | 0.5023±0.372 | 0.6638±0.5301 | 1.0122±0.7579 | 0.669±0.3534 |
| H4 acetylation | 0.8004±0.502 | 0.5425±0.354 | 0.4869±0.2339 | 0.6199±0.5351 | 0.5935±0.2876 | 1.134±0.7489 |
| H3-K9 methylation | 1.0954±0.2694 | 1.7661±1.9473 | 10.6794±12.3146 | 1.3301±0.5452 | 2.0311±1.1495 | 6.0929±1.1450 |
| H3-K4 methylation | 1.1881±0.7918 | 1.2261±0.9836 | 1.1463±0.1835 | 0.7199±0.3758 | 1.4433±0.3959 | 2.9528±0.1164 |
Tested cell lines (two wild-type, 5106 and three full mutation) are indicated on top of the respective columns.
References
Luger, K. (
Martens, J.A. and Winston, F. (
Chiurazzi, P. and Neri, G. (
Iizuka, M. and Smith, M.M. (
Liang, G., Chan, M.F., Tomigahara, Y., Tsai, Y.C., Gonzales, F.A., Li, E., Laird, P.W. and Jones, P.A. (
Kress, C., Thomassin, H. and Grange, T. (
Marmorstein, R. and Roth, S.Y. (
Yang, X.-J. and Seto, E. (
Lachner, M., O'Sullivan, R.J. and Jenuwein, T. (
Daujat, S., Bauer, U.M., Shah, V., Turner, B., Berger, S. and Kouzarides, T. (
Grewal, S.I.S. and Moazed, D. (
Nishioka, K., Chuikov, S., Sarma, K., Erdjument-Bromage, H., Allis, C.D., Tempst, P. and Reinberg, D. (
Ng, H.H., Robert, F., Toung, R.A. and Struhl, K. (
Zegerman, P., Canas, B., Pappin, D. and Kouzarides, T. (
Sedkov, Y., Cho, E., Petruk, S., Cherbas, L., Smith, S.T., Jones, R.S., Cherbas, P., Canaani, E., Jaynes, J.B. and Mazo, A. (
Boa, S., Coert, C. and Patterson, H.G. (
Fischle, W., Wang, Y., Jacobs, S.A., Kim, Y., Allis, C.D. and Khorasanizadeh, S. (
Chiurazzi, P., Neri, G. and Oostra, B.A. (
Zalfa, F. and Bagni, C. (
Zalfa, F., Giorgi, M., Primerano, B., Moro, A., Di Penta, A., Reis, S., Oostra, B.A. and Bagni, C. (
Tassone, F., Hagerman, R.J., Taylor, A.K., Gane, L.W., Godfrey, T.E. and Hagerman, P.J. (
Primerano, B., Tassone, F., Hagerman, R.J., Hagerman, P., Amaldi, F. and Bagni, C. (
Kenneson, A., Zhang, F., Hagedorn, C.H. and Warren, S.T. (
Greco, C.M., Hagerman, R.J., Tassone, F., Chudley, A.E., Del Bigio, M.R., Jaquemont, S., Leehey, M. and Hagerman, P.J. (
Chiurazzi, P., Pomponi, M.G., Willemsen, R., Oostra, B.A. and Neri, G. (
Pietrobono, R., Pomponi, M.G., Tabolacci, E., Oostra, B., Chiurazzi, P. and Neri, G. (
Chiurazzi, P., Pomponi, M.G., Pietrobono, R., Bakker, C.E., Neri, G. and Oostra, B.A. (
Coffee, B., Zhang, F., Warren, S. and Reines, D. (
Coffee, B., Zhang, F., Ceman, S., Warren, S. and Reines, D. (
Smeets, H.J., Smits, A.P., Verheij, C.E., Theelen, J.P., Willemsen, R., van de Burgt, I., Hoogeveen, A.T., Oosterwijk, J.C. and Oostra, B.A. (
Wohrle, D., Salat, U., Hameister, H., Vogel, W. and Steinbach, P. (
Burman, R.W., Yates, P.A., Green, L.D., Jacky, P.B., Turker, M.S. and Popovich, B.W. (
Rougeulle, C., Navarro, P. and Avner, P. (
Handa, V., Saha, T. and Usdin, K. (
Heard, E., Rougeulle, C., Arnaud, D., Avner, P., Alllis, C.D. and Spector, D.L. (
Fuks, F., Hurd, P.J., Wold, D., Nan, X., Bird, A.P. and Kouzarides, T. (
