


Abstract
To identify candidate genes that may be involved in motoneuron degeneration, we combined laser capture microdissection with microarray technology. Gene expression in motoneurons was analyzed during the progression of the disease in transgenic SOD1 G93A mice that develop motoneuron loss. Three major observations were made: first, there was only a small number of genes that were differentially expressed in motoneurons at a pre-symptomatic age (27 out of 34 000 transcripts). Secondly, there is an early specific up-regulation of the gene coding for the intermediate filament vimentin that is increased even further during disease progression. Using in situ hybridization and immunohistochemical analysis, we show that vimentin expression was not only elevated in motoneurons but that the protein formed inclusions in the motoneuron cytoplasm. Thirdly, a time-course analysis of the motoneurons at a symptomatic age (90 and 120 days) showed a modest de-regulation of only a few genes associated with cell death pathways; however, a massive up-regulation of genes involved in cell growth and/or maintenance was observed. This is the first description of the gene profile of SOD1 G93A motoneurons during disease progression and unexpectedly, no widespread induction of cell death-associated genes was detected in motoneurons of SOD1 G93A mice.
INTRODUCTION
One of the key features in the understanding of neurodegenerative diseases such as amyotrophic lateral sclerosis (ALS) is to elucidate mechanisms that underlie or predispose one particular type of neuron (i.e. a motoneuron) to selective death (for review, see ( 1 )). One means of analyzing this selective vulnerability consists in studying gene expression alterations in motoneurons during disease progression. Certain obstacles in analyzing tissue from the nervous system result from the wide variety of cell types. The cell heterogeneity of the brainstem and the spinal cord interferes with an analysis of the molecular changes occurring in a specific subpopulation of cells. However, the emerging technology of laser capture microdissection (LCM) allows procurement of specific cells from tissue sections that can be used to profile gene expression. Furthermore, the simultaneous comparison of the expression profiles of thousands of genes can be achieved using microarrays.
Recently, Sobue and coworkers ( 2 ) have applied these techniques to analyze the gene expression profile of human spinal motoneurons in sporadic ALS tissue. As expected, spinal motoneurons showed a unique gene expression profile compared with the whole ventral spinal cord. Down-regulated genes were related to cytoskeletal and axonal transport, whereas up-regulated genes were associated with both promoters and inhibitors of cell death pathways. Inflammation-related genes were not significantly up-regulated.
A great deal of gene expression analysis has been done in the entire spinal cord of the SOD1 G93A mouse model that expresses a human mutated SOD1 gene and represents a mouse model for familial ALS ( 3 , 4 ). These studies showed a wide variety of modifications in a large spectrum of genes. In contrast, no analysis has been done on pure motoneurons. Some controversy has been generated about whether the death phenomenon is indeed cell autonomous; when the SOD1 mutant gene is expressed either in the astrocytes or in the neurons, no motoneuron degeneration occurs ( 5 – 7 ). More recent studies by Clement et al . ( 8 ) showed that toxicity to motoneurons requires mutant damage not just within motoneurons but also to non-neuronal cells. Furthermore, normal non-neuronal cells can protect motoneurons that express the mutated SOD1 gene, suggesting that SOD1-mediated toxicity is non-cell autonomous.
In this study, we combined LCM and microarrays to identify modifications in gene expression in microdissected motoneurons issued from control and SOD1 G93A mice. At a pre-symptomatic age (60 days), there was a modest number of de-regulated genes; only 27 out of 34 000 transcripts showed a differential expression. Secondly, the intermediate filament, vimentin, was up-regulated at all stages of the disease not only in SOD1 G93A mice but also in two other mouse models that exhibit an inherited loss of motoneurons (progressive motor neuronopathy and wobbler). Finally, an analysis of SOD1 G93A motoneurons during disease progression (early symptomatic age, 90-day-old; end stage of disease, 120 days of age) showed a modest de-regulation of only three genes associated with cell death pathways (XIAP, caspase-1 and -3), but a massive up-regulation of genes involved in cell growth and/or maintenance. These results demonstrate that there is no widespread activation of genes involved in cell death pathways in SOD1 G93A motoneurons.
RESULTS
Motoneuron isolation by LCM
To identify early modifications in gene expression that may predispose or trigger motoneuron death, it was important to study the differential gene expression that may occur during early events of motoneuron degeneration. We microdissected motoneurons from the lumbar spinal cord (L2–L5) of SOD1 G93A mice where the onset of degeneration occurs. As SOD1 G93A mice show the first clinical evidence of disease at approximately 80 days of age, we undertook our initial analysis at a pre-symptomatic age (60 days of age). Gene expression profiles were subsequently analyzed during the progression of the disease in lumbar motoneurons at an early symptomatic age (90 days of age) and at end stage of the disease (120 days of age).
Motoneurons were selected according to (i) their localization in the ventral part of the spinal cord (Fig. 1 A and B), (ii) a diameter of at least 25 µm and (iii) an identifiable nucleus (Fig. 1 C). The remaining spinal cord tissue was intact after the laser-capture procedure (Fig. 1 B and D), proving the high selectivity of the microdissection. The morphology of the motoneurons was analyzed on cresyl violet stained sections. At 60 days of age, motoneurons appeared similar in control and mutant mice; they had not undergone visible neurodegeneration, were not atrophic and showed no characteristic features of apoptosis such as cell shrinkage and nuclear condensation (Fig. 1 E and F). At 120 days of age, motoneurons in mutant mice showed characteristics of degeneration and/or atrophy (Fig. 1 H). In control animals, at all ages, motoneurons with a diameter of at least 25 µm represented 52±3% of the total motoneurons on a given section. At a pre-symptomatic age in mutant animals, the diameter of motoneurons remained unchanged (50.7±0.8%) whereas at symptomatic ages, motoneurons with a diameter of at least 25 µm represented 43.3±1.3 and 38.6±7% at 90 and 120 days of age, respectively.
To confirm the high selectivity of microdissection, we examined by quantitative real-time PCR (Q-PCR) the expression levels of motoneuron markers in both the lumbar spinal cord and purified motoneurons. Choline acetyltransferase, a bona fide motoneuron marker, was expressed ∼25-fold more in motoneurons than in spinal cord. The expression of calcitonin-related polypeptide and neurofilament heavy subunit was increased ∼6- and 3-fold, respectively, in purified motoneurons. These enrichment ratios provided strong evidence for the specificity of the dissection.
Quality of initial and amplified RNAs
As the quality of the starting RNA is a prerequisite for further genomic analysis, we first demonstrated that LCM did not interfere with the quality of total RNA (Fig. 2 A). All samples were tested and only those with ‘high-quality’ RNA were used. As our starting material consists of 2000–2400 cells, it was only possible to extract a small amount of RNA (40 ng); thus it was necessary to do a double amplification procedure before microarray analysis. We controlled the quality of the RNA from the first (Fig. 2 B) and second amplifications (Fig. 2 C) and found that their amplification profiles were similar. The ‘smear’ was comprised all lengths of amplified RNA (from 60 to 4000–5000 bp) with a peak of ∼500 bp after both procedures (Fig. 2 B and C), indicating a high quality of amplification.
A small number of genes were differentially expressed in SOD1 G93A motoneurons at a pre-symptomatic age
We compared the molecular profile of 2000–2400 microdissected motoneurons from both mutant and control mice in order to identify genes that were differentially expressed. Motoneurons were pooled from one mouse per array, and three arrays were analyzed in both mutants and controls; 34 000 transcripts were examined on the gene chips. Among those transcripts, only 27 genes (0.08% of the screened genes) were differentially expressed in SOD1 G93A motoneurons (Table 1 ).
Seventeen transcripts, including the genes for matrix metalloproteinase 13, myristoylated alanine-rich protein kinase C substrate (coding for a major protein kinase C substrate in the brain), the nephroblastoma overexpressed gene [coding for an insulin-like growth factor binding protein (IGFBP)], growth-associated protein 43, vimentin (an intermediate filament type III) and gap junction channel protein alpha (connexin 43), were up-regulated (Table 1 ). Eleven transcripts, including tubulin alpha 3 gene, ionotropic glutamate receptor N -methyl- d -aspartic acid (NMDA) zeta 1 and carbonic anhydrase gene, were down-regulated. All these genes belong to various families of proteins such as intermediate filaments, protein catabolism, cell communication and regulators of cell growth.
Independent validation of candidate genes at a pre-symptomaticage using quantitative real-time PCR
To determine the reliability of our microarray analysis and to reduce the number of false-positive candidates, we selected eight differentially expressed genes and examined their expression levels by quantitative real-time PCR using amplified cRNA samples issued from separate batches of microdissected motoneurons. We confirmed the differential expression obtained by microarrays for five of these eight genes, indicating that three genes were false positives (Table 2 ).
As some of the de-regulated genes such as vimentin and connexin 43 are also known to be expressed in glia cells, we examined their expression level by real-time PCR in entire segments of the spinal cord (L2–L5). None of these genes showed a modified expression in the whole spinal cord, confirming the specificity of the differential expression within pure motoneurons. Indeed, vimentin was not de-regulated in the entire lumbar spinal cord (1.01±0.1) but showed a 1.79 (±0.02)-fold increase in microdissected motoneurons; similarly, connexin 43 did not show a de-regulation in the spinal cord (−1.22±0.22).
Genes differentially expressed in SOD1 G93A motoneurons during disease progression
Using microarrays, we analyzed the molecular profile of microdissected motoneurons from SOD1 G93A mice at an early post-symptomatic age (90 days) and at the end stage of the disease (120 days); 34 000 transcripts were examined on the gene chips. There was a de-regulation of approximately 150 genes at the onset of the disease (90 days) and more than 400 genes at 120 days of age. At both ages, the majority of the de-regulated genes were up-regulated (95 and 389, respectively) and only a minority down-regulated (53 at both ages).
We then compared the de-regulated genes at all stages of the disease (Fig. 3 ). Among all de-regulated genes, nine were up-regulated (including matrix metalloproteinase 13, vimentin, nephroblastoma overexpressed gene (NOV), serine proteinase inhibitor, growth-associated protein 43, aquaporin 4, myristoylated alanine-rich protein kinase C substrate and cathepsin Z) (Fig. 3 A, Table 1 ; Supplementary Material, Table S1) and three down-regulated (general receptor for phosphoinositides-1-associated scaffold protein, immunoglobulin heavy chain 6 and glutamate ionotropic receptor, NMDA1) (Fig. 3 B, Table 1 ; Supplementary Material, Table S1) at all stages of the disease. These values correspond to 52.9% (9/17) and 27% (3/11), respectively, of the differentially regulated genes identified by microarrays at a pre-symptomatic age. When we compared the differential expression at an early symptomatic age (90 days) and at the end stage of the disease (120 days), 57 genes were commonly up-regulated (Fig. 3 A; Supplementary Material, Table S1) and 11 down-regulated (Fig. 3 B; Supplementary Material, Table S1). Thus 69.5% (66/95) and 26.4% (14/53) of the genes identified, respectively, as up-regulated and down-regulated at the beginning of the symptoms (90 days) remain elevated at the end stage of the disease.
Genes de-regulated at an asymptomatic age are also de-regulated at symptomatic ages
During disease progression in SOD1 G93A motoneurons, we monitored the expression of those genes that were shown to be de-regulated at a pre-symptomatic age (60 days of age) (see Table 1 ). The differential gene expression was validated using real-time PCR (Table 3 ). Whereas vimentin was up-regulated by only 1.80-fold at a pre-symptomatic age, it increased even further at 90 days of age (8.96-fold by microarray; 4.27-fold by Q-PCR) and remained elevated at the end stage of the disease (4.03-fold by microarray; 3.22-fold by Q-PCR). Matrix metalloproteinase 13 was up-regulated ∼4-fold at 60 and 90 days of age and increased sharply by ∼14-fold (6-fold by microarrays) at 120 days of age. The NOV was up-regulated both at a pre-symptomatic age and at end-stage disease but surprisingly was not confirmed as de-regulated at 90 days of age by Q-PCR. The expression of connexin 43 was moderately up-regulated at 60 and 90 days of age whereas at 120 days, the expression level was similar to that of the controls. GAP-43 showed a transitory elevation at 90 days of age and decreased slightly at the end stage of the disease. For the down-regulated genes, ionotropic glutamate receptor NMDA zeta 1 expression showed a 1.2-fold reduction at 60 and 90 days of age (1.6-fold and 1.75, respectively, by microarray) and a 2.3-fold (2.08-fold by microarray) reduction at end stage of the disease.
Few cell-death-associated genes are de-regulated in motoneurons during disease progression
To determine in which biological processes the de-regulated genes may be involved, we queried the Gene Ontology database (GO; http://www.geneontology.org/ ). At 90 and 120 days of age, up-regulated genes related to cell growth and/or maintenance were significantly over-represented ( P <0.001) (Table 4 , Supplementary Material, Tables S2 and S3). Indeed, 54 of the 95 ( P =9.94×10 −6 ) genes up-regulated in SOD1 G93A motoneurons belonged to these biological processes at 90 days of age; this enrichment increased even further at 120 days of age with 211 of the 389 ( P =3.744×10 −15 ) up-regulated genes corresponding to this category. Furthermore, we identified de-regulated genes that belong to other biological processes at the end stage of the disease, e.g. 43 of the 389 up-regulated genes were involved in developmental processes.
Out of the 696 genes associated with cell death present on the mouse 430 2.0 chip, not a single gene was de-regulated in SOD1 G93A motoneurons during disease progression. This is surprising because there is growing evidence in both ALS patients and SOD1 G93A mice that molecular components of programmed cell death may be implicated in motoneuron degeneration (for a review, see ( 9 )). For this reason, we examined the expression level by real-time PCR of certain genes associated with cell death both in the entire spinal cord (L2–L5) and in microdissected motoneurons; Q-PCR is a more sensitive technique than microarray analysis. The genes examined were caspase-1, -3, -7 and -9, XIAP (X-linked inhibitor of apoptosis protein), Bax and TNFα (tumor necrosis factor α). At an early symptomatic age (90 days of age), two genes were de-regulated in the entire spinal cord; caspase-9 expression was down-regulated and TNFα level showed a 2-fold increase. In isolated motoneurons, only caspase-1 was up-regulated at this same age (Table 5 ).
At the end stage of the disease (120 days of age), all of the selected genes, except caspase-9 and XIAP, showed an increased expression in the entire spinal cord of SOD1 G93A mice and there was a pronounced increase in TNFα (5.5-fold). In opposition, in pure motoneurons only caspase-1 and -3 were modestly up-regulated and XIAP levels (not present on the Affymetrix array) decreased by 1.9-fold (Table 5 ). The expression levels of caspase-1, -3 and XIAP were ∼2-, 4- and 60-fold lower, respectively, in purified motoneurons when compared with lumbar spinal cord. Therefore, the true expression level of caspase-1, caspase-3 and XIAP was very low in isolated motoneurons when compared with the entire spinal cord. Taken together, these results suggest either that death signals arise mainly from other cell types and/or that motoneurons that we had selected are at an early stage of the cell death process.
A small increase in the level of glial fibrillary acidic protein (GFAP) expression was observed in motoneuron samples from mutant mice during disease progression. At a pre-symptomatic age (60 days), GFAP was not detected in control and mutant motoneurons; at post-symptomatic ages (90 and 120 days), GFAP levels were not different from the background value in controls but a low level of expression was detected in samples from the mutants. During disease progression, motoneurons undergo neurodegeneration and become atrophic (Fig. 1 H); thus there is an increased risk of microdissecting unwanted material surrounding motoneurons such as astrocytes.
Vimentin is expressed in the cytoplasm of motoneurons and formed inclusions during the progression of the disease
The gene profile of microdissected motoneurons in two other mouse models that develop an inherited motoneuron degeneration (progressive motor neuronopathy and wobbler) also showed an up-regulation of the vimentin gene at a pre-symptomatic age (data not shown). Therefore, our goal was to determine whether vimentin was expressed by postnatal motoneurons and to follow its expression during the progression of the disease.
Using in situ hybridization, we showed mRNA expression of vimentin in motoneurons (cytoplasm and nucleus) and less intensely in other cells in the gray matter of the spinal cord in both control and mutant animals during disease progression (Fig. 4 ). We observed a more intense signal in the motoneurons of the SOD1 G93A mice at 120 days of age (Fig. 4 D). In addition, the spinal cord tissue from the mutant mice was consistently more fragile at the late stage of the disease. Using an immunohistochemical approach, we studied the localization of vimentin in control and mutant animals at different ages. In control and SOD1 G93A mice at 60 days of age, a weak staining of vimentin was observed in the cytoplasm of motoneurons (Fig. 5 A and D). Diffuse vimentin staining with occasional inclusions (Fig. 5 A, arrow) was detected in control animals, whereas inclusions were more frequent in SOD1 G93A motoneurons (Fig. 5 D, arrow). At the end stage of the disease (i.e. 120-day-old), the overall expression of vimentin was increased in the cytoplasm of motoneurons as well as in other cells in the gray matter of control and mutant animals (Fig. 5 G and J). Abundant vimentin inclusions were seen in the cytoplasm of the mutants at this later age (Fig. 5 J, arrows). Furthermore, using double-label immunohistochemical staining, we showed that vimentin and neurofilament heavy chains (phosphorylated and non-phosphorylated forms) were localized in the same motoneurons as well as in other cell types (Fig. 5 C, F, I and L).
DISCUSSION
In this study, we have characterized the ‘molecular signature’ of a pure SOD1 G93A motoneuron subpopulation during disease progression. By using a combination of LCM and high-density cDNA microarrays, we screened a large number of transcripts (34 000) and identified significant differential expression in SOD1 G93A -mutated motoneurons compared with control motoneurons from a pre-symptomatic age to the end stage of the disease. Unexpectedly, we observed no widespread induction of cell death genes in motoneurons of mutated SOD1 G93A mice. In addition, an immunohistochemical analysis has shown that the intermediate filament, vimentin, forms inclusions in spinal cord motoneurons during disease progression in a mouse model of ALS.
Few genes are de-regulated at an asymptomatic age
At a pre-symptomatic age (60 days of age), only 0.08% of the tested genes (27/34 000) are de-regulated in pure motoneurons. As the analysis is done before the onset of the symptoms, differential molecular expression might reflect events that either initiate the disease or reflect an early protective response of the targeted cells.
Among these de-regulated genes, more than 50% remain differentially expressed during disease progression. Matrix metalloproteinase 13 (MMP-13) gene is highly up-regulated at both asymptomatic and symptomatic stages; it belongs to a family of enzymes that are the main mediators of extracellular matrix degradation ( 10 ). Even though substrates of MMPs in the CNS are unknown, an excessive production of MMP may not only be toxic but also involved in neuroinflammation (for review, see ( 11 )). Furthermore, MMP-9 is increased in the motor cortex and spinal cord motoneurons of ALS patients ( 12 ). Thus MMP-13 may be involved in motoneuron degeneration at an early stage.
The gene for vimentin, an intermediate filament type III, is up-regulated at a pre-symptomatic age in SOD1 G93A motoneurons and also in motoneurons from two other mouse models of motoneuron degeneration (progressive motor neuronopathy and wobbler; data not shown). In striking opposition, no deregulation is observed in the entire spinal cord of mutant mice at the same age. In situ hybridization during the progression of the disease confirms the presence of vimentin within motoneurons. These findings strongly support a specific up-regulation of vimentin within the affected cells in motoneuron disease. Vimentin is prominently expressed in glial cells ( 13 ) but also in neurons during early development ( 14 – 16 ). It has been suggested to play a role in the early generation and extension of neurites following injury ( 17 , 18 ) as well as in enabling retrograde transport of activated MAP kinases in sensory axons following injury ( 19 ). During disease progression, the mRNA expression of vimentin is increased even further in SOD1 G93A motoneurons at an early symptomatic age (90 days) and remains elevated at the end stage of the disease (120 days). Using immunohistochemistry, we show that vimentin inclusions are present in the cytoplasm of pre-symptomatic SOD1 G93A mutants and become more abundant at the end stage of the disease.
Prominent cytoplasmic inclusions or aggregates are a hallmark of several neurodegenerative disorders (for review, see ( 20 – 23 )). In ALS patients and SOD1 mutant mice, protein aggregates such as bunina bodies and ubiquitinated/SOD inclusions have been reported (for review, see ( 24 )). It remains controversial whether the presence of inclusions, actually triggers motoneuron death, results from a cell death, process or reflects a cellular protective mechanism (for review, see ( 1 , 20 – 22 )). Formation of aggresomes has been postulated to be a protective cellular response to overloading the proteasome in HEK293 cells transfected with mutated forms of SOD1 ( 25 ). A hallmark of aggresomes is the deposition of intermediate filament proteins such as vimentin; most aggresomes are delivered to the microtubule-organizing center where they are surrounded by a vimentin ‘cage’ ( 20 , 25 , 26 ).
An increase in IGFBPs has been reported in ALS patients ( 27 ). One member of this family, NOV, is up-regulated in SOD1 G93A motoneurons at all stages of the disease and binds both IGF-1 and IGF-2 ( 28 ). IGF-1 is a potent survival factor for motoneurons and viral delivery of IGF-1 has been shown to prolong survival of SOD1 G93A mice ( 29 ). Thus, an increase of IGFBPs might diminish the availability of IGF-1 and lead to motoneuron death by forming heterodimeric IGF complexes.
At a symptomatic age, few cell-death-associated genes are de-regulated whereas a massive de-regulation of genes associated with cell growth and maintenance is observed
The number of differentially expressed genes remains relatively low even at a symptomatic age. Indeed, 0.28 and 1.14% of the tested genes are up-regulated at an early symptomatic age and at the end stage of the disease, respectively; down-regulated genes correspond to 0.16% at both ages. This small number of de-regulated genes is in agreement with a recent study using human spinal motoneurons in sporadic ALS where 1% of the 4845 tested genes were up-regulated and 3% down-regulated ( 2 ). In contrast to Jiang et al . ( 2 ), we do not find a significant de-regulation of genes involved in apoptotic pathways but a massive up-regulation of genes involved in cell growth and/or maintenance. Differences in gene expression seen between ALS patients and SOD1 G93A motoneurons (a mouse model for familial ALS) may be due to differences in sporadic versus familial ALS, post-mortem delay modifications in human tissue, stage of the disease and the composition and the number of genes examined on the arrays.
Other workers have reported an activation of apoptotic genes in the entire spinal cord of ALS patients and SOD1 mice (for review, see ( 1 , 30 )). Because of the heterogeneous population of cells in the spinal cord, it is not surprising to find transcriptional differences compared to pure motoneurons. In our study, 696 genes involved in cell death pathways were examined by microarrays and none of those genes are de-regulated. The two main cell death pathways (i.e. Bcl-2 and caspase family) suggested to be implicated in the ALS neurodegenerative process ( 9 ) are largely queried among these 696 tested genes. Molecular events that initiate the death of motoneurons in ALS patients or in SOD1 mouse models remain elusive. At symptomatic ages, massive microglia activation, astrogliosis and T-cell infiltration ( 9 , 31 ) have been reported in SOD1-mutated mice. These non-neuronal cells may release extracellular inflammatory factors and mediators of programmed cell death that induce or amplify cell death signals in motoneurons.
A temporal activation of caspase-1 and -3 has been reported in motoneurons and in non-neuronal cells of SOD1 G93A mice; activation of caspase-3 in motoneurons is contemporaneous of cell death which is in contrast to activation of caspase-1 that occurs at an earlier stage of the disease ( 32 – 34 ). We do not find an up-regulation of either caspase-1 and-3 mRNAs by microarray analysis but in agreement with the previous studies we find a modest temporal increase using Q-PCR. Such a discrepancy could result from the inability of the microarray analysis to detect low abundance transcripts. It had been hypothesized that caspase activation within motoneurons could result from diffusible factors emanating from neighboring cells ( 32 ). Furthermore, it had been shown that SOD1 toxicity is required in both motoneurons and in non-neuronal cells to induce cell death ( 8 ); indeed expression of the mutated form of SOD1 in either neurons ( 6 , 7 ) or astrocytes ( 5 ) alone does not cause motoneuron degeneration. Normal non-neuronal cells protect motoneurons that express the mutated form of SOD1 when present in sufficient number whereas an SOD1 mutation in non-neuronal cells induces degeneration in neighboring normal motoneurons ( 8 ). We cannot exclude an intrinsic activation of cell death pathways (mitochondrial pathway and/or ER pathway ( 1 , 35 )) but taken together, our results are compatible with an extrinsic activation (such as a death receptor pathway ( 1 , 35 )) of programmed cell death where neighboring cells might trigger motoneuron death.
Motoneuron death may also reflect a balance between protective and toxic gene products ( 30 , 36 , 37 ). For example, a balance between the antiapoptotic molecule XIAP and the inhibitor XAF1 plays a role in the differential sensitivity to death of motoneurons after axotomy ( 36 , 37 ); thioredoxin promotes cell survival and is up-regulated in ALS patients ( 38 ). An up-regulation of 14-3-3 proteins involved in preventing apoptosis ( 39 ) is also observed in ALS tissue ( 40 ). Up-regulation of genes involved in cell growth and/or maintenance may reflect a transitory neuroprotective phenomenon. Indeed, motoneuron loss is not synchronized and occurs over a long period of time. Despite the low number of motoneurons at 120 days of age, we microdissected a subpopulation of motoneurons that had a diameter of at least 25 µm and an identifiable nucleus; these criteria are necessary to exclude the possibility of dissecting interneurons or even gamma-motoneurons that are smaller. Motoneurons that we analyzed may be at an early stage of the cell death process and may still be capable of resisting degeneration. These motoneurons might have an intrinsic but transient ability to up-regulate protective gene products in response to the expression of mutant SOD1.
In conclusion, by combining LCM and microarrays, we demonstrate alterations in gene expression profiles during disease progression in SOD1 G93A motoneurons. One gene, coding for vimentin, was up-regulated at all three ages examined and the vimentin protein forms inclusions during progression of the disease. At symptomatic ages, we do not find a significant de-regulation of genes involved in cell death but a massive up-regulation of genes involved in cell growth and maintenance. In ALS, it remains to be determined whether the origin of the disease is in the motoneurons or in non-neuronal cells. As our results are compatible with a non-cell autonomous toxicity of mutated SOD1, a high priority will be to analyze gene profiles of non-neuronal cells such as astrocytes.
MATERIALS AND METHODS
Animal models
Transgenic mice overexpressing human SOD1 carrying the G93A mutation (strain designation: B6SJL-Tg(SOD1-G93A)1Gur) were purchased from the Jackson Laboratory (Bar Harbour, ME, USA). Transgenic progeny were identified by polymerase chain reaction (PCR) for human SOD1; non-transgenic littermates served as controls. Only males were used. Pre-symptomatic mice (60-day-old) were used to identify early modifications in gene expression; the progression of the disease was examined in early symptomatic (90-day-old) and end stage of the disease (120-day-old). Animals were sacrificed by decapitation. The experimental procedures were approved by the Ethical Committee for Animal Experimentation of the Geneva Veterinary Office.
LCM of motoneurons
Spinal cords (lumbar regions L2–L5) were rapidly removed, embedded in Tissue-Tek OCT Compound (Zoeterwoude, The Netherlands), placed at −20°C for 1 h and then stored at −80°C. Tissues were sectioned at 16 µm and mounted on PALM ® PEN-covered membrane slides (PALM AG, Bernried, Germany). LCM was performed immediately after sectioning. To identify motoneurons, a light staining in 0.1% methylene blue was done for 1 min; the sections were then dehydrated in graded solutions of ethanol (70, 95 and 100%) for 10 s each. Once air-dried, motoneurons were microdissected using the Palm Robot-Microbeam system (PALM AG, Bernried, Germany). Criteria for motoneuron selection include a diameter of greater than 25–30 µm and an identifiable nucleus. Motoneurons were catapulted into a microfuge cap moistened with a drop of mineral oil (Sigma, Saint Louis, Missouri). Approximately 100 cells were collected per cap. A total of 2000–2400 cells were used for analysis on one GeneChip array. Motoneurons were pooled from one animal per GeneChip. Additionally, we collected 900–1200 motoneurons from three mice for subsequent quantitative real-time PCR analysis.
RNA extraction and quality test
Total RNA was isolated using RNeasy Mini Kit (Qiagen, Maryland, USA) including DNase treatment (on columns) to remove potential genomic DNA contamination. We tested the quality of the starting RNA (Agilent 2100 bioanalyzer, RNA 6000 Pico LabChip, Palo Alto, USA) and proceeded only if the quality was satisfactory. Criteria were the absence of degradation of the ribosomal RNA that represents 90–95% of total RNA and a ratio 28S/18S equal to 1.8–2.0. cRNA quality was also tested after both amplifications using RNA 6000 Nano LabChip (Agilent 2100 bioanalyzer, Palo Alto, USA).
cRNA preparation, oligonucleotide microarray hybridization and analysis
Hybridization targets were obtained following a double amplification procedure according to the protocol developed by Affymetrix (GeneChip ® Eukaryotic Small Sample Target Labeling Assay Version II, Affymetrix, Santa Clara, USA). A hybridization mixture containing 5.5 µg of biotinylated cRNA was generated. The biotinylated cRNA was hybridized to Affymetrix GeneChip ® MOE 430 2.0. Three chips were hybridized, each corresponding to one mouse, for each condition. Chips were visualized on an Scs 3000 gene scanner (Affymetrix, Santa Clara, USA) and image files analyzed. We selected the differentially expressed transcripts using the Affymetrix software MAS 5.0 and carried out pair-wise comparison analyses where each of the mutant samples was compared with each of their respective control samples. This analysis is based on the Mann–Whitney pair-wise comparison test and allows the ranking of the results by concordance as well as the calculation of significance ( P -value) of each identified gene ( 41 , 42 ). A gene must exhibit 50% or more of ‘present’ calls in all samples to be considered ‘expressed’ and has two or more present calls among the three sets of samples. Fold differences were calculated as the ratio between the average values within each condition. Signal values and detection calls (present or absent) for all samples were determined by using Affymetrix MAS5.0. To identify transcripts that are differentially expressed between the controls and the mutant mice, we defined a criterion of a 1.5-fold and greater difference plus a P -value of <0.05.
Determination of over-representation of gene ontology terms during disease progression in SOD1 G93A motoneurons
Data were analyzed with Microarray Analysis GCOS 1.2 (Affymetrix) and classified according to GeneOntology terms ( http://www.geneontology.org/ ) using GeneSpring software (version 7.0, Silicon Genetics, Redwood City, CA). GeneOntology allows the classification of a gene according to its molecular function, biological process, cellular component and chromosomal localization. Genes with each of these functional annotations were assessed to see if they were over-represented in motoneurons of SOD1 G93A mice during the progression of the disease. If the P -value of observed genes in motoneurons with a particular gene ontology term was <0.001, the gene was considered to be significantly over-represented.
Quantitative real-time PCR
Total RNA from 900–1200 microdissected motoneurons was extracted as described earlier and used as a template in real-time PCR. Three animals were used for each analysis. One round of amplification was done following the first cycle (first cDNA and cRNA synthesis) of the Affymetrix double amplification procedure before undertaking reverse transcription with random hexamers (Superscript II, Invitrogen, Carlsbad, CA). Real-time PCR using Syber Green PCR Master Mix and Abi Prism SDS 7900 HT (Applied Biosystems, Foster City, CA) was done according to the manufacturer's protocol. All amplicons were designed within the 3′ end of the cDNA using Primer Express Software 2.0 (Applied Biosystems) and when possible, overlapped exon–exon junctions. Total RNA from the L2–L5 spinal cord segment was extracted as previously described and used as a template as described earlier but without an amplification step (for the sequences of the primers, see Supplementary Materials, Table S4). All samples were analyzed in triplicate and the values normalized to two reference genes GAPDH (glyceraldehyde-3-phosphate dehydrogenase) and RPS9 (mitochondrial ribosomal protein S9) ( 43 ).
Histology and morphometry
Sixty- and 120-day-old mice (controls and SOD1 G93A ) mice were killed with an overdose of pentobarbital (Nembutal, Narconen, Switzerland) and perfused transcardially with 4% paraformaldehyde in PBS. The lumbar spinal cords were removed, post-fixed and processed for paraffin embedding. Sections (8 µm) were stained with cresyl violet and then mounted in Eukitt. Lumbar spinal cords from 60-, 90- and 120-day-old mice (controls and SOD1 G93A ) were embedded in Tissue-Tek OCT Compound (Zoeterwoude), sectioned at 16 µm and stained with cresyl violet. Motoneurons were classified into two categories (diameter of greater than 25–30 µm and an identifiable nucleus and diameter lower than 25 µm) using the Palm Robot-Microbeam system (PALM AG). Each control and mutant group includes two and three animals, respectively. For each animal, at least 300 motoneurons were classified.
In situ hybridization
Lumbar spinal cords from 90- and 120-day-old mice (controls and SOD1 G93A ) were embedded in Tissue-Tek OCT Compound (Zoeterwoude), sectioned at 10 µm and mounted on gelatin-coated slides. In situ hybridization was done using a vimentin-specific FITC-labeled Custom Design TriSeq kit according to the manufacturer's instructions (Biognostik, Göttingen, Germany). Sections were hybridized with vimentin, poly-dT, β-actin, α-tubulin or random (negative) control probes (20 U/ml); mRNA expression was revealed with alkaline phosphatase-conjugated anti-FITC antibody and visualized with AEC+ Substrate Chromogen (both from DakoCytomation AG, Postfach, Switzerland). Each group includes at least two animals.
Double labeling immunofluorescence
Sixty- and 120-day-old mice were perfused and embedded in Tissue-Tek OCT compound as previously described. Twelve-micrometer sections of the lumbar spinal cord were mounted on slides and washed in PBS for 5 min. To prevent non-specific antibody binding, sections were treated for 30 min in PBS-containing lysine (20 m m , pH 7.4). Tissue sections were then permeabilized and blocked for 30 min with PBS-containing fetal bovine serum (FBS) (10%) and Triton X-100 (0.4%). Goat polyclonal anti-vimentin and mouse monoclonal anti-neurofilament 200 (both Sigma) primary antibodies were used in combination at 1:100 and 1:400, respectively. They were diluted in the blocking solution and sections were incubated overnight at 4°C. After three washes with PBS and 1 h in the blocking solution (FCS in PBS), sections were incubated with a combination of the secondary antibodies Alexa 594 donkey anti-goat IgG and Alexa 488 goat anti-mouse IgG (both 1:1500, Molecular Probes, Eugene, OR) for 45 min at room temperature. The sections were coverslipped using Fluorosave (Calbiochem, La Jolla, CA) and analyzed with a Zeiss Microscope equipped with a digital camera (Axiocam, Carl Zeiss, Oberkochen, Germany). The controls were done in the absence of the primary antibody and were negative in all cases. Each group includes at least three animals.
SUPPLEMENTARY MATERIAL
Supplementary Material is available at HMG Online.
ACKNOWLEDGEMENTS
We thank Gisele Gillieron, Beatrice King and Didier Chollet for excellent technical help and Marcel Ferrer-Alcon, Yannick Simonin and Temugin Berta for reading the manuscript. All microarrays and real-time PCR experiments were done in the Genomics Platform, National Center of Competence in Research ‘Frontiers in Genetics’, University of Geneva, Switzerland. This work was supported by the Association Française Contre les Myopathies (France), the Carlos and Elsie de Reuter Foundation (Switzerland), the Foundation Boninchi (University of Geneva), the Institut International de Recherche en Paraplégie and the Swiss National Foundation.
Conflict of Interest statement : No conflict of interest.
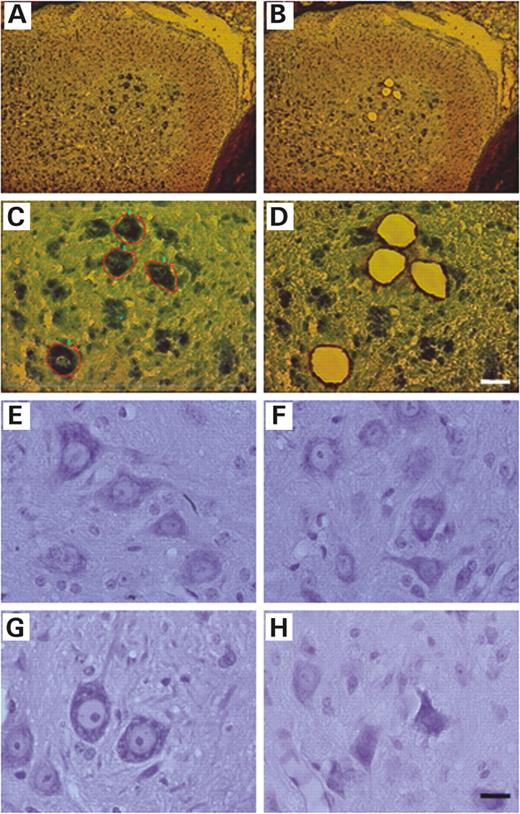
Figure 1. LCM of motoneurons from a methylene blue-stained section of 60-day-old SOD1 G93A spinal cord and morphological characteristics of motoneurons during disease progression. ( A ) Motoneurons localized in the ventral part of the spinal cord before capture. The ventral part is on the right and the dorsal part on the left. Sections are from the lumbar (L2–L5) of SOD1 G93A spinal cord. ( B ) Spinal cord after capture of motoneurons. ( C and D ) Higher magnification of (A) and (B). (C) Selected motoneurons for the capture. (D) Spinal cord after capture. Tissue surrounding the captured cells remains intact after microdissection. Scale bar represents 100 µm in (A) and (B); 25 µm in (C) and (D); 30 µm in ( E ) and ( F ). (E and F) Cresyl violet staining of lumbar (L2–L5) spinal cord in 60-day-old control and SOD1 G93A mice. Motoneurons appeared similar in controls and mutant mice. Motoneurons in mutant mice do not show any characteristics of degeneration or atrophy. ( G and H ) Cresyl violet staining of lumbar (L2–L5) spinal cord in 120-day-old control and SOD1 G93A mice. (H) Motoneurons in mutant mice show characteristics of degeneration or atrophy. (E and G) Control mice. (F and H) Mutant mice.
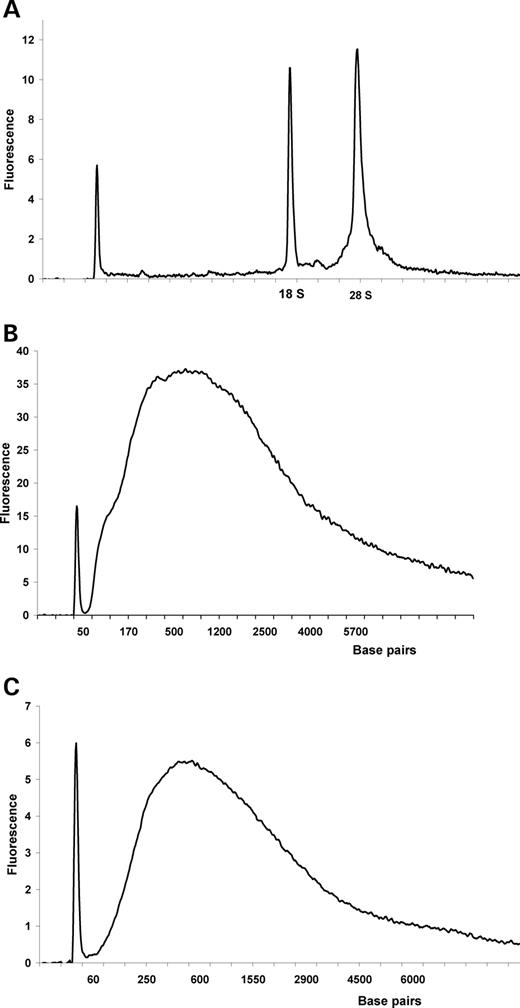
Figure 2. Quality of initial and amplified RNAs. The Agilent LabChip technology was used to control the quality of the RNA. In all graphs, the first peak corresponds to an internal marker of 25 nucleotides. ( A ) For each experiment, the integrity of total RNA from the LCM samples was determined. This graph shows that the two most representative peaks of rRNA (18S and 28S) are well defined; moreover, the ratio 28S/18S is approximately 2 which is an indication of high-quality total RNA. For each sample, we obtained a profile that is representative of intact RNA. ( B ) RNA quality after the first amplification. ( C ) RNA quality after the second amplification. The ‘smear’ is comprised of all lengths of RNA, indicating that we have obtained a good quality of amplified RNA after one round of amplification (B) as well as after the second round of amplification (C).
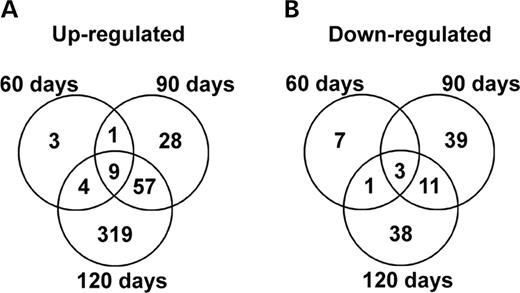
Figure 3. Global mRNA changes in microdissected motoneurons during the progression of the disease. Gene expression levels of laser-captured SOD1 G93A motoneurons in mutant versus control animals were compared at three different stages of the disease (60, 90 and 120 days); 34 000 transcripts were screened. ( A ) Up-regulated genes. We found nine genes up-regulated at all stages of the disease (matrix metalloproteinase 13, vimentin, nephroblastoma overexpressed gene, serine proteinase inhibitor (clade B, member 1a), growth-associated protein 43, aquaporin 4, mus musculus transcribed sequences (BB750040), myristoylated alanine-rich protein kinase C substrate and cathepsin Z). One gene showed an up-regulation at an asymptomatic age (60 days) and early symptomatic age (90 days), 57 genes showed an up-regulation at early and advanced stages (120 days) of the disease and four genes were up-regulated at 60 and 120 days of age. We found three genes differentially expressed uniquely at a pre-symptomatic age, 28 at an early symptomatic stage and 319 at the end stage of the disease. ( B ) Down-regulated genes. We found three genes down-regulated at all stages of the disease (GRP1 (general receptor for phosphoinositides 1)-associated scaffold protein, immunoglobulin heavy chain 6 and glutamate ionotropic receptor, NMDA1). Eleven genes showed a down-regulation at early (90 days) and advanced stages (120 days) of the disease and one gene was down-regulated at 60 and 120 days of age. We found seven genes down-regulated uniquely at a pre-symptomatic age, 39 at an early symptomatic stage and 38 at the end stage of the disease.
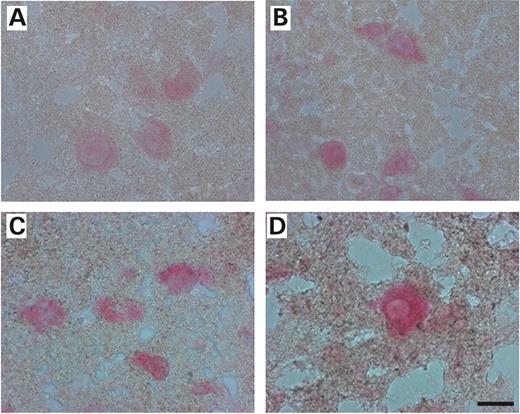
Figure 4.In situ hybridization of vimentin in lumbar spinal cord sections from control and SOD1 G93A mice during the progression of the disease. ( A and B ) mRNA expression of vimentin in lumbar (L2–L5) spinal cord in 90-day-old control and SOD1 G93A mice (early symptomatic age). ( C and D ) Hundred and twenty-day-old control and SOD1 G93A mice (end stage of the disease). In all cases, vimentin mRNA is expressed in the cytoplasm and the nucleus of motoneurons and less abundantly in other cell types of the gray matter. (A and C) Control mice. (B and D) Mutant mice. Scale bar represents 20 µm.
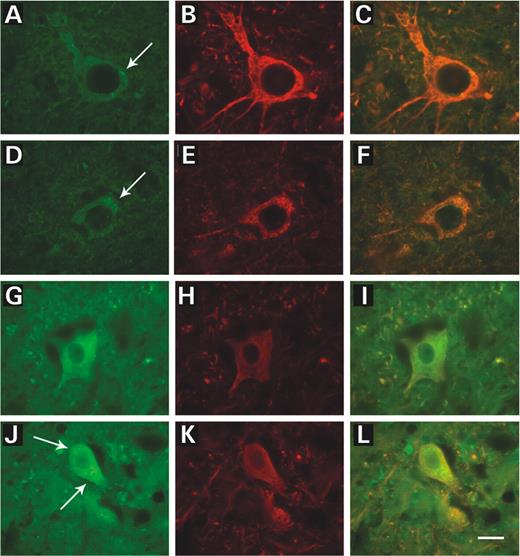
Figure 5. Immunostaining of vimentin and neurofilaments in lumbar spinal cord sections from control and SOD1 G93A mice during the progression of the disease. ( A – C ) Photographs of the lumbar (L2–L5) spinal cord in a 60-day-old control littermate, ( D – F ) 60-day-old SOD1 G93A mouse (pre-symptomatic age), ( G – I ) 120-day-old control littermate and ( J – L ) 120-day-old SOD1 G93A mouse (end stage of disease). Immunostaining with a polyclonal antibody to vimentin (A, D, G and J), a monoclonal antibody to neurofilaments (B, E, H and K) and a merged image of vimentin and neurofilaments (C, F, I and L). Note that in all cases vimentin and neurofilaments are located in the same motoneurons; in transgenic animals (D–F and J–L), motoneurons show characteristics of degeneration and atrophy along with vimentin inclusions in the cytoplasm. Scale bar represents 20 µm.
Comparison of genes differentially expressed in pre-symptomatic SOD1 G93A motoneurons using microarrays
| Affymetrix probe set ID | GenBank | Gene name | Fold change |
|---|---|---|---|
| Up-regulated in SOD1 G93A | |||
| 1417256_at | NM_008607 | Matrix metalloproteinase 13 | 7.63 |
| 1440142_s_at | BB750040 | Mus musculus-transcribed sequences, ESTs | 4.22 |
| 1437685_x_at | BB235530 | Fibromodulin | 2.75 |
| 1415973_at | BF141776 | Myristoylated alanine-rich protein kinase C substrate | 2.74 |
| 1437874_s_at | AV225808 | Hexosaminidase B | 2.55 |
| 1416318_at | AF426024 | Serine (or cysteine) proteinase inhibitor, clade B, member 1a | 2.30 |
| 1417868_a_at | NM_022325 | Cathepsin Z | 2.26 |
| 1426852_x_at | X96585 | Nephroblastoma overexpressed gene | 2.15 |
| 1421840_at | BB305534 | ATP-binding cassette, sub-family A (ABC1), member 1 | 2.15 |
| 1423537_at | BB622036 | Growth-associated protein 43 | 2.11 |
| 1432416_a_at | AK005498 | Nucleophosmin 1 | 1.91 |
| 1438118_x_at | AV147875 | Vimentin | 1.80 |
| 1422860_at | NM_024435 | Neurotensin | 1.72 |
| 1448595_a_at | NM_009052 | Reduced expression 3 | 1.67 |
| 1438945_x_at | BB142324 | Gap junction membrane channel protein alpha 1 | 1.61 |
| 1438940_x_at | AV170171 | High-mobility group nucleosomal-binding domain 1 | 1.60 |
| 1434449_at | BB193413 | Aquaporin 4 | 1.57 |
| Down-regulated in SOD1 G93A | |||
| 1427351_s_at | BB226392 | Immunoglobulin heavy chain 6 | −3.30 |
| 1436944_x_at | BB504983 | Mus musculus-transcribed sequence | −2.38 |
| 1439833_at | BQ176645 | Mus musculus adult male cortex cDNA | −2.28 |
| 1416311_s_at | NM_0094461 | Tubulin, alpha 3 | −2.15 |
| 1423478_at | BF660388 | Protein kinase C | −1.91 |
| 1441894_s_at | BB071890 | GRP1-associated scaffold protein | −1.63 |
| 1437968_at | AI385669 | Glutamate receptor, ionotropic, NMDA1 (zeta 1) | −1.62 |
| 1439368_a_at | AV002797 | Solute carrier family 9, isoform 3 regulator 2 | −1.56 |
| 1443824_s_at | BB193643 | Carbonic anhydrase 7 | −1.55 |
| 1433806_x_at | AW324084 | Calreticulin | −1.53 |
| 1417606_a_at | NM_007591 | Calreticulin | −1.52 |
List of genes whose transcripts were regulated by 1.5-fold or more ( P <0.05) in mutant mice. RNA was extracted from 2000–2400 microdissected motoneurons issued from one animal. Three chips were analyzed for each condition (control and mutant). Gene expression levels were compared in disease versus control animals. Fold change was calculated as the ratio between the average values of expression in mutant animals relative to the average values of controls; in all comparisons, a positive value indicates a higher level of expression in mutant animals versus negative numbers that show a higher level in controls.
Comparison of the fold changes observed at a pre-symptomatic age by microarrays versus real time PCR
| GenBank | Gene name | Description | Array | Real-time PCR |
|---|---|---|---|---|
| Genes up-regulated in SOD1 G93A | ||||
| NM_008607 | Mmp13 | Matrix metalloproteinase 13 | 7.63 | 4.24±0.07 |
| X96585 | Nov | Nephroblastoma overexpressed gene | 2.15 | 3.34±0.17 |
| AV147875 | Vim | Vimentin | 1.80 | 1.79±0.02 |
| BB142324 | Gja1 | Gap junction membrane channel protein alpha 1 (connexin 43) | 1.61 | 1.52±0.04 |
| AV225808 | Hexb | Hexosaminidase B | 2.55 | Not confirmed |
| BB622036 | Gap43 | Growth associated protein 43 | 2.11 | Not confirmed |
| NM_009052 | Rex3 | Reduced expression 3 | 1.67 | Not confirmed |
| Genes down-regulated in SOD1 G93A | ||||
| AI385669 | Grin1 | Glutamate receptor, ionotropic, NMDA1 (zeta1) | −1.62 | −1.18±0.1 |
To confirm the microarray results, eight genes were selected and analyzed by real-time PCR. For each sample, real-time PCR was done in triplicate. Fold change corresponds to the ratio between the expression levels in mutant animals relative to controls; a positive value indicates a higher level of expression in mutant animals versus a negative number that shows a higher level in controls.
Genes de-regulated at a pre-symptomatic age remain elevated at a symptomatic age
| GenBank | Gene name | Description | Days | Array | Real-time PCR |
|---|---|---|---|---|---|
| AV147875 | Vim | Vimentin | 60 | 1.80 | 1.79±0.02 |
| 90 | 8.96 | 4.27±0.14 | |||
| 120 | 4.03 | 3.22±0.26 | |||
| NM_008607 | Mmp13 | Matrix metalloproteinase 13 | 60 | 7.63 | 4.24±0.07 |
| 90 | 2.74 | 3.21±0.16 | |||
| 120 | 6.17 | 13.90±0.9 | |||
| X96585 | Nov | Nephroblastoma overexpressed gene | 60 | 2.15 | 3.34±0.17 |
| 90 | 4.59 | −1.07±0.55 | |||
| 120 | 3.73 | 5.01±0.49 | |||
| BB142324 | Gja1 | Gap junction membrane channel protein alpha 1 (connexin 43) | 60 | 1.61 | 1.52±0.04 |
| 90 | 1.34 | 1.52±0.33 | |||
| 120 | 1.44 | −1.05±0.33 | |||
| BB622036 | Gap43 | Growth-associated protein 43 | 60 | 2.11 | −1.14±0.15 |
| 90 | 4.04 | 2.80±0.18 | |||
| 120 | 3.32 | 1.43±0.13 | |||
| AI385669 | Grin1 | Glutamate receptor, ionotropic, NMDA1 (zeta 1) | 60 | −1.62 | −1.18±0.1 |
| 90 | −1.75 | −1.20±0.05 | |||
| 120 | −2.08 | −2.32±0.07 |
We followed the differential expression of a selected group of genes that were de-regulated in SOD1 G93A mice at a pre-symptomatic age. These genes were analyzed at 90 (onset of disease) and 120 days of age (end stage of disease). Three chips were analyzed for each condition (control and mutant) at all time points. Real-time PCR analyses were done in triplicate for each sample. Fold change indicates the ratio between the expression levels in mutant animals relative to controls; positive values indicate a higher level of expression in mutant animals versus negative numbers that show a higher level in controls.
Classification of over-represented genes obtained by microarrays in motoneurons of SOD1 G93A mice during the disease progression using the gene ontology database ( http://www.geneontology.org/ )
| Up-regulated genes | Total | P 90 | P 120 | ||
|---|---|---|---|---|---|
| Classification | Found | P -value | Found | P -value | |
| Cell growth and/or maintenance | 54 | 9.91E-6 | 211 | 3,74E-15 | |
| Cell organization and biogenesis | 12 | 1.47E-2 | 63 | 3.33E-15 | |
| Cytoskeleton organization and biogenesis | 1335 | 6 | 6.31E-2 | 42 | 7.34E-13 |
| Cytoplasm organization and biogenesis | 2804 | 12 | 1.47E-2 | 63 | 3.33E-12 |
| Metabolism | 42 | 1.29E-4 | 152 | 2.68E-8 | |
| Electron transport | 4575 | 17 | 1.45E-2 | 67 | 1.21E-5 |
| Lipid metabolism | 1301 | 6 | 5.71E-2 | 23 | 1.06E-3 |
| Coenzymes and prosthetic group metabolism | 1067 | 19 | 2.60E-3 | ||
| Protein biosynthesis | 1070 | 7 | 7.54E-3 | 19 | 2.68E-3 |
| Energy pathways | 1709 | 8 | 2.79E-2 | 26 | 4.06E-3 |
| Biosynthesis | 1291 | 9 | 1.63E-3 | 20 | 9.17E-3 |
| Carbohydrate metabolism | 1808 | 11 | 1.48E-3 | 24 | 2.55E-2 |
| Catabolism | 519 | 5 | 4.91E-3 | 9 | 3.76E-2 |
| Cell growth | 50 | 2.50E-7 | |||
| Cell homeostasis | 3 | 1.66E-3 | 7 | 5.00E-5 | |
| Transport | 13 | 2.21E-2 | 45 | 1.89E-3 | |
| Ion transport | 3028 | 13 | 1.09E-2 | 45 | 2.79E-4 |
| Development | 43 | 4.93E-11 | |||
| Cell differentiation | 1589 | 43 | 4.93E-11 | ||
Certain genes were de-regulated by at least 1.5-fold in motoneurons of SOD1 G93A mice at an early symptomatic age (90 days of age) and at the end stage of the disease (120 days of age). The table provides the total number of genes with that particular gene ontology term on the Affymetrix GeneChip ® MOE 430 2.0.
Comparison of the fold changes of genes involved in apoptotic and inflammatory pathways observed in entire spinal cord segments versus microdissected motoneurons using real-time PCR
| Description | Entire spinal cord | Motoneurons | ||
|---|---|---|---|---|
| Fold P 90 | Fold P 120 | Fold P 90 | Fold P 120 | |
| Bax | 1.02±0.047 | 1.36±0.082 | −1.23±0.043 | 1.19±0.11 |
| Caspase 1 | 1.06±0.06 | 1.81±0.21 | 1.76±0.28 | 1.59±0.24 |
| Caspase 3 | 1.09±0.06 | 1.41±0.2 | −1.09±0.23 | 2.45±0.55 |
| Caspase 7 | 1.02±0.12 | 2.12±0.22 | Too low to determine a | Too low to determine a |
| Caspase 9 | −1.25±0.11 | −1.2±0.11 | Too low to determine a | Too low to determine a |
| XIAP | −1.08±0.05 | −1.05±0.06 | −1.06±0.34 | −1.89±0.30 |
| TNF alpha | 2.05±0.34 | 5.49±0.6 | Too low to determine a | Too low to determine a |
To confirm the specificity of the differential expression within motoneurons, we selected genes involved in the apoptotic pathway and undertook real-time PCR on the entire L2–L5 spinal cord segments. For each sample, real-time PCR was done in triplicate. Fold change represents the ratio between the expression levels in mutant animals relative to controls; positive values indicate a higher level of expression in mutant animals versus negative numbers that show a higher level in controls.
a The expression level in control and mutant animals was too low to determine a fold change.
References
Bruijn, L.I., Miller, T.M. and Cleveland, D.W. (
Jiang, Y.M., Yamamoto, M., Kobayashi, Y., Yoshihara, T., Liang, Y., Terao, S., Takeuchi, H., Ishigaki, S., Katsuno, M., Adachi, H. et al . (
Olsen, M.K., Roberds, S.L., Ellbrock, B.R., Fleck, T.J., McKinley, D.K. and Gurney, M.E. (
Yoshihara, T., Ishigaki, S., Yamamoto, M., Liang, Y., Niwa, J., Takeuchi, H., Doyu, M. and Sobue, G. (
Gong, Y.H., Parsadanian, A.S., Andreeva, A., Snider, W.D. and Elliott, J.L. (
Lino, M.M., Schneider, C. and Caroni, P. (
Pramatarova, A., Laganiere, J., Roussel, J., Brisebois, K. and Rouleau, G.A. (
Clement, A.M., Nguyen, M.D., Roberts, E.A., Garcia, M.L., Boillee, S., Rule, M., McMahon, A.P., Doucette, W., Siwek, D., Ferrante, R.J. et al . (
Przedborski, S. (
Nagase, H. and Woessner, J.F., Jr (
Yong, V.W., Power, C., Forsyth, P. and Edwards, D.R. (
Lim, G.P., Backstrom, J.R., Cullen, M.J., Miller, C.A., Atkinson, R.D. and Tokes, Z.A. (
Menet, V., Prieto, M., Privat, A. and Ribotta, M. (
Cochard, P. and Paulin, D. (
Tapscott, S.J., Bennett, G.S., Toyama, Y., Kleinbart, F. and Holtzer, H. (
Fliegner, K.H., Kaplan, M.P., Wood, T.L., Pintar, J.E. and Liem, R.K. (
Boyne, L.J., Fischer, I. and Shea, T.B. (
Dubey, M., Hoda, S., Chan, W.K., Pimenta, A., Ortiz, D.D. and Shea, T.B. (
Perlson, E., Hanz, S., Ben Yaakov, K., Segal-Ruder, Y., Seger, R., and Fainzilber, M. (
Ardley, H.C., Hung, C.C. and Robinson, P.A. (
Caughey, B. and Lansbury, P.T. (
Soto, C. (
Taylor, D.M., Minotti, S., Agar, J.N. and Durham, H.D. (
Wood, J.D., Beaujeux, T.P. and Shaw, P.J. (
Johnston, J.A., Dalton, M.J., Gurney, M.E. and Kopito, R.R. (
Johnston, J.A., Ward, C.L. and Kopito, R.R. (
Wilczak, N., de Vos, R.A. and De Keyser, J. (
Christine, P.B., Wilson, E.M., Hwa, V., Oh, Y. and Rosenfeld, R.G. (
Kaspar, B.K., Llado, J., Sherkat, N., Rothstein, J.D. and Gage, F.H. (
Malaspina, A. and de Belleroche, J. (
Alexianu, M.E., Kozovska, M. and Appel, S.H. (
Li, M., Ona, V.O., Gan, C., Chen, M., Jackson-Lewis, V., Andrews, L.J., Olszewski, A.J., Stieg, P.E., Lee, J.P., Przedborski, S. and Friedlander, R.M. (
Pasinelli, P., Houseweart, M.K., Brown, R.H., Jr and Cleveland, D.W. (
Vukosavic, S., Stefanis, L., Jackson-Lewis, V., Guegan, C., Romero, N., Chen, C., Dubois-Dauphin, M. and Przedborski, S. (
Vila, M. and Przedborski, S. (
Perrelet, D., Ferri, A., MacKenzie, A.E., Smith, G.M., Korneluk, R.G., Liston, P., Sagot, Y., Terrado, J., Monnier, D. and Kato, A.C. (
Perrelet, D., Perrin, F.E., Liston, P., Korneluk, R.G., MacKenzie, A., Ferrer-Alcon, M. and Kato, A.C. (
Malaspina, A., Kaushik, N. and de Belleroche, J. (
Nomura, M., Shimizu, S., Sugiyama, T., Narita, M., Ito, T., Matsuda, H. and Tsujimoto, Y. (
Kawamoto, Y., Akiguchi, I., Nakamura, S. and Budka, H. (
Hubbell, E., Liu, W.M. and Mei, R. (
Liu, W.M., Mei, R., Di, X., Ryder, T.B., Hubbell, E., Dee, S., Webster, T.A., Harrington, C.A., Ho, M.H., Baid, J. and Smeekens, S.P. (
