


Abstract
Background: Mendelian randomization (MR) studies investigate the effect of genetic variation in levels of an exposure on an outcome, thereby using genetic variation as an instrumental variable (IV). We provide a meta-epidemiological overview of the methodological approaches used in MR studies, and evaluate the discussion of MR assumptions and reporting of statistical methods.
Methods: We searched PubMed, Medline, Embase and Web of Science for MR studies up to December 2013. We assessed (i) the MR approach used; (ii) whether the plausibility of MR assumptions was discussed; and (iii) whether the statistical methods used were reported adequately.
Results: Of 99 studies using data from one study population, 32 used genetic information as a proxy for the exposure without further estimation, 44 performed a formal IV analysis, 7 compared the observed with the expected genotype-outcome association, and 1 used both the latter two approaches. The 80 studies using data from multiple study populations used many different approaches to combine the data; 52 of these studies used some form of IV analysis; 44% of studies discussed the plausibility of all three MR assumptions in their study. Statistical methods used for IV analysis were insufficiently described in 14% of studies.
Conclusions: Most MR studies either use the genotype as a proxy for exposure without further estimation or perform an IV analysis. The discussion of underlying assumptions and reporting of statistical methods for IV analysis are frequently insufficient. Studies using data from multiple study populations are further complicated by the combination of data or estimates. We provide a checklist for the reporting of MR studies.
Key Messages
The specific methods used in Mendelian randomization studies vary widely.
These methods broadly fall into three categories: (i) using genetic information as a proxy for the exposure without further estimation; (ii) performing an instrumental variable analysis; (iii) comparing the observed with the expected genotype-outcome association.
Mendelian randomization studies frequently insufficiently discuss underlying assumptions or report statistical methods for IV analysis.
A checklist for the reporting of Mendelian randomization studies is provided.
Introduction
Observational studies are limited in their ability to identify whether exposures are causally related to disease occurrence or other outcomes. Adjustment for confounding is only possible for those factors which are identified and measured and will inevitably be incomplete: some degree of residual confounding will always remain. Reverse causation, an effect of the outcome on the studied exposure, may also explain associations found in an observational study.1,2 An approach which can circumvent both reverse causation (as first proposed in 1986)3 and residual confounding in order to establish the causal effect of the exposure on the outcome is to investigate the effect of genetic variation in levels of the exposure on the outcome. This approach has come to be known as Mendelian randomization over the past decade.2 The random allocation of genetic variants from parents to offspring means these variants will generally be unrelated to other factors which affect the outcome.1 Furthermore, associations between the genotype and the outcome will not be affected by reverse causation because disease does not affect genotype.1
Mendelian randomization studies use genetic variation as an instrumental variable (IV) and must fulfil instrumental variable assumptions. Applied to Mendelian randomization, these assumptions are that (i) the genotype is associated with the exposure; (ii) the genotype is associated with the outcome through the studied exposure only (exclusion restriction assumption); and (iii) the genotype is independent of other factors which affect the outcome (independence assumption).4 Potential threats to the validity of these assumptions, such as population stratification, linkage disequilibrium and pleiotropic effects, are discussed in detail elsewhere.1,5
These general principles of Mendelian randomization are increasingly used in aetiological research, but the specific methods used in these studies can vary widely. In this study we review the methodology used in studies from the past 10 years which were described by the authors as Mendelian randomization studies. We provide an overview of the use of the different approaches to Mendelian randomization and, where applicable, the specific statistical methods used for estimation. We evaluate whether the plausibility of the Mendelian randomization assumptions is discussed. Further, we evaluate whether the statistical methods used are sufficiently described (including how the confidence interval was obtained) for those studies which perform an instrumental variable analysis or compare the observed and expected genotype-outcome association.
Methods
Search strategy and inclusion criteria
We searched PubMed, Medline, Embase and Web of Science for studies containing the term ‘Mendelian randomization’ or ‘genetic instrumental variable’ or a related term (e.g. ‘genetic instrument’)from 1 January 2003 to 31 December 2013. The full search strategies for each of the databases are included in Supplementary Methods, available as Supplementary data at IJE online. We excluded publications that; (i) were conference abstracts, letters, commentaries, editorials, reviews, study proposals or theoretical papers; (ii) did not use Mendelian randomization (i.e. did not state Mendelian randomization or a genetic instrumental variable was used in the text, abstract or title and did not include ‘Mendelian randomization’ or ‘genetic instrumental variable’ or a related term as a keyword); (iii) identified potential genetic instruments for future Mendelian randomization studies; (iv) were primarily methodological, using an application of Mendelian randomization as an example; or (v) were published in a health economics journal (rather than a biomedical journal).
Classification of Mendelian randomization approach used
First we classified publications into studies which used data from a single study population and studies which used data from multiple study populations. We then classified included studies according to their general Mendelian randomization approach: i.e. how they utilized the genetically determined variation in exposure.
For studies performed in a single study population we identified the following three main approaches:
Use of genetic variation as a proxy for the exposure, without further estimation.
These studies investigate the association between a genotype (which affects the exposure) and the outcome. No comparison is made with the expected association between this genotype and the outcome, and no IV estimate of the effect of the exposure on the outcome is obtained.
Comparison of the observed and expected genotype-outcome associations.
These studies compare the observed association between the genotype and the outcome with the association which would be expected if the observed exposure-outcome association were causal. This expected association is calculated by multiplying the observed genotype-exposure association with the observed exposure-outcome association (sometimes termed the ‘triangulation’ approach, although this is not a specific term); see Figure 1 for an illustration and further explanation. The confidence interval of the expected genotype-outcome association can be estimated analytically or using bootstrap techniques.
Formal instrumental variable analysis using genetic variation as the instrument.
These studies perform a formal IV analysis to obtain a causal estimate of the effect of genetically determined variation in the exposure on the outcome. Different statistical techniques can be used for this purpose, as we will further explain below.
We classified the studies including more than one study population into the following pre-specified main categories:
Pooling of the data, followed by any of the approaches Ai‐iii listed above.
IV analysis in each of the study populations, followed by a meta-analysis.
Meta-analysis using the genotype as a proxy for the exposure, without further estimation.
Meta-analyses of the genotype-exposure, exposure-outcome and genotype-outcome associations, followed by comparison of observed and expected genotype-outcome associations (as in approach Aii).
Meta-analyses of the genotype-exposure and genotype-outcome associations, followed by a Wald-type/ratio estimate (see Didelez et al. for a description of Wald-type estimators).6
Data analysed separately for more than one population, followed by any of the approaches Ai‐iii.
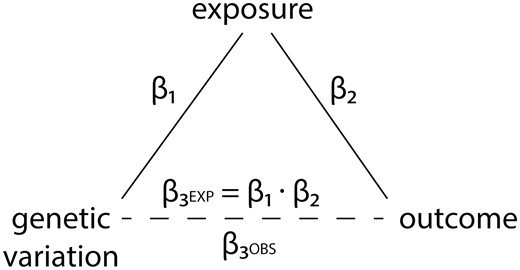
Diagram of the approach used by Mendelian randomization studies which compare the observed genotype-outcome association with the expected genotype-outcome association. β1, regression coefficient of the genetic variant-exposure association. β2, regression coefficient of the exposure-outcome association. β3OBS, observed regression coefficient of the genetic variant-outcome association. β3EXP, expected regression coefficient of the genetic variant-outcome association. The point estimate of β3EXP is calculated as follows: β3EXP = β1 · β2. The confidence interval of the expected genotype-outcome association can be estimated analytically or using bootstrap techniques.
Further categories were added for those studies which did not fall into any of the above categories.
Assessment of discussion of Mendelian randomization assumptions
Regardless of the approach used, Mendelian randomization studies rely on three main assumptions, as briefly mentioned in the introduction.
The genotype is associated with the exposure.
This assumption can and should be verified in the data. Reporting guidelines for IV analyses recommend the use of the partial F-statistic as a measure of the strength of the association between the IV and the exposure.7,8 It encompasses information on the strength of the instrument and on the number of observations in the analysis.9 We assessed whether studies reported the strength of the genotype-exposure association in the data using a partial F-statistic or using another measure (e.g. mean difference in exposure by genotype). If not, we assessed whether they reported the strength of this association from literature.
The genotype is associated with the outcome through the studied exposure only (exclusion restriction assumption).
This assumption is violated if the genotype has multiple (pleiotropic) effects, if a nearby variant with which it is in linkage disequilibrium affects the outcome in other ways than through the exposure of interest, or if developmental canalization occurs.1 For all studies we evaluated whether the plausibility of this assumption was discussed. Mentioning the assumption in general terms was not deemed sufficient: a specific discussion of its plausibility in the particular study was required.
The genotype is independent of other factors which affect the outcome (independence assumption).
This assumption is violated if subgroups in the study population have both different genotype frequencies and different distributions of the outcome (population stratification).1 It is also violated if there is an association between the genotype used as an instrument and confounders. For all studies we assessed whether the association between the genetic instrument and measured confounders was reported, as recommended in IV reporting guidelines.7 Furthermore, we assessed whether potential associations of the genotype with unmeasured confounders were discussed and/or population stratification was discussed. Again, a specific discussion of the plausibility of the assumption in the particular study was required.
Assessment of reporting of statistical analysis
This section only applies to the studies which used the IV approach or the observed-expected approach, because using genetic variation as a proxy for the exposure without further estimation does not involve any special statistical methods.
For studies which obtained an IV estimate of the effect of the exposure on the outcome, we determined which statistical method was used and assessed whether it was described sufficiently and whether a confidence interval was reported. A frequently used IV method is two-stage least squares analysis. This involves two stages of linear regression. The first stage is a linear regression with the exposure as the dependent variable and the instrument (genotype) as the independent variable, which is then used to obtain predicted exposure levels based on the instrument. The second stage is a regression with the outcome as the dependent variable and these genetically predicted exposure levels as the independent variable. Software for two-stage least squares regression takes into account the errors in both stages of the analysis to give a correct confidence interval. Additionally, we determined the type of outcome investigated (continuous, binary, time-to-event) and for binary outcomes what kind of target parameter was estimated (risk difference, odds ratio, relative risk, probit coefficient). We also determined whether a statistical test was used to compare the IV estimate with the ‘conventional’ estimate of the effect of the exposure on the outcome, what type of genetic instrument was used [one single nucleotide polymorphism (SNP) or allele, multiple SNPs in separate analyses, multiple SNPs in a single analysis, combinations of SNPs e.g. haplotypes or a genetic risk score] and for those studies which used multiple SNPs in a single analysis, whether weak instrument bias was discussed. In the IV studies within one study population, we also determined whether the genetic variant used as an instrument was identified or selected in the same population or if the weights for a weighted genetic risk score were derived in the same population.
For studies comparing the observed and expected genotype-outcome association, we assessed whether the method used to obtain a point estimate of the expected genotype-outcome association was described. If the description was such that calculation of this point estimate should be possible using the data provided, we assessed whether the point estimate corresponded to our calculations (only in those studies within one population). Further, we assessed whether a confidence interval for the expected genotype-outcome association was reported, whether the method used to obtain this confidence interval was described, and whether the confidence interval incorporated the variance of both the genotype-exposure association and the exposure-outcome association.
Results
Our search returned 1911 hits, of which 594 hits remained after exclusion of conference abstracts and duplications. After reviewing the title and abstract and if necessary the full-text article, a further 415 records were excluded for reasons listed in the flowchart in Figure 2, resulting in 179 eligible Mendelian randomization studies. Of these 179 studies, 99 studies used data from a single study population for their main analyses,10–108 and 80 studies used data from more than one study population (Table 1).109–188 The included studies were published between May 2005 and December 2013. An overview of the exposures studied and the genetic instruments used is presented in Supplementary Table 1 (available as Supplementary data at IJE online). The most frequently studied exposures were C-reactive protein (29 studies) and adiposity measures such as body mass index, fat mass and percentage body fat (25 studies).
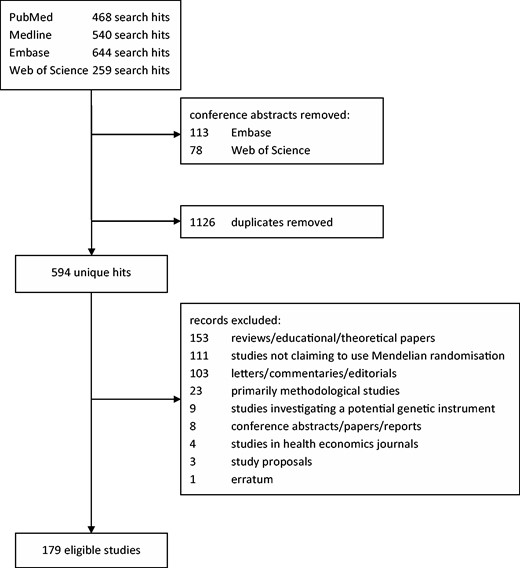
Summary of literature search.
Approaches used in Mendelian randomization studies
| Data from 1 study population | (n = 99) | Refs |
|---|---|---|
| 1. Genotype used as a proxy for exposure, without further estimationa | 38 | 10–47 |
| 2. Comparison of observed and expected genotype-outcome association | 10 | 48–57 |
| 3. IV analysisb | 48 | 58–105 |
| 4. Comparison of observed and expected genotype-outcome association and IV analysis | 1 | 106 |
| 5. Unclear | 2 | 107,108 |
| Data from more than 1 study population | (n = 80) | |
| 1. Data pooled, then analysed | ||
| a. Genotype used as a proxy for exposure, without further estimation | 2 | 109,110 |
| b. Comparison of observed and expected genotype-outcome associationa | 3 | 111–113 |
| c. IV analysisb | 14 | 114–127 |
| d. Comparison of observed and expected genotype-outcome association and IV analysis | 7 | 128–134 |
| 2. IV analyses, then meta-analysis | 10 | 135–144 |
| 3. Meta-analysis using genotype as a proxy for exposure, without further estimation | 15 | 134–136,145–157 |
| 4. Meta-analyses* followed by comparison of observed and expected genotype-outcome associationc | 13 | 139,144,157–167 |
| 5. Meta-analyses* followed by a Wald-type/ratio estimate | 9 | 168–176 |
| 6. Data analysed and reported separately for more than 1 population | ||
| a. Genotype used as a proxy for exposure, without further estimationc | 3 | 177,179,180 |
| b. IV analysis | 3 | 178,181,182 |
| 7. Multivariate meta-analysis | 2 | 155,183 |
| 8. Bayesian meta-analysis | 1 | 184 |
| 9. Separate study IV-analysis | 1 | 185 |
| 10. Meta-analysis of gene-exposure association, then ratio estimate, then meta-analysis | 1 | 186 |
| 11. Other/unclear** | 2 | 187,188 |
Some studies used multiple approaches in non-identical sets of study populations.
aTwo studies also performed an IV analysis for which it was unclear how the data were combined.112,113
bOne study performed some of the analyses in a single study population.118
*Meta-analyses of genotype-exposure, exposure-outcome and/or genotype-outcome associations.
Of the 99 studies which used data from a single study population, 38 studies (38%) used the genetic information as a proxy for the exposure by investigating the genotype-outcome association without further estimation of either the causal effect of the exposure on the outcome or of the expected genotype-outcome association (Table 1); 48 studies (48%) used IV analysis to estimate the effect of genetically determined variation in exposure levels on the outcome. Ten studies compared the observed association between the genotype and the outcome with the expected association based on the genotype-exposure association and the exposure-outcome association. One study used both these latter two approaches. For two studies we could not categorize the methods used into any of the aforementioned approaches.
Of the 80 studies which used data from multiple study populations, 26 (33%) studies pooled the data from the different studies and subsequently analysed the pooled data (Table 1). Ten studies performed an IV analysis in the different studies followed by a meta-analysis; 41 studies (51%) first performed a meta-analysis of one or more of the genotype-exposure, exposure-outcome and genotype-outcome associations, 26 of which subsequently used these meta-analysed associations for further estimation of either the causal effect of the exposure on the outcome or of the expected genotype-outcome association. In total, 52 studies (65%) used some form of IV analysis to obtain a causal effect of the exposure on the outcome. A further 23 studies compared the observed and expected genotype-outcome associations.
Table 2 summarizes the reporting of the Mendelian randomization assumptions. Reporting of assumptions was assessed in 178 studies, because the design of one study was so different from the general Mendelian randomization design that the assumptions could not be assessed. A total of 37 out of 98 studies (38%) which used a single study population and 42 out of 80 studies (53%) which used multiple study populations explicitly discussed the plausibility of all three Mendelian randomization assumptions in the context of their study.
Reporting of Mendelian randomization assumptions
| Criteria | 1 Study population (n = 98)* | >1 Study population (n = 80) |
|---|---|---|
| Strength of genetic instrument-exposure association (assumption 1) | ||
| Verified in data using F-statistic | 33 | 26 |
| Otherwise verified in data (e.g. using risk difference or odds ratio) | 53 | 45 |
| Reported from literature | 4 | 4 |
| Not reported | 8 | 5‡ |
| Plausibility of exclusion restriction assumption discussed (assumption 2) | 56 | 55 |
| Independence assumption (assumption 3) | ||
| Instrument-confounder associations shown & assumption further discussed theoreticallya | 20 | 16 |
| Instrument-confounder associations shown, assumption not further discussed | 30 | 21 |
| Investigation of instrument-confounder associations mentioned, not shown & assumption further discussed theoretically | 4 | 0 |
| Investigation of instrument-confounder associations mentioned, not shown & assumption not further discussed | 8 | 0 |
| Plausibility of assumption theoretically discussed only | 7 | 18 |
| Plausibility of assumption not discussed | 29 | 25 |
*Reporting of assumptions was not assessed in one study, because its design was vastly different from the general design of a Mendelian randomization study. The total number of studies within 1 study population is therefore 98.
aPotential association with unmeasured confounders discussed and/or population stratification discussed.
‡Two studies reported a P-value only.
Among the studies which performed an IV analysis, those using a single study population most frequently studied a continuous outcome, whereas those using multiple study populations most frequently studied a binary outcome and estimated an odds ratio (Table 3). The statistical methods used in these formal IV studies are shown in Table 4. Two-stage least squares (2‐SLS) regression was the most common method used in studies within one study population (n = 26, 53%). Ten studies within multiple study populations also used this method. One study used 2‐SLS with a binary outcome, but it did not mention whether heteroskedasticity robust standard errors were used.69 Among the studies which used multiple study populations, a Wald-type or ratio estimator was most frequently used (n = 16, 31%). The method used to obtain the confidence interval for the ratio estimate was a Taylor series expansion (termed the delta method138,141,168,169,186 or Taylor expansion170), Fieller method,120,176–178 or was not described. Three studies in a single study population also used a Wald-type/ratio estimator, but two of these studies did not report a confidence interval. Other methods used were control functions (n = 8 in total), IV probit regression (n = 4), generalized method of moments (n = 8), generalized least squares regression (n = 5), quasi-likelihood and variance function (n = 4) and a two-stage approach with a linear first stage and a logistic second stage (n = 5). Four of the studies which used this last approach did not report how the correct confidence interval was obtained,125,133,135,158 and the fifth used a sandwich estimator.114 The IV method was insufficiently described in 14 studies. In six of these studies there was a discrepancy between the statistical method reportedly used (2‐SLS) and the effect estimate reported (OR).100,128,129,130,131,134 Another study seemingly did not take into account the variance of the genotype-exposure association in the variance of the IV estimate, which would result in too narrow a confidence interval.101
Types of outcome and parameters estimated in IV Mendelian randomization studies
| Type of outcome | 1 Study population (n = 49) | Refs | >1 Study population (n = 52) | Refs |
|---|---|---|---|---|
| Continuous | 37 | 58–68,70–89,94,98,103–106 | 14 | 114–116,118,126,135–139,168,170,182,185 |
| Binary | ||||
| Risk difference | 3 | 69,93,99 | 0 | – |
| Relative risk | 2 | 81,102 | 2 | 118,124 |
| Odds ratio | 7 | 67,82,88,90–92,100 | 37 | 112–114,117,119–121,123,125,128–135,139–144,155,158,168,169,171–176,178,181,183,184,186 |
| Probit coefficient | 1 | 83 | 1 | 122 |
| Time-to-event | 4 | 95–97,101 | 5 | 124,138,168,177,178 |
| Unclear | 0 | – | 1 | 127 |
The total number of types of outcome and parameters estimated exceeds the total number of studies because some studies included multiple types of outcomes.
Statistical methods used in the instrumental variable studies
| Method | 1 Study population (n = 49) | Refs | >1 Study population* (n = 52) | Refs |
|---|---|---|---|---|
| Two-stage least squares | 26 | 58–83 | 10 | 114–116,118,135–139,182 |
| Instrumental variable regression in Stata, not further specified (2‐SLS, GMM or LIML) | 5 | 84–88 | 0 | – |
| Control function | 6 | 81,82,89–92 | 2 | 139,143 |
| Instrumental variable probit regression | 3 | 67,83,93 | 1 | 122 |
| GMM | 2 | 94,98 | 0 | – |
| Multiplicative GMM | 0 | – | 6 | 117–121,124 |
| Generalized least squares regression | 1 | 95 | 4 | 112,113,123,132 |
| Two-stage: linear first stage, logistic second stage | 0 | – | 5 | 114,125,133,135,158 |
| Quasi-likelihood and variance function | 1 | 88 | 3 | 140,144,181 |
| Ratio/Wald-type estimator | 1 | 99 | 17 | 120,124,138,141,142,168–178,186 |
| Ratio/Wald-type estimator without confidence interval | 2 | 96,97 | 0 | – |
| Insufficiently described/unclear | 7 | 100–106 | 7 | 126–131,134 |
| Otherb | 0 | – | 4 | 155,183–185 |
The total number of statistical methods exceeds the total number of studies because some studies investigated multiple statistical methods.
2‐SLS, two-stage least squares; GMM, generalized method of moments; LIML, limited-information maximum likelihood.
*Including the two studies which used multiple study populations, but performed the IV analysis in a single study population.
bSee Table 1.
Of the101 studies which used one of the approaches which yields an IV estimate, 48 reported tests of the difference between the IV estimate and the conventional estimate: the most commonly used were (a variant of) the Durbin-Wu-Hausman test (29 studies),58–60,62,64–66,68,70–72,74,75–77,79–87,94,98,105,116,139 and (a variant of) the Bland-Altman test(10 studies).112,113,117,119,128–132,134 The types of genetic instrument used (e.g. a single SNP or a genetic risk score) in the IV analysis studies are listed in Supplementary Table 2 (available as Supplementary data at IJE online). Of the 25 studies which used multiple SNPs in a single analysis, 13 mentioned weak instrument bias, with two studies very specifically discussing it in relation to using multiple instruments.117,185 Of the 49 studies which used IV methods and were performed in one study population, 14 evidently identified or selected the genetic variant used as an instrument in the same population or derived weights for a weighted genetic risk score in the same population.61,62,65,66,70,71,82,85,87,91,93,102,104,105
In 3 of the 11 studies comparing the observed gene-outcome association with the expected gene-outcome association in one study population we could not reconstruct the point estimate of the expected association from the data.48,50,57 Four studies did not report a confidence interval for the expected genotype-outcome association.52,54,56,106 In a further five studies, the methods used to calculate this confidence interval were unclear,48–50,53,57 and in one study only the error in the exposure-outcome association seemed to have been taken into account in the calculation of this confidence interval.55 Only one study adequately described the methods used to obtain the point estimate and confidence interval (bootstrapping) of the expected genotype-outcome association.51 In the 23 studies which employed this approach using more than one study population, three only took into account the error in the exposure-outcome association and not the error in the genotype-exposure association,159,164,165 and 16 studies did not describe how the confidence interval was obtained.
Discussion
Most Mendelian randomization studies either performed some form of IV analysis (49% of studies within one study population and 65% of studies within multiple study populations) or used the genotype as a proxy for the exposure without further estimation. A third approach used less frequently was to compare the observed genotype-outcome association with the expected genotype-outcome association. Although validity of the three main Mendelian randomization assumptions is required regardless of the approach used, only 44% of studies adequately discussed the plausibility of these assumptions. The methods used to obtain an IV estimate were not always adequately described. For those studies which were performed using multiple study populations, the range of approaches used was very broad, because of further differentiation according to the way the data from the different studies were combined. Here we will discuss our findings and propose recommendations for the reporting of Mendelian randomization studies.
To our knowledge there is one paper which previously reviewed MR studies, which included a much smaller number of studies. Its main focus was on whether the Mendelian randomization studies reported results that were compatible with a causal association, which was the case for over half of their reviewed studies.189 In contrast, our review focused on the approach used and on the discussion of the assumptions and the reporting of the statistical methods used. The previous review also noted that many studies applied IV analysis to a binary outcome, using methods which had not quite been validated,189 which is an issue which we will also discuss later.
Our meta-epidemiological study has several limitations. With respect to study selection, we investigated what methods were used in studies stating that they used Mendelian randomization or that they used a genetic IV. Importantly, we were unable to include studies which apply the same principles without using the term Mendelian randomization or genetic IV because these could not feasibly be found using a systematic search strategy. We do not know to what extent our results apply to these studies, but suspect the discussion of Mendelian randomization assumptions in particular is likely to be insufficient in many of these studies. Importantly, the focus of our review was on the quality of reporting of methods used in Mendelian randomization studies. We did not assess whether the statistical method used to obtain an IV estimate was actually appropriate. We investigated whether the statistical method used was adequately described, whether it was consistent with the estimates reported and if any evident mistakes were made. Similarly, we focused on whether plausibility of MR assumptions was discussed, not on whether we considered them likely to hold.
With regard to the Mendelian randomization approach used, we found that a majority of studies performed some form of IV analysis, but a substantial proportion of studies used the genotype as a proxy for the exposure without performing a formal IV analysis. This raises the question whether either of these approaches, or the third option of comparing the observed and expected genotype-outcome association, should be preferred. This depends on the aim of the study: for a test of causality, testing the presence of a genotype-outcome association is sufficient.1,190 Often the aim will be a quantification of the causal effect of the exposure on the outcome. We note that IV analysis is more suited to this aim than a comparison of the observed and the expected effect of the genotype on the outcome, although some may find the latter approach more intuitive. Showing the association between the genotype (or genetic score) and the outcome is always advisable as it increases the transparency of the study by showing the data as they are. Further analyses can subsequently be undertaken.191 When considering whether a formal IV analysis is appropriate, further aspects of the underlying biology of the genotype-phenotype association need to be taken into account to avoid misleading inferences.192 A recent paper discusses a number of situations in which a formal IV analysis may give biased results, but a Mendelian randomization approach looking only at the genotype-outcome association can validly be used as a test of causality.190 Another recent paper specifically discusses smoking as an example of an exposure for which the measurement does not fully capture the underlying exposure, which gives a biased estimate of the effect of the measured exposure on the outcome if an IV analysis is performed in a Mendelian randomization study.4
With regard to the discussion of the Mendelian randomization assumptions, we found that fewer than half of studies adequately discussed all three assumptions. Some studies did mention what the assumptions are and how they can be violated in general terms, but did not discuss how plausible the assumptions were for the specific setting of their study. An aspect of the assumptions which can be evaluated using the data is whether there is an association between the genetic instrument and measured confounders. This may be more difficult for studies which use multiple study populations, but an effort to obtain this information from those studies in which it is available is warranted. Among the studies which performed an IV analysis in a single study population, we identified 14 studies in which SNPs were detected or selected, or genetic risk score weights were derived in that same study population. This can bias Mendelian randomization estimates.116,193 The number of studies in which we found this to have occurred may be an underestimation, because some study populations are used for multiple Mendelian randomization studies and the later studies may not report the detection of SNPs in a previous study in the same population.
With regard to the IV methods used, we found that two-stage least squares regression and a Wald-type/ratio estimator were the most commonly used methods. We also found that a considerable number of the Mendelian randomization studies which used IV methods estimated an odds ratio or risk ratio, especially in those studies which used data from multiple study populations. However, which methods are appropriate for IV estimation of causal odds ratios or risk ratios is a methodological challenge of IV analysis that has not yet been fully resolved. Several methodological studies have investigated this issue in recent years.194,194–198 One of the reviewed MR studies mentioned that the Wald-type estimator used to estimate an odds ratio was an approximate method.169 The properties and limitations of these IV methods used to estimate a causal odds ratio deserve more attention in the Mendelian randomization studies in which they are used.
Overall, we conclude from our review the standard of reporting of Mendelian randomization studies should be improved. Existing guidelines and recommendations for the reporting of IV analyses largely apply to Mendelian randomization studies (the extent depending on the Mendelian randomization approach used).7,8 In addition to these recommendations, we have formulated a checklist of Mendelian randomization-specific reporting recommendations in Box 1.
Box 1. Proposed checklist for reporting Mendelian randomization studies
Methods
If an expected genotype-outcome association is calculated, report how this was calculated and how the confidence interval was obtained. Take into account the variance of both the genotype-exposure and the exposure-outcome association.
If an instrumental variable analysis is performed, report in detail which method was used and how the confidence interval was obtained. For non-standard instrumental variable methods (e.g. methods used to estimate an odds ratio), discuss the properties of these methods.
If data from multiple populations are used, clearly explain how and at what stage the data/estimates were combined.
Results
Report the strength of the association between the genetic instrument and the exposure, using a partial F-statistic if possible.
Show the association between the genetic instrument and measured confounders. If multiple study populations are used, show this for those populations for which this information is available.
Report the association of the genotype and the outcome.
Discussion
Discuss the plausibility of the second and third instrumental variable assumptions in the specific setting of the study: could pleiotropy, linkage disequilibrium, canalization, population stratification or unmeasured confounding of the genotype-outcome relation affect results in this study?
In conclusion, studies stating that they perform a Mendelian randomization study within one study population broadly fall into three categories: studies using a genotype as a proxy for exposure without further estimation; studies performing IV analysis using a genotype as an instrument; and studies comparing observed and expected genotype-outcome associations. Plausibility of underlying Mendelian randomization assumptions is not always discussed, but as these assumptions are crucial for validity of MR studies, they should always be discussed in the specific context of the study. If IV methods are used to estimate a causal effect of the exposure, the statistical methods used should be clearly explained. Studies using data from multiple populations should also clearly report how data or estimates are combined.
Supplementary Data
Supplementary data are available at IJE online.
Funding
This work was supported by The Netherlands Organisation for Health Research and Development ZonMw [grant number 152002040].
Acknowledgements
We thank Ruifang Li for helping to extract the required information from an article published in Chinese. All authors contributed to the design of the study. A.G.C.B. performed the literature search and extracted the relevant data. All authors contributed to the interpretation of the data. A.G.C.B. drafted the article and S.l.C. and O.M.D. critically revised it. All authors approved the final version of the article. A.G.C.B. takes responsibility for the integrity of the data, the accuracy of the data analysis and the accuracy and completeness of references.
Conflict of interest: None declared.

