


Why was the cohort set up?
Epidemiological and animal research shows that disease aetiology often has to be evaluated with a life course perspective, starting as close to the time of conception as possible and, furthermore, that genetic predisposition, environmental exposures and social context have to be considered simultaneously.1 Exposures during the prenatal and postnatal periods have implications for children’s health and may also have implications for morbidity occurring later in life, including obesity and cardiovascular diseases, asthma and allergy, cancer, delayed neurodevelopment, mental illnesses and more.2 Birth cohort research has a long history in Europe and extensive collaborations have been established.3 The Rhea cohort is the only pregnancy cohort established and followed up in Greece and one of the very few cohorts in a large area in southern Europe and the eastern Mediterranean where birth cohort research has just started to emerge, and some of the circumstances observed in the Rhea population actually reflect patterns in this wider region. The research team of Rhea study specializes on specific research areas, including obesity, neurodevelopment and child asthma, but also addresses social, environmental and lifestyle factors specific to the Greek society such as use of pesticides, adherence to the Mediterranean diet or psychosocial factors at a time of economic crisis. The name of the cohort ‘RHEA’ is inspired by ‘Ρέα’ the mythological wife of Kronos (Cronus).
The Rhea study was established in 2007 in the island of Crete, aiming to recruit a representative sample of mother-child pairs from early pregnancy and to follow them up to young adulthood. The uniqueness of this cohort is that it takes place in the island of Crete where the beneficial effect of the Mediterranean diet was first described during the Seven Countries Study of Cardiovascular Diseases, started at the end of the 1950s. The typical Cretan Mediterranean diet was associated with lower incidence and mortality from cardiovascular diseases and also with the lowest death rates and the greatest survival rates.4 This has changed dramatically over the last 50 years, and the Rhea cohort was created in response to the rising concerns about the high rates of childhood obesity in Greece (more than 40% overweight and obese children at school age according to recent estimates).5
The general aims of the project are:
to characterize nutritional, environmental and psychosocial determinants of children’s growth and development;
to focus on four primary outcome areas of research: (i) offspring growth and obesity; (ii) neuropsychological and behavioural development; (iii) allergies and asthma in childhood; and (iv) genotoxicity;
to evaluate mother’s health during and after pregnancy;
and to evaluate the interaction between environmental stressors and genetic variants in children’s growth and health.
The Rhea study has been funded by various European grants since 2006 and by the Greek Ministry of Health (see Funding section). The funding has been continuous and has allowed the study to accomplish multiple follow-ups and to produce research and scientific results.
Who is in the cohort?
Pregnant women (Greek and immigrants) were recruited at the time of the first comprehensive ultrasound examination at around week 12 of gestation, from four antenatal clinics (two public and two private) in Heraklion city, covering the wider Heraklion region, during the 12-month period from February 2007 until February 2008. The inclusion criteria for study participants were: residents in the study area; pregnant women older than 16 years; first antenatal visit: hospitals or private clinics in Heraklion district; no communication handicap. Participants were invited to provide blood and urine samples and to participate in a face-to-face interview.
The flow diagram of Rhea cohort participation is described in Figure 1. During the study period, 1610 pregnant women agreed to participate and 1363 singleton pregnancies were followed up until delivery. Late recruitment at birth included additional 95 mother-child pairs. Table 1 describes characteristics of the Rhea study mothers at recruitment and delivery, and of their children at each postnatal visit.
Characteristics of mother-child pairs included in the RHEA cohort study
| Recruitment/birth | Birth/infancy (9 or 18 months) | Early childhood (4 years) | Mid-childhood (6 years) | |||||||
|---|---|---|---|---|---|---|---|---|---|---|
| N | % or mean (SD) | N | % or mean (SD) | N | % or mean (SD) | N | % or mean (SD) | |||
| Maternal characteristics | Infant characteristics | Child characteristics | ||||||||
| Maternal age (years) | 1470 | 29.4 (5.0) | Age (months) | 1294 | 9.5 (2.2) | Age (years) | 904 | 4.2 (0.2) | 626 | 6.7 (0.3) |
| Pre-pregnancy BMI (kg/m2) | 1373 | 24.4 (4.9) | Sex, n (%) | Sex, n (%) | ||||||
| Maternal residence, n (%) | Male | 767 | 50.4 | Male | 486 | 52.3 | 343 | 55.1 | ||
| Urban | 282 | 22.9 | Female | 755 | 49.6 | Female | 443 | 47.7 | 279 | 44.9 |
| Rural | 950 | 77.1 | Birthweight (kg) | 1427 | 3.1 (0.5) | Child’s BMI (kg/m2) | 624 | 17.0 (2.8) | ||
| Maternal origin, n (%) | Preterm birth, n (%) | Overweight/obesity, n (%) | ||||||||
| Greek | 1364 | 91.1 | Yes | 192 | 87.0 | No excess weight | 681 | 78.1 | 418 | 67.3 |
| Non Greek | 133 | 8.9 | No | 1283 | 13.0 | Overweight | 126 | 14.45 | 132 | 21.3 |
| Maternal education, n (%) | Rapid growth – 6 months, n (%) | Obese | 65 | 7.45 | 71 | 11.4 | ||||
| Low | 297 | 21.2 | Yes | 275 | 33.9 | Adherence to Mediterranean Diet | ||||
| Medium | 709 | 50.5 | No | 536 | 66.1 | Poor | 156 | 14.1 | 202 | 32.6 |
| High | 397 | 28.3 | Breastfeeding initiation | Average | 715 | 64.6 | 385 | 62.1 | ||
| Maternal working status, n (%) | Yes | 1113 | 83.8 | Good | 236 | 21.3 | 33 | 5.3 | ||
| Employed | 657 | 47.7 | No | 215 | 16.2 | Pre-/school attendance, n (%) | ||||
| Not working | 721 | 52.3 | Breastfeeding duration (months) | 1328 | 3.6 (4.0) | Yes | 768 | 85.2 | 628 | 100.0 |
| Maternal smoking during pregnancy, n (%) | Age of introduction to solid foods (months) | 1159 | 6.2 (0.9) | No | 133 | 14.8 | 0 | 0.0 | ||
| Non smoker | 779 | 56.3 | Nursery attendance, n (%) | Passive smoking at home, n (%) | ||||||
| Quit during pregnancy | 276 | 19.9 | Yes | 31 | 2.5 | Yes | 413 | 46.1 | 228 | 36.3 |
| Smoker | 330 | 23.8 | No | 1224 | 97.5 | No | 483 | 53.9 | 400 | 63.7 |
| Parity | Passive smoking at home, n (%) | Wheeze | ||||||||
| Primiparous | 620 | 43.3 | Yes | 164 | 13.1 | Yes | 13 | 1.5 | 58 | 9.3 |
| Multiparous | 812 | 56.7 | No | 1088 | 86.9 | No | 879 | 98.5 | 564 | 90.7 |
| Type of delivery, n (%) | Wheeze | Doctor-diagnosed asthma | ||||||||
| Vaginal | 723 | 48.6 | Yes | 317 | 25.3 | Yes | 48 | 5.4 | 57 | 9.1 |
| Caesarian | 766 | 51.7 | No | 937 | 74.7 | No | 844 | 94.6 | 567 | 90.9 |
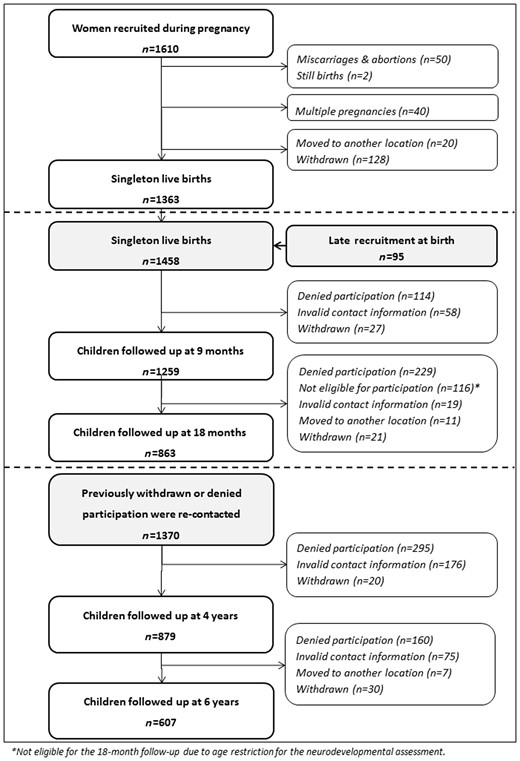
Rhea study flow diagram.
How often have they been followed up?
We initially contacted pregnant women in the first trimester of pregnancy at the time of the first routinely scheduled major ultrasound test (median 12 weeks of gestation). After the clinical visit was completed, specially trained midwives met privately with interested women to describe the study in greater detail, then obtained written informed consent and completed in person a detailed questionnaire on diet, environmental exposures and socio-demographic and lifestyle characteristics. Midwives measured height, weight and blood pressure and collected blood and urine samples from pregnant women. We next met pregnant women in the third trimester of pregnancy (median 32 weeks of gestation) when midwives administered questionnaires on maternal stress and collected urine samples and medical record information on pregnancy-related complications as well as fetal ultrasound measurements. During the birth admission (median 38 weeks of gestation) midwives measured the infant’s size (weight, length, anogenital distance and head circumference) and collected cord blood samples, as well as information on the type of delivery, infant sex and gestational age.
At 8–10 weeks after giving birth, mothers were approached by phone and provided information about symptoms of postnatal depression. Subsequently, we completed in-person clinical visits with mothers and children during infancy (median ages 9 and 18 months), early childhood (median 4.2 years) and mid-childhood (median 6.5 years). Briefly, visits included a detailed child clinical examination (anthropometry, blood pressure measurement, screening for atopic dermatitis), spirometry, neurodevelopmental assessment and biological sample collection (blood, urine and hair samples). Figure 2 summarizes the visit frequency and timing. The majority of clinical visits were conducted at the University Hospital of Heraklion in Greece, but for families living in rural areas of Crete, we also organized visits at four Rural Health Services in Crete. At each visit, we obtained written informed consent from the mothers and the Ethics Committee of the University Hospital at Heraklion approved the study protocols.
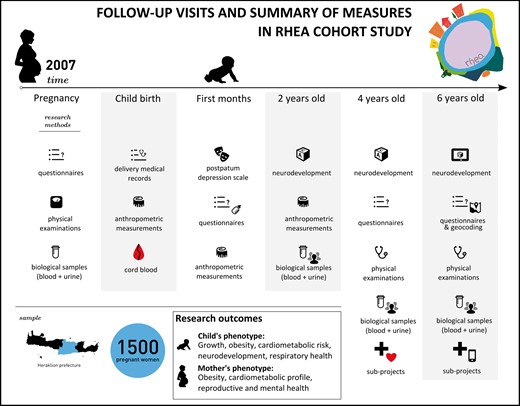
Schedule of study visits and summary of measures at each visit.
Major efforts have been made by the study staff to keep the families involved in the study and minimize losses to follow-up. Specific strategies implemented to retain the study sample are described below:
Personal invitations were sent to all participants by post before each follow-up, including informative bulletins to keep the families updated with the study.
Personal feedback related to child’s growth measurements was given to the families after the clinical examination. In cases of overweight/obese children or with signs of neurodevelopmental delay, parents were advised to have an additional appointment with an expert.
During the 4th and 6th year follow-ups, children who provided biological samples received feedback concerning their blood measurements.
Research assistants focus on having a more personal communication with the families, responding promptly to questions or problems.
Of the 1458 children (singleton births) followed up until delivery, including the later-recruited mother-child pairs at birth, 879 children completed the early childhood follow-up and 607 children the mid-childhood follow-up. Children who attended the follow-up tended to have older parents who were married, of higher education and of Greek origin. Attrition at follow-up was mainly due to withdrawal, difficulty in keeping track of changed addresses and telephone numbers, emigration, children’s severe illness and mothers’ unwillingness to attend the in-person visits (Figure 1). In most analyses, in order to account for missing data we used chained equations to multiply impute missing values.
What has been measured?
Tables 2 and 3 provide an overview of exposure and outcome data collected at different time points during the study. Exposure variables assessed via questionnaires include parental socio-demographic and lifestyle characteristics (smoking habits, sleep patterns, sedentary behaviours, physical activity, nursery attendance, hours spent with the child), pregnancy and delivery characteristics, household information (pets, moisture/moulds in house, bedroom location, cleaning products) and environmental factors (water use, pesticides use, sun exposure, noise, air pollution).
Data collected on maternal and child exposures in the RHEA cohort study
| Biomarkers | Sample type | Prenatal | Birth | 2 years | 4 years | 6 years |
|---|---|---|---|---|---|---|
| Environmental pollutants | ||||||
| Cotinine | Urine | ✓ | ✓ | |||
| Acrylamide | Red cells | ✓ | ✓ | |||
| Dioxin-like activity (DR Calux) | Serum | ✓ | ✓ | |||
| DNA adducts | Lymphocytes | ✓ | ✓ | |||
| Metals (Pb, Sb, Cd, Mo, Se, As, Zn, Cu, Co, Fe, Mn, Mg, Ca, B, Li) | Urine/whole blood | ✓ | ✓ | |||
| Persistent organic pollutants (DDT/DDE, HCB, PCBs, PBDEs) | Serum | ✓ | ✓ | |||
| Non-persistent pollutants | ||||||
| Bisphenol A (BPA) | Urine | ✓ | ✓ | ✓ | ✓ | |
| Organophosphate pesricides | Urine | ✓ | ✓ | |||
| Phthalate metabolites | Urine | ✓ | ✓ | ✓ | ✓ | |
| Parabens | Urine | ✓ | ✓ | ✓ | ✓ | |
| Other | ||||||
| THMs | Water | ✓ | ||||
| Air pollution | Air | ✓ | ||||
| Lipids (HDL, LDL, cholesterol, triglycerides) | Serum | ✓ | ✓ | ✓ | ||
| Glucose, insulin | Serum | ✓ | Glucose | Glucose | ||
| Creatinine | Serum/urine | ✓ | ✓ | ✓ | ✓ | |
| Micronutrients (P, Ca, Mg, Fe) | Serum | ✓ | ✓ | |||
| Fatty acids | Serum | ✓ | ||||
| Vitamin B12 | Serum | ✓ | ✓ | |||
| Folate | Serum | ✓ | ✓ | |||
| Vitamin D | Serum | ✓ | ||||
| Thyroid hormones (FT4, TSH, F4) | Serum | ✓ | ✓ | |||
| Adipokines (leptin, adiponectin) | Serum | Leptin | ✓ | |||
| Inflammatory markers (IL1β, ΙL6, IL8, IL10, IL17α, IFNγ, TNFα, MIP1α) | Serum | ✓ | ✓ | |||
| C-reactive protein | Serum | ✓ | ✓ | |||
| Serology (Helicobacter pylori, EBV, CMV, HSV-1, HSV-2, HHV-8, BKPyV, JCPyV, KIPyV, WUPyV, MCPyV, TSPyV, HPyV9, HPyV10) | Serum | ✓ | ✓ | |||
| Questionnaires | ||||||
| Parental occupation & education | ✓ | ✓ | ✓ | ✓ | ✓ | |
| Maternal mental health | ✓ | |||||
| Sleep | ✓ | ✓ | ✓ | |||
| Physical activity | ✓ | ✓ | ✓ | |||
| Breastfeeding | ✓ | ✓ | ||||
| Diet and eating behaviour | ✓ | ✓ | ✓ | |||
| Smoking/passive smoking | ✓ | ✓ | ✓ | ✓ | ✓ | |
| Alcohol consumption | ✓ | |||||
| Medicine intake | ✓ | ✓ | ✓ | ✓ |
TSH, thyroid stimulating hormone; free T4, free thyroxine; IFNγ, interferon gamma; IL, interleukin, TNF α, tumour necrosis factor α; MIP1a, macrophage inflammatory protein 1-alpha; BPA, bisphenol A; OP pesticides, organophosphate pesticides; THMs, trihalomethanes; EBV, Epstein-Barr virus; CMV, cytomegalovirus; HSV-1, herpes simplex virus 1; HSV-2, herpes simplex virus 2; HHV-8, human herpesvirus 8; BKPyV, BK polyomavirus; JCPyV, JC polyomavirus; KIPyV, KI polyomavirus; WUPyV, WU polyomavirus; MCPyV, Merkel cell polyomavirus; TSPyV, trichodysplasia spinulosa polyomavirus; HPyV9, human polyomavirus 9; HPyV10, human polyomavirus 10.
Data collected on maternal and children’s health outcomes in the RHEA cohort study
| Outcome | Type of measurement | Birth | 9 months | 18 months | 4 years | 6 years |
|---|---|---|---|---|---|---|
| Birth size | Gestational age | ✓ | ||||
| Weight | ✓ | |||||
| Length | ✓ | |||||
| Head circumference | ✓ | |||||
| Waist circumference | ✓ | |||||
| Apgar score | ✓ | |||||
| Fat mass (skinfold thickness) | ✓ | |||||
| Anogenital distances | AGD | ✓ | ✓ | |||
| Postnatal growth | Weight | ✓ | ✓ | ✓ | ✓ | |
| Length/height | ✓ | ✓ | ✓ | ✓ | ||
| Head circumference | ✓ | ✓ | ✓ | ✓ | ||
| Waist circumference | ✓ | ✓ | ✓ | |||
| Mid-arm circumference | ✓ | ✓ | ✓ | |||
| Fat mass (skinfold thickness) | ✓ | ✓ | ||||
| Body composition | BIA | ✓ | ||||
| Blood pressure | Systolic/ Diastolic | ✓ | ✓ | |||
| Lung function | Spirometry | ✓ | ✓ | |||
| Asthma/wheeze | Questionnaire | ✓ | ✓ | ✓ | ||
| Food allergy | Questionnaire | ✓ | ✓ | ✓ | ||
| Dermatitis/eczema | Questionnaire | ✓ | ✓ | ✓ | ||
| Infections | Questionnaire, antibodies | ✓ | ✓ | |||
| Neurodevelopment | ||||||
| Bayley’s Toddler Scales | Clinical assessment | ✓ | ||||
| McCarthy Scales | Clinical assessment | ✓ | ||||
| ADHD test | Questionnaire | ✓ | ||||
| SDQ | Questionnaire | ✓ | ||||
| K-CPT | Computer test | ✓ | ||||
| Conner’s | Questionnaire | ✓ | ||||
| CBCL | Questionnaire | ✓ | ||||
| Raven test | Computer test | ✓ | ||||
| Attention Network Test | Computer test | ✓ | ||||
| Trail Making Test | Computer test | ✓ | ||||
| N-back test | Computer test | ✓ | ||||
| Autism (M-CHAT) | Questionnaire | ✓ | ||||
| Finger-tapping test | Computer test | ✓ | ||||
| Genotoxicity | Micronuclei frequencies (blood samples) | ✓ | ✓ |
AGD, anogenital distance; BIA, bioelectric impedance analyses; ADHD, attention-deficit/hyperactivity disorder; SDQ, strengths and difficulties questionnaire; CBCL, child behaviour checklist.
Diet
Dietary habits of pregnant women have been assessed with the use of a validated food frequency questionnaire (FFQ), completed in mid-pregnancy (14th–18th weeks of gestation). We assessed infant feeding (breastfeeding, use of infant formula, age of introduction to solid foods) via an interview-administered questionnaire at 9 and 18 months. Dietary assessment at 4 and 6 years of age was performed with the use of a validated6 semi-quantitative FFQ. We also used the Children’s Eating Behaviour Questionnaire (CEBQ) to assess children’s eating behaviour, in a subsample of the Rhea study.7
Environmental exposures
We have extensive, multimodal and repeated assessments of environmental exposures in both mothers and children from parental questionnaires, biological samples and environmental measurements. To date, we have measured more than 100 different chemicals in collected biospecimens (blood, urine and hair samples). These include heavy metals, tobacco smoke metabolites, polychlorinated biphenyls (PCBs), dioxins, organochlorine pesticides [dichlorodiphenyl dichloroethene (DDE), dichlorodiphenyl trichloroethane (DDT) and hexachlorobenzene (HCB)], phthalate metabolites, environmental phenols, perfluoroalkyl substances, bisphenol A (BPA), parabens and organophosphate pesticide metabolites. For many chemicals, we have multiple measures during pregnancy and childhood. Chemicals in drinking water and outdoor air pollution (ESCAPE protocol) have been measured.
Health outcomes
The primary outcomes of the Rhea study are pregnancy and birth outcomes, offspring obesity and cardiometabolic risk factors, asthma and atopy, and neuropsychological and behavioural development. Fetal growth data including femoral length, biparietal diameter and head and abdominal circumferences were obtained during regular clinic visits the second and thirdrd trimesters by ultrasound measures. Child anthropometry measures included weight, length/ height and head circumference at birth, plus waist circumference and mid-upper arm and skinfold thickness at four sites of the body (subscapular, triceps, suprailiac and thigh) in infancy and early childhood (4- and 6-year follow-up) with very good intra-observer and inter-observer reliability. In mid-childhood (6-year follow-up) we additionally performed fat mass measurements by bioelectrical impedance analysis. Internal gender- and age–adjusted growth curves have been created within the cohort, which allow estimation of individual growth patterns.
Anogenital distance (the distance from the anus to the genitalia) measurements at birth and early infancy (mean age17.5 ± 6.8 months) were performed in 897 children using Vernier digital callipers.8–10
We assessed wheeze and asthma symptoms by questionnaire in infancy and early and mid-childhood, and lung function via spirometry at the 4- and 6-year follow-ups. Novel asthma and allergy phenotypes have been defined based on the Mechanisms of the Development of ALLergy (MeDALL) protocol.11
Neurodevelopment has been an important outcome for many analyses in the Rhea cohort. Experienced psychologists carried out the first assessment at 18 months using the Bayley Scales of Infant and Toddler Development (Bayley-III).12 At 4 years, trained psychologists evaluated children’s abilities through the McCarthy Scales of Children Abilities13 and parents completed two other questionnaires regarding the presence and the severity of certain symptoms and behaviours of their children: the Attention-Deficit/Hyperactivity Disorder Test (ADHDT)14 and the Strengths and Difficulties Questionnaire (SDQ).15 Neurodevelopmental outcomes at 6 years were assessed through a battery of internationally standardized computer tests (N-BACK, Attention Network Test, Trail Making Test, Raven). Parents completed the Conners’16 and Child Behaviour Checklist (CBCL)17 questionnaires evaluating child’s behavioural and emotional problems.
We assessed maternal mental health (anxiety, depressive symptoms and personality characteristics) during pregnancy and postpartum (8–10 weeks after delivery) with the use of self-administered questionnaires, and maternal cognition with the use of Raven’s Standard Progressive Matrices.18,19
Finally, we measured micronuclei (MN) frequencies in blood samples collected at pregnancy, birth and at 4 years of age. MN frequencies are biomarkers of early genetic effects that have been used to investigate the association between environmental exposures and cancer. We carried out the cytokinesis-block micronuclei (CBMN) assay using whole blood according to the standardized protocol for the semi-automated image analysis system.20–22 We recorded the total numbers of bi-nucleated T lymphocytes and calculated MN frequency per 1000 bi-nucleated T lymphocytes.
The Rhea biobank
We designed our biospecimen collection to identify unique windows of vulnerability to early life stressors during gestation or childhood (Table 2). Blood samples have been collected from pregnant women (n = 1400) and from children at birth (n = 900), at 4 years (n = 815) and at 6 years of age (n = 550). Urine samples are also available, collected during pregnancy (n = 1300), at 2 years (n = 390), at 4 years (n = 845) and at 6 years of age (n = 614). DNA has been extracted from 1300 pregnancy blood samples, 820 cord blood samples at birth and 670 blood samples at 4 years of age. Other biological samples include child saliva and hair samples collected at 2 years and 6 years of age. All samples have been processed within 2 h from sampling time, and aliquots of urine, whole blood, serum, plasma, red blood cells and buffy coat are currently stored in ultra-low-temperature freezers (−80°C). All data generated within the Rhea cohort, including those measured through laboratory assays, are identified by a unique ID code for each sample. Thus, personal details (e.g. name, surname, birth date) never appear on the samples and the generated data are untraceable.
What has it found? Key findings and publications
The Rhea project is still ongoing, with the analysis of data now in progress. The first paper based on Rhea data was published in 2009.23 The Rhea website gives updated references with a Pubmed link to all Rhea publications [http://www.rhea.gr/en/publications/]. A summary of published articles within the framework of the Rhea birth cohort study is given in Table 4. We also provide below a selection of key findings from the core topics of the Rhea study.
Summary table of published articles of the RHEA cohort study
| Exposures | Main findings | References |
|---|---|---|
| Diet and nutrition | A higher adherence to the Mediterranean diet during pregnancy was associated with increased birthweight and length in smoking mothers, lower risk for postpartum depression, and lower adiposity and blood pressure in childhood | 24–26 |
| High red meat intake during pregnancy was associated with increased micronuclei frequency in pregnant women and higher risk of child wheeze in the first year of life | 27,28 | |
| High doses of supplementary folic acid in early pregnancy (5 mg/day) were found to be protective for preterm birth and small-for-gestational-age neonates, and were associated with enhanced vocabulary development, communicational skills and verbal comprehension at 18 months of age | 58,59 | |
| Longer duration of breastfeeding was associated with increased scores in cognitive, language and motor development at 18 months of age; unhealthy food choice,s characterized by processed and high-sugar foods, were associated with lower scores in verbal ability, general cognitive ability and cognitive functions of the posterior cortex at preschool age; child eating behaviours, such as emotional overeating, were associated with increased ADHD symptoms | 29,30,60 | |
| Environmental exposures | Active and passive smoking during pregnancy was associated with lower birthweight and impaired gross motor ability at 18 months of age | 61,62 |
| Prenatal exposure to organochlorine pesticides (DDE, HCB), PCBs and dioxins was associated with higher risk for GDM, adverse birth outcomes, shorter anogenital distance in infants, higher adiposity and blood pressure and reduced cognitive development in preschool children | 31–35,63 | |
| Elevated cadmium exposure during pregnancy was inversely associated with children’s cognitive function measured at preschool age | 36 | |
| Infections | Early childhood multi-infection with ≥ eight polyomaviruses was associated with lower ADHD symptoms; seropositivity to a potential neurotropic virus (BKPyV) was associated with increased ADHD symptoms at preschool age | 42,43 |
| Maternal mental health | Poor perinatal maternal mental health was associated with higher risk for postpartum depression, adverse birth outcomes and delays in offspring neurodevelopment at 18 months of age | 44–46 |
| Maternal weight status, metabolic and hormone profile | Adverse metabolic profile in pregnancy was associated with higher risk for GDM and increased risk of preterm birth | 23,37 |
| Leptin levels at birth and at age 4 were positively associated with birthweight and postnatal BMI gain | 64,65 | |
| Maternal pre-pregnancy obesity and excess gestational weight gain were associated with greater risk of child adiposity, reduced child cognitive development at early ages and increased behavioural problems, and ADHD symptoms in childhood | 39,41,66 |
DDE, dichlorodiphenyldichloroethene; HCB, hexachlorobenzene; PCBs, polychlorinated biphenyls; GDM, gestational diabetes mellitus.
Early life adherence to a healthy diet
We have shown that a high adherence to the Mediterranean diet during pregnancy was associated with increased birthweight and length in smoking mothers,24 lower risk of postpartum depression25 and lower adiposity and lower blood pressure in childhood.26 High red meat intake during pregnancy was associated with increased micronuclei frequency in pregnant women and higher risk of child wheeze in the first year of life.27,28 Children who had unhealthy food choices at preschool age, characterized by processed and high-sugar foods, scored lower in verbal ability, general cognitive ability and cognitive functions of the posterior cortex.29 Child eating behaviours such as food responsiveness and emotional overeating were associated with increased ADHD symptoms in preschool children.30
Early life exposure to persistent organic pollutants and metals
Prenatal exposure to HCB, DDE and PCBs was associated with lower birthweight,31,32 increased risk of childhood obesity, higher blood pressure levels33 and reduced cognitive development at 4 years of age.34 Low-level prenatal exposure to dioxin and dioxin-like compounds was associated with shorter anogenital distance in boys.35 Elevated cadmium exposure during pregnancy was inversely associated with children’s cognitive function measured at preschool age.36
Maternal obesity and hormone status during pregnancy
Women with metabolic syndrome in early pregnancy were at high risk for gestational diabetes mellitus (GDM)37 and preterm birth.23 We further analysed molecular signatures associated with maternal metabolic profile by measuring urinary metabolomics in early pregnancy, and showed that a number of urinary metabolites (acetate, formate, tyrosine and trimethylamine) were inversely associated with both fetal growth restriction and maternal insulin levels, suggesting a potential complex relationship between maternal glucose metabolism and adverse birth outcomes.38 Maternal pre-pregnancy overweight/obesity was a strong indicator of offspring obesity and central adiposity,39 and was associated with reduced child cognitive development in infancy40 and early childhood,41 and increased behavioural problems and attention-deficit hyperactivity disorder (ADHD) symptoms at 4 years of age.41
Infections
We measured IgG seroreactivity against polyomaviruses, herpesviruses and H. Pylori using multiplex technology, in blood samples collected at birth and at 3 and f4 years of age. We showed that early life social and environmental characteristics determine acquisition of polyomaviruses and herpesviruses in childhood.42 Seropositivity to a potential neurotropic virus (BKPyV) was associated with increased ADHD symptoms at preschool age, whereas early childhood multi-infection to ≥ 8 polyomaviruses was associated with lower ADHD symptoms.43
Maternal mental health
Among maternal personality traits assessed during pregnancy, we found that neuroticism which predisposes to negative mood was associated with increased risk for fetal weight growth restriction and fetal head circumference growth restriction.44 Antenatal maternal trait anxiety and depression were associated with higher risk for developing depressive symptomatology at 8 weeks postpartum.45 Both antenatal and postnatal depression were, independently of each other, associated with delays in offspring neurodevelopment at 18 months of age.46
What are the main strengths and weaknesses?
The main strengths of Rhea cohort are its general population basis with the inclusion of women from different socioeconomic backgrounds at early pregnancy, the in-person collection of a large variety of exposures and outcome measures, the availability of repeated measures, and the extensive biobank. Clinical phenotyping assessment was conducted by trained and expert staff for the mother firstt and third trimesters of pregnancy) and for the child (birth, 18 months, 4 years, 6 years). We used standardized questionnaires, personal monitors and extensive biological collection to enrich the data collection. All research staff were unaware of the children’s exposures and health outcomes which could otherwise contribute to differential bias.
Weaknesses include the loss to follow-up over time, and lack of statistical power to study rare outcomes. Attrition bias is an issue in most prospective longitudinal studies and is a big challenge, as participating families should be engaged for long-term follow-up. In the Rhea cohort, non-participants were more likely to have a lower socioeconomic status compared with participants, and this may have introduced bias in the estimation of some effects. Big efforts have been constantly made to retain all mother-child pairs in the cohort, by periodic newsletters, the web page and personal and regular contact with the families by our research assistants. Our sample size does not allow the study of rare categorical outcomes or extreme values for continuous traits unless data are pooled with those of other cohorts. To enhance scientific quality, we have participated in international collaborations of birth cohort studies, to study the impact of early life stressors on birth and child health outcomes.32,40,47–57
Can I get hold of the data? Where can I find out more?
The Rhea cohort is involved in many national and international collaborations and we welcome collaboration with other researchers. Investigators interested in collaborating with the Rhea cohort team can contact the principal investigators Leda Chatzi [lchatzi@uoc.gr] and Manolis Kogevinas [manolis.kogevinas@isglobal.org] to complete a detailed analysis plan for evaluation by the Rhea study steering committee. Alternatively, the Rhea website [www.rhea.gr] provides details of how to submit expressions of interest and has short proformas for these. All suggestions will be reviewed by the Rhea study steering committee on a monthly basis, and we aim to get back to potential collaborators within 2 months.
The Rhea cohort is a pregnancy cohort investigating how early life nutritional, environmental and social stressors may affect child health and development.
Pregnant women (n = 1610) residing in the prefecture of Heraklion in Crete, Greece, were recruited at the time of the first major ultrasound (median 12 weeks of gestation), from February 2007 to March 2008.
Follow-up of exposure and health outcomes was done through several contacts from pregnancy until 6 years of age. Clinical phenotyping assessment was conducted by trained and expert staff for the mother (first and third trimesters of pregnancy) and for the child (birth, 18 months, 4 years, 6 years).
The main outcomes of interest are fetal (via ultrasound) and postnatal growth, obesity, cognitive and behavioural development, asthma and atopy. The main early life stressors studied are diet, environmental pollutants (atmospheric pollutants, organochlorine compounds, phenols, phthalates, heavy metals and water pollutants), hormone imbalance and psycho-emotional factors. An extensive biobank with repeated measurements has been created including urine, plasma, serum, extracted DNA and RNA and several omics and biomarkers.
Requests for data and collaborations are welcome. Those interested should contact the principal investigators Leda Chatzi [lchatzi@uoc.gr] and Manolis Kogevinas [manolis.kogevinas@isglobal.org].
Funding
We acknowledge all funding sources for the Rhea study: the European Union H2020 (LIFECYCLE), FP7 (HELIX, CHICOS, EnviroGenomarkers, ENRIECO, ESCAPE) and FP6 (HiWate, NewGeneris) programmes. The National Strategic Reference Framework (ESPA) 2007–13, the General Secretariat for Research and Technology in Greece and the Research Committee of the University of Crete, Greece. Funders had no influence of any kind on analyses or results interpretation.
Acknowledgements
We are extremely grateful to all the families who took part in the Rhea study, the midwives, research assistants and psychologists for recruiting and following them, and the whole Rhea team, including research scientists, biologists and technicians for their commitment and their role in the success of the study. We thank Mariona Bustamante (CREAL, Barcelona, Spain) for maintaining the Rhea DNA biobank. We also thank Athanasios Karachalios for his help in the preparation of Figure 2.
Conflict of interest: None declared.

