


Abstract
Elevated serum concentrations of human epididymis protein 4 (HE4) have appeared in a large number of female patients with chronic kidney disease (CKD). However, it is unknow whether HE4 could be a potential biomarker for diagnosis of CKD.
To evaluate whether serum HE4 is a potential biomarker of CKD in our cohort of 238 ethnic Han Chinese female patients, between the ages of 19 and 89 years.
We selected 230 healthy control individuals and 238 female patients with CKD for inclusion in our study. We acquired their demographic characteristics and evaluated their renal function by measuring serum creatinine, blood urea nitrogen, and uric acid levels. The serum concentrations of HE4 were quantified via chemiluminescence immunoassay.
Serum HE4 levels were significantly higher in the patients with CKD compared with controls (P <.001). Meanwhile, HE4 levels showed significant differences among 5 CKD subgroups via multiple comparison (P <.05) and presented significantly better diagnostic value than other indicators. Also, the results of binary logistic regression analysis indicated that HE4 showed significant correlation with the prevalence of CKD (P <.001) and had a larger odds ratio (OR) value.
HE4 can serve as a potential biomarker for prediction of CKD and has important reference value for CKD staging.
In 2002, the National Kidney Foundation’s Kidney Disease Outcomes Quality Initiative (KDOQI) introduced the definition and classification of chronic kidney disease (CKD) for the first time.1,2 The guidelines represented an important shift towards the recognition of CKD as a public health problem that should be managed in its early stages.3Kidney Disease: Improving Global Outcomes (KDIGO) provided a clear explanation to the nephrology and nonnephrology communities of the evidence base for the definition and classification recommended by KDOQI.4 CKD, characterized by a gradual loss of kidney function over time,5 is a worldwide public health problem. There is an increasing incidence of CKD, which yields high costs, poor outcomes,6 and adverse outcomes that include end-stage renal disease (ESRD),7 cardiovascular disease (CVD),8,9 and premature death. Findings of recent studies have shown that the mean global prevalence of CKD is 13.4% in stages 1 to 5,10 and the morbidity of CKD in China is as high as 13%.11 Therefore, accurate and prompt detection methods or diagnostic indicators are strongly needed to identify CKD.
Human epididymis protein 4 (HE4) was first identified as a proteinase inhibitor in the epididymis in 1991 and was discovered to affect the maturation of sperm.12,13 In addition to epididymis, HE4 has been detected in the respiratory tract, nasopharynx, salivary glands, kidneys, and in high amounts in ovarian tissue.14 The results of previous studies15-17 have proven that HE4 serves as a valuable serum biomarker of ovarian cancer. However, recently, elevated serum concentrations of HE4 have been observed in many female patients with CKD. Thus, we hypothesize that serum HE4 may be a new potential biomarker of CKD. This retrospective observational study aims to evaluate whether serum HE4 is a potential biomarker of CKD in female patients.
Materials and Methods
Patients and Healthy Subject Individuals
The whole study was supervised under the Ethics Committee of Renmin Hospital of Wuhan university. The consent procedure was based on the standard procedure. In this study, we enrolled 238 female patients with CKD (estimated glomerular filtration rate [eGFR] <90 mL/min/1.73 m2) who were hospitalized at Renmin Hospital of Wuhan University, Hubei Province, China, and 230 healthy controls (eGFR> 90 mL/min/1.73 m2). Patients with normal ovarian function who did not accept dialysis therapy were eligible for inclusion. Patients who were diagnosed with acute kidney function deterioration or malignant neoplasms were excluded. Healthy controls were defined as healthy individuals without any known major disease.
Blood Specimen Collection and Laboratory Analysis
We collected blood specimens from antecubital veins of the patients and heathy controls, who were in a resting state and had been fasting for at least 8 hours. Serum concentrations of HE4 were measured via electrochemiluminescence immunoassay (Cobas e 601, F. Hoffmann-La Roche Ltd.) Here’s the detection principle of HE4. The HE4 in the blood specimen, biotinylated monoclonal HE4 antibody, and ruthenium-labelled HE4 antibody form a sandwich compound, which is combined with the streptomycin avidin-coated magnetic bead in the analyzer. The magnetic beads are adsorbed on the electrode surface through electromagnetic interaction; then, uncombined materials are removed. When the electrode voltage reaches a certain level, chemical luminescence from the compound can be detected, and luminous intensity can be measured via photomultiplier (precision, coefficient of variation [CV] <5%; analytic measurement range, from 15 to 1500 pmol/L; detection limit, 5 pmol/L).
Also, we tested levels of serum creatinine (SCr), blood urea nitrogen (BUN), and uric acid (UA) using the Siemens ADVIA 2400 automatic biochemistry analyzer (Siemens AG). Glomerular filtration rate (GFR) was estimated using the Modification of Diet in Renal Disease (MDRD) Study equation, using coefficients corrected for the ethnic Chinese population based on the following concentration:1, 18-19
Statistical Analysis
The normality test of the data was checked by the results of Kolmogorov-Smirnov testin. Normally distributed quantitative values of laboratory parameters were expressed as mean (SD). For skewed data, we used median and interquartile range (IQR). Differences in means were compared using the independent Student's t-test (2 groups) or analysis of variance (ANOVA; multiple groups) for normally distributed data. However, if the data were not normally distributed, the Mann-Whitney U test was used. We evaluated correlations between continuous variables via Spearman rank correlation analysis (Pearson correlation analysis, if normally distributed). We performed binary logistic regression analysis to evaluate the relationship between CKD and the parameters. Receiver operating characteristic (ROC) curves were constructed to assess sensitivity, specificity, and area under the curve (AUC), with a 95% confidence interval (CI) for CKD. A 2-sided value of P < 0.05 was considered statistically significant. All statistical tests were performed using SPSS software, version 20.0 (SPSS Inc).
Results
Characteristics of the Study Population
The clinical characteristics of the controls and the female patients with CKD are presented in Table 1. Serum HE4 levels were significantly higher in the female patients with CKD compared with the controls (P <.001). The median SCr level was 274 μmol/L in patients with CKD, which is statistically significant higher than that in the controls (P <.001). However, there was no statistically significant difference in age between patients with CKD and controls (P = .12). The Hb concentrations were lower in patients with CKD than in controls (P <.001). In contrast, levels of BUN and UA were significantly higher in the patients with CKD compared with the controls (P <.001 for each group Also, the rates of systolic blood pressure (SBP) and diastolic blood pressure (DBP) in patients with CKD were significantly higher than those in the controls (P <.001 for each group).
Clinical Characteristics and Laboratory Indicators of the Studied Patients With CKD and Control Individuals
| Variable | Control Individuals (n = 230) | Patients with CKD (n = 238) | P Value |
|---|---|---|---|
| Age (y), mean (SD) | 59.20 (14.11) | 61.26 (14.38) | .12 |
| SBP (mmHg), median (IQR) | 140 (130–158) | 230 (110–126) | <.001 |
| DBP (mmHg), median (IQR) | 74 (66–80) | 80 (70–90) | <.001 |
| SCr (μmol/L, mg/dL), median (IQR) | 53 (47–59), 0.60 (0.53–0.67) | 274 (130–565), 3.10 (1.47–6.39) | <.001 |
| BUN (mmol/L, mg/dL), mean (SD) | 4.80 (1.44), 13.44 (4.03) | 15.29 (9.18), 42.83 (25.71) | <.001 |
| UA (μmol/L, mg/dL), mean (SD) | 278.63 (72.07), 4.64 (1.20) | 435.20 (142.01), 7.25 (2.37) | <.001 |
| Hb (g/L, g/dL), median (IQR) | 126 (120–133), 12.6 (12.0–13.3) | 87 (76–104), 8.7 (7.6–10.4) | <.001 |
| HE4 (pmol/L), median (IQR) | 53.92 (44.59–67.07) | 579.75 (250.53–1494.25) | <.001 |
CKD, chronic kidney disease; SBP, systolic blood pressure; IQR, interquartile range; DBP, diastolic blood pressure; SCr, serum creatinine; BUN, blood urine nitrogen; UA, uric acid; Hb, hemoglobin; HE4, human epididymis protein 4.
Comparison of Laboratory Indicators Among the Control Group and CKD Subgroups
The concentrations of laboratory indicators in 5 groups are listed in Table 2; for these indicators, we calculated the analysis of variance (ANOVA). SCr and HE4 levels showed statistically significant differences among 5 groups via multiple comparison, respectively (P <.05). Also, serum HE4 and SCr concentrations were higher in more-advanced CKD stages.
Comparison of Laboratory Indicators Among the Control Group and CKD Stagesa
| Variables | Control Individuals (n = 230) | CKD2 (n = 27) | CKD3 (n = 50) | CKD4 (n = 41) | CKD5 (n = 120) |
|---|---|---|---|---|---|
| HE4 (pmol/L)b | 53.92 (44.59–67.07) | 131.70 (105.00–161.80) | 220.50 (167.90–374.03) | 427.60 (328.00–504.40) | 1388.00 (830.83–1500.00) |
| SCr (μmol/L,mg/dL)b | 53 (47–59), 0.60 (0.53–0.67) | 73 (63–77), 0.83 (0.71–0.87) | 115 (99–138), 1.30 (1.12–1.56) | 209 (178–256), 2.36 (2.01–2.89) | 560 (415–686), 6.33 (4.69–7.76) |
| UA (μmol/L, mg/dL) | 280 (229–321), 4.67 (3.82–5.35) | 353 (262–416), 5.88 (4.37–6.93) | 401 (339–499), 6.68 (5.65–8.31) | 451 (379–508), 7.52 (6.32–8.47) | 424 (355–562), 7.07 (5.92–9.37) |
| BUN (mmol/L,mg/dL) | 4.79 (3.7–5.6), 13.42 (10.36–15.69) | 6.86 (5.59–8.6), 19.22 (15.66–24.09) | 7.18 (5.95–9.66), 20.11 (16.67–27.06) | 11.52 (8.90–17.05), 32.27 (24.93–47.76) | 19.18 (14.11–25.20), 53.73 (39.52–70.59) |
CKD, chronic kidney disease; HE4, human epididymis protein 4; SCr, serum creatinine; UA, uric acid; BUN, blood urine nitrogen.
aCKD stage was defined as followed: CKD2, estimated glomerular filtration rate (eGFR) of 60–89 mL/min/1.73 m2; CKD3, eGFR of 30–59 mL/min/1.73 m2; CKD4, eGFR of 15–29 mL/min/1.73 m2; and CKD5, eGFR of <15 mL/min/1.73 m2.bCalculated by analysis of variance (ANOVA). SCr and HE4 levels showed statistically significant differences among 5 groups via multiple comparison, respectively (P <.05).
Correlations Between GFR and Laboratory Indicators in Patients With CKD
Subsequently, Spearman rank correlation analysis was performed to evaluate the association between GFR and laboratory indicators or HE4 in patients with CKD. The results showed that the levels of GFR were significantly and negatively correlated with serum levels of HE4, BUN, and UA (Figure 1A, P <.001; Figure 1B, P <.001; Figure 1D, P <.001, respectively). Meanwhile, we observed a strong positive correlation between HE4 and SCr values (Figure 1C, P <.001), whereas modest positive correlations between HE4, UA, and BUN values were shown (Figure 1E, P <.001; Figure 1F, P <.001, respectively).
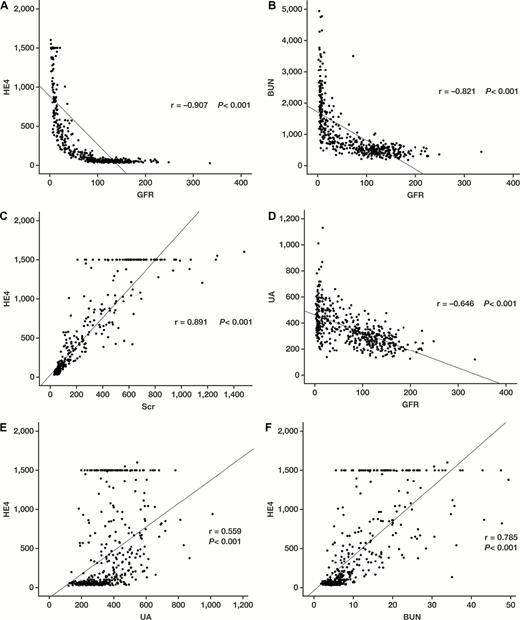
Results of Spearman rank correlation analysis, performed to evaluate the association between glomerular filtration rate (GFR) or human epididymis protein 4 (HE4) and various analytes in patients with chronic kidney disease (CKD). A, HE4 and GFR association. B, Blood urea nitrogen (BUN) and GFR association. C, HE4 and serum creatinine (SCr) association. D, Uric acid (UA) and GFR association. E, HE4 and UA association. F, HE4 and BUN association.
Diagnostic Performance of HE4 and Other Laboratory Indicators for CKD
Receiver operating characteristic (ROC) curves were used to investigate the diagnostic value and predictive power of laboratory indicators for CKD. As shown in Table 3 and Figure 2, serum HE4 has larger AUC values, compared with SCr, BUN, and UA values. Therefore, serum HE4 showed significantly better diagnostic value than other laboratory indicators.
The AUC of 4 Indicators for Diagnosing CKDa
| Analyte | AUC | 95% CI | Cutoff | Sensitivity (%) | Specificity (%) |
|---|---|---|---|---|---|
| HE4 | 0.994 | 0.988–>.99 | 100.08 | 100 | 97.9 |
| SCr | 0.987 | 0.919–0.961 | 70.00 | 95.7 | 95.7 |
| BUN | 0.940 | 0.810–0.881 | 6.71 | 86.0 | 91.0 |
| UA | 0.845 | 0.979–0.995 | 350.45 | 74.5 | 85.0 |
AUC, area under the curve; CKD, chronic kidney disease; CI, confidence interval; HE4, human epididymis protein 4; SCr, serum creatinine; BUN, blood urine nitrogen; UA, uric acid.
aP <.001.
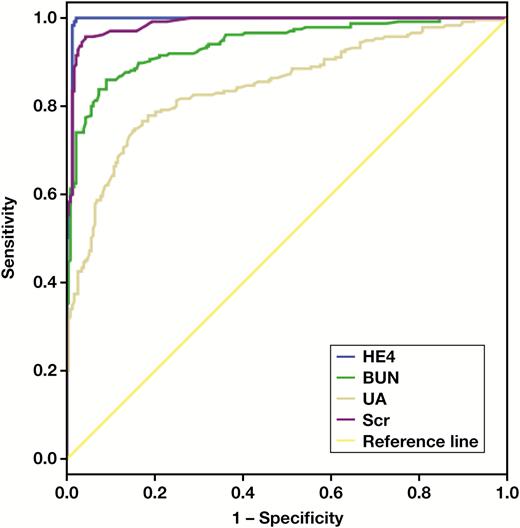
Area under the curve (AUC) values for serum human epididymis protein 4 (HE4), serum creatinine (SCr), blood urea nitrogen (BUN), and uric acid (UA).
Logistic Regression Analysis of Factors Predicting CKD
We performed binary logistic regression analysis to assess the factors that could predict prevalent risk of CKD. The results of binary logistic regression analysis indicated that the levels of all analytes showed significant correlation with the prevalence of CKD (Table 4; P <.001 for each). As stated earlier herein,1 the HE4 had a larger OR value and was stronger predictor for CKD.
Logistic Regression Analysis of HE4 and Other Laboratory Indicators for CKD
| Variables | βa | OR | 95% CI | P Value |
|---|---|---|---|---|
| Age | 0.010 | 1.010 | 0.997–1.023 | .12 |
| SCr | 0.207 | 1.230 | 1.157–1.307 | <.001 |
| BUN | 0.946 | 2.576 | 2.097–3.166 | <.001 |
| UA | 0.016 | 1.016 | 1.013–1.019 | <.001 |
| SBP | 0.077 | 1.080 | 1.064–1.098 | <.001 |
| DBP | 0.048 | 1.049 | 1.032–1.066 | <.001 |
| Hb | -0.118 | 0.888 | 0.870–0.907 | <.001 |
| HE4 | 0.326 | 2.080 | 1.098–3.943 | <.001 |
HE4, human epididymis protein 4; CKD, chronic kidney disease; OR, odds ratio; CI, confidence interval; SCr, serum creatinine; BUN, blood urine nitrogen; UA, uric acid; SBP, systolic blood pressure; DBP, diastolic blood pressure; Hb, hemoglobin.
aCoefficient of regression.
Discussion
As is common knowledge, HE4 usually serves as a tumor marker of ovarian cancer. Galgano et al20 have reported that HE4 could be expressed in the distal convoluted tubules of the kidney. Therefore, we have reasonable grounds to believe that elevated serum HE4 could appear in case of renal cellular injury or renal fibrosis.21,22 Further, renal dysfunction may lead to the diminution of HE4 clearance, which would result in elevated HE4. In this study, we confirmed this hypothesis. The results of this study showed that the levels of serum HE4 in patients with CKD were significantly elevated.
Meanwhile, as renal function declined, serum HE4 increased significantly, suggesting that HE4 could be a potential biomarker for assessing the severity of CKD. These findings in our study are consistent with the results of a recent report by Nagy et al.23 Also, in our study, the diagnostic performance of HE4 and other laboratory indicators for CKD was also evaluated via ROC analysis, which showed that HE4 had better diagnostic ability than other laboratory indicators. Further, HE4 has provided better sensitivity and specificity for CKD than SCr or BUN. HE4 concentrations are often abnormal and are present at significantly increased levels in patients even at early stages of CKD. Besides, the results of binary logistic regression analysis showed that the level of HE4 was a stronger predictor for CKD than other factors.
Of course, this study has some limitations that should be addressed. Because it is a single-center study that included a relatively small population, a larger sample may be necessary to verify our findings.
In summary, through the study findings, we discovered that HE4 has a close relationship with CKD; that it presents an important reference value for CKD staging; and that its levels provide guidance for the diagnosis of CKD, which permits possible earlier diagnosis and intervention.
Abbreviations
- HE4
human epididymis protein 4;
- CKD
chronic kidney disease;
- GFR
glomerular filtration rate;
- MDRD
Modification of Diet in Renal Disease;
- IQR
interquartile range;
- SCr
serum creatinine;
- BUN
blood urine nitrogen;
- UA
uric acid;
- SBP
systolic blood pressure;
- DBP
diastolic blood pressure;
- Hb
hemoglobin;
- OR
odds ratio;
- CI
confidence interval.
Acknowledgements
We thank Natural Science Foundation of China (NSFC) [grant no. 81572069] for the financial support.
References
