


Abstract
It has been known that the conservation or diversity of homeobox genes is responsible for the similarity and variability of some of the morphological or physiological characters among different organisms. To gain some insights into the evolutionary pattern of homeobox genes in bilateral animals, we studied the change of the numbers of these genes during the evolution of bilateral animals. We analyzed 2,031 homeodomain sequences compiled from 11 species of bilateral animals ranging from Caenorhabditis elegans to humans. Our phylogenetic analysis using a modified reconciled-tree method suggested that there were at least about 88 homeobox genes in the common ancestor of bilateral animals. About 50–60 genes of them have left at least one descendant gene in each of the 11 species studied, suggesting that about 30–40 genes were lost in a lineage-specific manner. Although similar numbers of ancestral genes have survived in each species, vertebrate lineages gained many more genes by duplication than invertebrate lineages, resulting in more than 200 homeobox genes in vertebrates and about 100 in invertebrates. After these gene duplications, a substantial number of old duplicate genes have also been lost in each lineage. Because many old duplicate genes were lost, it is likely that lost genes had already been differentiated from other groups of genes at the time of gene loss. We conclude that both gain and loss of homeobox genes were important for the evolutionary change of phenotypic characters in bilateral animals.
Introduction
Homeobox genes that regulate morphogenesis were first discovered by Garber, Kuroiwa, and Gehring (1983) and Scott et al. (1983) in Drosophila melanogaster (fruitfly). Subsequent studies of homeobox genes in fruitflies, frogs, and humans revealed a highly conserved motif of about 180 bp called the homeobox (McGinnis et al. 1984; Scott and Weiner 1984). The homeobox encodes a DNA-binding domain called the homeodomain. In the genomes of animals and plants, homeobox genes form a large transcription factor gene family, with more than 200 genes in humans and about 80 genes in Arabidopsis.
Animal homeobox genes were previously classified into about 30 different groups or families based on their sequence similarity and protein domain structure (Burglin 1994). Additional groups of homeobox genes were identified later (e.g., PBC, MEIS, PKNOX/PREP, TGIF, and IRO; Burglin 1997), and now the homeobox genes in animals can be classified into at least 49 different gene families (see Burglin 2005, for a more detailed classification). Member genes of the same family are often functionally related, and different families of homeobox genes are concerned with different aspects of development (Burglin 1994). For example, the genes of the HOX, CDX, and EVX families and their cognate genes play important roles in different steps of body pattern formation during early embryogenesis of animals. The PAX6, SIX, VAX, and EMX gene families are concerned with the development of eyes, whereas the LIM and HMX gene families are important in the development of neurons (reviewed in Duboule 1994). Because of their important roles in development, homeobox genes have been studied extensively by both developmental and evolutionary biologists.
Homeobox genes are generally highly conserved and control similar phenotypic characters among distantly related organisms (reviewed in De Robertis 1994). However, they are also responsible for controlling different phenotypic characters among relatively closely related species (e.g., Galant and Carroll 2002; Ronshaugen, N. McGinnis, and W. McGinnis 2002). The formation of similar phenotypic characters can be explained by the conservation of shared homeobox genes. By contrast, different phenotypic characters are believed to be generated by duplication of homeobox genes and their functional differentiation. It has also been hypothesized that the loss of some homeobox genes are responsible for morphological differentiation (Ruddle et al. 1994). Therefore, it is interesting to study the pattern of duplication and loss of homeobox genes to have some insights into the evolutionary change of phenotypic characters. It is likely that the number of homeobox genes is related to the complexity of organisms.
Although the patterns of gain and loss of homeobox genes belonging to some families have been studied (e.g., Zhang and Nei 1996; Aparicio et al. 1997; Kappen 2000; Wada et al. 2003; Amores et al. 2004; Edvardsen et al. 2005), no one appears to have studied the gain and loss of the entire set of homeobox genes covering diverse bilateral animals. We have therefore decided to study the evolutionary change of the homeobox gene superfamily examining 11 completely or nearly completely sequenced genomes from bilateral animals. For this purpose, we used a modified version of the reconciled-tree method (Goodman et al. 1979; Page and Charleston 1997) taking into account the ambiguity of gene tree. Although our estimates are crude and conservative, we can still obtain a rough picture of the gain and loss of homeobox genes and their significance for morphological evolution. The method used and the results obtained will be presented in this paper.
Materials and Methods
Identification of Homeodomain-Containing Proteins
To find homeodomain-containing proteins, we performed homology search using the tool Psi-Blast (Altschul et al. 1997) for the entire set of annotated proteins of Caenorhabditis elegans, Caenorhabditis briggsae, mosquito (Anopheles gambiae), fruitfly (D. melanogaster), tunicate (Ciona intestinalis), zebrafish (Danio rerio), pufferfish (Fugu rubripes), frog (Xenopus tropicalis), rat, mouse, and humans. All sequence data except for the tunicate were downloaded from the ENSEMBL (ftp://ftp.ensembl.org) as of February 21, 2005. The tunicate data set (version 1) was downloaded from the Joint Genome Institute (http://genome.jgi-psf.org/). We used 207 homeodomain sequences from animals, plants, and fungi as queries, with an E value ≤ 10−5 (see Supplementary Material online). We also searched for homeobox genes from the expressed sequence tag (EST) database of the tunicate from the DNA Data Bank of Japan (http://www.ddbj.nig.ac.jp/) because Wada et al. (2003) reported several unannotated homeobox genes from the EST database of this organism.
Phylogenetic Analysis
Because the homeodomain is the only alignable region between different groups of homeodomain-containing proteins, we used only this domain (≈60 aa) for phylogenetic analysis. The homeodomain sequences were aligned against the alignment of 207 query sequences (seed alignments) using the profile alignment of the ClustalX program (Thompson et al. 1997). We then constructed a neighbor-joining tree (Saitou and Nei 1987) using the computer program NJBOOT (Takezaki, Rzhetsky, and Nei 1995) with the pairwise deletion option, proportional amino acid differences (p-distances), and 1,000 bootstrap resamplings (Nei and Kumar 2000). Because of the large number of sequences used, other tree construction methods such as maximum-parsimony and maximum-likelihood methods were not used.
Each homeobox gene was assigned to one of the 49 previously defined groups according to the sequence similarity and protein domain structure. Domain structure was examined by using the computer program HMMER (Eddy 2001) for each protein domain profile downloaded from the Pfam (http://pfam.wustl.edu/). A phylogenetic tree for the 49 families of genes was constructed to find their evolutionary relationships.
Estimation of the Number of Genes in the Ancestral Species
When there is a rooted tree of m species, the tree has m − 1 ancestral nodes or species (Nei and Kumar 2000). We are interested in estimating the number of homeobox genes in each of the ancestral species and how the number has changed in the evolutionary process. This can be studied by comparing the species tree with the gene tree for a given set of genes and constructing a reconciled tree (Goodman et al. 1979; Page and Charleston 1997). In this paper, we use a modified version of this reconciled-tree method in which multifurcating branching patterns are taken into account.
For simplicity, let us consider the tree of three species α, β, and γ in figure 1A and assume that species α, β, and γ have three, two, and two genes, respectively. Suppose that the gene tree inferred for the seven genes from the three species is given in figure 1B and that this tree represents the true gene tree. This gene tree can be decomposed into three groups of genes (I, II, and III), in which genes a, b, and c come from species α, β, and γ, respectively. Group I genes do not include any c gene but contain two pairs of genes a and b. Therefore, to reconcile this portion of the gene tree with the species tree under the principle of parsimony, we must assume that one deletion of gene c and one duplication of the ancestral gene of genes a and b occurred (fig. 1C). Similarly, to reconcile the group II genes with the species tree, we will have to assume that gene b was deleted. In the case of group III genes, we have to consider the deletion of genes a and b. In this case, we assume that one event of deletion occurred in the ancestral lineage of genes a and b. The reconciled tree in figure 1C therefore suggests that the ancestral species δ had three genes (ancestral genes of the three groups of genes).
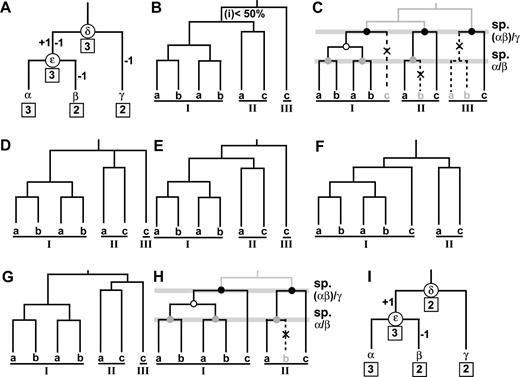
A simple example illustrating the method for estimating the numbers of ancestral, gained, and lost genes. We assume that there are three species (species α, β, and γ), and species α, β, and γ have three, two, and two genes, respectively. (A) The species tree and the numbers of ancestral, gained, and lost genes. The MRCA of species α, β, and γ and the MRCA of species α and β are labeled δ and ε, respectively. The numbers within square boxes are the numbers of genes in extant species (species α, β, and γ) or ancestral species (species δ and ε). The numbers of genes gained and lost in each ancestral branch are shown on the right and left sides of each branch, respectively. (B) The gene tree of the seven genes. (C) The reconciled tree of (A) and (B). Black and gray dots stand for speciation events (sp.), empty black circles for gene duplication events, and crosses for gene losses. (D) The condensed tree of (B). (E)–(G) Three possible gene trees that can be inferred from the condensed tree in (D). (H) The simplest reconciled tree of (D). (I) The species tree and the numbers of ancestral, gained, and lost genes counted from (H).
A similar inference indicates that the ancestral species ε also contained three genes, i.e., two genes in group I, one gene in group II, and zero gene in group III (fig. 1C). Figure 1A now shows the change of the number of genes in the evolutionary lineages for α, β, and γ.
In the above estimation of the number of genes, we assumed that the gene tree is correct. In practice, however, some interior branches are often weakly supported in terms of bootstrap values. For example, one interior branch may have a low bootstrap value (<50% in the present study). In this case, the existence of this branch is questionable, so that the length of this branch is reduced to zero, and a condensed tree (Nei and Kumar 2000) is constructed (fig. 1D). The real gene tree in this case will be one of the three possible trees given in figure 1E–G. Tree E is identical with tree B, and we already estimated the number of genes in the ancestral species δ and ε. In the case of tree F, the reconciled tree is given by figure 1H, and the numbers of genes in species δ and ε are given in figure 1I. This tree is more parsimonious than tree A with respect to the change of gene number. Tree G is different from tree F in that group II genes are closer to gene c, but the number of genes estimated in the ancestral organisms becomes the same as those for tree B. Therefore, we assume that tree I gives the actual numbers of ancestral species. Note that if low bootstrap support was observed between two clades representing different family of genes, we did not apply this multifurcation rule.
When there are several branches with low bootstrap values, the numbers of genes in ancestral species are estimated by the same procedure as the above under the principle of parsimony. Therefore, one can estimate the number of genes for any number of ancestral species. Obviously, the number of genes estimated would be minimal, but because homeobox genes evolve very slowly, the present method appears to give reasonably good estimates (see below). When m is large, the computation can be quite complicated, and we have developed a computer program (available by request to J.N.).
Results
Number of Homeobox Genes in the Genome
Table 1 shows the numbers of nonredundant homeobox genes obtained from the annotated gene sets of 11 species. The majority of the homeobox genes encode only one homeodomain (single-homeobox genes), but some encode more than one domain (multihomeobox genes). The number of homeodomains encoded by a multihomeobox gene was less than 10 with some exceptions. All vertebrate species studied (pufferfish, zebrafish, frog, mouse, rat, and humans) had about 200 or more homeobox genes, and all invertebrate species (C. elegans, C. briggsae, fruitfly, mosquito, and tunicate) had about 100 or fewer homeobox genes. All the sequences used are presented as Supplementary Material online (see file 1).
Estimates of the Numbers of Homeobox Genes in 11 Species and the MRCA of All 11 Species (Archi-MRCA)
Nematodes | Insects | Teleosts | Rodents | |||||||||||||
|---|---|---|---|---|---|---|---|---|---|---|---|---|---|---|---|---|
| Archi-MRCA | Caenorhabditis elegans | Caenorhabditis briggsae | Fruitfly | Mosquito | Tunicate | Pufferfish | Zebrafish | Frog | Mouse | Rat | Humans | |||||
| Single-homeodomain proteins | 82 | 83 | 68 | 97 | 81 | 97 | 229 | 279 | 191 | 234 | 205 | 217 | ||||
| Multihomeodomain proteins | (6) | 9 (30) | 2 (4) | 2 (5) | 2 (4) | 2 (5) | 10 (36) | 10 (37) | 7 (27) | 8 (27) | 11 (35) | 13 (40) | ||||
| Total number of proteins (homeodomains) | (88) | 92 (113) | 70 (72) | 99 (102) | 83 (85) | 99 (102) | 239 (265) | 289 (316) | 198 (218) | 242 (261) | 216 (240) | 230 (257) | ||||
NOTE.—The estimates of the numbers of homeobox genes are shown outside parentheses, and those of homeodomains are shown in parentheses. These two numbers are different because of multihomeodomain proteins.
Evolutionary Relationships of Different Families of Homeobox Genes
The majority of the homeobox genes were assigned into the 49 previously defined groups or families. The remaining homeobox genes were either highly divergent or multihomeobox genes. The list of the genes in each of the 49 groups and the multihomeobox genes is available from the Supplementary Material online. Figure 2 shows the evolutionary relationships of the 49 groups of genes. The homeobox gene superfamily was initially classified into two groups, the typical and atypical homeobox gene groups (Burglin 1994). The homeobox of typical genes encodes a 60-aa-long homeodomain composed of three helical regions, and the homeobox of atypical genes encodes additional amino acids either between helices 1 and 2 or between helices 2 and 3 (Burglin 1994). The typical and atypical groups of genes are presented in figure 2. One group of atypical homeobox genes encodes three additional amino acids between helices 1 and 2 and are called TALE (three amino acids loop elongation) class genes. Bharathan et al. (1997) and Burglin (1997) proposed that the typical and TALE homeobox genes diverged before the animal-plant split. Our tree shows the separation of most typical homeobox genes (except SIX group genes) and TALE homeobox genes and supports their notion. However, because we do not know the exact position of the root in the tree, it is difficult to know whether the early evolved groups of typical homeobox genes (e.g., SIX) are evolutionarily closer to TALE genes than to other typical genes or not.
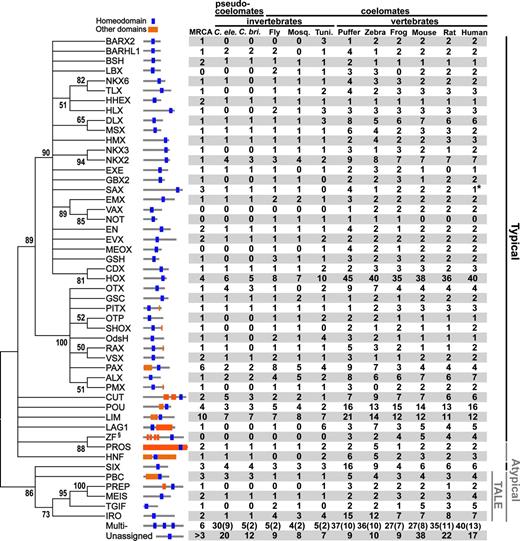
Evolutionary relationships of 49 different families of homeobox genes and their phylogenetic distribution in the 11 species of bilateral animals. The tree is constructed by the neighbor-joining method using average p-distances between 49 groups and is a 50% bootstrap consensus tree (100 bootstrap replications). Bootstrap values higher than 50% are shown. Representative domain organization is shown on the right-hand side of each family name. Black vertical lines indicate the typical homeobox gene family and gray vertical lines the atypical homeobox gene family. Each blue square indicates a homeodomain, and orange squares indicate the conserved family-specific domains. Gray horizontal lines indicate full-length proteins. Domains of E value < 0.01 in the HMM search are shown. The numbers of homeobox genes for each family in each species is also shown. Numbers in parentheses are the numbers of homeoboxes from multihomeobox genes. Numbers under “MRCA” are the estimated numbers of homeobox genes in the MRCA of the 11 species using species trees based on the Coelomata hypothesis. No SAX family gene was found in the annotated data set of human genes from the ENSEMBL. However, the annotation data set of human genes from the GenBank contains one copy of SAX group gene. We therefore included this gene in this tabulation (number with “*” mark). We did not show any ZF homeobox genes in invertebrates, though there are ZF homeobox genes in these animals. This is because the ZF homeobox genes (subfamily with “§” mark) in invertebrates are either ZF multihomeobox genes that have their own vertebrate multihomeobox orthologs or unclassified genes that appear to have been derived from multihomeobox genes (data not shown). Note that the SIX family genes are typical homeobox genes and that the gene numbers for the HOX gene family are slightly higher than those of the genes in the HOX cluster. This is because other closely related genes (e.g., IPF) were also included in this family. We used the same notations as Burglin's (2005) to represent homeobox gene families.
At least 13 groups of homeobox genes (gene groups with orange boxes in fig. 2) encode other evolutionarily conserved domains in addition to the homeodomain according to the hidden Markov model searches for conserved domains using the Pfam database (see Burglin 2005 for the detailed domain structures of homeodomain proteins). Interestingly, a majority of them appear to be early evolved groups of homeobox genes. Therefore, our results suggest that there were already many homeobox genes in the most recent common ancestor (MRCA) of the 11 species, and their domain structures were already quite complex. Because we did not include the multihomeodomain proteins and the proteins that are not assigned to any of the 49 groups, the evolutionary history of the entire set of homeobox genes should be more complex than that shown in figure 2.
Figure 2 also shows the numbers of homeobox genes for each of the 49 families as well as for those of multihomeobox genes and unassigned genes. In most groups, vertebrates have about two to four times more genes than invertebrates. However, there are several gene groups that do not show this pattern. For example, the NOT gene, which is important for the development of notochords in zebrafish (Talbot et al. 1995), has been found as a single-copy gene in three invertebrate species, fruitflies, mosquitoes, and tunicates, and three vertebrate species, zebrafish, pufferfish, and frog, but no gene has been found in three mammalian species, mouse, rat, and humans. Recently, it has been claimed that a mouse ortholog of the NOT gene was found (Abdelkhalek et al. 2004; Plouhinec et al. 2004), but the phylogenetic analysis presented actually suggests that it is a paralog of the NOT genes. There are also other families of genes where vertebrates have fewer or no more genes than those of invertebrates. Because the genome sequencing or annotation of several species has not been completed, the absence of some families of genes should be reexamined, though it may not change the general pattern of evolution. It is also possible that the genes have not been lost completely but only their homeoboxes are missing, and other regions of the gene are still functional as in the case of some PAX genes (Chi and Epstein 2002).
Evolutionary Change of the Number of Homeobox Genes in Bilateral Animals
Knowing that there were already many homeobox genes in the MRCA of all the 11 species (archi-MRCA), we estimated the numbers of homeobox genes in all ancestral organisms and their increase and decrease in different stages of the evolution of bilateral animals. We constructed a phylogenetic tree of 2,031 homeodomain sequences compiled from single- and multihomeodomain–containing proteins in relation to the species tree (fig. 3). The species tree is based on the observation that insects, tunicates, and vertebrates are coelomates but nematodes are pseudocoelomates (Coelomata hypothesis) as well as phylogenetic analyses using more than 100 nuclear proteins from several species (e.g., Blair et al. 2002; Wolf, Rogozin, and Koonin 2004; Philip, Creevey, and McInerney 2005). (The Ecdysozoa hypothesis in which insects and nematodes are sister groups will be considered later.) Because the protein sequences used are generally closely related, we used a bootstrap cutoff point of 50% for generating a multifurcating node of gene trees. As mentioned above, the number of homeoboxes in multihomeobox genes varies with the gene, and therefore it is difficult to estimate the real number of ancestral genes for these genes. We therefore decided to regard each homeobox as one gene. However, this will not affect our results significantly because the number of multihomeobox genes included was small.
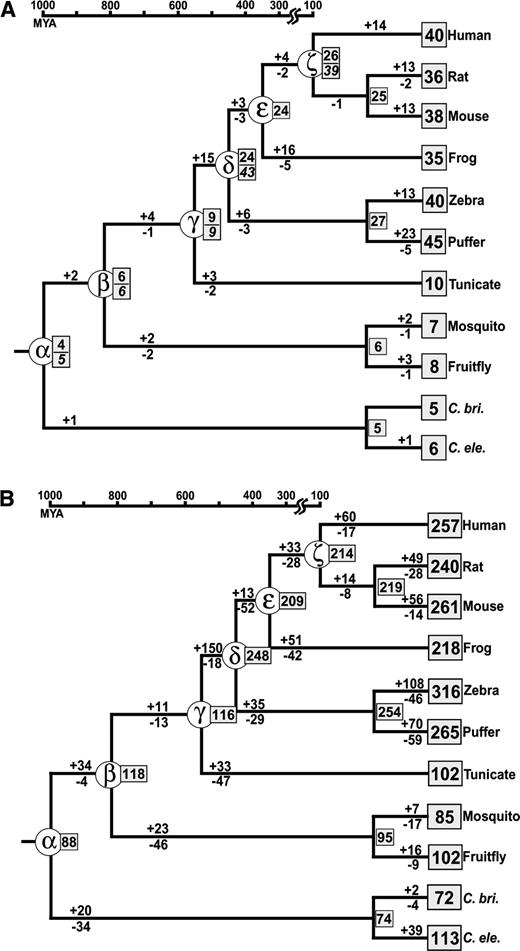
Estimated numbers of ancestral, gained, and lost genes during the evolution of bilateral animals when the Coelomata tree is used. Species name is given on the right-hand side of each external node. Ancestral species of our interest are labeled by α to ζ. The number within a square box is the number of genes in each extant species or ancestral species. The numbers above and below each branch are the numbers of gained and lost genes, respectively. The divergence times for ancestral nodes α, β, δ, ε, and ζ are based on the molecular clock (Kumar and Hedges 1998; Nei, Xu, and Glazko 2001) and that for node γ is based on the fossil record (Shu et al. 2001). The remaining ancestral nodes are not on the timescale. (A) Evolution of the HOX family genes. For ancestral nodes α, β, γ, δ, and ζ, the numbers in italic are the numbers of ancestral HOX genes estimated by other studies, and those above the italic are the estimated numbers in this study. Other studies are as follows: node α, Zhang and Nei (1996); node β, Holland and Garcia-Fernandez (1996); node γ, Wada et al. (2003); and nodes δ and ζ, Stellwag (1999). (B) Evolution of the entire homeobox gene superfamily. The numbers of gained and lost genes for the exterior branches are not so reliable (see Results). The notations used are the same as those of (A).
To check the reliability of our estimates, we first analyzed HOX family genes. The numbers of ancestral HOX genes at several evolutionary time points have already been estimated by several researchers (e.g., Holland and Garcia-Fernandez 1996; Zhang and Nei 1996; Stellwag 1999; Wada et al. 2003). In the case of HOX genes, estimation of the numbers of ancestral genes is relatively easy because information about the conserved genomic locations of HOX genes can also be used for reconstructing the ancestral states. We compared our estimates of the numbers of ancestral genes with the previous estimates, assuming that the previous estimates are correct (fig. 3A). The previous estimates for ancestral species α, β, γ, δ, and ζ in figure 3A were 5, 6, 9, 43, and 39, respectively, whereas our estimates were 4, 6, 9, 24, and 26 in this order. This result suggests that our estimates of the numbers of genes in the ancestral species tend to be smaller than the previous ones. This has happened mainly because some of the paralogous homeodomains from different species had identical or nearly identical sequences, and therefore the interior branches involved sometimes had zero substitutions and showed low bootstrap values. In this case, the numbers of genes in ancestral organisms are expected to be underestimated. In particular, the number of genes in the MRCAs δ and ζ was underestimated for this reason. However, we note that the number of genes gained at the exterior branch of each lineage is likely to have been overestimated because of underestimation of the numbers of ancestral genes.
Increase of Homeobox Genes in the Evolutionary Process
Keeping in mind this possibility of underestimation, we estimated the numbers of ancestral genes and the numbers of genes lost and gained for the entire homeobox gene superfamily. Figure 3B shows that there were at least 88 ancestral homeobox genes in the archi-MRCA. This archi-MRCA already had several genes in some homeobox families (e.g., six genes in PAX group) (fig. 2). However, some gene families (LBX, VAX/NOT, MEOX, and zinc-finger [ZF]) were not found in nematodes (fig. 2), and separation of these gene families from other families was not always clear-cut in the tree of 2,031 sequences (data not shown). Therefore, these gene families were not considered in the estimation of genes in the archi-MRCA. However, figure 2 shows that these groups of genes already diverged from other groups of genes before the nematode and mammalian split. Therefore, it is possible that the genes from these four families actually existed in the archi-MRCA. If this is the case, the number of homeobox genes in the archi-MRCA would increase to about 92.
After the divergence of coelomates and pseudocoelomates, the number of homeobox genes increased almost threefold in the vertebrate lineages. In invertebrates, however, the increase was small or moderate, and our results suggest that the number of homeobox genes did not merely increase during the evolutionary process, but the number sometimes decreased. For example, the MRCA of insects and vertebrates had at least 118 homeobox genes, but fruitflies have 102 at present. Tunicates also have fewer homeobox genes than the MRCA of tunicates and vertebrates. In the case of vertebrate lineages, the number of genes increased primarily in two time periods, that is, the early stages of coelomate evolution (between nodes α and β in fig. 3B) and the early stages of vertebrate evolution (between nodes γ and δ in fig. 3B). The major increase of gene number in these two time periods are consistent with that of the total number of genes in the genome by X. Gu, Wang, and J. Gu (2002). Note that if a gene is duplicated and one of the two duplicate genes is lost during the same time interval, our approach cannot detect them, as mentioned earlier. Therefore, the gene losses estimated here are losses of fairly old duplicate genes.
The Ecdysozoa hypothesis (e.g., Aguinaldo et al. 1997; H. Dopazo and J. Dopazo 2005) proposes that insects are more closely related to nematodes than to vertebrates. We therefore examined the numbers of ancestral genes for all the MRCAs of the species tree (fig. 4). A conspicuous difference between the two hypotheses was observed in the archi-MRCA (node α), the numbers for the former and the latter hypotheses being 88 and 145, respectively. In other MRCAs, the number was nearly the same for the two hypotheses.
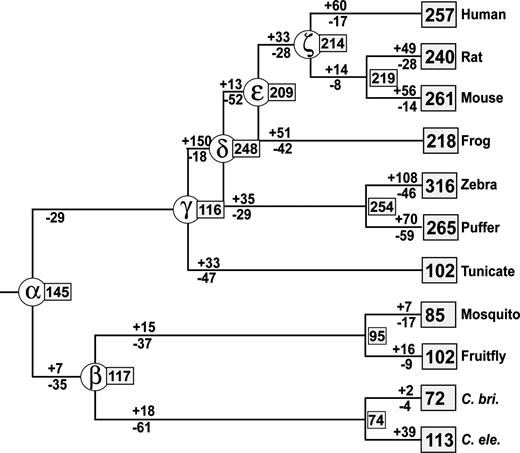
Estimated numbers of ancestral, gained, and lost genes during the evolution of bilateral animals when the Ecdysozoa tree is used. The notations used are the same as those in figure 3.
The Coelomata and the Ecdysozoa hypotheses are quite controversial now. However, the studies based on a large number of nuclear protein sequences (e.g., Blair et al. 2002; Wolf, Rogozin, and Koonin 2004; Philip, Creevey, and McInerney 2005) generally support the Coelomata tree. It should also be noted that in our data set the number of gains and losses of genes in the entire evolutionary process is considerably smaller (more parsimonious) for the Coelomata tree than for the Ecdysozoa tree (figs. 3 and 4). This result lends support to the former tree. For these reasons, we will consider primarily the results obtained from the Coelomata tree subsequently.
Retention and Loss of Ancestral Homeobox Genes in Each Species
It is interesting to know how many gene families of the archi-MRCA have left descendent genes in the 11 species and how many gene families have been lost during this evolutionary period. Figure 2 shows that in nematodes 12 of the 49 gene families in the archi-MRCA have been lost, whereas 32 of them have been retained, the remaining 5 gene families existing in neither archi-MRCA nor nematodes. In vertebrates, however, all the archi-MRCA genes were found. In addition, some new gene families originated in insects, tunicates, and vertebrates. The HOX gene family has the largest number of member genes in vertebrates, and the archi-MRCA also had a relatively high number of member genes (four genes). The highest number of archi-MRCA genes was observed in the LIM family, but the number of genes did not increase very much compared with the HOX gene family. Some gene families such as the BSH and VSX families had small numbers of genes in all species.
We also studied the numbers of ancestral homeobox genes lost during the time period from the archi-MRCA to the present species (table 2). Let us consider figure 1C to illustrate how we counted the numbers of genes lost. This figure shows three groups of genes (I, II, and III) that were derived from the three genes in the ancestral species δ. In group I, genes a and b are retained, but gene c was lost. In group II, genes a and c are retained, but gene b was lost. Similarly, in group III genes, gene c is retained, but genes a and b were lost. Therefore, in species α, two ancestral genes are retained and one gene was lost. Similarly, the number of genes lost is two in species β and one in species γ. The total number of genes lost in each extant species is given by the sum of these losses for all gene families. Note that this number of gene losses can be computed for each MRCA.
Estimates of the Numbers of Genes Lost from Each MRCA to Extant Species When the Coelomata Tree Was Used
Ancestral Nodes in Figure 3 | |||||||||||
|---|---|---|---|---|---|---|---|---|---|---|---|
| α | β | γ | δ | ε | ζ | ||||||
| Species | 88 | 118 | 116 | 248 | 209 | 214 | |||||
| Caenorhabditis elegans | 34 | ||||||||||
| Caenorhabditis briggsae | 38 | ||||||||||
| Fruitfly | 30 | 53 | |||||||||
| Mosquito | 35 | 59 | |||||||||
| Tunicate | 35 | 57 | 47 | ||||||||
| Zebrafish | 25 | 40 | 29 | 71 | |||||||
| Pufferfish | 27 | 43 | 31 | 78 | |||||||
| Frog | 26 | 43 | 34 | 90 | 42 | ||||||
| Mouse | 26 | 43 | 34 | 91 | 41 | 26 | |||||
| Rat | 28 | 46 | 38 | 97 | 47 | 36 | |||||
| Humans | 26 | 42 | 33 | 86 | 34 | 17 | |||||
NOTE.—Estimates of the numbers of genes lost in each species from the same MRCA are shown in the same column.
Table 2 shows that the invertebrate lineages lost about 30–38 genes of the 88 ancestral genes in the archi-MRCA, whereas the vertebrate lineages lost about 25–28 genes during the same period. This suggests that invertebrates lost somewhat more genes than vertebrates. However, the difference is much smaller than that observed with full genome analysis, which suggests that about two-fold or more gene losses occurred in the lineage leading to C. elegans than the lineage leading to human (Hughes and Friedman 2004; Koonin et al. 2004; Ogura, Ikeo, and Gojobori 2005). Similarly, the numbers of genes lost from the ancestor β to insects and tunicates were somewhat higher than those in the vertebrate lineages (see column 3 in table 2). In vertebrates, the numbers of lost genes are more or less the same for each MRCA. However, because the major increase of gene number occurred in the early stage of vertebrate evolution (between γ and δ), fishes lost somewhat smaller numbers of genes than other vertebrates. These results suggest that the degree of gene loss varies significantly among different families of homeobox genes, but it is not so different among different species.
When the Ecdysozoa tree was used, the number of genes lost from the archi-MRCA is more than two times greater than that for the Coelomata tree (table 3). This indicates that the Coelomata tree is much more parsimonious than the Ecdysozoa tree. Therefore, our data support the former tree, as mentioned earlier.
Estimates of the Numbers of Genes Lost from Each MRCA to Extant Species When the Ecdysozoa Tree Was Used
Ancestral Nodes in Figure 4 | |||||||||||
|---|---|---|---|---|---|---|---|---|---|---|---|
| α | β | γ | δ | ε | ζ | ||||||
| Species | 145 | 117 | 116 | 248 | 209 | 214 | |||||
| Caenorhabditis elegans | 96 | 61 | |||||||||
| Caenorhabditis briggsae | 100 | 65 | |||||||||
| Fruitfly | 76 | 46 | |||||||||
| Mosquito | 83 | 52 | |||||||||
| Tunicate | 79 | 47 | |||||||||
| Zebrafish | 60 | 29 | 71 | ||||||||
| Pufferfish | 63 | 31 | 78 | ||||||||
| Frog | 64 | 34 | 90 | 42 | |||||||
| Mouse | 63 | 34 | 91 | 41 | 26 | ||||||
| Rat | 66 | 38 | 97 | 47 | 36 | ||||||
| Humans | 62 | 33 | 86 | 34 | 17 | ||||||
NOTE.—Estimates of the numbers of genes lost in each species from the same MRCA are shown in the same column.
Discussion
In this study, we showed that there were at least 88 homeobox genes in the archi-MRCA of bilateral animals when the Coelomata tree was used. Previously, we mentioned that our statistical method would give minimum estimates of the numbers of ancestral genes. However, our estimate of the total number of genes in the archi-MRCA is close to the current number of genes in nematodes and insects. This is also true with the number in each gene family. These observations suggest that our estimates may not be too far off from the true numbers. Furthermore, the similarity of the estimates for the archi-MRCA and those for nematodes and insects suggest that the archi-MRCA had the same degree of phenotypic complexity as that of current nematodes or insects. Because vertebrates gained more homeobox genes than invertebrates, it appears that this increase in the number of homeobox genes is responsible for the formation of more complex characters in vertebrates than in invertebrates.
We have also seen that many homeobox genes have been lost in the process of evolution of phenotypic characters. This loss of homeobox genes might have been either inactivation of redundant genes after gene duplication or loss of functionally differentiated genes (Ruddle et al. 1994; Wagner, Amemiya, and Ruddle 2003). The genes lost in our study are losses of fairly old duplicate genes, and therefore it is likely that the genes lost were already functionally differentiated from their paralogous genes at the time of gene loss. This raises the question of why genes could be lost so often. There are at least three possible explanations. First, without closely related paralogous genes, functional redundancy can be achieved by something called distributed robustness (reviewed in Wagner 2005). In other words, loss (or mutation) of a homeobox gene can be buffered by the rewiring of functionally different parts of the regulatory network. If so, it is possible that losses of homeobox genes might not have caused any noticeable changes of phenotypes. Second, it is also possible that gene loss occasionally has had beneficial effects. For example, loss of genes may be related to the reduction of unused characters. Third, the phenotypic changes caused by the loss of homeobox genes might have been more or less neutral with respect to fitness. In the case of multifunctional genes, this is possible if the critical functions are shared by duplicate genes.
The gain and loss of homeobox genes are probably initially opportunistic, but these events may change the evolutionary courses of different organisms. However, the possible causes of gene loss mentioned above are speculative, and more detailed studies are needed to identify the real reason.
William Martin, Associate Editor
We thank David Geiser, Claude dePamphilis, Hong Ma, Jan Klein, Junyul Kim, Li Hao, Yoshi Suzuki, and Kerstin Kaufmann for valuable comments on an earlier version of the manuscript. We also thank Thomas Bürglin for sending his up-to-date classification of homeobox genes. This study was supported by the National Institutes of Health Grant GM20293 to M.N.
References
Abdelkhalek, H. B., A. Beckers, K. Schuster-Gossler et al. (14 co-authors).
Aguinaldo, A. M., J. M. Turbeville, L. S. Linford, M. C. Rivera, J. R. Garey, R. A. Raff, and J. A. Lake.
Altschul, S. F., T. L. Madden, A. A. Schaffer, J. Zhang, Z. Zhang, W. Miller, and D. J. Lipman.
Amores, A., T. Suzuki, Y. L. Yan, J. Pomeroy, A. Singer, C. Amemiya, and J. H. Postlethwait.
Aparicio, S., K. Hawker, A. Cottage, Y. Mikawa, L. Zuo, B. Venkatesh, E. Chen, R. Krumlauf, and S. Brenner.
Bharathan, G., B. J. Janssen, E. A. Kellogg, and N. Sinha.
Blair, J. E., K. Ikeo, T. Gojobori, and S. B. Hedges.
Burglin, T. R.
———.
———.
Chi, N., and J. A. Epstein.
De Robertis, E. M.
Dopazo, H., and J. Dopazo.
Eddy, S. R.
Edvardsen, R. B., H. C. Seo, M. F. Jensen et al. (11 co-authors).
Galant, R., and S. B. Carroll.
Garber, R. L., A. Kuroiwa, and W. J. Gehring.
Goodman, M., J. Czelusniak, G. W. Moore, A. E. Romero-Herrera, and G. Matsuda.
Gu, X., Y. Wang, and J. Gu.
Holland, P. W., and J. Garcia-Fernandez.
Hughes, A. L., and R. Friedman.
Kappen, C.
Koonin, E. V., N. D. Fedorova, J. D. Jackson et al. (18 co-authors).
Kumar, S., and S. B. Hedges.
McGinnis, W., M. S. Levine, E. Hafen, A. Kuroiwa, and W. J. Gehring.
Nei, M., P. Xu, and G. Glazko.
Ogura, A., K. Ikeo, and T. Gojobori.
Page, R. D., and M. A. Charleston.
Philip, G. K., C. J. Creevey, and J. O. McInerney.
Plouhinec, J. L., C. Granier, C. Le Mentec, K. A. Lawson, D. Saberan-Djoneidi, J. Aghion, D. L. Shi, J. Collignon, and S. Mazan.
Ronshaugen, M., N. McGinnis, and W. McGinnis.
Ruddle, F. H., K. L. Bentley, M. T. Murtha, and N. Risch.
Saitou, N., and M. Nei.
Scott, M. P., and A. J. Weiner.
Scott, M. P., A. J. Weiner, T. I. Hazelrigg, B. A. Polisky, V. Pirrotta, F. Scalenghe, and T. C. Kaufman.
Shu, D. G., S. C. Morris, J. Han, L. Chen, X. L. Zhang, Z. F. Zhang, H. Q. Liu, Y. Li, and J. N. Liu.
Takezaki, N., A. Rzhetsky, and M. Nei.
Talbot, W. S., B. Trevarrow, M. E. Halpern, A. E. Melby, G. Farr, J. H. Postlethwait, T. Jowett, C. B. Kimmel, and D. Kimelman.
Thompson, J. D., T. J. Gibson, F. Plewniak, F. Jeanmougin, and D. G. Higgins.
Wada, S., M. Tokuoka, E. Shoguchi et al. (13 co-authors).
Wagner, A.
Wagner, G. P., C. Amemiya, and F. Ruddle.
Wolf, Y. I., I. B. Rogozin, and E. V. Koonin.
