


Abstract
Plant pathogenesis-related genes (PR genes) code for enzymes, enzyme inhibitors, and other peptides that confer resistance to pathogens and herbivores. Although several PR genes have been the subject of molecular population genetic analyses, a general understanding of their long-term evolutionary dynamics remains incomplete. Here we analyze sequence data from 17 PR genes from two closely related teosinte species of central Mexico. In addition to testing whether patterns of diversity at individual loci depart from expectations under a neutral model, we compared patterns of diversity at defense genes, as a class, to nondefense genes. In Zea diploperennis, the majority of defense genes have patterns of diversity consistent with neutral expectations while at least two genes showed evidence of recent positive selection consistent with arms-race models of antagonistic coevolution. In Zea mays ssp. parviglumis, by contrast, analyses of both defense and nondefense genes revealed strong and consistent departures from the neutral model, suggestive of nonequilibrium population dynamics or population structure. Nevertheless, we found a significant excess of replacement polymorphism in defense genes compared to nondefense genes. Although we cannot exclude relaxed selective constraint as an explanation, our results are consistent with temporally variable (transient or episodic) selection or geographically variable selection acting on parviglumis defense genes. The different patterns of diversity found in the two Zea species may be explained by parviglumis' greater distribution and population structure together with geographic variation in selection.
Introduction
Plant pathogenesis–related (PR) proteins constitute an integral part of the plant immune system (Nimchuk et al. 2003). Specifically, the PR proteins, as a class, are induced following plant recognition of herbivore or pathogen attack and directly inhibit parasite growth, reproduction, or infection (Ward et al. 1991; Morris et al. 1998; Muthukrishnan et al. 2001). In view of evidence that PR proteins play a central role in defense and that plant enemies impose selection on resistance traits in natural populations (Rausher 2001; de Meaux and Mitchell-Olds 2003), the genes that encode these proteins are likely candidates for evolving in response to selection. Unlike plant R genes which are involved in pathogen recognition and have consistently shown evidence for strong selection (Meyers et al. 1998; Wang et al. 1998; Caicedo, Schaal, and Kunkel 1999; Stahl et al. 1999; Bergelson et al. 2001; Mondragon-Palomino et al. 2002; Tian et al. 2002; Mauricio et al. 2003; Rose et al. 2004), molecular population genetic evidence for selection acting on PR genes is variable. Some PR genes show evidence for having evolved in response to strong positive selection. For example, positive selection appears to have driven among-species divergence in chitinase genes in Arabis (Bishop, Dean, and Mitchell-Olds 2000), β-1-3-endoglucanases in Glycine species (Bishop et al. 2005), and polygalacturonases among dicot species (Stotz et al. 2000). Patterns of intraspecific diversity suggest that positive selection has acted on at least one chitinase gene in Zea (Tiffin 2004) and a protease inhibitor in Arabidopsis thaliana (Clauss and Mitchell-Olds 2003). Many PR genes, however, show patterns of intraspecific diversity that are consistent with neutral expectations (Kawabe and Miyashita 1999; Tiffin and Gaut 2001a; Clauss and Mitchell-Olds 2003; Tiffin 2004).
The apparently neutral evolutionary histories of several PR genes may indicate that these genes evolve under strong functional constraints or that their selective histories are not easily detected using standard molecular analyses. For example, temporally or spatially variable selection may result in patterns of nucleotide polymorphism that do not conform to expectations under simple models of balancing or positive selection (de Meaux and Mitchell-Olds 2003). For many plant species, signatures of selection may also be obscured by nonequilibrium population dynamics or population structure (Przeworski 2002; B. Charlesworth, D. Charlesworth, and Barton 2003; Wright and Gaut 2005). An additional problem for evaluating the evolutionary history of PR genes is that evidence of selection may not be detected due to low statistical power associated with the relatively short gene lengths and small number of segregating sites found in many PR genes. Combining data from multiple PR genes and comparing the levels and patterns of diversity to a set of reference genes that play no role in host defense may increase the statistical power for detecting selection and improve the ability to distinguish the effects of selection from demographic history.
The potential power of combining data from multiple genes in order to understand the evolutionary history of host defense has been demonstrated by two recent studies of innate immunity genes in Drosophila. Schlenke and Begun (2003) compared patterns of diversity at 34 Drosophila simulans immunity genes primarily involved in pathogen recognition and signaling to a collection of nonimmunity genes. Their analyses revealed higher values of Ka/Ks and lower haplotype diversity for immunity genes, patterns consistent with predictions of recurrent positive selection from arms-race models of coevolution (Van Valen 1973; Dawkins and Krebs 1979). By contrast, Lazzaro and Clark (2003) examined nine inducible antibacterial peptide genes from Drosophila melanogaster and found evidence for an excess of polymorphic replacement sites, a pattern of diversity potentially suggesting transient positive selection favoring rare amino acid variants. Not all combined analyses of immunity-related genes, however, have detected evidence for nonneutral evolution. An analysis of seven peptidoglycan recognition genes thought to be involved in parasite recognition in D. melanogaster revealed no evidence for directional or balancing selection (Jiggins and Hurst 2003). Broad surveys of immunity genes coupled with comparisons of immunity to nonimmunity genes have not been conducted previously for plants.
Here we report on a survey of sequence variation in 17 pathogenesis-related genes (hereafter referred to as defense genes) in two closely related teosinte species, Zea diploperennis and Zea mays ssp. parviglumis. Our survey includes genes coding for eight types of PR proteins (see Supplementary Material Table 3 for further information), most of which are induced following plant perception of pathogen infection and/or herbivore attack: three chitinases, one β-1-3-glucanase, three protease inhibitors, one cysteine protease, three thaumatin-like proteins, two phospholipid transferases, two ribosomal-inactivating proteins, and two PR-1 proteins. Each of the genes we examine has been implicated as being functionally important in defending Zea against potential enemies or exhibits high similarity to genes that have been identified as functionally important in other species. Chitinases and β-1-3-glucanases degrade the chitin and glucan matrix of fungal cell walls, respectively (Schlumbaum et al. 1986; Huynh et al. 1992), the cysteine protease, mir1, damages the peritrophic matrix of the insect gut (Pechan et al. 2002), protease inhibitors inactivate digestive proteases in insect guts and proteases secreted by pathogens into host tissue (Ryan 1990), thaumatin-like proteins retard the growth of fungal pathogens and some may inhibit amylases and trypsins in herbivores (Velazhahan, Datta, and Muthukrishnan 1999), lipid transfer proteins exhibit antibiotic activity possibly by perforating pathogen plasma membranes (Kader 1996), ribosome-inactivating proteins disrupt protein synthesis in fungal pathogens by damaging ribosomes (Jensen et al. 1999; Nielsen, Payne, and Boston 2001), and PR-1 proteins are expressed in response to fungal and viral infection and some (e.g., prms) appear to be targeted to plasmodesmata to localize and prevent the spread of infection (Murillo, Cavallarin, and San Segundo 1997; Buchel and Linthorst 1999). Because plant PR genes are induced following damage and function by directly inhibiting pathogen infection, these genes are functionally similar to the effector proteins involved in innate immune response in insects and vertebrates (Menezes and Jared 2002).
The specific objectives of this study were twofold. First, we tested for evidence of selection acting on individual genes using analyses based on the frequency spectrum of intraspecific polymorphisms. Second, in order to determine if defense genes, when treated as a functional class, differ from nondefense genes in their evolutionary dynamics, we conducted several multilocus tests that compared patterns of polymorphism and divergence at defense genes to patterns at nondefense genes. Comparing the results of multilocus tests with single-locus tests allowed us to evaluate the extent and nature of genome-wide demographic effects that may shape diversity and obscure evidence of selection.
Materials and Methods
Species Sampling and Sequence Collection
We analyzed sequence data from 16 defense and 4 nondefense genes from Z. diploperennis (data for 12 of the defense genes are new to this study) and 17 defense and 10 nondefense genes from Z. mays ssp. parviglumis (hereafter parviglumis) (data for 13 of the defense genes are new to this study). Both species are wind-pollinated endemics of southwestern and south-central Mexico. Zea diploperennis is a perennial that is restricted to a small, high-elevation region of Sierra de Manantlán in southwestern Jalisco (Iltis et al. 1979), while parviglumis, the closest relative and progenitor to the domesticate maize (Z. mays ssp. mays) (Matsuoka et al. 2002), is an annual widely distributed at lower elevations from Jalisco to Oaxaca (Sanchez G. et al. 1998; Ruiz, Sánchez G., and Aguilar S. 2001). We used polymerase chain reaction (PCR) to amplify genes from the same species-wide collections of Z. diploperennis (7–13 alleles from 8 accessions) and parviglumis (12–17 alleles from 13 accessions). These accessions were also used in previous studies of defense genes in these species (Tiffin 2004; Tiffin, Hacker, and Gaut 2004), and information on the sources of the accessions sampled is provided in these references. Because diploperennis and parviglumis are highly outcrossing, PCR products were cloned into pGemTA vectors (Promega, Madison, Wis.) prior to sequencing. We also attempted to amplify each of these genes from Tripsacum dactyloides (Poaceae) for use as an outgroup in analyses.
Singleton variants obtained from clones may represent true polymorphisms or may result from misincorporation by Taq polymerase. For this reason, all singletons were checked by sequencing multiple clones from at least two separate PCRs or from direct sequencing of PCR products. When singleton variants were not recovered from separate PCRs or from PCR templates, they were assumed to have arisen from misincorporation by Taq polymerase and were excluded from analyses. Prior to analyses, sequences were aligned by eye using BioEdit version 6.0.5 (Hall 1999). We combined these newly collected data with previously published data for five defense and four nondefense genes from Z. diploperennis (table 1; Tiffin and Gaut 2001b; Tiffin, Hacker, and Gaut 2004) and 1 defense and 10 nondefense genes from parviglumis (table 2; Eyre-Walker et al. 1998; Hilton and Gaut 1998; Zhang et al. 2002; Tenaillon et al. 2004). GenBank sequences used for primer design, amplification conditions, and primer sequences as well as GenBank accession numbers for sequences that are new to this study are provided in Table 1 of Supplementary Material online.
Number of Sequences (N), Number of Haplotypes (H), Number of Segregating Sites (S), Gene Length, Haplotype Diversity (Hd), Replacement and Silent Site Diversity (πrep, πsilent) of Defense and Nondefense Genes in Zea diploperennis
N | H | S | Length | Hd | πrep | πsilent | πrep/πsilent | |
|---|---|---|---|---|---|---|---|---|
| Defense | ||||||||
| chiA | 8a | 1 | 0 | 1,100 | 0 | 0 | 0 | — |
| chiB | 7a | 6 | 32 | 1,100 | 0.952 | 0.007 | 0.017 | 0.412 |
| chiI | 9a | 6 | 19 | 1,080 | 0.889 | 0.003 | 0.009 | 0.333 |
| hag | 8 | 6 | 13 | 651 | 0.929 | 0.004 | 0.012 | 0.311 |
| mir1 | 9 | 5 | 20 | 971 | 0.806 | 0.007 | 0.009 | 0.819 |
| mpi | 13b | 9 | 13 | 630 | 0.870 | 0.001 | 0.008 | 0.125 |
| plt1 | 9 | 5 | 17 | 482 | 0.806 | 0.009 | 0.018 | 0.498 |
| plt2 | 11 | 3 | 6 | 609 | 0.473 | 0.006 | 0.001 | 4.125 |
| pr1 | 9 | 4 | 9 | 517 | 0.583 | 0.003 | 0.011 | 0.229 |
| pr5 | 10 | 7 | 11 | 478 | 0.911 | 0.009 | 0.010 | 0.906 |
| pr6 | 8 | 5 | 18 | 1,172 | 0.786 | 0.002 | 0.012 | 0.125 |
| prms | 8 | 2 | 11 | 699 | 0.250 | 0.001 | 0.007 | 0.186 |
| rip1 | 8 | 7 | 35 | 1,135 | 0.964 | 0.008 | 0.017 | 0.439 |
| rip2 | 8 | 5 | 11 | 630 | 0.893 | 0.006 | 0.010 | 0.557 |
| wip1 | 10b | 8 | 27 | 660 | 0.933 | 0.006 | 0.027 | 0.222 |
| zlp | 8 | 7 | 5 | 721 | 0.964 | 0.001 | 0.006 | 0.152 |
| Nondefense | ||||||||
| adh1 | 9c | 9 | 38 | 1,400 | 0.972 | 0.001 | 0.017 | 0.059 |
| c1 | 14c | 11 | 16 | 750 | 0.967 | 0.004 | 0.010 | 0.450 |
| glb1 | 9c | 6 | 21 | 1,200 | 0.889 | 0.006 | 0.012 | 0.500 |
| waxy | 10c | 9 | 16 | 1,400 | 0.978 | 0.003 | 0.006 | 0.500 |
Data from Tiffin (2004).
Data from Tiffin, Hacker, and Gaut (2004).
Data from Tiffin and Gaut (2001b).
Number of Sequences (N), Number of Haplotypes (H), Number of Segregating Sites (S), Gene Length, Haplotype Diversity (Hd), Replacement and Silent Site Diversity (πrep, πsilent) of Defense and Nondefense Genes Zea mays ssp. parviglumis
N | H | S | Length | Hd | πrep | πsilent | πrep/πsilent | |
|---|---|---|---|---|---|---|---|---|
| Defense | ||||||||
| chiA | 13a | 13 | 51 | 1,100 | 0.987 | 0.006 | 0.026 | 0.231 |
| chiB | 14a | 14 | 54 | 1,100 | 1 | 0.008 | 0.025 | 0.320 |
| chiI | 15a | 14 | 27 | 1,080 | 0.990 | 0.001 | 0.016 | 0.062 |
| cpi | 12 | 9 | 74 | 1,274 | 0.939 | 0.010 | 0.018 | 0.556 |
| hag | 15 | 15 | 37 | 613 | 1 | 0.006 | 0.035 | 0.171 |
| mir1 | 12 | 12 | 65 | 937 | 1 | 0.016 | 0.030 | 0.533 |
| mpi | 17 | 9 | 9 | 523 | 0.912 | 0.005 | 0.004 | 1.250 |
| plt1 | 13 | 13 | 42 | 491 | 1 | 0.005 | 0.034 | 0.147 |
| plt2 | 14 | 13 | 24 | 813 | 0.989 | 0.003 | 0.008 | 0.375 |
| pr1 | 16 | 12 | 15 | 658 | 0.967 | 0.005 | 0.016 | 0.297 |
| pr5 | 13 | 11 | 19 | 479 | 0.974 | 0.008 | 0.021 | 0.381 |
| pr6 | 14 | 14 | 26 | 1,110 | 1 | 0.005 | 0.011 | 0.455 |
| prms | 16 | 9 | 21 | 699 | 0.817 | 0.002 | 0.012 | 0.167 |
| rip1 | 14 | 14 | 55 | 1,147 | 1 | 0.008 | 0.020 | 0.400 |
| rip2 | 13 | 13 | 21 | 615 | 1 | 0.007 | 0.016 | 0.438 |
| wip1 | 14b | 9 | 25 | 458 | 0.990 | 0.006 | 0.026 | 0.280 |
| zlp | 14 | 12 | 14 | 727 | 0.923 | 0.002 | 0.012 | 0.167 |
| Nondefense | ||||||||
| adh1 | 8c | 7 | 59 | 1,261 | 0.964 | 0.001 | 0.028 | 0.036 |
| bz2 | 12d | 8 | 15 | 590 | 0.939 | 0.002 | 0.015 | 0.147 |
| c1 | 11e | 7 | 29 | 635 | 0.909 | 0.002 | 0.026 | 0.065 |
| csu381 | 10d | 10 | 29 | 917 | 1 | n/a | 0.014 | — |
| csu1132 | 8d | 7 | 42 | 531 | 0.964 | n/a | 0.020 | — |
| d8 | 13d | 13 | 46 | 791 | 1 | 0.002 | 0.037 | 0.065 |
| glb1 | 8f | 8 | 75 | 991 | 1 | 0.014 | 0.037 | 0.391 |
| tb1 | 7d | 7 | 88 | 2,702 | 1 | 0.002 | 0.016 | 0.160 |
| ts2 | 10d | 10 | 17 | 975 | 1 | 0.001 | 0.016 | 0.087 |
| waxy | 9e | 9 | 36 | 1,221 | 1 | 0.002 | 0.016 | 0.101 |
Data from Tiffin (2004).
Data from Tiffin and Gaut (2001a).
Data from Eyre-Walker et al. (1998).
Data from Tenaillon et al. (2004).
Data from Zhang et al. (2002).
Data from Hilton and Gaut (1998).
Statistical Analyses
Nucleotide diversity at each locus was estimated using both the average number of pairwise differences per site between sequences, π (Nei 1987), and the average number of segregating sites per site, θ (Watterson 1975), for both nonsynonymous and silent sites, separately. We also calculated haplotype diversity, Hd (as in Nei 1987, but replacing 2n with n), for each locus. The tests of Tajima (D, 1989) and Fu (Fs, 1997) were used to test whether the frequency distribution of polymorphic sites deviated from the neutral equilibrium expectation. The test of Fay and Wu (H, 2000) was used to test for an excess of high-frequency–derived variants, and the test of McDonald and Kreitman (MK, 1991) was used to test whether the ratio of replacement to synonymous substitutions is equal to the ratio of replacement to synonymous polymorphism; both tests incorporate information on divergence from the outgroup, T. dactyloides. Statistical significance for Fu's Fs and Fay and Wu's H was assessed using coalescent simulations of 10,000 genealogies based on the number of segregating sites and assuming no recombination. Analyses of diversity and tests of neutrality for individual genes were conducted in DnaSP 4.0 (J. Rozas and R. Rozas 1999). We used multilocus HKA tests (Hudson, Kreitman, and Aguadé 1997) as implemented in software available from Jody Hey (Rutgers University, http://lifesci.rutgers.edu/∼heylab/HeylabSoftware.htm) to test for deviations from the null hypothesis of a correlation between intraspecific diversity and interspecific divergence for defense and nondefense genes separately. We also conducted MK tests on pooled data from all defense genes and pooled data from all nondefense genes (see Schlenke and Begun 2003).
To compare directly the evolutionary histories of defense to nondefense genes, we used three approaches. First, we compared levels of diversity based on Hd, π, and θ between defense and nondefense genes using nonparametric Wilcoxon two-sample tests. Second, we used contingency tests to directly compare the distribution of polymorphism and fixed differences at replacement and synonymous sites between defense and nondefense genes. Third, we used the newly developed maximum-likelihood HKA test of Wright and Charlesworth (2004) to test for evidence of selection acting on defense genes by comparing ratios of intraspecific diversity to interspecific divergence at defense and nondefense genes (implemented in the program MLHKA available from Stephen I. Wright, York University, http://www.yorku.ca/stephenw/). Tests were conducted by comparing the fit of a neutral model to a model allowing for selection on all defense genes (full-selection model). If the full-selection model provided a significantly higher likelihood compared to the neutral model, we conducted a second test to compare the full-selection model to a simpler model that allowed for selection only on defense genes that exhibited strong deviations from neutrality (i.e., k > 2 or k < 0.5; see below). The neutral model is fit to the data by fitting a locus-specific θ, a species divergence time, T, and a selection parameter, k, which is fixed across all loci (k1 = k2 = ⋯ kr = 1). A model allowing for selection on defense genes also fits a separate θ for each locus but differs from the neutral model in allowing separate k values for each defense locus. The k values for reference (nondefense) genes in the selection models are fixed (k = 1) as in the neutral model (Wright and Charlesworth 2004). Regardless of the selection parameters, all models assume no recombination within loci, free recombination between loci, the standard neutral model of coalescence in a panmictic population, and the likelihood of the model is maximized using a Markov chain Monte Carlo approach (Wright and Charlesworth 2004). Preliminary analyses revealed that chains run for 1 or 10 million steps converged on very similar likelihoods, and therefore, we report on models that were fit with 1 million steps. Each model was fit using five independent runs with a different random-number seed. We used the mean likelihood and mean value of k averaged across the five independent runs of each model to evaluate whether selection had acted on defense genes. The goodness of fit of the different models was compared using likelihood-ratio tests where the difference in twice the log-likelihood between models was compared to a χ2 distribution.
Results
Sequence Diversity
We compared genetic diversity between defense and nondefense genes within each species by examining haplotype diversity, Hd, the average pairwise nucleotide differences between sequences, π, and the average number of segregating sites per site, θ. In diploperennis, haplotype diversity (Hd) was significantly lower for defense than nondefense genes (fig. 1; mean ± SE for Hd: 0.75 ± 0.07 vs. 0.95 ± 0.02; Wilcoxon two-sample test, P = 0.02). Although differences in Hd between gene classes may arise because of differences in the number of segregating sites, we did not find significantly fewer segregating sites in defense (mean S = 15.44 ± 2.40) compared to nondefense genes (mean S = 22.75 ± 5.22, Wilcoxon two-sample test, P = 0.17). Nevertheless, this difference in Hd should be interpreted with caution because the sample size of nondefense genes was small and the mean number of segregating sites was higher in nondefense genes (table 1). The average pairwise number of nucleotide differences per site, π, measured using either nonsynonymous (πrep) or silent sites (πsilent) in diploperennis did not differ significantly between defense and nondefense genes (mean πrep: 0.0044 vs. 0.0036, Wilcoxon two-sample test, P = 0.705; mean πsilent: 0.0103 vs. 0.0112, P = 0.720). We also did not find differences between gene classes in πrep/πsilent (fig. 2; Wilcoxon two-sample test, P = 0.841) or in nucleotide diversity measured using θ for either nonsynonymous or silent sites (P = 0.925 for both tests).
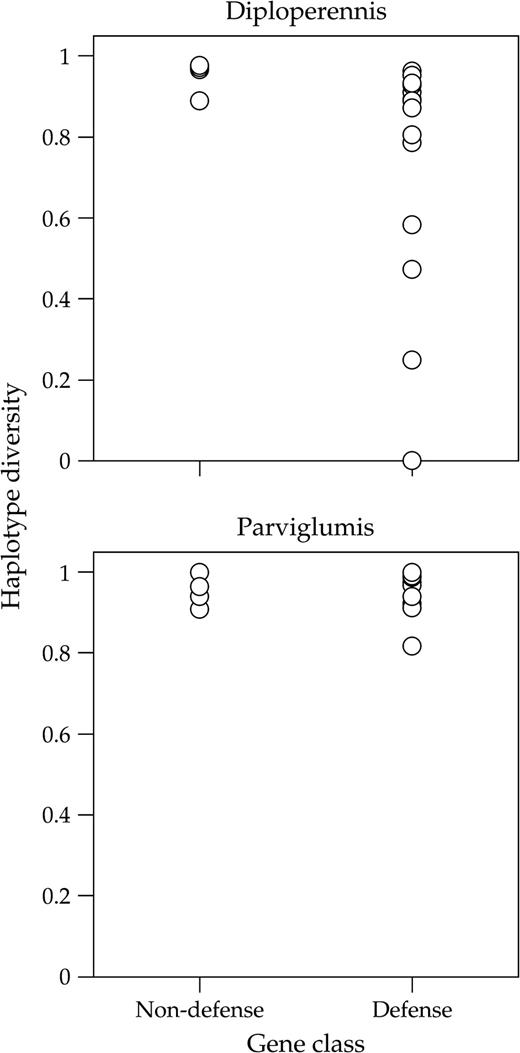
Haplotype diversity in defense and non-defense genes in Zea diploperennis and Zea mays ssp. parviglumis.
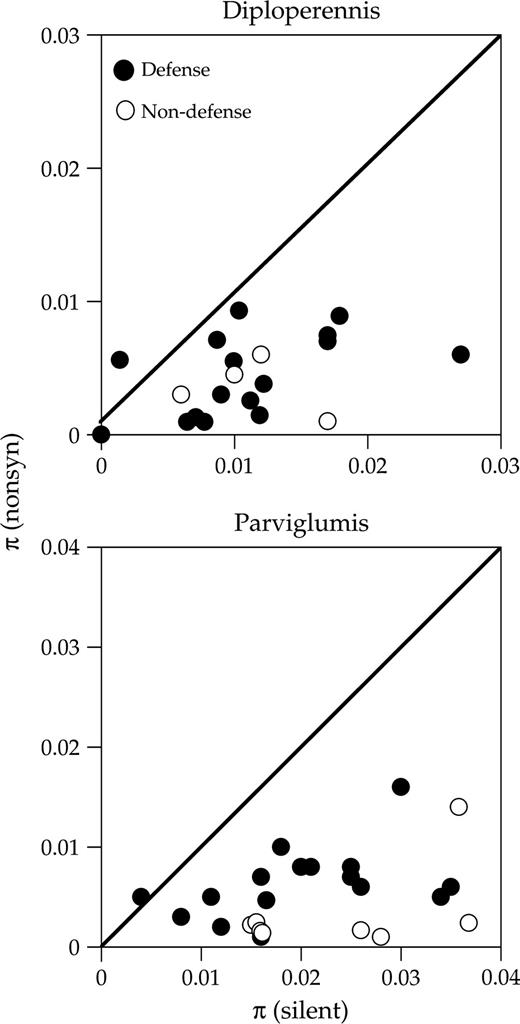
The relationship between πrep and πsyn for defense and nondefense genes in Zea diploperennis and Zea mays ssp. parviglumis. The solid line indicates πrep/πsyn = 1.
In parviglumis, we found no significant difference in haplotype diversity at defense compared to nondefense genes (fig. 1; Hd = 0.97 vs. 0.98; Wilcoxon two-sample test, P = 0.65). However, nucleotide diversity for replacement sites, πrep, was significantly greater for defense compared to nondefense genes (fig. 2; 0.0059 vs. 0.0033; Wilcoxon two-sample test, P = 0.018), but πsilent did not differ significantly between gene classes (πsilent: 0.0190 vs. 0.0224; Wilcoxon two-sample test, P = 0.325). The difference in diversity at replacement sites is reflected in a significantly higher πrep/πsilent at defense than nondefense genes (fig. 2; 0.366 vs. 0.132; Wilcoxon two-sample test, P = 0.004). A comparison of θ between gene classes also showed evidence of elevated diversity at nonsynonymous sites (P = 0.009) but not silent sites (P = 0.563) in defense genes.
Tests of Neutral Evolution Conducted on Individual Genes
We applied four commonly used tests of neutrality, Tajima's D, Fu's Fs, Fay and Wu's H, and the MK test, to each of the defense genes individually. For diploperennis, Tajima's D was significantly negative for one gene, prms (D = −1.76, P < 0.05), and Fu's Fs was significantly negative for two defense genes, mpi and zlp (mpi: Fs = −3.57, P < 0.05; zlp: Fs = −4.80, P < 0.001; fig. 3; see also Table 2 of Supplementary Material online). For chiA, an absence of segregating sites indicates that this gene may have also experienced a recent selective sweep although the lack of segregating sites prevents calculation of either Tajima's D or Fu's Fs. Across gene classes, however, we did not detect a significant difference in Tajima's D between defense and nondefense genes (Wilcoxon two-sample test, P = 0.689); estimates of Fu's Fs could not be compared between gene classes because values of Fs scale with the number of segregating sites. Fay and Wu's H was not significantly different from expectation under neutrality for any of the 11 diploperennis genes for which we had an outgroup sequence (see Table 2 of Supplementary Material online). Similarly, MK tests provided evidence of nonneutrality in only one gene, chiB, a result previously reported in Tiffin (2004). Multilocus HKA tests corroborated evidence for the apparent heterogeneity in evolutionary histories of defense genes revealed by single-locus tests (P = 0.042). Based on marginal χ2 deviations, three of seven defense loci appear to be responsible for this heterogeneity: two loci (chiA, mpi) showed reduced levels of polymorphism and elevated divergence, while one locus (rip1) showed elevated levels of polymorphism and reduced divergence. We found no evidence for significant heterogeneity among nondefense genes (P = 0.822); however, it should be noted that the small number of nondefense genes included in the analysis means that there was little power to detect heterogeneous patterns of diversity.
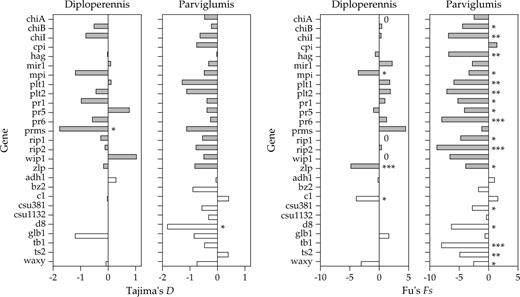
Tajima's D and Fu's Fs values calculated for individual defense (shaded bars) and nondefense genes (open bars) in Zea diploperennis and Zea mays ssp. parviglumis. Levels of statistical significance are indicated by asterisks (*P < 0.05, **P < 0.01, ***P < 0.001). Values of Tajima's D and Fu's Fs are provided in Table 2 of the Supplementary Material online.
For parviglumis, Tajima's D did not deviate from neutral expectation for any defense gene. By contrast, Fu's Fs, a test that is particularly sensitive to the effects of population expansion (Fu 1997), was significantly negative for 12 of 17 defense and 5 of 10 nondefense genes in parviglumis. Consistent with results from individual genes, the set of defense genes did not differ significantly from the set of nondefense genes for Tajima's D (Wilcoxon two-sample test, P = 0.688). The common rejection of the neutral model in both gene classes by Fu's Fs test, as well as consistently negative values of both Tajima's D (25 of 27 genes) and Fu's Fs (24 of 27 genes), suggests that demographic history has had a strong influence on patterns of diversity in parviglumis (fig. 3). Fay and Wu's H test, which could be conducted only for those genes for which we had an outgroup sequence (18 genes), was significantly negative for one defense gene in parviglumis, cpi2 (Table 2 of Supplementary Material online). MK tests were not significant for any individual gene. Similarly, multilocus HKA tests revealed no evidence for significant heterogeneity in the evolutionary history of defense genes (P = 0.931) or nondefense genes (P = 0.388).
Comparative Multilocus Tests of Neutrality Using Defense and Nondefense Genes
MK tests conducted on data pooled for each gene class revealed no evidence for selection having acted on either defense or nondefense genes in either species (table 3). However, a 4 × 2 contingency test comparing defense to nondefense genes revealed significant heterogeneity in the distribution of fixed and polymorphic replacement and synonymous sites in parviglumis (table 3; P < 0.001) but not diploperennis (P = 0.615). Partitioning the contingency table for parviglumis between polymorphism and divergence revealed that significant heterogeneity in the 4 × 2 test was due mainly to heterogeneity in the ratio of replacement to synonymous polymorphic sites between gene classes (P < 0.001) and not the ratio of replacement to synonymous fixed differences between gene classes (P = 0.145). This significant heterogeneity in polymorphism could be due to any of the cells in the contingency table. Nevertheless, assuming that nondefense genes represent expectations under neutrality, then significance is most likely due to an excess of replacement polymorphism in defense genes (table 3), a finding consistent with the significantly elevated levels of πrep and πrep/πsilent at defense compared to nondefense genes.
Results of MK Tests for Data Pooled Within Gene Classes and Comparisons of the Distribution of Polymorphism and Divergence for Replacement and Synonymous Sites Between Gene Classesa
Defense Versus Nondefense | ||||||||||
|---|---|---|---|---|---|---|---|---|---|---|
| Polymorphism | Divergence | MK | Polymorphism | Divergence | All | |||||
| Replb | Sync | Repl | Syn | χ2 (P) | χ2 (P) | χ2 (P) | χ2 (P) | |||
| diploperennis | ||||||||||
| Defense | 28 | 37 | 56 | 56 | 0.791 (0.374) | 0.362 (0.547) | 1.271 (0.260) | 1.799 (0.615) | ||
| Nondefense | 22 | 23 | 29 | 41 | 0.618 (0.432) | |||||
| parviglumis | ||||||||||
| Defense | 76 | 66 | 59 | 59 | 0.320 (0.572) | 16.984 (<0.001) | 2.123 (0.145) | 19.295 (<0.001) | ||
| Nondefense | 45 | 106 | 47 | 69 | 3.336 (0.068) | |||||
Only those genes for which we were able to obtain a sequence from the outgroup, Tripsacum dactyloides, were included in the analyses. Defense genes: chiA, chiB, cpi, hag, mpi, pr1, rip1, and wip1. Nondefense genes: adh1, bz2, c1, csu381, csu1132, d8, glb1, tb1, ts2, and waxy.
Number of replacement polymorphisms.
Number of synonymous polymorphisms.
The standard multilocus HKA test (results reported earlier) indicated that not all defense genes have experienced similar selective histories within diploperennis; however, it does not provide a direct test of whether selection has shaped diversity at defense loci differently than at nondefense loci. To test this, we used the maximum-likelihood HKA test of Wright and Charlesworth (2004) to compare the fit of a neutral model (selection parameter, k = 1 for all loci) to a model in which selection was allowed to act on defense (variable k) but not nondefense genes. For diploperennis, a likelihood-ratio test revealed that the selection model fit the data significantly better than the neutral model (table 4; χ2 = 21.52, df = 7, P = 0.003) providing evidence for the action of selection on defense genes. To test whether the rejection of the neutral model was due to all or only a subset of the defense genes, we then compared the full-selection model to a model that allowed for selection only on the four loci identified by the first selection model as putative targets of selection (chiA and mpi, both with k < 0.33, and pr1 and rip1, both with k > 2.0; k measures the relationship between polymorphism and divergence and is expected to be 1 under neutrality). This reduced model also provided a significant improvement over the neutral model (χ2 = 20.77, df = 4, P < 0.001). The full-selection model did not, however, provide a significantly better fit than the reduced-selection model (χ2 = 0.76, df = 3, P = 0.859). Therefore, it appears as though a subset of the defense loci (chiA, mpi, pr1, and rip1) is responsible for driving the significant difference in the evolutionary history of defense versus nondefense genes. Estimates of the selection parameter, k, indicated that polymorphism was elevated more than twofold relative to neutral (non-defense gene) expectations for rip1 and pr1 (k = 2.12 and 2.86, respectively); whereas, polymorphism was approximately one-fourth of neutral expectations in mpi (k = 0.26) and strongly reduced for chiA (k = 0). To confirm that significant heterogeneity is restricted to defense genes, we also tested whether a model allowing for selection on nondefense genes (while constraining the defense genes to evolve neutrally) provides an improved fit over a strictly neutral model. This model did not fit the data significantly better than a neutral model regardless of whether all defense genes or only those not identified as having significant values of k were used as reference loci (both P > 0.90). Moreover, the k values for the four defense genes identified as having been shaped by selection fell outside the range of k values for the nondefense genes (range = 0.85–1.89). In contrast to diploperennis, a model allowing for selection on all defense genes did not provide a significantly better fit to the data than a neutral model for parviglumis (table 4; χ2 = 0.36, df = 8, P = 0.99). Similarly a model allowing for selection on nondefense genes, but not defense genes, did not fit the data significantly better than a neutral model (χ2 = 3.83, df = 7, P = 0.80).
Results from Maximum-Likelihood HKA Tests Comparing the Fit of a Neutral Model to Models Allowing for Selection on Either Defense Loci or Nondefense loci
Model | ln L | Model Comparison | Likelihood-Ratio Statistic (df) | P |
|---|---|---|---|---|
| diploperennis | ||||
| A Neutral | −64.32 | |||
| B Selection, 7 defense loci | −53.56 | A versus B | 21.52 (7) | 0.003 |
| C Selection, 4 defense loci | −53.94 | A versus C | 20.77 (4) | <0.001 |
| B versus C | 0.76 (3) | 0.859 | ||
| D Selection, 4 nondefense loci | −63.94 | A versus D | 0.76 (4) | 0.944 |
| parviglumis | ||||
| A Neutral | −89.76 | |||
| B Selection, 8 defense loci | −89.94 | A versus B | 0.36 (8) | 0.999 |
| C Selection, 7 nondefense loci | −87.84 | A versus C | 3.83 (7) | 0.799 |
Discussion
In order to further our understanding of the evolutionary history of plant defense genes, we examined the present-day diversity of 16 defense genes in Z. diploperennis and 17 defense genes in parviglumis. The defense genes we sampled encode proteins with diverse biochemical functions, but all are classified as pathogenesis-related proteins and are potentially important in inhibiting attack by pathogens or herbivores. Our specific objectives were twofold: to understand the nature and extent of variation among defense genes in patterns of past selection and to test whether defense genes, as a class, have experienced a different selective history than nondefense genes.
For Z. diploperennis, we found significant heterogeneity in the evolutionary histories of defense genes. Specifically, multilocus tests of homogeneity in the ratio of polymorphism to divergence identified two genes (chiA and mpi) with low diversity relative to divergence and two genes (pr1 and rip1) that harbor an excess of intraspecific polymorphism relative to divergence.
The reduced diversity found at the chitinase gene, chiA, and protease inhibitor, mpi, are consistent with a history of positive selection on these or closely linked loci. The possibility of positive selection is also supported by the lack of segregating sites at chiA (Tiffin 2004) and the significantly negative value of Fu's Fs for mpi. There was also evidence suggestive of positive selection from two other genes for which HKA tests could not be performed. A significantly negative Fu's Fs was detected for the putative dual α-amylase trypsin inhibitor, zlp, and a significantly negative Tajima's D was detected for the pr1-like prms. It is important to note that two of 15 defense and one of 4 nondefense genes had significantly negative values for Fu's Fs, suggesting that demographic forces may be responsible for the rejection of the neutral equilibrium model. However, if demographic forces are responsible, they do not appear to have affected diversity across the genome—12 of 19 values of Fs were positive. Similarly, the single significantly negative Tajima's D value may not reflect selection but simply a false positive, which is possible given that we conducted 19 separate tests in Z. diploperennis. The evidence of positive selection acting on chiA and mpi is consistent with expectations from coevolutionary arms-race models (Dawkins and Krebs 1979), which predict recurrent selective sweeps on defense genes. It is also possible, however, that these genes are not on a path to fixation as classic arms-race models predict. Rather, they may be evolving in a manner consistent with expectation from allelic cycling models (May and Anderson 1983; Seger 1988, 1990; Frank 1993; Stahl et al. 1999) which predict that periods of positive selection will drive the selected alleles to high frequency but that the selective environment will change before the alleles reach fixation.
In contrast to the defense genes that show reduced diversity as expected under positive selection, pr1 and rip1 harbor an excess of diversity relative to divergence, a pattern often interpreted as evidence of balancing selection. However, we found no other evidence for balancing selection acting on these loci—Tajima's D values are negative, linkage disequilibrium is not more extensive at these than at other loci (data not shown), and genealogies do not show evidence for distinct allelic classes (not shown). Therefore, it does not appear that selection has maintained a long-lived polymorphism at these loci. It is, however, possible that the elevated levels of diversity reflect a more complicated form of enemy-imposed selection or antagonistic coevolution, perhaps associated with ongoing or periodic selection from multiple genetically distinct enemies. Regardless of whether the evidence for nonneutral evolution provides support for any particular coevolutionary model, our results do provide evidence for substantial variability in the evolutionary histories of downstream components of plant defense response (i.e., PR genes).
Although the significant heterogeneity we detected in intraspecific diversity may reflect the action of selection, these differences may also be due to indirect effects of recombination on genetic diversity (Begun and Aquadro 1993). For example, chiA and mpi may be located in regions of low recombination and thus be more affected by background selection (B. Charlesworth, Morgan, and D. Charlesworth 1993; Hudson and Kaplan 1995) and hitchhiking (Maynard-Smith and Haigh 1974; Kaplan, Hudson, and Langley 1989), whereas pr1 and rip1 may be located in regions of high recombination. Under this scenario, the remainder of the defense and nondefense genes would be expected to reside in regions of “normal” recombination. Excluding recombination as an explanation for our results would require information on the recombinational landscape and the genomic location of each gene in Z. diploperennis, which is not available. However, two lines of evidence suggest that differences in rates of recombination do not explain the variation in diversity we detected. First, the estimated recombination rate, R (Hudson 1987), for mpi is higher than the average calculated for the defense genes, the estimate for pr1 is lower than the average, and the estimate for rip1 is toward the upper end of the range but not markedly different from other genes (Supplementary Material Table 2, chiA harbors no polymorphic sites and thus R could not be calculated). Second, if recombination strongly affects diversity, then we might expect to find low diversity at chiA and mpi and high diversity at pr1 and rip1 in the closely related species parviglumis, which we do not (Supplementary Material Table 2). Finally, we note that there is some evidence that the positive relationship between recombination rate and nucleotide diversity may not be as strong in Zea as has been found in other systems (Tenaillon et al. 2002).
In contrast to Z. diploperennis, in which a subset of defense genes may have experienced recent selection, we found no evidence for selection having acted on individual PR genes in parviglumis. Although our ability to detect selection may have been limited by small sample sizes, we did find that patterns of intraspecific diversity were considerably different in the two species. In particular, we found a significant excess of replacement polymorphism segregating at defense genes in parviglumis but not diploperennis. Specifically, πrep and πrep/πsilent were higher at defense than nondefense genes, and contingency tests revealed significant heterogeneity in the distribution of fixed and polymorphic sites in defense compared to nondefense genes, apparently due to an excess of replacement polymorphism in defense genes. Interestingly, elevated replacement polymorphism has been detected at other genes involved in mediating antagonistic coevolution, including a pathogen recognition gene in A. thaliana (rpp13, Rose et al. 2004), a protease inhibitor in European Aspen (Ingvarsson, 2005), inducible antibacterial peptide genes in D. melanogastor (Lazzaro and Clark 2003), and genes involved in sperm competition in several Drosophila species (Begun et al. 2000; Kern, Jones, and Begun 2004). At least four processes may explain the elevated levels of replacement diversity we found in parviglumis: relaxed selective constraints, stable balanced polymorphisms, transient or episodic selection that favors specific alleles only when those alleles are rare, or geographically variable selection on defense genes.
Higher levels of replacement polymorphism in defense compared to nondefense genes could result from relaxed selective pressure on defense genes, allowing for an accumulation of slightly deleterious mutations. Selective constraints may be relaxed if there has been a change in the functional importance of defense genes, either due to reductions in enemy population sizes, the evolution of counterdefense mechanisms in enemy populations, or the evolution of tolerance in the host plants. Although we cannot exclude the possibility of relaxed selection, two aspects of the data suggest that relaxed selective constraints are not the primary explanation for the elevated levels of replacement polymorphism. First, we found no null alleles or frameshift mutations in our sample of 239 defense alleles from parviglumis, making it unlikely that selection has been relaxed over any appreciable period of time. Second, the evidence for positive selection in diploperennis suggests that at least some defense genes are functional in this closely related species.
Higher levels of replacement polymorphism at defense genes may also reflect the action of selection maintaining polymorphism; however, we found little corroborating evidence for this hypothesis. Under simple models of balanced polymorphism, we expect to find elevated levels of polymorphism at silent sites surrounding the target of selection and high linkage disequilibrium (e.g., Kreitman and Hudson 1991; Richman, Uyenoyama, and Kohn 1996). Although both these patterns have been found at other defense loci at which polymorphism appears to be maintained by selection (e.g., Tian et al. 2002; Kroymann et al. 2003; Mauricio et al. 2003), neither was apparent in our data. In fact, the genetic association between polymorphic sites, estimated for each gene by ZnS (Kelly 1997), was greater, although not significantly so, in nondefense genes (t = 1.82, P = 0.081). In addition, Tajima's D is expected to be positive under simple balanced polymorphism models, but our analyses revealed negative Tajima's D for all 17 defense genes. These summary statistics, therefore, suggest that it is unlikely that balancing selection maintains amino acid diversity at these loci.
A third possible explanation for the excess of replacement polymorphisms is that defense genes experience transient episodes of positive selection. Specifically, rare allelic variants may rapidly increase in frequency when enemy pressure is strong and resistance enhances plant fitness but later may become selectively neutral due to enemy counteradaptation or a low frequency of attack, i.e., rare or novel allele advantage (Haldane 1949; Tiffin and Gaut 2001a; de Meaux and Mitchell-Olds 2003; Lazarro and Clark 2003). This pattern of selection differs from balancing selection in that polymorphism is not necessarily maintained by natural selection but rather accrues due to periodic bursts of positive selection.
Finally, elevated replacement polymorphism may result from population structure coupled with local selection on defense genes. Population structure as well as population expansion or contraction can cause the frequency of polymorphic sites to deviate from expectations under a neutral model (B. Charlesworth, Nordborg, and D. Charlesworth 1997; B. Charlesworth, D. Charlesworth, and Barton 2003) and result in significantly negative values of Tajima's D and Fu's Fs (Tajima 1989; Fu 1997; Wright and Gaut 2005). We found negative Tajima's D and Fu's Fs values for virtually all defense and nondefense genes sampled from parviglumis, suggesting that demographic factors have strongly influenced the frequency spectrum of polymorphic sites (see also Zhang et al. 2002). Moreover, the present-day distribution of parviglumis, which is found in geographically distinct populations spread across south-central and southwestern Mexico (Ruiz, Sánchez G., and Aguilar S. 2001), as well as evidence for recent climate change in the region (Buckler, Pearsall, and Holtsford 1998) make it reasonable to think that patterns of polymorphism in parviglumis may be shaped by demographic forces and historical shifts in distribution and abundance. If population structure coupled with local selection is responsible for the significant excess of replacement polymorphisms we detected in parviglumis, then it may not be surprising that we found distinctly different patterns of diversity in parviglumis and diploperennis. Unlike parviglumis, with populations spread across south-central and southwestern Mexico, diploperennis has a limited geographic range (Sanchez G. et al. 1998; Ruiz, Sánchez G., and Aguilar S. 2001), and summary statistics based on the frequency spectrum of polymorphic sites reveal no evidence of population structure or nonequilibrium population dynamics (fig. 3).
Because the effect of demographic history should be independent of gene function, population expansion or population structure alone cannot account for the elevated replacement polymorphism we found at defense compared to nondefense loci. Geographically variable selection on defense genes, by contrast, may lead to the fixation of different amino acid–changing alleles in different partially isolated populations (Begun and Aquadro 1993; Slatkin and Wiehe 1998; Barton 2000) and therefore to high levels of replacement polymorphism in species-wide samples. Evidence for local adaptation in host-parasite interactions has been found in several systems (reviewed in Kaltz and Shykoff 1998; Van Zandt and Mopper 1998; Bergelson, Dwyer, and Emerson 2001; Kniskern and Rausher 2000), suggesting that spatial variation in selection and adaptive differentiation is at least plausible in parviglumis. Unfortunately, relatively little is known about the natural enemies that attack teosintes, let alone the patterns of selection imposed by these enemies or the geographic scale over which this selection acts in contemporary populations. Regardless of short-term ecological and evolutionary dynamics in contemporary populations, hierarchical spatial sampling of DNA sequence diversity should reveal whether local adaptation has been important in shaping defense gene diversity over longer periods of time.
Michael Nachman, Associate Editor
We are grateful to Jesse Stringer for assistance with laboratory work; Brandon Gaut, John Doebley, and USDA North Central Regional Plant Introduction Station for providing seeds that made this study possible; Maud Tenaillon for alignments of Zea mays ssp. parviglumis nondefense genes; and three anonymous reviewers for helpful comments that improved the manuscript. Funding was provided by the National Science Foundation Grant DEB 0235027 to P.T.
References
Begun, D. J., and C. F. Aquadro.
Begun, D. J., P. Whitley, B. L. Todd, H. M. Waldrip-Dail, and A. G. Clark.
Bergelson, J., G. Dwyer, and J. J. Emerson.
Bergelson, J., M. Kreitman, E. A. Stahl, and D. Tian.
Bishop, J. G., A. M. Dean, and T. Mitchell-Olds.
Bishop, J. G., D. R. Ripoll, S. Bashir, C. M. B. Damasceno, J. D. Seeds, and J. K. C. Rose.
Buchel, A. S., and H. J. M. Linthorst.
Buckler, E. S., D. M. Pearsall, and T. P. Holtsford.
Caicedo, A. L., B. A. Schaal, and B. A. Kunkel.
Charlesworth, B., D. Charlesworth, and N. H. Barton.
Charlesworth, B., M. T. Morgan, and D. Charlesworth.
Charlesworth, B., M. Nordborg, and D. Charlesworth.
Clauss, M. J., and T. Mitchell-Olds.
Dawkins, R., and J. R. Krebs.
de Meaux, J., and T. Mitchell-Olds.
Eyre-Walker, A., R. L. Gaut, H. Hilton, D. L. Feldman, and B. S. Gaut.
Fay, J. C., and C.-I. Wu.
Fu, Y.-X.
Hall, T. A.
Hilton, H., and B. S. Gaut.
Hudson, R. R.
Hudson, R. R., and N. L. Kaplan.
Hudson, R. R., M. Kreitman, and M. Aguadé.
Huynh, Q. K., C. M. Hironaka, E. B. Levine, C. E. Smith, J. R. Borgmeyer, and D. M. Shah.
Iltis, H. H., J. F. Doebley, R. Guzman, and B. Pazy.
Ingvarsson, P. K.
Jensen, A. B., R. Leah, B. Chaudhry, and J. Mundy.
Jiggins, F. M., and G. D. D. Hurst.
Kader, J. C.
Kaplan, N. L., R. R. Hudson, and C. H. Langley.
Kawabe, A., and N. T. Miyashita.
Kern, A. D., C. D. Jones, and D. J. Begun.
Kreitman, M., and R. R. Hudson.
Kroymann, J., S. Donnerhacke, D. Schnabelrauch, and T. Mitchell-Olds.
Lazzaro, B. P., and A. G. Clark.
Matsuoka, Y., Y. Vigouroux, M. M. Goodman, J. Sanchez G., E. S. Buckler, and J. Doebley.
Mauricio, R., E. A. Stahl, T. Korves, D. Tian, M. Kreitman, and J. Bergelson.
May, R. M., and R. M. Anderson.
Maynard-Smith, J. and J. Haigh.
McDonald, J. H., and M. Kreitman.
Menezes, H., and C. Jared.
Meyers, B. C., K. A. Shen, P. Rohani, B. S. Gaut, and R. W. Michelmore.
Mondragon-Palomino, M., B. Meyers, R. Michelmore, and B. Gaut.
Morris, S. W., B. Vernooij, S. Titatarn, M. Starrett, S. Thomas, C. C. Wiltse, R. A. Frederiksen, A. Bhandhafalck, S. Hulbert, and S. Uknes.
Murillo, I., L. Cavallarin, and B. San Segundo.
Muthukrishnan, S., G. H. Liang, H. N. Trick, and B. S. Gill.
Nielsen, K., G. A. Payne, and R. S. Boston.
Nimchuk, Z., T. Eulgem, B. F. Holt III, and J. L. Dangl.
Pechan, T., A. Cohen, W. P. Williams, and D. S. Luthe.
Przeworski, M.
Richman, A. D., M. K. Uyenoyama, and J. R. Kohn.
Rose, L. E., P. D. Bittner-Eddy, C. H. Langley, E. B. Holub, R. W. Michelmore, and J. L. Beynon.
Rozas, J., and R. Rozas.
Ruiz, J. A., J. Sánchez G., and M. Aguilar S.
Ryan, C. A.
Sanchez G., J. G. Sanchez, Y. Kato, M. Aguilar S., H. M. Hernandez C., A. Lopez R., and J. A. Ruiz C.
Schlenke, T. A., and D. J. Begun.
Schlumbaum, A., F. Mauch, U. Vogelli, and T. Boller.
Seger, J.
———.
Slatkin, M., and T. Wiehe.
Stahl, E. A., G. Dwyer, R. Mauricio, M. Kreitman, and J. Bergelson.
Stotz, H. U., J. G. Bishop, C. W. Bergmann, M. Koch, P. Albersheim, A. G. Darvill, and J. M. Labavitch.
Tajima, F.
Tenaillon, M. I., M. C. Sawkins, L. K. Anderson, S. M. Stack, J. Doebley, and B. S. Gaut.
Tenaillon, M. I., J. U'ren, O. Tenaillon, and B. S. Gaut.
Tian, D. C., H. Araki, E. A. Stahl, J. Bergelson, and M. Kreitman.
Tiffin, P.
Tiffin, P., and B. S. Gaut.
———.
Tiffin, P., R. Hacker, and B. S. Gaut.
Van Zandt, P. A., and S. Mopper.
Velazhahan, R., S. K. Datta, and S. Muthukrishnan.
Wang, G.-L., D.-L. Ruan, W.-Y. Song et al. (12 co-authors).
Ward, E. R., S. Uknes, S. C. Williams, S. Dincher, D. L. Wiederhold, D. C. Alexander, P. Ahl-Goy, J. P. Metraux, and J. A. Ryals.
Watterson, G. A.
Wright, S. I., and B. Charlesworth.
Wright, S. I., and B. S. Gaut.
