


Abstract
Mouse models are often used to study human genes because it is believed that the expression and function are similar for the majority of orthologous genes between the two species. However, recent comparisons of microarray data from thousands of orthologous human and mouse genes suggested rapid evolution of gene expression profiles under minimal or no selective constraint. These findings appear to contradict non–array-based observations from many individual genes and imply the uselessness of mouse models for studying human genes. Because absolute levels of gene expression are not comparable between species when the data are generated by species-specific microarrays, use of relative mRNA abundance among tissues (RA) is preferred to that of absolute expression signals. We thus reanalyze human and mouse genome-wide gene expression data generated by oligonucleotide microarrays. We show that the mean correlation coefficient among expression profiles detected by different probe sets of the same gene is only 0.38 for humans and 0.28 for mice, indicating that current measures of expression divergence are flawed because the large estimation error (discrepancy in expression signal detected by different probe sets of the same gene) is mistakenly included in the between-species divergence. When this error is subtracted, 84% of human-mouse orthologous gene pairs show significantly lower expression divergence than that of random gene pairs. In contrast to a previous finding, but consistent with the common sense, expression profiles of orthologous tissues between species are more similar to each other than to those of nonorthologous tissues. Furthermore, the evolutionary rate of expression divergence and that of coding sequence divergence are found to be weakly, but significantly positively correlated, when RA and the Euclidean distance are used to measure expression-profile divergence. These results highlight the importance of proper consideration of various estimation errors in comparing the microarray data between species.
Introduction
Patterns and mechanisms of DNA and protein sequence evolution have been extensively studied in the past three decades (Li 1997; Nei and Kumar 2000). By contrast, little had been known about the general patterns of gene expression evolution until a few years ago when high-throughput gene expression–profiling technologies became available (Cavalieri, Townsend, and Hartl 2000; Enard et al. 2002; Oleksiak, Churchill, and Crawford 2002; Ranz et al. 2003; Rifkin, Kim, and White 2003; Townsend, Cavalieri, and Hartl 2003). Because gene expression evolution links the evolutionary changes of genes and phenotypes, it is of fundamental importance to estimate the rate of gene expression evolution and to look for the underlying molecular mechanisms responsible for transcriptome evolution. Among all the technologies for producing transcriptome data, the DNA (oligonucleotide or cDNA) microarray is most commonly used (Ruan et al. 2004). This technology makes it possible to study the expression of large numbers of genes simultaneously with relatively low cost compared to sequencing-based technologies such as serial analysis of gene expression (Velculescu et al. 1995) and massively parallel signature sequencing (Brenner et al. 2000). Transcriptome data from various tissues in various organisms have been produced using DNA microarrays, making evolutionary analysis of genome-wide gene expression patterns feasible.
Based on oligonucleotide microarray data sets obtained from humans and mice (Su et al. 2002), Yanai, Graur, and Ophir (2004) found that the expression profiles of orthologous genes differ substantively between the two species, suggesting little selective constraint in the evolution of gene expression. Additionally, based on the expression similarity among 32 human and mouse tissues, they found orthologous tissues between species (e.g., human liver and mouse liver) to be less similar than nonorthologous tissues within species (e.g., human liver and human testis). Because tissue functions are determined by the genes expressed in the tissue, these results imply that the human liver is functionally more similar to the human testis than to the mouse liver, which is contrary to the common sense. Based on both oligonucleotide and cDNA microarrays, Khaitovich et al. (2004) found that expression-level divergence between primate species increases linearly with divergence time and that functional genes and expressed pseudogenes have similar rates of expression evolution (Khaitovich et al. 2004). Because pseudogenes evolve without any selective constraint, these results suggest that gene expression evolution is largely neutral, without the influence of either positive or purifying selection (Khaitovich et al. 2004).
These findings are surprising for several reasons. First, it is well established that coding sequences and functions of most orthologous genes are conserved across species (Li 1997). Because a gene must be expressed properly to function in the cell, it is puzzling why gene function should be conserved when the expression changes quickly. Second, the expression pattern and function of human genes are often inferred from their mouse orthologs (e.g., Hinds et al. 1993), based on the assumption that these properties are conserved between the two species. The success of many mouse models of human genes and diseases suggests the validity of this assumption. Studies using traditional non–array-based methods such as the northern analysis showed that the expression profiles of human-mouse orthologs are overall similar, although a quantitative genome-wide measure of mean similarity is difficult to obtain, due to large variations in experimental designs among these individual-gene studies. Third, a recent microarray-based study of the nematode Caenorhabditis elegans showed that transcriptome evolution is significantly faster in laboratory mutation-accumulation strains than in naturally isolated strains (Denver et al. 2005). Because the sizes of the laboratory populations are much smaller than those of the wild populations, the observation of Denver et al (2005) is best explained by purifying selection acting on expression divergence in nature. The rate of expression divergence would have been similar between laboratory and wild populations if gene expression were not under any selection (Kimura 1983).
With these considerations, we reexamined the expression divergence between orthologous genes, based on the oligonucleotide microarray data of human and mouse genes generated by Su et al. (2004). Our choice of this data set is not only because it (or its earlier version) has been used in a number of evolutionary studies (Li 1997; Makova and Li 2003; Huminiecki and Wolfe 2004; Yanai, Graur, and Ophir 2004; Jordan, Marino-Ramirez, and Koonin 2005; Yang, Su, and Li 2005) but also because this data set is one of the largest for humans and mice, the expression divergence between which is of special importance to the biomedical community. Our analysis showed that there is a large error in measuring gene expression using microarrays. When this error is subtracted, the majority of orthologous genes show significantly lower expression-profile divergence between humans and mice than expected under neutrality.
Materials and Methods
Mapping Expression Data to Ensembl Genes
We used the Gene Atlas V2 microarray data set of humans and mice (http://symatlas.gnf.org/). The data set was generated by hybridization of RNA from 79 human and 61 mouse tissues onto the designed Affymetrix microarray chips (humans: U133A/GNF1H; mice: GNF1M) (Su et al. 2004). These human and mouse chips were designed according to the annotated human and mouse genome sequences, respectively. On a chip, each gene is represented by one to several probe sets, each of which comprises 11 pairs of probes. Each pair of probes contains a 25mer oligonucleotide probe that matches the genomic sequence perfectly and the second probe that is identical to the first probe except for the middle nucleotide, which differs from the genomic sequence. To assign the probe sets to their corresponding human or mouse genes, we aligned sequences of each probe set to the Ensembl cDNA sequences (humans: Homo_sapiens.NCBI35.feb.cdna.fa; mice: Mus_musculus.NCBIM33.feb.cdna.fa; http://www.ensembl.org/) using BlastN (http://www.ncbi.nlm.nih.gov/blast/) and retained those probe sets in which all 16 matching probes perfectly matched to the same Ensembl gene. A total of 25,368 probe sets (75.3%) in the human chip corresponding to 16,456 genes and 18,005 probe sets (49.8%) in the mouse chip corresponding to 15,835 genes were used for further analysis. The expression level detected by each probe set was obtained as the signal intensity (S) computed by the MAS 5.0 algorithm (Hubbell, Liu, and Mei 2002). The S values were averaged among replicates.
To compare our results with those of Yanai, Graur, and Ophir (2004), we also analyzed the expression data set used in their study, which is from Su et al. (2002). The results obtained from the two data sets were consistent with each other when the same method was used. We also used the expressional values computed by the robust multiarray averaging (RMA) (Bolstad et al. 2003; Irizarry et al. 2003). The results obtained from MAS 5.0 and RMA algorithms were similar. Thus, only the results derived from the data set Gene Atlas V2 and calculated by MAS 5.0 are presented here.
Human-Mouse Orthologs
Homology information of human and mouse genes was obtained from Ensembl EnsMart (http://www.ensembl.org/Multi/martview) (Kasprzyk et al. 2004). There are several homologous relationships between human and mouse genes annotated by Ensembl. We only considered those pairs of genes annotated as unique best reciprocal hit (meaning that they were unique reciprocal best hits in all-against-all BlastZ searches) as orthologous. A total of 10,607 pairs of human-mouse orthologs have expression information from the microarray data we use. Among these genes, 64.5% of human genes and 86.9% of mouse genes were represented by a single probe set, while the others have multiple probe sets on the chips. Affymetrix probes with name suffixes _x_at and _s_at are believed to be prone to cross-hybridization, compared to other probes (Affymetrix Technical Support, Data Analysis Fundamentals, Appendix B; http://www.affymetrix.com/) and have been considered “suboptimal” (Huminiecki and Wolfe 2004; Yang, Su, and Li 2005). But our analysis showed that the quality of these probes is not worse than other probes (see below). We therefore considered all probe sets equally.
The number of synonymous substitutions per synonymous site (dS) and the number of nonsynonymous substitutions per nonsynonymous site (dN) between human and mouse orthologs were retrieved form Ensembl EnsMart. In this database, dS and dN were estimated by codeml of the PAML package (Yang 1997) using the likelihood method.
Analysis of Gene Expression Data
For the purpose of studying the divergence of expression profiles between human-mouse orthologs, we analyzed 26 common tissues from the two species (see fig. 2 for the tissues examined; note that mouse lower spinal cord was used as the homologous tissue of human spinal cord).
Results and Discussion
The Mean Expression Divergence Between Human-Mouse Orthologs Is Lower Than That Between Random Gene Pairs
To study whether the expression profile is conserved between human and mouse orthologous genes, it is necessary to know the expected value of expression divergence under complete neutrality. Ideally, this value should be estimated using expressed pseudogenes. However, it is unlikely that a functionless pseudogene generated before the separation of primates and rodents would still be retained and expressed in humans and mice. Jordan, Marino-Ramirez, and Koonin (2005) suggested that the expected expression divergence under neutrality can be approximated by the expression difference between a randomly picked human gene and a randomly picked mouse gene. This suggestion was based on the assumption that the expression similarity between human-mouse orthologs has been completely lost under neutrality. Following this logic, we compared expression divergence of orthologous human and mouse genes with that of randomly paired human and mouse genes. Our data set included 10,607 orthologous gene pairs, each with expression information from 26 common tissues from the two species (see Materials and Methods). For a gene of a species, the signal intensity (S) values from all the tissues were transformed to the RA values, which are the signal intensities in individual tissues divided by the total signals in all the tissues considered (see eq. 1 in Materials and Methods). The reason for using RA, instead of S, is that the absolute expression signal is not meaningful in the human-mouse comparison as different microarrays were used for the two species. We then used 1 − Pearson's correlation coefficient (r) to measure the divergence of expression profile between species (see eq. 2 in Materials and Methods). Note that r can vary between −1 and 1, thus the value of 1 − r ranges from 0 to 2. Higher r means lower 1 − r and indicates smaller expression divergence. For randomly paired human-mouse genes, the mean r is 0.002 and the median r is −0.024 (fig. 1a). Hence, on average, randomly paired human and mouse genes show no expression similarity, as expected. For human and mouse orthologous gene pairs, the mean r is 0.216 and the median r is 0.165. Orthologous genes have significantly higher r values than random gene pairs do (P < 10−280, Mann-Whitney U test). Thus, the expression divergence between human and mouse orthologous genes is on average lower than expected under complete neutrality, suggesting that expression evolution has been under purifying selection. We also used another commonly used measure of expression divergence, Euclidean distance (d) (see eq. 3 in Materials and Methods), which is always positive. Higher d indicates greater expression divergence. We found that human-mouse orthologs have a mean d of 0.180 and a median d of 0.149 (fig. 1b). By contrast, human-mouse random gene pairs have a mean d of 0.229 and a median d of 0.177 (fig. 1b). Again, expression divergence measured by Euclidean distances is lower between orthologous gene pairs than between random pairs (P < 10−151, Mann-Whitney U test), consistent with the result obtained from the use of r. These results support the findings of Yanai, Graur, and Ophir (2004) and Jordan, Marino-Ramirez, and Koonin (2005), although they used different data sets and/or different ways of analysis. For example, Yanai, Graur, and Ophir (2004) used an earlier version of the microarray data (Su et al. 2002), which was considerably smaller than the version used here. They also removed those genes with more than one probe set on the chip. The number of orthologous gene pairs they analyzed was only 1,350, compared with 10,607 in our analysis. When multiple probe sets are available for a gene, Jordan, Marino-Ramirez, and Koonin (2005) picked the probe set that showed the highest S, while we randomly picked a probe set. Because it is unclear whether the use of the probe set with the highest expression signal introduces biases, our result should be less influenced by such potential biases.
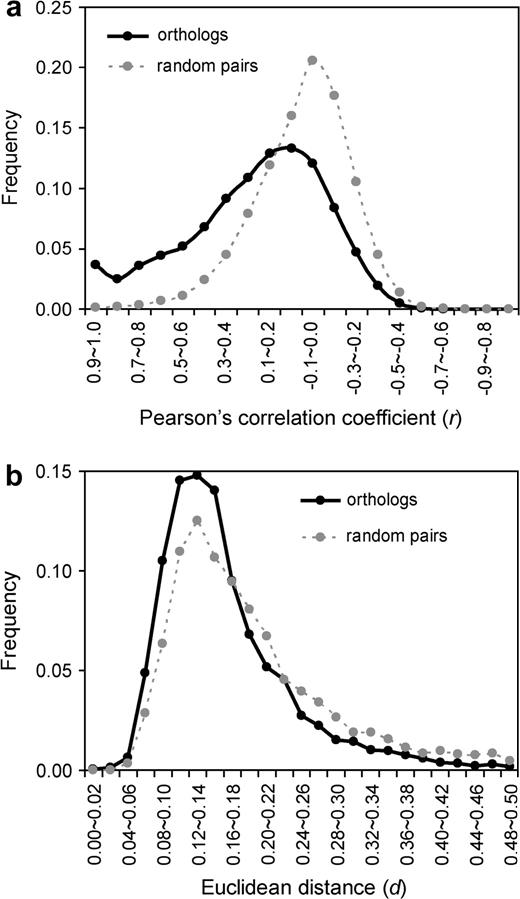
Expression-profile divergences of orthologous genes and randomly paired genes from humans and mice. A total of 10,607 orthologous gene pairs and 10,607 random gene pairs are analyzed. Expression divergence is measured by (a) Pearson's correlation coefficient r and (b) Euclidean distance d. Both measurements show that the expression-profile divergence of human-mouse orthologs is significantly lower than that of random gene pairs (P < 10−280 for r and P < 10−151 for d; Mann-Whitney U test).
Errors in Measuring Gene Expression
Although the overall rate of transcriptome evolution between humans and mice appears lower than the neutral expectation, it is unclear what proportion of genes are under purifying selection in their expression evolution and how strong the selection is. To address this question, it is necessary to evaluate the error in measuring gene expression by microarrays. It is quite common that more than one probe set is used to represent a gene on an oligonucleotide microarray. Theoretically, if the same transcripts are targeted and if there is no cross-hybridization, all probe sets designed for the same gene should provide the same, or at least similar, expression signals. However, this is often not the case. For example, there are two probe sets on the human chip and two on the mouse chip for the gene RUTBC1. The S as well as RA values obtained from the two probe sets on the same chip are quite different even for the same tissues (fig. 2). In this example, the r between the RA values generated from the two mouse probe sets (0.23) is even lower than the average r between the RA values generated from a human probe set and a mouse probe set (0.40). In other words, the apparent low r between species is largely attributable to the estimation error of gene expression within species. For many of the 3,762 genes with multiple probe sets on the human chip, the r values between the expression profiles generated by two randomly picked probe sets of the same gene are much lower than 1 (fig. 3a). In fact, r has a mean of 0.375 and a median of 0.368. There are 1,385 genes with multiple probe sets on the mouse chip. The mean r is 0.277 and the median r is 0.235 between the expression profiles generated by two randomly picked probe sets of the same mouse gene (fig. 3a). These low r values show that the expression level is not precisely measured by the microarrays. Rather, there are large errors associated with the estimates. Similar results were obtained when d was used to measure the difference between expression profiles detected by different probe sets targeting the same gene (fig. 3b).
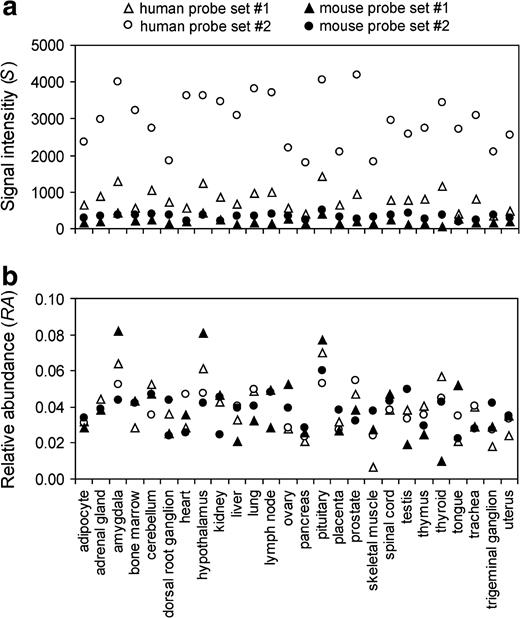
Expression profiles of the RUTBC1 gene in humans and mice measured by the oligonucleotide microarrays. Two probe sets (#1: 212319_at; #2: 36129_at) were used on the human chip and two (#1: gnf1m22384_at; #2: gnf1m28735_at) on the mouse chip. Note that none of them are so-called suboptimal probe sets. (a) Signal intensity values. (b) RA values. The expression-profile similarity measured by r is 0.744 and 0.229, respectively, between the two probe sets for the human gene and between the two probe sets for the mouse gene. When the interspecific divergence is estimated by comparing the expression profile measured by a human probe set and that measured by a mouse probe set, four possible r values can be obtained with equal probability: 0.484, 0.449, 0.495 and 0.164. The mean of the four r values is 0.398.
Expression-profile divergences within and between species. Presented are the results obtained from 3,762 human genes and 1,385 mouse genes for which multiple probe sets per gene are available. Two probe sets for each gene are randomly picked on a microarray to measure the expression-profile divergence within species (i.e., variation due to estimation errors). Two probe sets, one from the human gene and the other from the orthologous mouse gene, are picked to measure the between-species divergence. The experiment is repeated five times. Within-species divergences are denoted in dark gray for humans and black for mice, while the between-species divergences are represented by light gray lines. The expression-profile divergence is measured by (a) Pearson's correlation coefficient r and (b) Euclidean distances d. Both measures show that within-species expression divergences are significantly lower than between-species divergences (when r is used, P < 10−115 for humans and P < 10−5 for mice; when d is used, P < 10−100 for humans and P < 10−35 for mice; Mann-Whitney U test).
It is unclear what factors caused such a great variation between expressional levels detected by different probe sets. Affymetrix probes with name suffixes _x_at and _s_at are thought to be prone to cross-hybridization, compared to other probes, and have been considered suboptimal (Huminiecki and Wolfe 2004; Yang, Su, and Li 2005). Using the human chip, we examined whether the high estimation error is due to the inclusion of suboptimal probe sets. Let A be the group of genes with multiple probe sets and B be the subset of A that contain multiple “optimal” probe sets but no suboptimal probe sets. There are 3,762 genes in group A and 1,097 genes in group B. Assuming that suboptimal probes are randomly distributed among genes, we expect that the mean expression-profile similarity between two probe sets of the same gene is higher for group B genes than for group A genes. However, we observed the opposite pattern (Supplementary Fig. S1, Supplementary Material online), suggesting that the estimation error was not due to the inclusion of suboptimal probe sets. We also compared the average S of all 26 tissues generated by suboptimal probe sets and the corresponding value generated by optimal probe sets for each of the human genes with at least one suboptimal and at least one optimal probe sets. We found that 1,016 genes show higher mean S from suboptimal probe sets than from optimal probe sets and that 1,187 genes exhibit the opposite pattern (P < 0.0003, chi-square test). Thus, although suboptimal probe sets tend to show slightly lower signal intensities than optimal probe sets do, the bias is small. Furthermore, in the presence of cross-hybridization, it is unclear whether our observation means that suboptimal probes are less or more accurate than optimal probes. In sum, we found no definite evidence that suboptimal probe sets performed worse than optimal probe sets. Other possible sources of the estimation error are cross-hybridization with products of multiple genes, hybridization with different transcripts of the same gene, variable hybridization affinities of different probe sets, and stochastic background noise of the microarray. To address estimation errors, a variety of methods have been employed, such as removing suboptimal probe sets (Huminiecki and Wolfe 2004; Yang, Su, and Li 2005), discarding genes with multiple probe sets (Yanai, Graur, and Ophir 2004), and selecting the probe set with the highest expression level for each gene (Jordan et al. 2004; Jordan, Marino-Ramirez, and Koonin 2005). However, none of these strategies remove the estimation error. First, as we have shown, eliminating suboptimal probe sets does not reduce the estimation error. Second, removing genes with multiple probe sets does not reduce the intrinsic imprecision of individual probe sets. Finally, choosing the highest signal may only alleviate the error slightly because it is still unknown whether the quality of the highest signal probe set on the human chip is comparable to that on the mouse chip and whether highest signal means most accurate.
Expression Profiles of 84% of Human-Mouse Orthologs Are Significantly Lower Than Expected Under Neutrality
Despite the high estimation error shown in figure 3, the expression differences between human and mouse orthologs are higher than those detected by different probe sets within species. This indicates that for many genes the expression profile is not completely conserved between the two species. For estimating the proportion of human-mouse orthologs that diverge significantly slower than expected under neutrality, Euclidean distance d is preferred over 1 − r because the correlation coefficient r ignores any linear changes which may exist between expression profiles. We computed the net expression distance D between humans and mice by subtracting the expression distance between probe sets within species from the expression distance between species (see eq. 4 in Materials and Methods). This procedure is analogous to the estimation of the net genetic difference between populations by subtracting the variation within populations (Nei 1987). D can be interpreted as the detectable expression divergence given the estimation error. Randomly paired human-mouse genes should have no expression similarity; thus, the Euclidean distances do not require correction. We found that d has a relatively wide distribution for random gene pairs (fig. 4). Five percent of d is smaller than d5% = 0.0897. If the D value of a human-mouse orthologous gene pair is smaller than d5%, we may claim that the expression divergence of this gene pair has been under selective constraint because the probability that the evolution has been neutral is lower than 5% (fig. 4). Using this criterion, we found that the detectable expression divergence of 83.9% of genes is significantly lower than expected under complete neutrality. A simple interpretation is that the expressions of these genes are under purifying selection. However, our result may also reflect the large estimation error of the current microarray technology and consequently low detectable expression divergence between species. More accurately, our findings suggest that at least for 84% of genes the current data do not provide evidence for neutrality. Note that this estimate was derived from 4,564 orthologous gene pairs in which multiple probe sets are available for at least one species so that the estimation error could be evaluated. Under the assumption that the probe design for a gene is independent of the rate of gene expression evolution, our result is applicable to the entire genome. We also computed the values of dH and dM by averaging the Euclidean distances of all possible combinations of probe sets of the same gene, instead of using two randomly picked probe sets. The results are very similar (Supplementary Fig. S2, Supplementary Material online).
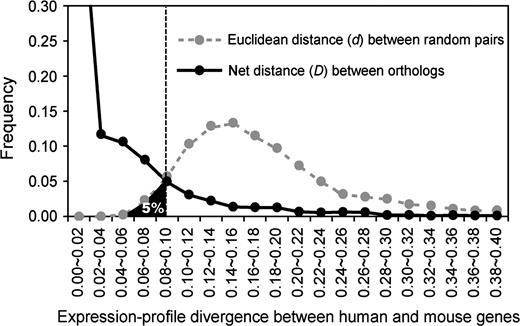
Net distances (D) of expressional profiles between human and mouse orthologs and Euclidean distances (d) of random human-mouse gene pairs. The distribution of the random pairs represents the neutral expectation of expressional divergences. The black area left to the vertical dashed line (d5% = 0.0089) shows the 5% smallest d values. A total of 83.9% of 4,564 human-mouse orthologous genes have D smaller than d5%, suggesting that the detectable expression-profile divergence of 83.9% of genes is lower than the neutral expectation at the 5% significance level.
Orthologous Tissues Between Species Are More Similar Than Nonorthologous Tissues in Terms of Expression Profile
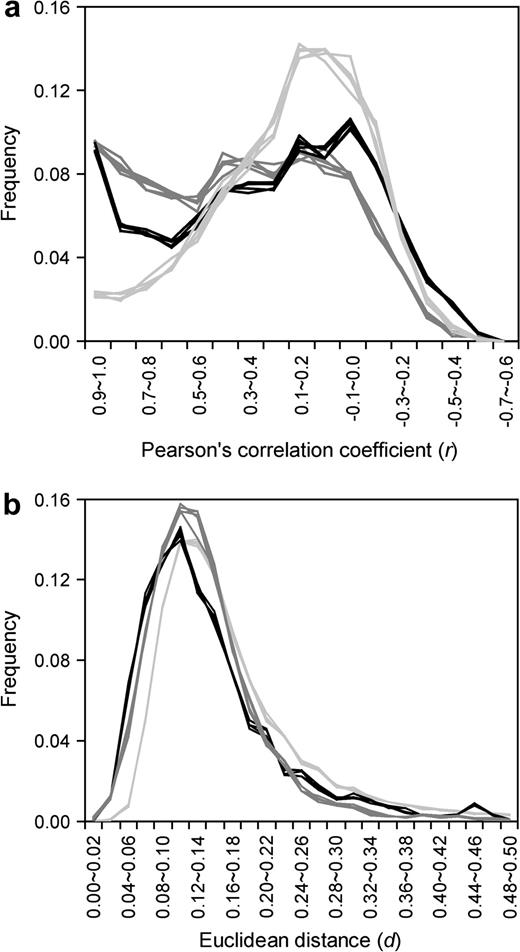
It is expected that orthologous tissues between species (e.g., human liver and mouse liver) should have similar expression profiles because they carry out similar physiological functions. However, Yanai, Graur, and Ophir (2004) showed that 16 pairs of human and mouse tissues were clustered into two species-specific clades. They explained that the dichotomy of human and mouse tissue expression in the dendrogram is due to large numbers of changes in the expression programs and considered this pattern as evidence for the neutral evolution of transcriptional profiles. To understand the exact cause of their findings, we regenerated the tissue expression dendrograms. When we measured the gene expression level by the normalized RMA default output or log2 MAS 5.0 signal intensity as Yanai, Graur, and Ophir (2004) did, we reproduced their dendrogram that showed the separate clustering of human and mouse tissues. However, a complete different dendrogram is produced when RA is used. Now most of the human-mouse orthologous tissues cluster, with bootstrap values higher than 95% (fig. 5). Similar results were obtained when either 1 − r (fig. 5a) or d (fig. 5b) was used to measure the expression distance between tissues (eqs. 5 and 6 in Materials and Methods) or when a smaller microarray data set (Su et al. 2002) was used. Because our results are more consistent with the expectation, we believe that the previous observation by Yanai, Graur, and Ophir (2004) was due to inappropriate data processing. In particular, ignoring the systematic bias caused by the use of two different oligonucleotide arrays and direct comparison of S (or log-transformed S) between species was the major problem (see Materials and Methods). Irrespective of the distance measure used, some nonorthologous species-specific tissue clusters remain in our dendrograms with relatively high bootstrap percentages (fig. 5). For example, amygdala, hypothalamus, and spinal cord of the same species cluster together. Whether this phenomenon is owing to simultaneously rapid evolution of the genes coexpressed in these regions or other reasons requires further investigation.
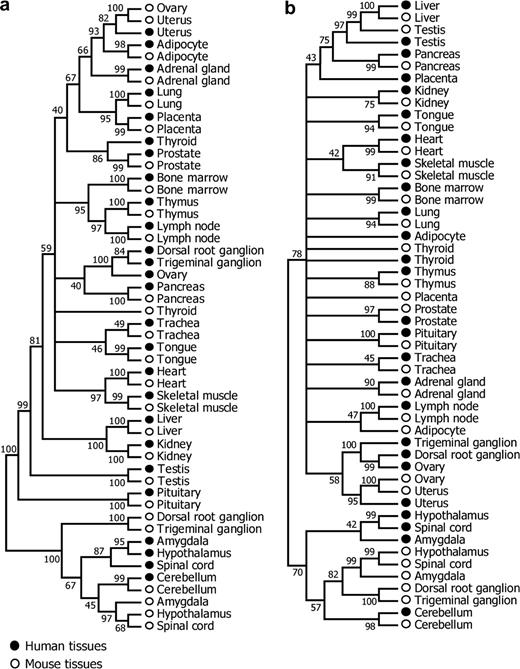
Dendrograms of 26 human and 26 mouse tissues based on (a) 1 − Pearson's correlation coefficient r and (b) Euclidian distance d of tissues. The consensus trees from 10,000 bootstrap trees are presented, with the support values (bootstrap percentages) shown on branches. Interior branches with support values lower than 40 are collapsed.
Correlation Between the Rate of Expression-Profile Divergence and That of Coding Sequence Divergence
It has been controversial as whether there is a positive correlation between the rate of expression evolution and the rate of coding sequence evolution across many genes in a genome. In earlier studies, this question was addressed by comparing duplicate genes within species (Wagner 2000; Gu et al. 2002; Makova and Li 2003). However, such analysis can only test whether the expression divergence and sequence divergence between two homologous genes are correlated but cannot test whether the rates of the two divergences are correlated. The latter question can be answered only when orthologous genes between two species are compared. Recent studies using human-mouse orthologs, however, do not find such a correlation (Jordan et al. 2004; Yanai, Graur, and Ophir 2004; Jordan, Marino-Ramirez, and Koonin 2005). In contrast, we found significantly positive correlations between d and coding sequence divergence in terms of dS (Pearson's correlation coefficient = 0.119, P < 10−32; fig. 6a) or dN (Pearson's correlation coefficient = 0.187, P < 10−80; fig. 6b). Because all the human-mouse orthologous gene pairs have the same divergence time, these results show that the rate of gene expression–profile divergence and the rate of coding sequence divergence at both the synonymous and nonsynonymous sites are positively correlated. In other words, proteins with low rates of sequence evolution also tend to have low rates of expression-profile evolution. We also observed that d and dN/dS are positively correlated (Pearson's correlation coefficient = 0.152, P < 10−52; fig. 6c). In our data set, there is virtually no correlation between dN/dS and dS (Pearson's correlation coefficient = 0.023, P = 0.02), contrary to the observation of a high positive correlation in a recent analysis of 3,561 human-mouse orthologous gene pairs (Wyckoff et al. 2005). Thus, dN/dS is a reliable measure of the strength of purifying selection acting on coding sequences. The correlation between d and dN/dS suggests that the level of purifying selection preventing protein sequence divergence is positively correlated with the level of purifying selection preventing expression-profile divergence. We think that this correlation arises because when a gene is functionally important, both its protein sequence and expression profile tend to be more conserved, compared to the situation when the gene is less important. It should be pointed out that although the correlations we detected are highly significant, the magnitudes of the correlations are low. This is not unexpected as both the rate of sequence evolution and that of expression-profile evolution are determined by multiple factors, and the estimated rate of expression-profile evolution has large errors. A recent study of humans and chimpanzees suggested that the rate of gene sequence evolution and the rate of expression-level evolution may also be positively correlated (Khaitovich et al. 2005).
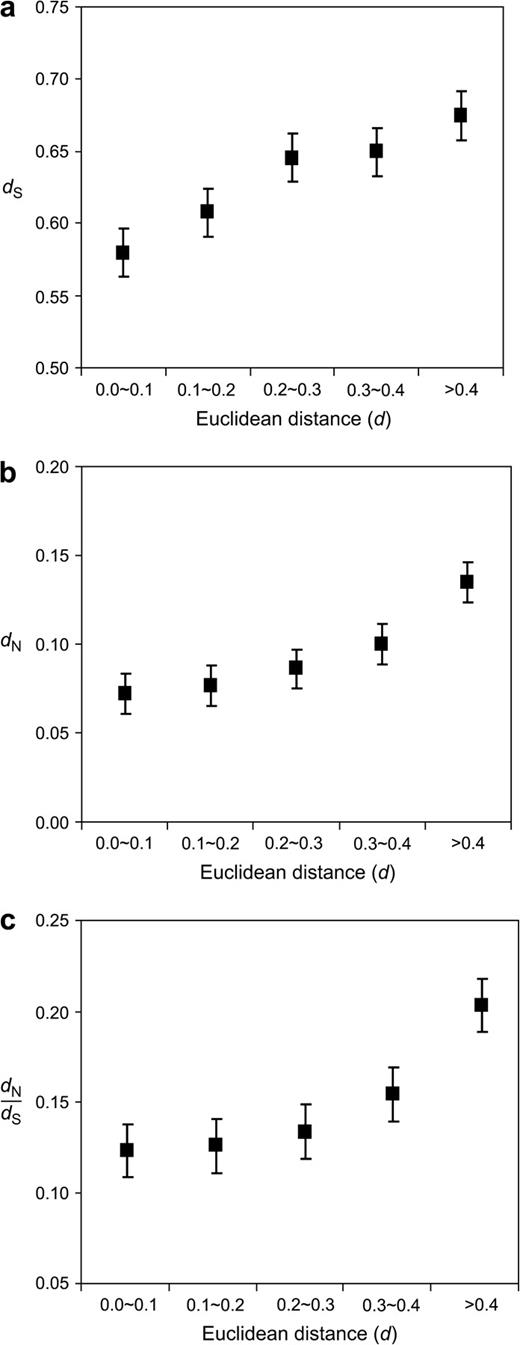
Expression-profile divergence between species, measured by the Euclidean distance d, is positively correlated with the coding sequence divergence measured by (a) synonymous distance dS, (b) nonsynonymous distance dN, and (c) dN/dS. Averaged (±standard error) dS, dN, or dN/dS is shown for each group of orthologs categorized by d. The number of human-mouse orthologous gene pairs per category is 1,689, 5,739, 1,670, 544, and 494, respectively, for the five categories.
We believe that the main reason why the positive correlation between expression-profile divergence and coding sequence divergence was not previously observed in the comparison of human and mouse orthologous genes (Yanai, Graur, and Ophir 2004; Jordan, Marino-Ramirez, and Koonin 2005) is because S (or the log-transformed S) was used, instead of RA, in the estimation of d. However, the observed difference in the absolute level of gene expression between species is not meaningful due to the use of species-specific microarrays. Therefore, inclusion of this difference in computing d substantially increases the noise. Furthermore, highly expressed genes tend to be more conserved at the coding sequence level (Pal, Papp, and Hurst 2001; Rocha and Danchin 2004; Jordan, Marino-Ramirez, and Koonin 2005; Zhang and He 2005). They also tend to have high d when it is computed using S (Jordan, Marino-Ramirez, and Koonin 2005). Together, these factors dramatically reduce the positive correlation between d and coding sequence divergence. This problem is rectified when d is computed by RA.
As mentioned, 1 − r and d are commonly used to measure gene expression divergence. Compared to d, 1 − r is more often adopted by evolutionists, such as in the studies of duplicated genes in yeast (Wagner 2000; Gu et al. 2002), nematode (Castillo-Davis, Hartl, and Achaz 2004; Conant and Wagner 2004), humans (Makova and Li 2003; Huminiecki and Wolfe 2004), mice (Huminiecki and Wolfe 2004), and mustard (Haberer et al. 2004). However, d reportedly performs better (Slonim et al. 2000) and has been used to compare orthologous genes (Yanai, Graur, and Ophir 2004; Jordan, Marino-Ramirez, and Koonin 2005) and to cluster coexpressed genes (Wen et al. 1998; de Bivort, Huang, and Bar-Yam 2004). To our surprise, we did not observe positive correlations between 1 − r and either dN, dS, or dN/dS. But this result is consistent with that of Jordan et al. (2004), although they used Spearman's rank correlation instead of Pearson's correlation (r) to measure the human-mouse expression-profile similarity. One may think that the expression divergences measured by d and 1 − r should be positively correlated. However, the mathematical properties of d and 1 − r are different. For example, any linear transformations of S do not affect r, while they may influence d. In addition, 1 − r is bounded between 0 and 2, whereas d can increase infinitely. In our data, 1 − r and d have a weak, but significant, negative correlation (Supplementary Fig. S3, Supplementary Material online). Although both measures are commonly used, which better describes the expression divergence between orthologous genes remains unanswered. It is possible that the advantages of these two measures vary depending on the conditions used. It is also important to note that neither 1 − r nor d measures the number of genetic changes (i.e., number of nucleotide substitutions) underlying the observed expression-profile divergence. Because the molecular mechanism of gene expression regulation is complex and not well understood, no distance measures currently exist to quantify the genetic changes underlying expression-profile divergence (Leung and Cavalieri 2003).
Final Remarks
There are two ways to compare the transcriptomes of two species using DNA oligonucleotide microarrays. The first approach is to use a single array to detect gene expression in multiple species, while the second approach is to use species-specific arrays. Using a single array is only applicable to closely related species and is subject to biases caused by interspecific sequence differences (Hsieh et al. 2003; Preuss et al. 2004; Gilad et al. 2005). Using multiple species-specific arrays is applicable to any species pairs, but we found that the expression divergence between species is substantially overestimated. This overestimation results from the large variation in sensitivity among different probe sets. Thus, precise measurement of expression divergence between species is still a challenging task. cDNA microarrays have also been used to assess the expression divergence between species (Ranz et al. 2003; Renn, Aubin-Horth, and Hofmann 2004). Our method of analysis (e.g., use of RA instead of S) applies to cDNA array data as well. We think that advances in both microarray technology and statistical methodology are needed to better characterize the evolution of gene expression, which is central to our understanding of the mechanism of biological evolution (Rodriguez-Trelles, Tarrio, and Ayala 2005).
Douglas Crawford, Associate Editor
We thank Itai Yanai for providing details of their published microarray analysis, James McDonald for technical assistance, Steve Qin and Xionglei He for discussion, and Wendy Grus and Soochin Cho for valuable comments on an earlier version of the manuscript. This study was supported by research grants from National Institutes of Health and University of Michigan to J.Z.
References
Affymetrix.
Binder, H., T. Kirsten, I. L. Hofacker, P. F. Stadler, and M. Loeffler.
Binder, H., T. Kirsten, M. Loeffler, and P. F. Stadler.
Bolstad, B. M., R. A. Irizarry, M. Astrand, and T. P. Speed.
Brenner, S., M. Johnson, J. Bridgham et al. (24 co-authors).
Castillo-Davis, C. I., D. L. Hartl, and G. Achaz.
Cavalieri, D., J. P. Townsend, and D. L. Hartl.
Conant, G. C., and A. Wagner.
de Bivort, B., S. Huang, and Y. Bar-Yam.
Denver, D. R., K. Morris, J. T. Streelman, S. K. Kim, M. Lynch, and W. K. Thomas.
Enard, W., P. Khaitovich, J. Klose et al. (13 co-authors).
Gilad, Y., S. A. Rifkin, P. Bertone, M. Gerstein, and K. P. White.
Gu, Z., D. Nicolae, H. H. Lu, and W. H. Li.
Haberer, G., T. Hindemitt, B. C. Meyers, and K. F. Mayer.
Hinds, H. L., C. T. Ashley, J. S. Sutcliffe, D. L. Nelson, S. T. Warren, D. E. Housman, and M. Schalling.
Hsieh, W. P., T. M. Chu, R. D. Wolfinger, and G. Gibson.
Hubbell, E., W. M. Liu, and R. Mei.
Huminiecki, L., and K. H. Wolfe.
Irizarry, R. A., B. Hobbs, F. Collin, Y. D. Beazer-Barclay, K. J. Antonellis, U. Scherf, and T. P. Speed.
Jordan, I. K., L. Marino-Ramirez, and E. V. Koonin.
Jordan, I. K., L. Marino-Ramirez, Y. I. Wolf, and E. V. Koonin.
Kasprzyk, A., D. Keefe, D. Smedley, D. London, W. Spooner, C. Melsopp, M. Hammond, P. Rocca-Serra, T. Cox, and E. Birney.
Khaitovich, P., I. Hellmann, W. Enard, K. Nowick, M. Leinweber, H. Franz, G. Weiss, M. Lachmann, and S. Paabo.
Khaitovich, P., G. Weiss, M. Lachmann, I. Hellmann, W. Enard, B. Muetzel, U. Wirkner, W. Ansorge, and S. Paabo.
Kumar, S., K. Tamura, and M. Nei.
Leung, Y. F., and D. Cavalieri.
Makova, K. D., and W. H. Li.
Murtagh, F. D.
Nei, M., and S. Kumar.
Oleksiak, M. F., G. A. Churchill, and D. L. Crawford.
Pal, C., B. Papp, and L. D. Hurst.
Preuss, T. M., M. Caceres, M. C. Oldham, and D. H. Geschwind.
Ranz, J. M., C. I. Castillo-Davis, C. D. Meiklejohn, and D. L. Hartl.
Renn, S. C., N. Aubin-Horth, and H. A. Hofmann.
Rifkin, S. A., J. Kim, and K. P. White.
Rocha, E. P., and A. Danchin.
Rodriguez-Trelles, F., R. Tarrio, and F. J. Ayala.
Ruan, Y., P. Le Ber, H. H. Ng, and E. T. Liu.
Slonim, D., P. Tamayo, J. P. Mesirov, T. Golub, and E. Lander.
Su, A. I., M. P. Cooke, K. A. Ching et al. (14 co-authors).
Su, A. I., T. Wiltshire, S. Batalov et al. (13 co-authors).
Townsend, J. P., D. Cavalieri, and D. L. Hartl.
Velculescu, V. E., L. Zhang, B. Vogelstein, and K. W. Kinzler.
Wagner, A.
Wen, X., S. Fuhrman, G. S. Michaels, D. B. Carr, S. Smith, J. L. Barker, and R. Somogyi.
Wyckoff, G. J., C. M. Malcom, E. J. Vallender, and B. T. Lahn.
Yanai, I., D. Graur, and R. Ophir.
Yang, J., A. I. Su, and W.-H. Li.
Yang, Z.
