


Abstract
Genome sequencing and transcriptomic profiling are two widely used approaches for the identification of human disease pathways. However, each approach typically provides a limited view of disease pathways: Genome sequencing can identify disease-related mutations but rarely reveals their mode-of-action, while transcriptomic assays do not reveal the series of events that lead to the transcriptomic change. ResponseNet is an integrative network-optimization approach that we developed to fill these gaps by highlighting major signaling and regulatory molecular interaction paths that connect disease-related mutations and genes. The ResponseNet web-server provides a user-friendly interface to ResponseNet. Specifically, users can upload weighted lists of proteins and genes and obtain a sparse, weighted, molecular interaction subnetwork connecting them, that is biased toward regulatory and signaling pathways. ResponseNet2.0 enhances the functionality of the ResponseNet web-server in two important ways. First, it supports analysis of human data by offering a human interactome composed of proteins, genes and micro-RNAs. Second, it offers a new informative view of the output, including a randomization analysis, to help users assess the biological relevance of the output subnetwork. ResponseNet2.0 is available at http://netbio.bgu.ac.il/respnet .
INTRODUCTION
Massive efforts are being invested worldwide in cataloguing the mutations and transcriptomic changes characterizing a large variety of human diseases to identify the cellular pathways involved in each disease (1–4). These wealth of data provide a promising starting point for unraveling disease pathways. However, the functions of many of the identified mutations and the signaling pathways that lead to altered transcriptional regulation often remain elusive.
Molecular interaction networks (interactomes), where nodes represent molecules such as genes and proteins and edges represent their various inter-relationships, offer a powerful framework for enhancing our understanding of protein functions and the cellular processes underlying diseases (5). First, molecular interactions govern biological processes. Being the union of these interactions, an interactome provides a skeleton from which the functions of proteins and the organization of pathways can be inferred (6–9). Second, because edges represent molecular relationships, the road from an interactome-based hypothesis to experimental testing is short (10–14). These observations motivated a wide variety of interactome-based approaches for shedding light on disease genes and pathways (15–19).
ResponseNet is an integrative interactome-based approach that uses known molecular interactions to bridge the gap between condition-specific mutations and transcriptomic changes, revealing a broader view of the underlying cellular processes (12). Specifically, given weighted lists of proteins and genes related to a specific condition, ResponseNet identifies a sparse high-probability molecular interaction subnetwork by which the input proteins may lead to the altered transcription of input target genes. This is achieved by formulating a minimum-cost flow optimization problem that is solved by linear programming. By applying ResponseNet to data of large-scale genetic and transcriptomic screens of a yeast disease model, we successfully mapped recognized disease pathways and exposed previously hidden pathways that we validated experimentally (12).
The ResponseNet web-server that we reported previously enabled users to meaningfully integrate their data and to substantially expand their understanding of the cellular conditions they study (20). Specifically, users could upload weighted lists of proteins and genes and obtain the connecting output subnetwork. Here we present ResponseNet2.0, a new version of the ResponseNet web-server that features enhanced functionality. We first describe the extension of ResponseNet toward the analysis of human pathways, including evaluation of its performance over manually curated human pathways. We then describe new features of ResponseNet2.0 that help users assess the biological relevance of ResponseNet results.
ResponseNet2.0: ANALYSIS OF HUMAN PATHWAYS
ResponseNet was originally developed to analyze data gathered from budding yeast (12). The ResponseNet web-server supported analysis of yeast data by providing a weighted model of the yeast interactome, which consisted of physical and regulatory interactions among yeast proteins and genes. Analysis of data from other organisms was also supported, given that users upload their corresponding interactomes. ResponseNet2.0 extends ResponseNet by offering, in addition, a weighted model of the human interactome. Similarly to the interactome of budding yeast, the human interactome contains physical and regulatory interactions among human proteins and genes. Yet unlike yeast, it also contains interactions involving micro-RNAs (miRs), in accordance with their significant roles in regulating a large variety of cellular processes in health and disease (21).
Construction of a weighted model of the human interactome
We gathered experimentally identified interactions from several databases. Protein–protein interactions (PPIs) were gathered from BioGRID (22), DIP (23), MINT (24) and IntAct (25) using the PSICQUIC interface (26). These interactions were then weighted using a weighting scheme that works in two steps, as previously described (12). First, given a specific subset of biological processes, in this case signaling pathways, the scheme calculates a score for each interaction-detection method, which reflects the ability of the method to identify process-related interactions (see Methods). Second, the scheme assigns a weight for every interaction according to the interaction-detection methods that identified it, using a Bayesian computation. The scheme therefore assigns higher weights to interactions identified by multiple interaction-detection methods with a bias toward certain methods, and is not limited to known pathways. A histogram describing the distribution of PPI weights is provided in Supplementary Figure S1. In addition to PPI, transcription regulation interactions between transcription factors and their target genes were gathered from TRANSFAC (27). Lastly, miR interactions were gathered from TarBase (28), miRecords (29) and TransmiR (30). All regulatory interactions were associated with uniform weights. The resulting weighted human interactome contained 88 016 experimentally identified interactions among 11 347 proteins, 426 miRs and 10 014 target genes.
ResponseNet2.0 evaluation over human cellular pathways
To assess the validity and performance of Response-Net2.0, we applied it to data from manually curated human pathways. To this end, we used the SPIKE database, which contained 24 maps of human cellular pathways (31). The analysis was performed as follows: From each pathway map, we extracted an input source set consisting of upstream pathway proteins and an input target set consisting of downstream pathway genes. We applied ResponseNet2.0 to these inputs and then compared between the output subnetwork predicted by ResponseNet2.0 and the original pathway map. In addition to this ‘full’ map analysis, we repeated the analysis for different path lengths per map. For every length k = 1, … ,12, the input target set was left intact and the input source set consisted of proteins with a shortest distance of k from the target set. The median input and output sizes per analysis are presented in Table 1. Figure 1 shows the performance of ResponseNet2.0 as measured by its sensitivity and precision over nodes and interactions (specificity was always 0.99 owing to the large number of true negatives relative to false positives). In general, ResponseNet's performance was highest for shortest paths and decreased with path length. The sensitivity and precision were much higher for nodes than for interactions, implying that ResponseNet often revealed the relevant proteins but not necessarily their pathway connectivity. Evaluation of ResponseNet analysis per map and upon using different values of gamma and capping are presented in Supplementary Tables S1–S3. Notably, ResponseNet can be applied to source and target sets of various sizes and to networks containing >104 nodes and >105 edges. A typical run of ResponseNet2.0 over source and target sets containing 20 protein and 500 genes took about 3 minutes when executed locally.
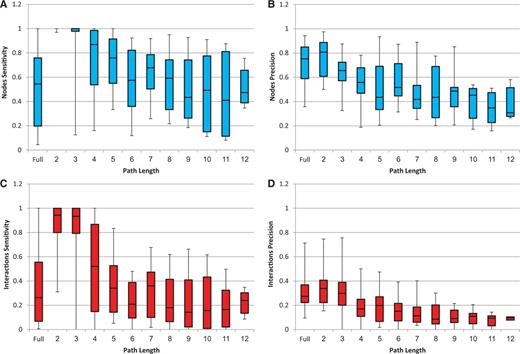
ResponseNet sensitivity and precision upon analysis of known human pathways. Results are shown for full maps (denoted ‘Full’) and for different path lengths (lengths >12 involved <5 maps and were therefore ignored). Each box-plot diagram shows the quartile values (25, 50 and 75%). (A) Nodes sensitivity. (B) Nodes precision. (C) Interactions sensitivity. (D) Interactions precision. Specificity was 99% in every case and is therefore not shown.
The scope of ResponseNet analysis of known human pathways by using SPIKE maps
| Paths length | Number of maps tested | Input sizea (source, target) | Map sizea (nodes, edges) | ResponseNet output sizea (nodes, edges) | Overlap between map and outputa (nodes, edges) |
|---|---|---|---|---|---|
| Full | 24 | 6, 13 | 73.5, 127.5 | 31, 51.5 | 23, 19 |
| 2 | 24 | 9.5, 13 | 27.5, 22 | 31.5, 64.5 | 27.5, 19 |
| 3 | 22 | 9, 17.5 | 27, 33 | 43.5, 98 | 27, 27 |
| 4 | 20 | 12.5, 17.5 | 41, 64 | 54, 134.50 | 31, 19 |
| 5 | 17 | 19, 22 | 62, 97 | 61, 128 | 31, 40 |
| 6 | 14 | 23, 13 | 69, 124 | 47, 104.50 | 40, 15 |
| 7 | 14 | 13, 13 | 64.5, 88.5 | 57.5, 117 | 39.5, 21.5 |
| 8 | 11 | 12, 13 | 70, 99 | 74, 150 | 45, 30 |
| 9 | 11 | 16, 13 | 66, 93 | 68, 169 | 37, 27 |
| 10 | 9 | 10, 22 | 52, 116 | 68, 130 | 35, 20 |
| 11 | 6 | 4, 27.5 | 45.5, 83.5 | 57.5, 127 | 14, 8.5 |
| 12 | 5 | 6, 33 | 38, 70 | 52, 107 | 18, 11 |
| 13 | 4 | 8, 48.5 | 53.5, 108.5 | 46.5, 99 | 13, 4.5 |
| 14 | 3 | 4, 33 | 39, 73 | 14, 18 | 7, 1 |
| 15 | 2 | 3, 17.5 | 33, 52 | 27.5, 44.5 | 7.5, 2.5 |
aMedian values are shown.
ResponseNet was executed with gamma of 2.5 and capping of 0.8. The sensitivity and precision for each type of run are shown in Figure 1.
An example of ResponseNet2.0 output is shown in Figure 2. In this case, we used ResponseNet to identify the regulatory subnetwork connecting the melanoma-related protein ‘BRCA1 associated protein-1’ (BAP1), which when mutated leads to uveal melanoma, to 693 target genes that were found to be down-regulated in melanoma cell lines (32). ResponseNet2.0 correctly predicted the main interactor of BAP1, the HCFC1 protein, and highlighted two connecting transcription factors, GABPA and SP1, the latter previously linked to melanoma (33).
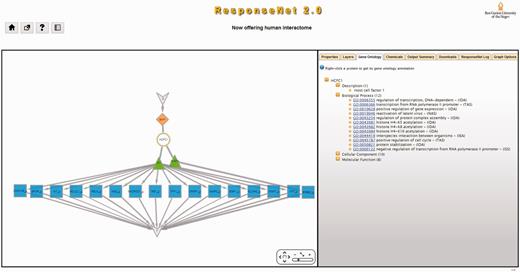
An example of ResponseNet2.0 output. The human protein BAP1 is a deubiquitinating enzyme that acts as a regulator of cell growth by mediating deubiquitination of HCFC1, and is frequently mutated in uveal melanomas. We used ResponseNet2.0 to identify a regulatory subnetwork that connects BAP1 to human genes that were found to be down-regulated in melanoma cell lines. ResponseNet correctly predicted the BAP1-interacting protein HCFC1, and connected HCFC1 to two transcription factors, GABPA and SP1, that regulate the transcription of 16 target genes. Notably, SP1 was previously linked to melanoma (33). S and T are auxiliary nodes that are part of ResponseNet formulation.
ResponseNet 2.0: NEW FEATURES
ResponseNet2.0 contains several features that we added to help users assess the biological relevance of ResponseNet results.
Informative presentation of ResponseNet results
The main output of ResponseNet is a subnetwork that is presented graphically using Cytoscape-web (34). ResponseNet2.0 enhances this output by providing a new tabs menu, where each tab provides additional information regarding the output (Figure 2): The ‘Gene Ontology’ (GO) tab provides the GO annotations and evidence codes of subnetwork proteins and transcripts (35). The ‘Chemicals’ tab provides data of small molecules known to bind subnetwork proteins, which may be used in the design of future experiments (36). The ‘Properties’ tab provides information regarding subnetwork interactions, including the method(s) by which they were detected and the database that reported them. Other tabs enable users to download data, remove subnetwork nodes, change the network layout, and more.
Randomization analysis
This novel feature in ResponseNet2.0 enables users to estimate the probability of observing subnetwork components by chance. Upon executing ResponseNet, users can choose whether to randomize the source set, the target set or both. In each randomization run, an input set of size equal to the original input set is selected randomly from the interactome, and ResponseNet is executed with all other data and parameters as in the original run. The results of the randomized runs are presented as a table in the ‘Properties’ tab. The table lists for each node in the original output the number of times that this node was predicted in the randomized runs. A lower number of appearances thus indicates higher statistical significance. Owing to the computational complexity of ResponseNet, we currently support up to 10 randomized runs per input set.
Session maintenance and subnetwork comparisons
ResponseNet users typically execute ResponseNet analyses anonymously. In ResponseNet2.0, we also provide users with an option to login to ResponseNet, store their sessions and load previous sessions. Notably, users can analyze and compare between their sessions using a layers tabs. A new layer can be created by uploading another network in GraphML format, or by creating a new layer from the existing network. Once a layer was created, the layers tab allows users to unite layers, intersect them to identify common components, or hide common components and show network differences. The layers interface can be used to evaluate runs with different parameters, and to identify common versus unique subnetwork components.
SUMMARY
The post-genomic era is marked by massive mapping of the genome, transcriptome, methylome, microbiome and other ‘omes’ of healthy and sick individuals (19). Owing to initiatives such as The Cancer Genome Atlas and the 1000 Genomes Project, these data are accumulating at a high pace (37). However, the next important step in the analysis, namely deciphering these large-scale data, often becomes the limiting step. This calls for the development of web-servers that offer users meaningful analysis of large-scale data. By taking into account known molecular interactions, tools such as ResponseNet (20) and SteinerNet (38) shed light on the roles of mutations and uncover additional components of the underlying pathways.
ResponseNet2.0 is a new version of the ResponseNet web-server that features richer user interface and offers analysis of human pathways. ResponseNet users can now upload lists of human proteins, genes and miRs, and obtain a high-probability subnetwork of the human interactome that connects them (Figure 2). Our evaluation of ResponseNet using manually curated human pathways revealed that ResponseNet recovered pathway nodes at a median sensitivity, specificity and precision of 54%, 99% and 75%, respectively. Notably, these results are almost as high as ResponseNet performance over yeast pathways (12). As interactions data improve, we anticipate that tools such as ResponseNet will become standard in the analysis of the accumulating state-of-the-art disease data, and provide the much needed views into the currently hidden mechanisms underlying human diseases.
METHODS
PPI weighting scheme
The first step in the scheme is the scoring of interaction-detection methods based on their ability to detect interactions within signaling and response pathways. To this end, we created positive and negative sets of PPIs as follows. The positive set included PPIs among members of a common signaling and regulatory process, where processes were extracted from Gene Ontology (35). The negative set included PPIs between proteins that were not annotated to any of these processes. The score of each interaction-detection method was then computed based on the ratio of positive to negative interactions that the detection method identified. In the second step of the scheme, the weight of each PPI was calculated according to the interaction-detection methods that identified it using a Bayesian computation. More details about the scheme can be found elsewhere (12).
ACKNOWLEDGEMENTS
We thank Ilan Y. Smoly and Martin Ramzi Kahil for help in integrating protein interactions data. We are grateful to all members of the Yeger-Lotem lab for helpful comments on the design of ResponseNet2.0.
FUNDING
European Union Seventh Programme under the FP7-PEOPLE-MCA-IRG Funding scheme [256360 to E.Y.-L.], and the Israel Cancer Institute (to E.Y.-L.). Funding for open access charge: Israel Cancer Institute (to E.Y.-L.).
Conflict of interest statement. None declared.

Comments