


Abstract
Small-angle X-ray and neutron scattering (SAXS and SANS) are fundamental tools used to study the global shapes of proteins, nucleic acids, macromolecular complexes and assemblies in solution. Due to recent advances in instrumentation and computational methods, the quantity of experimental scattering data and subsequent publications is increasing dramatically. The need for a global repository allowing investigators to locate and access experimental scattering data and associated models was recently emphasized by the wwPDB small-angle scattering task force (SAStf). The small-angle scattering biological data bank (SASBDB) www.sasbdb.org has been designed in accordance with the plans of the SAStf as part of a future federated system of databases for biological SAXS and SANS. SASBDB is a comprehensive repository of freely accessible and fully searchable SAS experimental data and models that are deposited together with the relevant experimental conditions, sample details and instrument characteristics. At present the quality of deposited experimental data and the accuracy of models are manually curated, with future plans to integrate automated systems as the database expands.
INTRODUCTION
Small-angle scattering (SAS) is a powerful technique to characterize biological macromolecules in solution. Both small-angle X-ray and neutron scattering (SAXS and SANS) enable the study of three-dimensional macromolecular shapes across a broad size range (from a few kDa to GDa) as well as changes in shape as a consequence of altering environmental conditions. Large complexes, assemblies and flexible proteins, like intrinsically disordered proteins (IDPs), are becoming common targets in structural biology (1–4) and SAS is one of the few techniques that can be quickly and efficiently applied to obtain global structural information from these systems. SAXS experiments are now extremely fast (in the range of micro- to milliseconds) and require small amounts of sample for analysis (5–30 μl) thanks to the advent of high-brilliance third-generation synchrotrons and new automated hardware developments (5). SANS experiments require longer measurement times and larger sample volumes, but are extremely useful to characterize the shapes and dispositions of components within macromolecular complexes. It is possible to generate ab initio models directly against scattering data or to integrate information from atomic-resolution and other techniques to develop more detailed hybrid-models, for example, combining SAS with X-ray crystallography, nuclear magnetic resonance (NMR) or fluorescence resonance energy transfer. As a result of these technical progresses a single SAS experiment can now produce several megabytes of data (6).
A dramatic increase in the number of SAS publications has occurred over the last decade (7), as the discipline moves from a specialization into a general technique for structural biologists. The growing amount of data recorded and published has led to an increased need for a global SAS repository that includes both SAS primary data and models. The recently formed wwPDB (world wide Protein Data Bank) SAS task force (SAStf) (8) has acted specifically to address the development of a biological SAS database for the deposition of data and models that are freely accessible, fully searchable and browsable. At present, there are very few SAS data repositories. The best known is the PDB (9) that currently contains 47 SAS-based models, out of a total of more than 100 000 structures determined by other techniques such as X-ray crystallography, NMR and electron microscopy (EM). However, the PDB is not a SAS database and the SAXS models deposited into it are often those where solution scattering has been employed as complementary to the primary ‘high-resolution’ method, for example, SAXS-NMR co-refinement. These models and those based purely on SAS lack critical information necessary to evaluate data quality, for example, access to the primary scattering data and structural parameters. DARA (10), the first public resource devoted to SAXS, allows one to search for structural neighbors based on the scattering patterns from over 20 000 PDB structures, but does not allow for model or data depositions. The SAXS repository BIOISIS (11) stores both scattering data and the derived models from the data and presently contains 75 structures. However, BIOISIS has some limitations, for example, searches are based only on its own ID and cross references to other biological databases are absent. SAXS models can also be deposited in pE-DB (12), a database of IDP structures. Since disordered proteins cannot be described with a single structure the entries in pE-DB correspond to ensembles of structures characterized using multiple techniques such as NMR, molecular dynamics (MD) and SAXS. Because of the specific type of molecule stored, pE-DB is not aimed at being a comprehensive repository of SAS data.
Consequently, the structural biology community still lacks a curated and comprehensive repository where it is easy to locate published and unpublished SAS data and the derived models. Hence SASBDB (small-angle scattering biological data bank) was established. With SASBDB we offer a repository that can be used as a resource for structural data analysis and comparison as well as a standard for data deposition in keeping with those recommendations outlined by the wwPDB SAStf.
We believe in the importance and long-term commitment of making the raw data underlying scientific publications freely searchable and discoverable to the community (13), while also retaining options for pre-release data exchange between collaborators, article referees and journal editors. As proposed by the wwPDB SAStf, SASBDB shall use standardized data formats and tools for data storage, validation and exchange with other databases built on a federated principle, in a similar fashion to what is done at the wwPDB (composed by RCSB PDB, PDBe, PDBj and BMRB).
MATERIALS AND METHODS
What data are stored in SASBDB
In a typical SAS experiment, a solution of macromolecules (preferably monodisperse and homogeneous) is irradiated with an X-ray or neutron beam. The result is a one-dimensional scattering pattern where the scattering intensity changes as a function of the angle that is related to the shape and size of the macromolecule. The experimental scattering patterns can be stored in a variety of formats. The most wide-spread format is a multi-column text file where the first column is the modulus of the scattering vector s (in inverse nanometres, nm−1 or in inverse angstroms, Å−1) defined as: s = 4πsin (θ)/λ where 2θ is the scattering angle and λ is the X-ray or neutron wavelength, the second column contains the scattered intensities I(s) (either in arbitrary units or inverse centimeters cm−1) and the third column contains the experimental errors of I(s). The scattering data files stored in SASBDB are expected to have at least these three columns.
The indirect inverse Fourier transform of I(s) versus s yields p(r) versus r, the pair distance distribution function of a particle that represents the probable distribution of distances between all pairs of atoms within the volume of particle weighted by their contrasts. There are also several overall geometrical and weight parameters of the particle (radius of gyration, Rg; maximum particle dimension, Dmax; volume, V; molecular weight, MW), which can be calculated from the experimental data and from the p(r) function (see Table 1).
It is possible to reconstruct the low-resolution shapes of macromolecules against the experimental scattering data ab initio. Typically the particle shape is represented by densely packed spheres that are assembled such that their computed scattering fits the experimental data (14). It is also possible to calculate a solution scattering curve from a given set of atomic coordinates. A number of programs can assemble models that fit experimental SAS data using structures (or sub-structures) obtained from X-ray crystallography, NMR or other techniques. At present these ‘pseudo-atomic’ models can be represented as files in a standard PDB-like format (15).
How the data are displayed in SASBDB
Generally, an entry in SASBDB corresponds to an SAXS or SANS experimental data set together with the experimental details, overall parameters, models and fits. Various experimental data sets can be grouped, for example, by their corresponding publication or by other criteria. Details of the data visualization are given below.
Logarithmic plot of the experimental data
Experimental solution scattering data are presented as log10I(s) versus s (Figure 1E) where I(s) is the intensity and s is the modulus of the scattering vector (in nm−1). Due to experimental errors a small number of intensities may be negative, these data points are shown as absolute values in red. To facilitate the comparison of different data plots the following convention is observed: one order of magnitude on the I(s) axis has the same length (in pixels) as one inverse nanometer on the s axis. Plots of experimental data that contain angles higher than 6 nm−1 are displayed with a horizontal scroll bar. This is a convenient way of representing wide-angle X-ray scattering (WAXS) data.
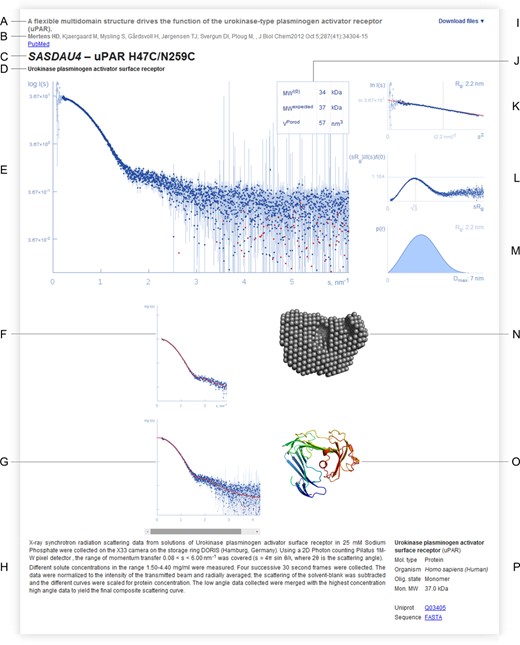
Detailed representation of an SASBDB entry (based on http://www.sasbdb.org/data/SASDAU4/). (A) Title of the publication (or project in case of unpublished data). (B) List of authors, main contributor(s) to the SAS results highlighted in bold; journal reference and a link to PubMed if available. (C) SASBDB ID and the tile of the entry. (D) Name of the macromolecule(s) that were measured. (E) Experimental scattering data (logarithmic plot). (F, G) Fit to the experimental data from the respective model(s) displayed on the right. (H) Experimental details, buffer and a brief description of the data reduction steps. (I) Drop-down list of files available for download, including a zip archive with all files related to the entry. (J) Summary of the overall parameters: MW estimated from the forward scattering, molecular weight expected from the sequence and the oligomeric state, Porod volume. (K) Guinier plot with the linear fit and estimated values of the forward scattering I(0) and the radius of gyration Rg. (L) Dimensionless Kratky plot. (M) Distance distribution function p(r) and the maximum particle dimension Dmax. (N) Ab initio model. (O) Hybrid model. On clicking the models switch to the interactive 3D mode. (P) Biological details of each measured macromolecule, sequence and a link to UniProt if available.
Guinier plot, radius of gyration and molecular weight
According to the Guinier approximation (16), the initial part of a scattering pattern can be described with only two parameters: Rg and intensity at zero angle I(0). This approximation ln I(s) = ln I(0) − (sRg)2/3 is valid in the range sRg < 1.0 ∼ 1.3. The data plotted in this range as ln I(s) versus s2 should follow a linear trend and is commonly known as Guinier plot (Figure 1K). The linearity of the Guinier plot is a sensitive indicator of the quality of the experimental SAS data. Deviations from linearity often point to strong inter-particle interference effects, polydispersity or improper background subtraction.
From the slope of a linear fit of the Guinier plot one can estimate the Rg, while the intercept provides the intensity at zero angle I(0), which relates to the concentration, volume and scattering length density of a particle. If the data are standardized against water (17) or a reference protein with known MW and concentration (18), then I(0) can be used to obtain experimental estimates of the MW of the particle in solution. In addition, the experimental MW can be compared to the expected MW (e.g. calculated from the sequence) in order to get an idea of the oligomeric state of the sample (Figure 1J).
Dimensionless Kratky plot and Porod volume
The degree of compactness of a protein can be conveniently represented as s2I(s) versus s, or Kratky plot (Figure 1L). A bell-shaped peak indicates that the particle under investigation is likely globular or compact, while a plateau or linear trend is typical for unfolded/extended proteins.
If the intensities are divided by I(0) and s is multiplied by Rg then the plot is called normalized (or dimensionless) Kratky plot (sRg)2I(s)/I(0) versus sRg. In case of globular particles the position of the bell-shaped peak should approximately occur at |$\sqrt{3}$| with a maximum height of 1.104 (marked with gray lines see Figure 1L), while the height of the plateau for an unfolded protein approaches a value of 2. Highly extended rods display a nearly linear relationship in the plot, with no observable plateau.
For globular particles of uniform density the excluded volume of the hydrated particle is inversely related to the area below the Kratky plot (19). For globular proteins the hydrated volume in nm3 should be about 1.6–1.8 times the molecular weight in kDa (20).
Pair distance distribution function
The pair distance distribution function is displayed as a plot p(r) versus r (Figure 1M). The point where p(r) decays to zero, Dmax, represents the maximum intra-particle distance and therefore the maximum particle dimension. The values of Rg and I(0) can be estimated from integrating the p(r) function.
Ab initio models
There are three general types of Ab initio models (i) two phase dummy atom model, (ii) multiphase dummy atom model and (iii) dummy residue model. Two-phase dummy atom models consist of a large number of densely packed spheres, for example, generated by the programs DAMMIN (21) or DAMMIF (14). The radius of the spheres is typically between 0.2 and 0.4 nm. Their number and size can vary between different models. For simplicity, only the phase representing the macromolecule is displayed in the database (the solvent phase is not shown).
Multiphase dummy atom modeling can be used to reconstruct complexes consisting of components with different scattering length densities based on simultaneous fitting of multiple scattering patterns. For these models, the beads representing two or more phases corresponding to different moieties of a complex (e.g. protein and nucleic acid) are displayed with different colors (21), (22). As with two-phase modeling, the solvent phase is not displayed.
Protein shapes can be reconstructed using the program GASBOR (23) as assemblies of dummy residues. These models consist of spheres with a radius of 0.19 nm, which is about the average size of an amino acid residue. The distances between the residues correspond to the ones typically found in proteins. The number of dummy residues equals the number of amino acid residues in the protein.
Ab initio models are displayed to the users of the database as 2D images, which can be switched to an interactive 3D view (Figure 1N). The size of the respective spheres comprising the ab initio models is automatically displayed in their correct size. Associated fits to the experimental data are provided by the depositor (Figure 1F).
Hybrid models
High-resolution models derived from crystallography, NMR, EM, homology modeling or MD simulations can be compared directly to SAS data. Furthermore, rigid-body models can be generated that fit scattering data that incorporate high-resolution sub-structures and components where the spatial positions are optimized via minimizing differences between the computed model scattering and the experimental data.
Those contributors depositing model into the database have to provide a fit to the experimental data (Figure 1G), which demonstrates how well the calculated solution scattering from the given model fits the experimental SAS data. Hybrid models are displayed as colorful ribbon 2D images, which can be switched to interactive 3D view (Figure 1O). SAS data from systems consisting of an equilibrium of oligomeric states can be fitted using a weighted mixture of multiple models. In this instance the single fit reported in the database will correspond to multiple models (e.g. different oligomers). In all modeling approaches additional information, for example, a symmetry group, can be reported.
Structural parameters stored in SASBDB.
| Parameter | Based on | Abbreviation | Units |
|---|---|---|---|
| Radius of gyration | Guinier approximation | |$R_{g}^{Guinier}$| | nm |
| Forward scattering | Guinier approximation | I(0)Guinier | A.U.a |
| Radius of gyration | p(r) function | |$R_{g}^{p(r)}$| | nm |
| Forward scattering | p(r) function | I(0)p(r) | A.U.a |
| Maximum intra-particle distance | p(r) function | Dmax | nm |
| Molecular weight | Guinier approximation | MWI(0) | kDa |
| Excluded volume | Porod invariant | VPorod | nm3 |
| Molecular weight | Sequence | MWexpected | kDa |
aA.U. = Arbitrary unit. Data in absolute scale (cm−1) can also be stored.
| Parameter | Based on | Abbreviation | Units |
|---|---|---|---|
| Radius of gyration | Guinier approximation | |$R_{g}^{Guinier}$| | nm |
| Forward scattering | Guinier approximation | I(0)Guinier | A.U.a |
| Radius of gyration | p(r) function | |$R_{g}^{p(r)}$| | nm |
| Forward scattering | p(r) function | I(0)p(r) | A.U.a |
| Maximum intra-particle distance | p(r) function | Dmax | nm |
| Molecular weight | Guinier approximation | MWI(0) | kDa |
| Excluded volume | Porod invariant | VPorod | nm3 |
| Molecular weight | Sequence | MWexpected | kDa |
aA.U. = Arbitrary unit. Data in absolute scale (cm−1) can also be stored.
Data validation and quality control
The validation of the content in SASBDB is currently done manually by SAS experts who perform a number of quality checks following the guidelines of a number of publications (8,24–25). The control criteria include:
Agreements between structural parameters, for example, Rg computed from the Guinier fit and from the p(r) function.
The quality estimate of Rg calculated using AUTORG (26).
The quality of the p(r) calculation using GNOM (27).
Discrepancies between calculated and experimental MWs.
The overall quality, for example, signal-to-noise ratio of the experimental data .
The correspondence between the goodness-of-fit of deposited models and the experimental scattering data.
These statistics generated using multiple ab initio and rigid body reconstructions and assessment of the variability of the model (using the tools DAMAVER and DAMCLUST (28)) need to be be provided by the depositor. The quality is evaluated after deposition and the entries are made publicly available to the community after approval.
Database structure
SASBDB has been designed as a relational MySQL-based database. Each entry in SASBDB is identified by a unique code in the format SASXXXN, where X is an alphanumeric character and N is a digit. Each entry corresponds to a scattering curve; multiple entries can be grouped in a project. In case of published data a project is defined as a publication (Figure 2).
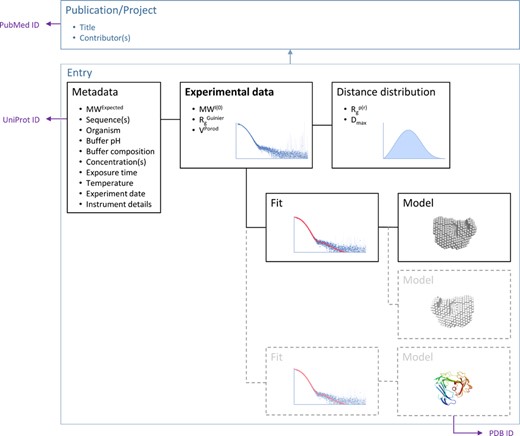
Each SASBDB entry is organized around an experimental SAS data set that is linked to the metadata related to the experiment that includes the experimental conditions, derived structural parameters, real-space distance distribution, models and fits. Multiple entries can be grouped according to a publication or, in case of unpublished data, project. Links to external data banks such as PubMed, UniProt and PDB for the entry are provided.
Each scattering curve is connected to two sets of metadata: the first set includes experimental conditions, publication or project details, sample and instrument characteristics; the second set consists of one or multiple models with their respective fits to the data. Multiple models can be related to a single fitting. In order to allow the description of complexes and mixtures we define the sample as a combination of one buffer with one or multiple macromolecules, where each macromolecule is a component of the complex or mixture.
Implementation
All the routines in SASBDB are implemented in python 2.7 (http://www.python.org). The user web interface was developed in the Django 1.6 (https://djangoproject.com) framework and displays plots and model images are automatically generated using gnuplot (http://gnuplot.info) and PyMOL (The PyMOL Molecular Graphics System, Version 1.7.0.1 Schrödinger, LLC), respectively. JSmol is used to visualize the model structures interactively (http://wiki.jmol.org/index.php/JSmol#JSmol). We preferred JSmol to the more widely used Jmol (http://www.jmol.org) because, being a JavaScript applet, it does not require any Java authorization.
The search is implemented using the Django extension Haystack 2.0 (http://haystacksearch.org/) and Elasticsearch 0.90.2 (http://www.elasticsearch.org/) as the search backend engine. The metadata from UniProt (29) and PubMed (http://www.ncbi.nlm.nih.gov/pubmed) are automatically retrieved using a the WSDbfetch API from PDBe (30) for the first and a BioPython (31) tool for the second source.
RESULTS
Availability and searching
SASBDB is publicly accessible via the http://www.sasbdb.org user interface that does not require registration to search, browse or download data. Registration via email address and a password is required to deposit data. Those users with an ATSAS account (20) can use their existing online credentials (the ATSAS-online community counts already more than 6000 SAS users) to login and deposit data. After registering the depositor has access to an online submission form to be filled in with the required fields. From the form it is possible to select whether the data are made immediately available for to the community (public) or as an on-hold entry for confidential sharing with collaborators, paper referees or journal editors.
The search criteria used in SASBDB are flexible and allow entries to be located using the unique SASBDB entry code as well as macromolecule name, publication, authors, projects, sample environments, instrument and corresponding UniProt, PubMed and PDB identifiers. Two alternative search interfaces are implemented: standard search and advanced search. The standard search is provided by default on each page, where single search terms can be used, while a dedicated advanced search is available through the http://www.sasbsb.org/search/advanced where it is possible to select one or more fields to restrict the search. The advanced search option is likely to become more relevant as the database becomes populated with SAS projects investigating the same macromolecule, but are sourced from various authors or instruments.
The web interface
Home page
The SASBDB home page provides an overview of the entire database that includes the number of entries and the numerical breakdown of the database contents that are displayed as pie charts. These charts link to collated archives of source organism, macromolecule type, model type and dissemination record (i.e. published and publicly available unpublished records). Among the unpublished data there is a list of 16 entries representing a set of well-characterized commercially available proteins that have been measured at small and wide angle (SAXS and WAXS) after further purification steps to ensure monodispersity and increase the sample quality. These entries act as a set of protein standards for the database. By clicking on any of the home page pie-chart sub-sections it is possible to browse the database according to the selected criteria. Also displayed on the home page are search and advanced search options as well as a few selected recent depositions. The website also comes with three different help pages that guide a first-time visitors throughout the web interface, present the overall database description and explain some of the fundamental principles of SAS as a technique
Browse page
The browse page lists all entries sorted by deposition date (more recent first) and it comprises browsing units (Figure 3). Each unit shows the scattering profile and one of the derived models. If a model has not been deposited along with the data, the space otherwise occupied by the model displays an automatically calculated dimensionless Kratky plot. This plot has been chosen because it may not be possible to obtain a single representative model for display purposes, for example, from disordered or flexible systems, or a project aim might not encompass the generation of 3D-models. Therefore, the Kratky plot substitution acts as a visual tool for users to qualitatively assess globularity, extensibility, flexibility or disorder of a macromolecule even if a model has not been provided. Information about sample, buffer, experiment and any associated publication is also presented in the browsing unit together with three structural parameters: Rg, Dmax and VPorod which give a general estimation of the particle size and shape. Clicking on the unique SASBDB identifier, the displayed SAS dataset or model/Kratky plot directs the user to the associated entry.
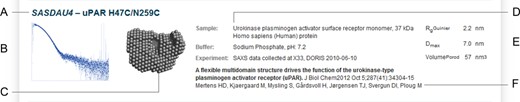
Brief representation of a SASBDB entry (browsing unit). (A) SASBDB ID and the title of the entry. (B) Experimental scattering data (logarithmic plot thumbnail). (C) One of the models. (D) Name of the macromolecule(s) that were measured, expected molecular weight organism, polymer type. Buffer details. Experiment type, instrument and data collection date. (E) Structural parameters: radius of gyration, maximum particle dimension, Porod volume. (F) Title of the publication (or project in case of unpublished data), journal reference, authors.
Detail entry page
The individual entry detail page conveys information about an SAS experiment in terms of publication, data, structural parameters, models, model-fits to the data, sample and sample environment conditions and instrument characteristics (see Figure 1). From the detail page it is possible to download a set of files related to the entry: the scattering data curve in the multi-column text format, the p(r) distribution function in GNOM format, models (in PDB-like format) and related fits to the experimental data. The whole set of files is also available as a compressed archive named after the entry ID (see Figure 1I). The detail page comes with additional features. By clicking on the publication title (Figure 1A), the contributor name (Figure 1B) or the macromolecule name (Figure 1C), one is redirected to the list of entries related to the selected item, for example, all the entries submitted by that contributor. In addition, on the bottom of the page (Figure 1H) instrumental and experimental details are written automatically in a ‘method-like’ section of a scientific publication based on information provided by the user on deposition.
DISCUSSION
SASBDB is a comprehensive publicly accessible repository of SAS data and models that, as of August 2014, contains 99 entries and 156 models, which makes it the largest repository of SAS data currently available. SASBDB offers a number of important features not readily available elsewhere:
It is entirely browsable according to different criteria such as macromolecule or dissemination type.
The search is highly flexible and it can be based on many different fields such as macromolecule name, buffer composition, instrument details, journal where the article was published and so on.
The embedded Javascript displays the 3D models in an interactive way without opening extra web pages.
It stores a set of highly purified well-characterized protein SAXS and WAXS data sets that can be used for benchmarking purposes.
The plots are designed to be highly informative and convenient for any type of data including WAXS.
It contains cross links to other biologically relevant databases (PubMed, UniProt and PDBe).
The data in SASBDB are sourced from both published and unpublished experiments, and in both cases the database offers a comprehensive suite of original data, models, structural parameters that are made publicly available. In modern research it is crucially important to improve the reproducibility of the experiments and this objective can only be achieved by supporting transparency and accessibility of the data. This philosophy was one of the main reasons to establish SASBDB. Indeed the web interface of the database has been designed to be user friendly and clear in order to comply with the necessities of different type of users, from novices to experts, journal referees and editors. Importantly, the submitted data can undergo evaluation so the quality of the data and the models used to interpret the data can be assessed during the peer review process.
The PDB SAS task force has stated that two key issues need to be addressed: uniformity of data formats and quality assessment for data and models. We are addressing these issues in the ongoing developments at SASBDB. The universal format suggested for data deposition is sasCIF (32), which is an ASCII format for meta parameters and experimental one-dimensional data. Similar to mmCIF that is currently employed by the PDB (33), sasCIF is an extension of the general CIF (crystallographic information framework). We are presently implementing the conversion tools of different file formats to sasCIF as provided by (32) for SASBDB such that the repository will accept and export the sasCIF data. In the future all the information stored in SASBDB will be accessible in the standard sasCIF format in order to facilitate exchange between repositories.
Currently in SASBDB the quality assessment of the submitted data is done manually. Given the expected growth of the data bank, automated data and model validation methods are required and a number of methods to achieve this goal is currently under development. An automated pipeline to compute the structural parameters from the submitted curves to be compared with the parameters submitted by users is being implemented based on the ATSAS tools (6). Quantitative scores will be introduced to assess the similarity between automatically calculated and submitted parameters and to evaluate the quality of ab initio and rigid body models. The recently developed methods to evaluate the useful range of the experimental data based on the Shannon sampling (Konarev and Svergun, submitted) and to statistically assess the quality of the fit to the experimental data in the absence of the experimental errors (Franke, Jeffries and Svergun, submitted) will be integrated as validation tools for SASBDB.
The necessity for a SAS database has become increasingly pressing due to the renaissance of SAXS/SANS in structural biology prompted by the new developments in software and instrumentation. SASBDB has been established to comply with the need to make those data publicly available, fully browsable and searchable, in accordance with the requirements of the wwPDB SAS task force. The data bank is designed to be scalable and using standard format for data exchange, to serve in a projected federated system of databases for SAS experiments. It is anticipated that SASBDB will contribute to increasing the fidelity of the biological SAS data and their interpretation for the rapidly growing community of structural biologists utilizing solution scattering in their research.
We gratefully acknowledge fruitful discussions with Maxim Petoukhov and Alejandro Panjkovich.
FUNDING
European Commission Seventh Framework Programme (FP7) projects BioStruct-X [283570]; IDPbyNMR [264257]; Bundesministerium für Bildung und Forschung (BMBF) project BIOSCAT [05K12YE1]. Funding for open access charge: EMBL resources.
Conflict of interest statement. None declared.

Comments