


Abstract
We explore the possibility of re-engineering mitochondrial genes and expressing them from the nucleus as an approach to rescue defects arising from mitochondrial DNA mutations. We have used a patient cybrid cell line with a single point mutation in the overlap region of the ATP8 and ATP6 genes of the human mitochondrial genome. These cells are null for the ATP8 protein, have significantly lowered ATP6 protein levels and no Complex V function. Nuclear expression of only the ATP8 gene with the ATP5G1 mitochondrial targeting sequence appended restored viability on Krebs cycle substrates and ATP synthesis capabilities but, failed to restore ATP hydrolysis and was insensitive to various inhibitors of oxidative phosphorylation. Co-expressing both ATP8 and ATP6 genes under similar conditions resulted in stable protein expression leading to successful integration into Complex V of the oxidative phosphorylation machinery. Tests for ATP hydrolysis / synthesis, oxygen consumption, glycolytic metabolism and viability all indicate a significant functional rescue of the mutant phenotype (including re-assembly of Complex V) following stable co-expression of ATP8 and ATP6. Thus, we report the stable allotopic expression, import and function of two mitochondria encoded genes, ATP8 and ATP6, resulting in simultaneous rescue of the loss of both mitochondrial proteins.
INTRODUCTION
Mitochondria carry out oxidative phosphorylation principally by using pyruvate, fatty acids and amino acids to generate adenosine triphosphate (ATP). In animals, mitochondria are the only cellular organelles that possess their own DNA, mitochondrial DNA (mtDNA), which in humans contains 37 genes including genes encoding mitochondrial tRNAs, mitochondrial rRNAs and 13 oxidative phosphorylation (OxPhos) complex proteins. The rest of the mitochondrial proteins and RNAs are encoded by nuclear DNA and these proteins must be imported into the mitochondria after cytoplasmic translation.
Both pediatric and adult-onset diseases have been identified that are caused by point mutations or partial deletions in mtDNA. Approximately 7.5 out of every 100 000 people are estimated to suffer from a diagnosed mtDNA disease (1–3), while 1 in 200 people are estimated to be born with a deleterious mtDNA mutation (4), suggesting that mitochondrial disease might be underdiagnosed. Although defects in the oxidative phosphorylation system can cause disease in essentially every organ system in the body, most symptoms occur predominantly in nervous, cardiovascular and skeletal muscle tissues [reviewed in (5)]. Leber's hereditary optic neuropathy (LHON) (6,7), Leigh syndrome (8), mitochondrial encephalopathy (8), chronic progressive external ophthalmoplegia (9) and Kearns–Sayre syndrome (9) are examples of neurological and muscular diseases associated with mtDNA mutations. Other mtDNA diseases include non-hypoxic lactic acidosis and Pearson marrow-pancreas syndrome (10).
Mitochondrial diseases tend to be fairly complex, with patients often presenting with multiple symptoms, and/or suffering from symptoms that differ between patients with the same mtDNA mutation (11). Traditional approaches include palliative treatments such as surgery or drugs, but are of limited use for mitochondrial diseases (5) because they fail to address the underlying defect in the mtDNA. In some cases, specific disease symptoms may be ameliorated by surgery, such as cochlear implants for some sensorineural hearing loss patients, cataract surgery for ocular manifestations of mitochondrial disease, or heart transplants for selected mitochondrial cardiomyopathy patients. Other symptoms are sometimes alleviated with pharmacologic therapies that partially address metabolic defects downstream of the mutations, such as by scavenging reactive oxygen species or reducing excessive lactate accumulation (12,13).
Gene therapy may have the potential to treat mitochondrial disease, but many challenges exist. Direct transfection of replacement genes into mitochondria is extremely challenging. As an alternative, allotopic expression (the translocation of genes from their normal location in the mitochondria to the nucleus, followed by expression in the cytoplasm and re-insertion into the correct location in the mitochondria) was proposed as a potential method of gene therapy for congenital mutations over 25 years ago (14). This technique introduces additional challenges as, in addition to transfection into the cell, the allotopically expressed gene product must also translocate to the mitochondria and integrate into the appropriate protein complex. Nature already uses such targeting methods with the vast majority of proteins that comprise the mitochondrial proteome that are encoded by the nuclear genome.
In the time since allotopic expression of mitochondrially-encoded proteins was first proposed, several groups have attempted the method with mixed results. ATP6 protein was shown to integrate into Complex V (CV) and partially rescue growth of ATP6 mutant cells (15). ATP6 expression was also able to partially rescue mutant CHO cells (16) while exogenous ND4 expression has been claimed to rescue rodent models of LHON (17–19). Mutant MT-ND1 cells (OST-93ND1 cells) were complemented by allotopic expression of ND1 with dramatic changes in the bioenergetics state and tumorgenic potential of the mutant cells (20). These cells are not perfectly homoplasmic (reported to carry a 93% mutation load) though the authors showed that this mutation load was sufficient to induce a null phenotype for the ND1 protein (21). Since then another group has generated a ND1 null cell line homoplasmic with respect to both the gene and protein (22,23). On the other hand, allotopically expressed ND6 protein localized to the mitochondria but failed to import properly or complement the loss of ND6 function. The authors showed that the ND6 protein localized to the outer mitochondrial membrane rather than the inner mitochondrial membrane (the site of OxPhos) (24). Allotopically expressed CYB was found to be similarly difficult to import into the mitochondria (25).
In order to unequivocally demonstrate functional import of a codon-corrected mtDNA gene, we sought to work in a system that was completely null for a mitochondrially encoded protein. We chose a transmitochondrial cybrid cell line which was derived from a patient whose mtDNA contained a non-sense mutation in ATP8. We have further characterized the cells and found them to contain reduced levels of ATP6 protein. Here, we demonstrate stable protein expression and mitochondrial import of codon-corrected ATP6 and ATP8 in the mutant cells and characterize the impact that these engineered genes have on several measures of Complex V function, oxidative phosphorylation and cell viability.
MATERIALS AND METHODS
Establishing homoplasmic m.8529G→A cell lines
A transmitochondrial cybrid cell line harboring the mitochondrial DNA mutation (m.8529G→A, henceforth referred to as A8/6mut) was kindly provided by the Rodenburg lab (Radboud University Medical Center, The Netherlands). The cells were treated with 50 ng/ml ethidium bromide (EtBr) for 4 weeks followed by recovery in EtBr free medium for 2 weeks. Twenty six single cell colonies were picked and analyzed for mutation load through ARMS qPCR (26). Briefly, total cellular DNA (genomic + mitochondrial) from clones (1 × 10⁵ cells/clone) was prepared using the DNeasy Blood and Tissue kit from Qiagen (Hilden, Germany). The samples were not treated with RNase. DNA derived from 143B osteosarcoma cells (WT) and the parental A8/6mut were used as controls. Quantitave PCR (qPCR) was performed in a total volume of 20 μl in Power SYBR green master mix using 100 ng DNA (measured using a NANODROP 2000 spectrophotometer, Thermo Scientific, Wilmington, DE, USA) as template for each reaction in triplicate and repeated once using the primer sets WT Fwd 1 and Mutant Fwd 1 (Supplementary Table S3) and this reverse primer: 5′gtactgatcattctatttcc3′ (0.2 μM each). The extracted DNA was stored at −20°C for regular use. The resulting product was 104 bp in length amplifying mtDNA at m.8503 through m.8606. Primers were synthesized by Integrated DNA Technologies (Coralville, IA, USA) without any modifications and purified with standard desalting. Forty cycles of PCR reaction (Step 1, initial denaturation: 95°C for 10 min; Step 2, denaturation, annealing and extension: 40 × 95°C for 15 s followed by 60°C for 1 min) was performed on an Applied Biosystems StepOne Plus Real Time PCR system (Thermo Scientific, Wilmington, DE, USA) in 96 well plates with optical adhesive covers (Applied Biosystems: Cat # 4346906 and 4360954, respectively). Cycle threshold (CT) values were obtained using the StepOne Software v2.3 and results expressed as ΔCT (CT Avg(mutant primers) – CT Avg(WT primers). A no template control set was added to each reaction set to rule out non-specific priming and CT values were between 36 and undetectable in every case.
In order to confirm that homoplasmy was preserved throughout the time line of experiments, we tested the mutation load in the cybrid cell lines at various time points by ARMS qPCR. WT 143b, A8/6mut parental, A8/6mut + A8F, A8/6mut + A8F + A6F and A8/6mut + A6F stable cell lines were grown in DMEM-complete medium with either glucose (25 mM) or galactose (25 mM) as the carbon source. On days 0, 15 and 28 (Glucose) mitochondrial fractions were enriched using the Pierce Mitochondria Isolation Kit for Cultured Cells (Thermo Fisher Scientific, Waltham, MA, USA). For wild-type (WT), A8/6mut + A8F and A8/6mut + A8F + A6F cell lines selecting under galactose medium, mitochondrial fractions were enriched on day 11. Fewer than 1% of A8/6mut parental and A8/6mut + A6F stable cell lines remained at this point and were not collected. Subsequently, mitochondrial DNA was extracted using the DNeasy Genomic DNA Isolation Kit (Qiagen, Hilden, Germany). A total of 12.5 ng of such purified DNA was used as template per reaction point (20 μl) in qPCR reactions. The difference in CT values (ΔCT avg(mutant-WT)) was evaluated at different time points. Results are expressed as the mean of two biological replicates performed in triplicate. The primers used to distinguish WT and mutant sequences have been described earlier. The mitochondrial gene MT-CYB was used as the reference gene (forward primer: 5′CTAACCCCCTAATAAAATTAATTAA3′ and reverse primer: 5′GTCTGGTGAGTAGTGCATGG3′).
Sequence was further confirmed through primer extension sequencing. Mitochondria were isolated from WT and A8/6mut cells using the Pierce Mitochondria Isolation Kit for Cultured Cells (Thermo Fisher Scientific, Waltham, MA, USA) and mtDNA purified as above. Using the mitochondrial DNA as the template, regions flanking the ATP8 and ATP6 genes were amplified and sequenced using primers 5′gctaacttagcattaaccttttaag 3′ (fwd) and 5′agcccatgacccctaacagg 3′(rev) (Sequetech, Mountain View, CA, USA).
Creation of DNA constructs
The ATP8 sequence was taken from mitomap.org, converted into the standard code, and synthesized with some changes to the sequence for codon optimization (Genscript, Piscataway, NJ, USA). ATP6 codon-corrected sequence was cloned from a plasmid kindly provided by Dr Marisol Corral–Debrinski (INSERM, Paris, France). The ATP8 and ATP6 sequences were inserted between the MluI and XhoI sites of the pCMV6 vector. The mitochondrial targeting sequence (MTS) of COX10 (MAASPHTLSSRLLTGCVGGSVWYLERRT) or ATP5G1 (G1) (MQTAGALFISPALIRCCTRGLIRPVSASFLNS PVNSSKQPSYSNFPLQVARREFQTSVVSRDIDTA) or ATP5G2 (G2) (MPELILYVAITLSVAERLVGPG HACAEPSFRSSRCSAPLCLLCSGSSSPATAPHPLKM FACSKFVSTPSLVKSTSQLLSRPLSAVVLKRPEILT DESLSSLAVSCPLTSLVSSRSFQTSAISRDIDTA) was appended onto the 5′ end (between sites AsiSI and MluI) of the genes. Subcloning integrated a Myc and FLAG or V5 epitope immediately downstream of the codon-corrected genes.
Expression of ATP8 and ATP6 in cultured cells
WT or A8/6mut cell lines were transfected with plasmids pCMV6-G1-ATP8-Myc-FLAG (G418), pCMV6-G1-ATP6-Myc-FLAG (puromycin) or pCMV6-G2-ATP8-V5 (puromycin) individually or in tandem using XfectTM (Clonetech Laboratories, Inc. Mountain View, CA, USA). Stable cell lines were generated by selecting against drug selection markers G418 and/or puromycin. Mammalian cells were regularly maintained in Dulbecco's modified Eagle's medium (DMEM) medium supplemented with 10% (v/v) fetal bovine serum (FBS), 1 mM L-glutamine, 1 mM Na-pyruvate, 50 μg/ml uridine and 1x antimycotic-antibiotic (DMEM-complete). Growth on galactose was tested by supplementing glucose free DMEM medium with 10% (v/v) FBS, 1 mM L-glutamine, 1 mM Na-pyruvate, 50 μg/ml uridine, 1x antimycotic-antibiotic and 25 mM galactose.
For the viability studies equal numbers of cells were plated in standard glucose (10 mM) containing media (as above) in replicates of 5. 24 h after plating cells were switched to glucose-free media (Thermo Fisher, cat# 11966-025) supplemented with 25 mM galactose and all the other additives mentioned above. After another 24 h, 1 set of cells was collected and counted (day 1) and another on each successive day. Cells were counted by hemocytometer and viability determined by trypan blue exclusion. Results are an average of five independent experiments and error bars are the standard error of the mean.
mRNA levels for the exogenously expressed constructs G1-ATP8 or G1-ATP6 was determined by qPCR. Briefly, total cellular RNA was extracted from 2.5 × 10⁶ cells from A8/6mut parental, A8/6mut + A8F, A8/6mut + A8F + A6F and A8/6mut + A6F stable cell lines using the E.Z.N.A.® Total RNA Kit I from OMEGA bio-tek (Georgia, USA). The corresponding cDNA was reverse transcribed using 500 ng of template RNA for every 10 μl reaction mix with the PrimeScript RT Reagent Kit (TaKaRa/Clonetech, Mountain View, CA, USA). One microliter of such reverse transcribed cDNA was used as input in each reaction point in qPCR. The intermediate region spanning parts of ATP5G1 MTS and the genes ATP8 or ATP6 was PCR amplified in order to confer specificity. The following primers were used: ATP5G1-oATP8 inter region (bp163-271) (Supplementary Figure S1); forward primer 5′CCAGACCAGTGTTGTCTCCC3′ and reverse primer 5′TCAGGAACAGTGTCAGCAGC3′, ATP5G1-rATP6 inter region (bp163-272) (Supplementary Figure S1); forward primer 5′CCAGACCAGTGTTGTCTCCC3′ and reverse primer 5′ATGATCAGTACTGCGGCGG3′. The nuclear encoded and mitochondrial targeted gene COX10 was used as the reference gene (forward primer 5′GTTCCGGGAGTTGCCATTCTG3′ and reverse primer 5′CAACCACAGCTCCGACCCATG 3′).
Preparation of mitochondria
Mitochondria were prepared using this method unless noted otherwise. Mitochondrial enriched fractions were prepared by a Dounce lysis method (27). Briefly, 2 × 15 cm fully confluent plates for each stable cell line or the parental cell lines (WT and A8/A6mut) were harvested by trypsin treatment and washed once with phosphate buffered saline (PBS) at 1000 rpm in a swinging bucket table top centrifuge (Eppendorf, Hamburg, Germany) for 5 min at 4°C. The cells were gently resuspended in ∼7.5 ml of mitochondria isolation buffer (MIB; 20 mM Hepes/KOH, pH 7.5, 0.25 M sucrose, 1 mM EDTA, 1 mM DTT, 0.1 mg/ml BSA, 1:500 PIM, 1 mM PMSF) and passed once through a 1 |$\frac{1}{2}$| inch, 25-gauge needle directly into a 15 ml Dounce homogenizer with 0.0010–0.0030 inch clearance. They were homogenized with 25 strokes, diluted with 7.5 ml of MIB and centrifuged at 2000 × g, 5 min, 4°C. The supernatant was saved separately and the pellet subjected to homogenization once more. The collected supernatants were centrifuged at 10 000 × g, 12 min, 4°C. The pellet from the high speed spin is the crude mitochondrial fraction. It was resuspended in MIB with 10% DMSO, flash frozen in liquid N2 and stored at −80°C until use.
Electrophoresis
Denaturing PAGE was performed in 4–12% or 12% NuPAGE minigels and proteins transferred onto PVDF membranes using a semi-dry transfer apparatus (Biorad, Richmond, CA, USA). Twenty five micrograms of protein/well was applied to denaturing PAGE gels with the exception of the Rho0 sample in Figure 2A where it was 50 μg. Blue native polyacrylamide gel electrophoresis (BN-PAGE) was performed on 3–12% Native PAGE gels (Invitrogen, Carlsbad, CA, USA). Purified mitochondria were washed once by diluting into isotonic buffer (20 mM MOPS/KOH pH 7.4, 250 mM sucrose, 1 mM EDTA, 1 mM PMSF, 1x PIM) followed by centrifugation at 10 000 × g for 5 min at 4°C. They were lysed by incubating in 20 mM Tris-HCl pH 7.5, 50 mM NaCl, 1 mM EDTA, 10% glycerol, 1 mM PMSF and 0.8% digitonin (v/v) for 30 min on ice. The lysates were centrifuged at 17 000 × g for 30 min. Protein was estimated by BCA protein assay kit (Pierce Cat# 23227) and Serva Blue G (5 mg/ml) (10x solution: 50 mg/ml Serva Blue G in 0.2 M ϵ-aminocaproic acid and 0.1 M Bis-Tris pH 7.0) added to supernatants. The samples were further cleared by centrifugation at 10 000 rpm, for 5 min at 4°C prior to loading on gels (25 μg protein/lane). Immunoblotting was performed by transferring the proteins onto PVDF membranes by tank transfer. The following antibodies were used in this study: Anti-FLAG (Cat# F1804) from Sigma, St. Louis, MO; anti-UQCRC2 : Complex III Core2 protein (Cat# MS304) and ATP5h (Cat# MS504) from MitoSciences, Eugene, OR; NDUFS4 (Cat# AP6932b); NDUFS3 from GeneTex, Irvine, CA (Cat# GTX113504); V5 from Genscript (Cat# A01724), and SDHB (Cat# AP19974b) from Abgent, San Diego, CA; ATP6 from mAbdx (Clone# 1G7-1G2); MT-CO2 (Cat# A303-600A) from Bethyl Laboratories, Montgomery, TX and ATP5O/OSCP (Cat# TA804572) from Origene Technologies, Rockville, MD, USA. Rabbit polyclonal ATP8 antibodies were generated against the NKPWEPKWTK peptide (Jomar Life Research, Scoresby, Victoria, AU). Secondary antibodies to mouse (Cat# G21040), rabbit (Cat# A16023) and goat (Cat# G21040) were obtained from Life Technologies, Carlsbad, CA, USA.
For in-gel Complex V activity, following BN-PAGE, the gel was incubated in equilibration buffer (35 mM Tris-base and 270 mM glycine; pH 8.3) for 2 h. The gel was then incubated in 20 ml assay buffer (35 mM Tris-base, 270 mM glycine, 14 mM MgSO4, 8 mM ATP and 0.2% Pb(NO3)2) and developed over a period of 2–24 h with gentle shaking (25 rpm) at room temperature. The Western blots in Figure 3A were all performed in triplicate. The Western blots in Figure 3B were performed: NDUFS4 N = 2, NDUFS3 N = 4, Complex III Core2 N = 2, MT-CO2 N = 3.
Mass spectrometry
Chemicals
Acetonitrile and water were obtained from Burdick & Jackson (Muskegon, MI, USA). Reagents for protein chemistry including iodoacetamide, dithiothreitol (DTT), ammonium bicarbonate, formic acid and urea were purchased from Sigma Aldrich (St. Louis, MO, USA). BSA and acetylated BSA were purchased from Pierce (Rockford, IL, USA). Sequencing grade trypsin was purchased from Promega (Madison, WI, USA). HLB Oasis SPE cartridges were purchased from Waters (Milford, MA, USA).
Sample preparation
For mass spectrometric analysis frozen mitochondrial pellets from different cell lines, i.e. 143B WT, A8/6mut and A8/6mut + A8F were re-suspended in 50 mM cold triethylammonium bicarbonate (TEAB) buffer and protein quantitation was performed using a BCA Protein Assay Kit (Pierce #23225, Waltham, MA, USA). Fifty micrograms of each sample was then aliquoted and brought to equal volume in 50 mM TEAB buffer. Maltoside and urea were added to each sample to a final concentration of 0.5% and 4 M, respectively, and samples were vortexed for 10 min. DTT was subsequently added to a final concentration of 20 mM and samples were incubated for 30 min at 37°C with shaking to reduce disulfide bonds. After cooling samples to room temperature, iodoacetamide was added to a final concentration of 40 mM and samples were placed in the dark at room temperature for 30 min to alkylate cysteine residues. Samples were diluted 10-fold with 50 mM TEAB followed by digestion with trypsin at a concentration of 1:50 enzyme:protein. Trypsin digestion was carried out at 37°C with shaking for 6 h. The digestion was stopped by the addition of formic acid to a final concentration of 1%, and samples were centrifuged at 1800 RCF for 15 min at room temperature. The peptide supernatants were then collected and desalted with Oasis HLB 30 mg Sorbent Cartridges (Waters #186003908, Milford, MA, USA) (28), concentrated and re-suspended in a solution containing mass spectrometric ‘Hyper Reaction Monitoring’ peptide standards (HRM, Biognosys #Kit-3003, Switzerland) and 0.2% formic acid in water.
Mass spectrometry
Samples were analyzed by reverse-phase HPLC-ESI-MS/MS using the Eksigent Ultra Plus nano-LC 2D HPLC system (Dublin, CA, USA) combined with a cHiPLC System, which was directly connected to a quadrupole time-of-flight SCIEX TripleTOF 5600 or a TripleTOF 6600 mass spectrometer (SCIEX, Redwood City, CA, USA). Typically, mass resolution in precursor scans was ∼35 000 (TripleTOF 5600) or 45 000 (TripleTOF 6600), while fragment ion resolution was ∼15 000 in ‘high sensitivity’ product ion scan mode. After injection, peptide mixtures were transferred onto a C18 pre-column chip (200 μm × 6 mm ChromXP C18-CL chip, 3 μm, 300 Å, SCIEX) and washed at 2 μl/min for 10 min with the loading solvent (H2O/0.1% formic acid) for desalting. Subsequently, peptides were transferred to the 75 μm × 15 cm ChromXP C18-CL chip, 3 μm, 300 Å, (SCIEX) and eluted at a flow rate of 300 nl/min using a 3 or 4 h gradient using aqueous and acetonitrile solvent buffers.
Some initial data-dependent acquisitions (DDA) were carried out to obtain MS/MS spectra for the 30 most abundant precursor ions (100 ms per MS/MS) following each survey MS1 scan (250 ms), yielding a total cycle time of 3.3 s as previously described (29,30). For collision induced dissociation tandem mass spectrometry (CID-MS/MS), the mass window for precursor ion selection of the quadrupole mass analyzer was set to ±1 m/z using the Analyst 1.7 (build 96) software. Subsequently, all study samples were analyzed by data-independent acquisitions, or specifically variable window SWATH acquisitions. In these SWATH acquisitions (29,31), instead of the Q1 quadrupole transmitting a narrow mass range through to the collision cell, windows of variable width (5 to 90 m/z) are passed in incremental steps over the full mass range (m/z 400–1250). The cycle time of 3.2 s includes a 250 ms precursor ion scan followed by 45 ms accumulation time for each of the 64 SWATH segments. The variable windows were determined according to the complexity of the typical MS1 ion current observed within a certain m/z range using a SCIEX ‘variable window calculator’ algorithm (i.e. more narrow windows were chosen in ‘busy’ m/z ranges, wide windows in m/z ranges with few eluting precursor ions).
Mass spectrometric data processing and bioinformatics
Mass spectrometric data from data dependent acquisitions was analyzed using the database search engine ProteinPilot (SCIEX 5.0) (32) using the Paragon algorithm. The following sample parameters were used: trypsin digestion, cysteine alkylation set to iodoacetamide, urea denaturation and species Homo sapiens. Trypsin specificity was assumed to be C-terminal cleavage at lysine and arginine. Processing parameters were set to ‘Biological modification’ and a thorough ID search effort was used. All DDA data files were searched using the SwissProt 2016_07 database (species: H. sapiens), and a custom database containing protein sequences for human ATP6 (P00846) and ATP8 (P03928), respectively. For Protein Pilot Searches, to assess and restrict rates of false positive peptide/protein identifications, we used the (PSPEP) tool available in ProteinPilot 5.0 (32), which automatically creates a concatenated forward and reverse decoy database. For database searches, a cut-off peptide confidence value of 99 was chosen. The Protein Pilot false discovery rate (FDR) analysis tool PSPEP provided a global FDR of 1% and a local FDR at 1% in all cases. Peptides and proteins that were identified by mass spectrometric analysis are listed in Supplementary Table S1.
SWATH acquisitions were quantitatively processed using Skyline 3.5 (33) an open source software project (http://proteome.gs.washington.edu/software/skyline). Quantitative SWATH MS2 data analysis was based on extracted ion chromatograms (XICs) of up to 10 of the most abundant fragment ions in the identified spectra. MS2 spectra of the peptides used to quantify ATP6 and ATP8 are shown in Supplementary Figure S2. In addition, the XICs for the top three resulting precursor ions were also extracted (31). Extracted peak areas were summed per target peptide/protein and relative quantification was performed comparing different conditions assessing fold changes for proteins from investigated cell lines, i.e. comparing A8/6mut versus 143B (WT), and A8/6mut + A8F versus 143B (WT), respectively. To quantify the chromatographic peak area of ATP8 in the null mutant, the XIC signal was integrated over the expected retention window of the ATP8 peptide based on the retention times observed in other samples. As expected, the relative fragment intensities for ATP8 did not match the pattern expected if ATP8 was present in the null mutants (Supplementary Figure S6B), consistent with the integration of baseline noise. Two different and independent sets of experiments were performed, and typically 3 biological replicates per strain were investigated (including additional technical replicates for MS acquisition). Significance was assessed using two-tailed Student's t-test requiring P-values < 0.05. In some cases spiked HRM peptide standards (Biognosys) were used for peptide normalization. Quantitative results from mass spectrometric SWATH analysis are shown in Supplementary Figure S4 and Supplementary Table S2.
Data accession
The supplemental files provide further insights into the quantitative SWATH results. All raw files are uploaded at the Center for Computational Mass Spectrometry, MassIVE and can be downloaded here: ftp://MSV000080037@massive.ucsd.edu (MassIVE ID number: MSV000080037 and password: winter; ProteomeXchange Accession PXD004782).
Immunofluorescence
WT, A8/6mut parental, A8/6mut + A8F, A8/6mut + A8F + A6F and A8/6mut + A6F stable cell lines were seeded at 40 000 cells per well into 8 well sterile chamber slides (Ibidi, Madison, WI, Cat# 80826) and grown for 24 h. They were stained for mitochondria with 50 nM Mitotracker CMXRos (Thermo-Fisher Cat# M7512) in culture medium (DMEM-complete) for 35 min at 37°C. The staining media was removed and fresh complete media was added to the slides and returned to the incubator for 1 h. Unless otherwise specified, subsequent incubations were performed at room temperature. The cells were washed once in PBS for 5 min and fixed by incubating with 100 μl of 4% paraformaldehyde (Affymetrix, Santa Clara, CA, Cat# 19943) for 10 min. After another PBS wash (5 min) the cells were permeabilized with 20 mM HEPES/KOH, pH 7.9, 50 mM NaCl, 3 mM MgCl2, 300 mM Sucrose and 0.25% Triton X-100 for 15 min. Subsequently, after three PBS washes, a blocking solution comprising of 3% BSA (Research Products International, Mt. Prospect, Illinois, Cat# A30075-100.0) in PBS for 1 h at 37°C. The cells were again washed with PBS once and incubated with monoclonal Mouse anti-FLAG antibodies (Sigma, Cat# F1804; 1:1000 dilution) in blocking buffer overnight at 4°C. Detection was achieved by incubating in goat anti-mouse IgG labeled with Alexa Fluor (ThermoFisher Cat# A11001; 1:500 in PBS containing 1% BSA) for 1 h at 37°C. DAPI (Biotium, Hayward, CA, Cat# 40043) was used as the nuclear stain. It was diluted to 1:10 000 with PBS and added to the wells and incubated for 15 min. Cells were washed twice with PBS for 5 min and mounted in Vectashield mounting medium (Vector Laboratories, Burlingame, CA, Cat# H-1000). Immunofluorescent imaging of all FLAG containing constructs was performed seven times. Chamber slides were imaged on Molecular Devices (Sunnyvale, CA, USA) Image Express Micro instrument and processed using MetaXpress image acquisition software.
Measurement of total ATP content
In a lidded, 384-well format TC-treated plate with white walls and clear bottom, ∼10 000 cells/well were plated and grown overnight in DMEM-complete medium minus antibiotics. The cells were then shifted to selective medium for each assay condition: 5 mM glucose, 5 mM galactose or 5 mM pyruvate. The influence of various OxPhos inhibitors was tested at: 5 μM antimycin A (for complex III), 5 μg/ml oligomycin (for CV), 5 μM valinomycin in 5 mM glucose. After 16 h of incubation, the cells were washed once with PBS and the total ATP content was measured using the ATP lite assay kit from Perkin Elmer (Waltham, MA, USA) on a Spectra Max i3 plate reader (Molecular Devices, Sunnyvale, CA, USA). Graphed results are a representative of an average of six replicates performed in triplicate. Normalization for each reaction point was performed relative to the value obtained for total DNA concentration as determined by Pico Green (Thermo Fisher) fluorescence. The percent values are expressed relative to glucose for WT cells.
ATP hydrolysis measurement by spectrophotometry
Mitochondria enriched fractions from WT, ATP8/6mut, A8/A6mut + A8F, A8/A6mut + A6F and A8/A6mut + A8F + A6F were incubated in 50 mM Tris-HCl pH 7.5, 10% glycerol, 50 mM KCl, 6 mM phosphoenol pyruvate, 0.2 mM NADH, 6 U pyruvate kinase, 6 U lactate dehydrogenase and the reaction initiated by the addition of 2.5 mM ATP. The decrease in absorbance at 340 nm was followed kinetically for 25 min at 37°C at reaction conditions with antimycin A (5 μg/ml) alone or antimycin A (5 μg/ml) and oligomycin (5 μg/ml). The difference in the slopes was used to calculate the ATP hydrolysis rate and expressed as nmol ATP hydrolyzed/min per mg of protein (34).
Oxygen consumption and acidification rate measurement
We employed a Seahorse XF24 as described previously (35). Seahorse buffer contained 15 mM glucose, 0.1% BSA and 15 mM sodium pyruvate. Cells were plated in quadruplicate the day before the experiment in numbers designed to achieve approximately 100% confluence at the time of the experiment. Drugs were employed via ports A, B and C at the following final concentrations: 2 μg/ml oligomycin 1.5 μM FCCP, 2 μM rotenone and 1 μM antimycin A. Data are shown as the average of three separate experiments performed on different days, each data point of which is the average of the four replicates. Data were normalized to cell number. Cell numbers were estimated from DNA content (Pico Green, Thermo Fisher) after the experiment was completed. Standard Error was calculated from the 3 independent experiments (N = 3).
RESULTS
The case study of a patient with a point mutation in the mitochondrial DNA (m.8529G→A) has been described previously (36). This mutation results in a premature truncation of the mitochondrial ATP8 protein and is predicted to result in a protein missing the C-terminal 14 amino acids (aa) of the 68 aa ATP8 protein. In addition, the start codon of the mtATP6 gene is converted from ATG to ATA (Figure 1A). Disease symptoms include hypertrophic cardiomyopathy and neuropathy, and biochemical analyses revealed a Complex V deficiency.
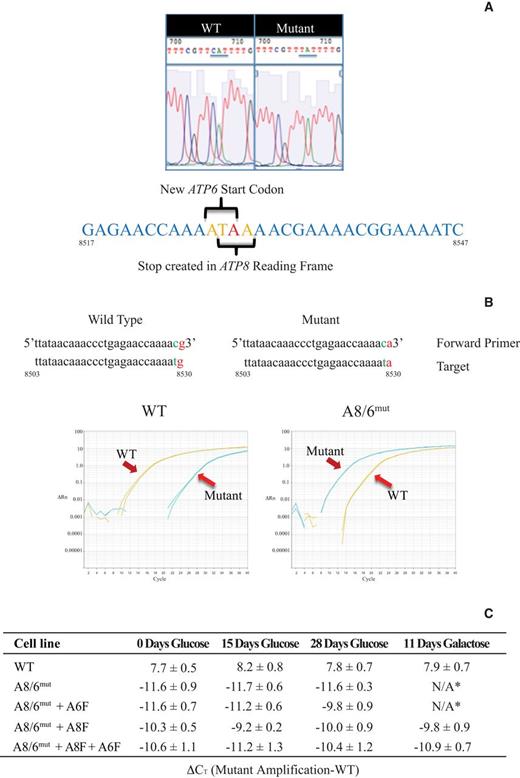
Description and detection of the m.8529G→A (A8/A6mut) mutation. (A) Sequence of WT 143B and mutant m.8529G→A mtDNA showing the point mutation and impact on the coding of ATP8 and ATP6. (B) Detection of wild-type (WT) and mutant sequences using ARMS qRT-PCR. (C) Confirmation of mutant homoplasmy by qRT-PCR. ΔCt = CT mutant – CT wt, normalized using MT-CYB as the housekeeping gene. * No discernible cell survival under these conditions.
In order to achieve complete homoplasmy and ensure a clean working system, we treated transmitochondrial cybrids derived from this patient's cells with ethidium bromide for 4 weeks. Subsequently, 26 clones were selected and analyzed for mutation load. We employed allele refractory mutation system (ARMS) based qPCR analysis (26) to carefully distinguish between the WT and mutant mtDNA. We tested primers with 0, 1 or 2 base-mismatches immediately 5′ to the mutant base. We found that primer sets with one penultimate change in the base position relative to the mutation were best suited to distinguish WT and mutant sequences (Figure 1B and Supplementary Table S3). The clone with the largest cycle threshold difference (ΔCT) (R1ΔA8 #12) between WT and mutant primer sets was chosen for further study and is referred to as A8/6mut (Supplementary Table S4). The sequence of the chosen clone was further confirmed through PCR and primer extension sequencing (Figure 1A). Cells from this clone were completely unable to grow on galactose (discussed in more detail below, Figure 7). The A8/6mut cells had no detectable ATP8 protein (Figure 2A, Lane 2, left panel and Figure 2D). Surprisingly, ATP6 levels were also greatly reduced in these cells; even though m.8529G→A is predicted to be a silent mutation in the start codon of ATP6 (Figure 2A, lane 2, right panel). These homoplasmic mutant cells were transfected with pCMV6 plasmids harboring codon-corrected ATP8 or ATP6 genes independently (A8/6mut + A8F or A8/6mut + A6F) or in tandem (A8/6mut + A8F + A6F) and stable cell lines were generated as described in the Materials and Methods. We tested for the expression of these constructs at the mRNA level by qRT-PCR (Supplementary Table S5). About 2 log 2 lower expression of ATP5G1-ATP6-FLAG was observed when compared to ATP5G1-ATP8-FLAG, however, the mRNA levels for ATP5G1-ATP6-FLAG was comparable to endogenous COX10 mRNA levels.
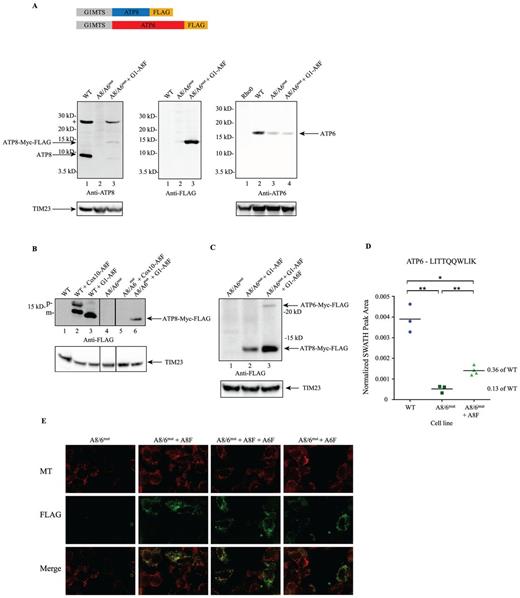
A8/A6mut cells stably express ATP8 alone or ATP8 + ATP6 proteins and target to mitochondria. Purified mitochondrial fractions from stable cell lines expressing ATP8 (A8/A6mut + A8F) and/or ATP6 (A8/A6mut + A8F + A6F, A8/A6mut + A6F). (A) Immuno-detection for anti-ATP8 (left panel, the + at ∼26 kD indicates a cross-reacting band), anti-FLAG (center panel; reprobe of left panel) and anti-ATP6 (right panel) antibodies. Resolved on a 4–12% denaturing PAGE. TIM23 protein was used as loading control (bottom panel). (B) Transient (lanes 2 and 3) and stable (lanes 5 and 6) expression of ATP8 protein in WT and A8/A6mut. Resolved on a 4–12% denaturing PAGE. (C) Stable expression of G1MTS-ATP8-FLAG and G1MTS-ATP6-FLAG proteins in A8/A6mut cells. Resolved on a 12% denaturing PAGE. TIM23 protein was used as loading control (bottom panel). (D) Monitoring tryptic peptide LITTQQWLIK (at m/z 622.37 with z = 2) derived from protein ATP6 by mass spectrometry. Data-independent SWATH acquisitions were analyzed using the Skyline algorithm, extracted ion chromatograms (XICs) were processed and normalized peak areas for LITTQQWLIK were used to quantify relative changes in the abundance of ATP6 comparing different human cell lines WT, A8/6mut and A8/6mut + A8F cells. Each cell line was acquired in biological triplicates, the A8/6mut + A8F strain was analyzed from four biological replicates, and normalized peak areas from all biological replicates and strains are displayed. A statistically significant ratio of 0.13 was measured comparing relative ATP6 protein levels between A8/6mut versus WT strains with a p-value of 0.009(**). The reduction in relative ATP6 protein levels in the mutant strain A8/6mut were significantly lower compared to the ATP6 levels in the rescue mutant A8/6mut + A8F strain. The relative ATP6 protein ratio comparing A8/6mut + A8F versus WT strains was measured at 0.36 with a P-value of 0.018 (*). (E) Co-localization of FLAG (Green) with Mitotracker (Red) in A8/A6mut cells stably expressing G1MTS-ATP8-FLAG and G1MTS-ATP6-FLAG.
To be certain that none of the cell lines we were working with could revert to a WT genotype we again employed the ARMS qPCR analysis to cells that had been in culture for 0, 15 or 28 days, as well as cells that had been grown for 11 days using galactose as their primary carbon source. As can be seen from Figure 1C and Supplementary Table S6, none of the A8/6mut cells or A8/6mut + A8F, A8/6mut + A6F and A8/6mut + A8F + A6F stable cell lines made any significant shift toward WT under non-selective (glucose) or selective (galactose) growth conditions. Western blot analysis of mitochondrial protein extracts purified from stable cell lines indicate that indeed ATP8 (Figures 2B Lane 6, 2C Lanes 2 and 3) and ATP6 (Figure 2C, Lane 3) proteins can be expressed in these patient cybrids. TIM23 was used as a loading control. While an ATP8 construct containing the MTS from the COX10 gene worked well when transiently transfected, protein expression was not maintained in stable cell lines. However, cells transfected with constructs harboring the ATP5G1 MTS (G1) seemed to express both the genes tested under transient and stable conditions (Figure 2B). Expression levels of exogenous ATP6 protein achieved were substantially lower than our FLAG-tagged ATP8 (Figure 2C lane 3). Endogenous ATP6 remained low in stable cell lines expressing exogenous ATP8 alone (Figure 2A, lane 3, right panel), however, quantitative SWATH mass spectrometry analysis did show a modest increase in endogenous ATP6 levels in A8/6mut + A8F cells compared with the A8/6mut cells which showed only 13% of ATP6 compared to WT (Figure 2D). Other CV proteins were not reduced in A8/6mut or A8/6mut + A8F cells (Supplementary Figure S5).
We further investigated whether our constructs could be visualized at mitochondria by immunofluorescence. A8/6mut cells stably expressing ATP8, ATP6 or both constructs showed co-localization of our FLAG-tagged constructs with the mitochondrial dye Mitotracker CMXRos (Figure 2E). Relatively few cells expressing ATP6-FLAG alone, however, showed colocalization of FLAG epitopes with Mitotracker.
Further investigation revealed that allotopically expressed ATP8 could be integrated into OxPhos CV as determined by BN-PAGE Western blots using antibodies to the FLAG epitope and ATP8 (Figure 3Ai and ii). Additionally, a stably expressed V5-tagged version of the ATP8 gene with the ATP5G2 MTS (pCMV6-ATP5G2MTS-ATP8-V5) also incorporated into CV of A8/6mut in BN-PAGE (Supplementary Figure S7A). We sought to learn what impact our exogenous ATP8 and ATP6 expression had on CV assembly, but we were also curious about how the null mutation in ATP8 might impact other protein complexes of the electron transport chain (Complexes I, II, III and IV) and further, how these allotopically expressed proteins might in turn influence them. The patient-derived cell line had an altered/reduced profile for most or all of the OxPhos complexes (Figure 3A and B). Stably expressing ATP8 alone partially restored CV monomers (∼550 kD) while co-expressing ATP8 and ATP6 restored both monomers (∼550 kD) and dimers (∼1000 kD – Figure 3Aii lane 2). Further, levels of CII (succinate dehydrogenase complex subunit B (SDHB)) were restored on expressing ATP8 alone, whereas ATP8 and ATP6 were required to restore Complex III (cytochrome c reductase core protein II (Core 2)) or Complex IV (cytochrome c oxidase subunit II (MT-CO2)) completely. Oligomycin sensitivity conferring protein (OSCP), which is part of the link between the Fo component and F1 subunit of CV, seemed to be reduced in the A8/6mut cells. However, this protein also seemed to be partially restored in the double expressing cells and in cells expressing ATP8 alone (Figure 3A iv). Antibodies against NDUFS4 (Figure 3B panel i) and NDUFS3 (Supplementary Figure S7B) were used to visualize Complex I, but we are unable to conclude whether Complex I assembly is impacted by the m.8529G→A mutation. Native TIM23 containing-complexes also seemed to be disrupted in the A8/6mut cells and were also complemented by ATP8 or ATP8 + ATP6 expression (Supplementary Figure S7C).
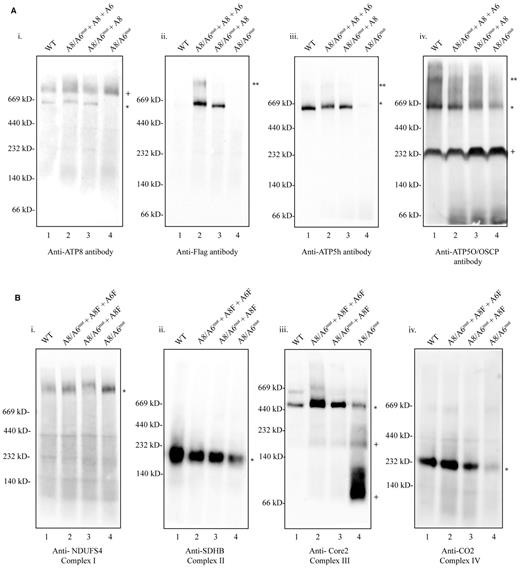
OxPhos complexes reassemble upon exogenous expression of ATP8 and ATP6 proteins in the A8/A6mut cell line. Mitochondria-enriched fractions (∼25 μg protein/lane) from WT (lane 1), A8/A6mut + A8F + A6F (lane 2), A8/A6mut + A8F (lane 3) and A8/A6mut (lane 4) were electrophoresed on 4–12% Bis-Tris BN-PAGE gels. Proteins were transferred onto PVDF membranes and immunodetected with the following antibodies: (A) panel i: anti-ATP8, ii: anti-FLAG, iii: anti-ATP5h, iv: anti-ATP5O (OSCP), and (B) panel i: anti-NDUFS4 (Complex I), ii: anti-SDHB (Complex II), iii: anti-Core 2 protein (Complex III), iv: anti-MT-CO2 (Complex IV). Protein standards are indicated on the left. * Immunodetected protein band, ** CV dimers, +degraded products of Complex III.
Figure 4 depicts in-gel ATPase activity in WT, A8/6mut, A8/6mut + A8F and A8/6mut + A8F + A6F cells. ATP hydrolysis was confined predominantly to CV monomers, and to a lesser extent dimers, in digitonin-solubilized mitochondria from WT cells. In the A8/6mut cells, this activity was observed only in the free F1 subunits. Expressing ATP8 alone restored the hydrolysis activity in the CV monomers with a concomitant decrease in free F1 activity. Expressing both ATP8 and ATP6 further increased monomer activity, restored some dimer activity in addition to greatly reducing the free F1 dependent ATPase activity. In line with the above observations, oligomycin-sensitive ATPase activity was observed only in cells expressing both ATP8 and ATP6 as judged by pyruvate kinase-lactate dehydrogenase assay (Table 1). Relative to the control cells, 55% of ATPase activity was restored in cells expressing both ATP8 and ATP6 (199 ± 5.9 and 109 ± 4.2 nmol/min/per mg protein, respectively). Surprisingly, expressing ATP8 alone restored the ATP hydrolysis to only 9.5% of wild type (19 ± 3.5 nmol/min/per mg protein). Allotopic expression of ATP6 protein individually showed little or no improvement on the oligomycin sensitive ATP hydrolysis rate (6.9 ± 2.5 nmol/min/per mg protein), suggesting that the residual ATPase activity observed is not due to assembled CV.
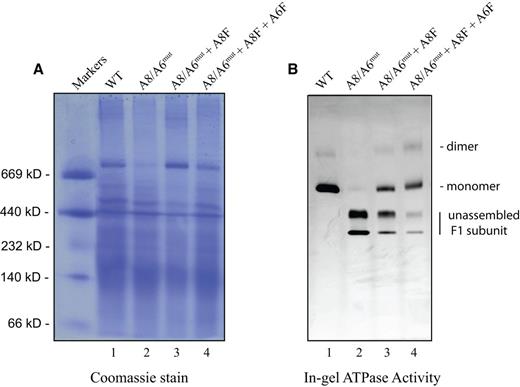
Restoration of Complex V ATPase activity. Mitochondrial proteins (∼25 μg) from WT (lane 1), A8/A6mut (lane 2), A8/A6mut + A8F (lane 3) and A8/A6mut + A8F + A6F (lane 4) were electrophoresed in 3–12% Bis-Tris, NativePAGE protein gels and incubated with assay buffer for 24 h. The in-gel activity was documented and subsequently the same gel was stained with 0.2% Coomassie blue R250. (A) Coomassie stain and (B) in-gel ATPase activity. Protein standards are indicated on the left.
Mitochondrial ATPase activity. Values are presented as means ± SEM (N = 3), percentages relative to WT and P-values compared with A8/6mut (two tailed Student's t-test)
| Cell line | Activity (nmol/min/mg protein) | % Activity | P-value |
|---|---|---|---|
| WT | 199 ± 5.9 | 100 ± 2.9 | 2.9 × 10⁻⁴ |
| A8/6mut | 4.5 ± 3.0 | 2.3 ± 1.5 | - |
| A8/6mut + A8F | 19 ± 3.5 | 9.5 ± 1.7 | 0.017 |
| A8/6mut + A8F + A6F | 109 ± 4.2 | 55 ± 2.1 | 2.3 × 10⁻⁴ |
| A8/6mut + A6F | 6.9 ± 2.5 | 3.5 ± 1.3 | 0.47 |
As these mutant cells seemed to lack CV-dependent ATPase activity, we hypothesized that they would compensate with elevated levels of glycolysis. We therefore measured proton production rates (PPR) using a Seahorse XF24 analyzer. Cells were supplied with both glucose and pyruvate as substrates. We observed that not only did the null cells have substantially higher basal PPR (17.4 ± 0.43 pmol H+/min/1000 cells) than WT cells (4.4 ± 0.94 pmol H+/min/1000 cells), implying higher glycolytic rates, but also that they were unresponsive to oligomycin (Figure 5A and Table 2). WT cells, on the other hand, responded to oligomycin treatment by up-regulating PPR substantially. When cells expressing exogenous ATP6, ATP8 or both were tested for these parameters we observed that expression of ATP6 alone caused little change in PPR nor did it affect oligomycin response. However, addition of ATP8 alone or in combination with ATP6 significantly lowered the basal PPR, to 8.9 ± 0.92 pmol H+/min/1000 cells and 6.0 ± 0.32 pmol H+/min/1000 cells respectively, and partially restored the oligomycin-dependent increase in PPR (‘Max’ PPR, Table 2).
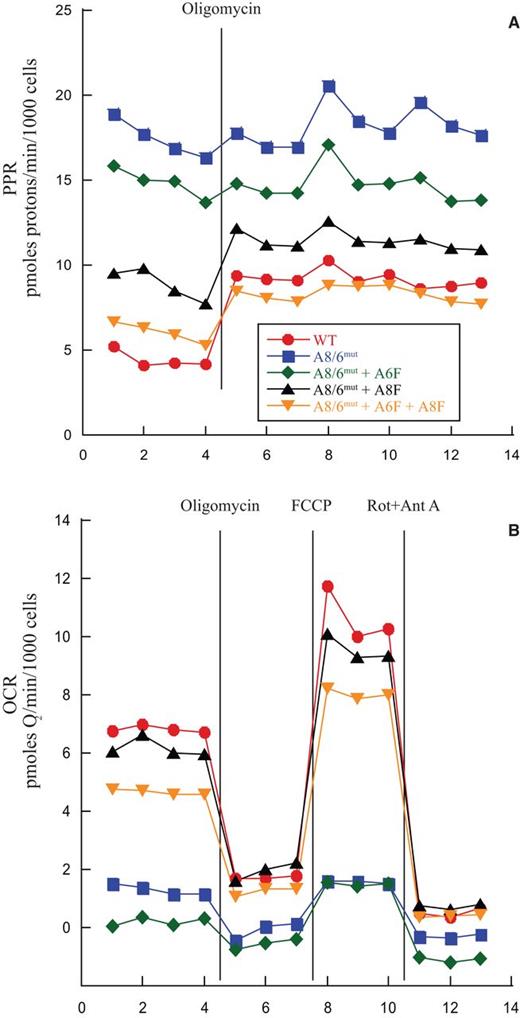
Metabolic preference of mutant cells switches with expression of ATP8/6. Cells were pre-incubated with an excess of glucose and sodium pyruvate. After basal rates were measured, CV function was inhibited by addition of oligomycin. Electron transport was then uncoupled by addition of FCCP, and finally all electron transport was inhibited by addition of rotenone and antimycin A. X-axis denotes measurement points. Cell lines were tested in quadruplicate in each of 3 independent experiments and results were normalized to cell number as estimated by DNA content. (A) Proton Production Rate (PPR) as a crude measure of glycolysis. (B) Oxygen consumption rate (OCR).
Proton Pumping and Oxygen Consumption Rates. Average of all 4 data points from 3 biological replicates for basal PPR and OCR, all 9 points for PPR of post-oligomycin treated cells and 3 OCR points for FCCP treated cells. All error noted is the SEM calculated from N = 12 for basal OCR and PPR, N = 27 for Oligomycin (Max) PPR and N = 18 for FCCP (Max) OCR. P-values (two-tailed Student's t-test) for difference between experimental and A8/A6mut: *P < 1 × 10⁻⁴, **P = 6.2 × 10⁻⁴, +P = 1.9 × 10⁻³, ++P = 4.6 × 10⁻⁴, +++P = 2.1 × 10⁻⁴
| Cell line | Avg. Basal PPR | Avg Max PPR | Avg Basal OCR | Avg. Max OCR |
|---|---|---|---|---|
| WT | *4.4 ± 0.94 | *9.2 ± 5.7 | *6.8 ± 1.1 | +11 ± 2.4 |
| A8/6mut | 17 ± 0.43 | 18 ± 2.5 | 1.3 ± 0.22 | 1.6 ± 0.39 |
| A8/6mut + A6F | 15 ± 1.5 | 15 ± 3.8 | 0.20 ± 0.39 | 1.5 ± 0.51 |
| A8/6mut + A8F | *8.9 ± 0.92 | *11 ± 4.8 | **6.2 ± 1.0 | ++9.6 ± 1.8 |
| A8/6mut + A8F + A6F | *6.0 ± 0.32 | *8.3 ± 3.0 | *4.7 ± 0.47 | +++8.0 ± 1.3 |
| pmoles H+ / min / 1000 Cells | pmoles O2 / min / 1000 Cells | |||
We further investigated whether this null mutation in the ATPase would indirectly impact oxygen consumption and, if so, whether our ATP8 and ATP6 expression could restore it. We found that basal oxygen consumption was almost zero in the null (1.3 ± 0.22 pmol O2/min/1000 cells) and ATP6-expressing (0.2 ± 0.39 pmol O2/min/1000 cells) mutant cells (Figure 5B and Table 2). By contrast, either ATP8 single (6.2 ± 1.0 pmol O2/min/1000 cells) or ATP6/8 double (4.7 ± 0.47 pmol O2/min/1000 cells) expression in mutant cells restored a significant level of basal oxygen consumption. Both of these cell lines (A8/6mut + A8F and A8/6mut + A8F + A6F) responded to oligomycin, FCCP and Rotenone/Antimycin A significantly more than null or null cells expressing only exogenous ATP6. WT cells had a basal oxygen consumption rate of 6.8 ± 1.1 pmol O2/min/1000 cells.
Next, we tested the influence of various OxPhos or glycolysis inhibitors on total ATP content in the WT, A8/6mut, A8/6mut + A8F and A8/6mut + A8F + A6F cell populations. WT cells grown using glucose as the primary energy source can perform both oxidative phosphorylation and glycolysis. Galactose, however, is a poor substrate for glycolysis and OxPhos null cells are inviable under these conditions. Galactose and pyruvate as the sole carbon sources were well tolerated in WT, ATP8- alone or ATP8- and ATP6-FLAG expressing mutant cells but did not support growth in parental mutant cells or in mutant cells expressing only ATP6 (Figure 6A).
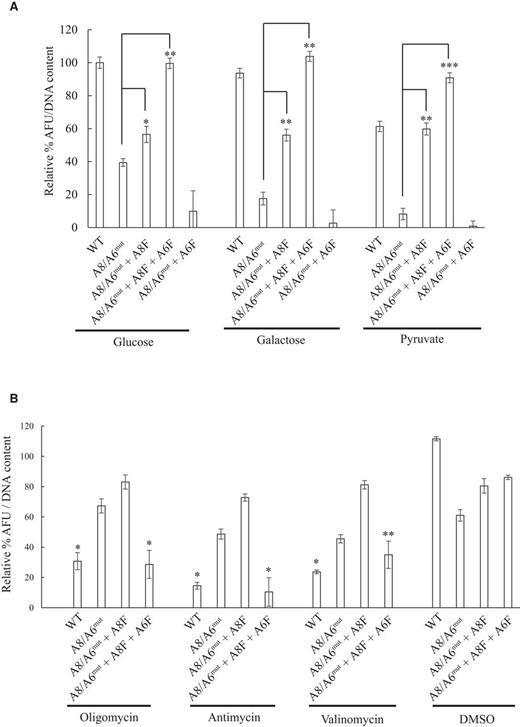
Influence of carbon source and OxPhos inhibitors on total cellular ATP content. (A) Total cellular ATP levels (normalized to total DNA content) were determined after 16 h of incubation in respective carbon sources, glucose (5 mM), galactose (5 mM) or pyruvate (5 mM) by luciferase assay as described in Materials and Methods. Values are expressed as percent ATP content relative to glucose as the carbon source for WT. *P = 1.1 × 10⁻³ and **P < 1 × 10⁻⁵. (B) Cell lines were grown in complete medium for 24 h and then shifted to complete medium plus the respective inhibitor: antimycin A 5 μM, oligomycin 5 μg/ml and valinomycin 5 μM for 16 h, washed once with PBS and the total ATP content measured by luciferase assay as in A. Values are expressed percent relative to untreated WT sample. *P < 0.001 and ** P = 1.4 × 10⁻³. Error is ± SEM, N = 6.
The inhibitory profile of WT and the A8/6mut + A8F + A6F cells were similar for oligomycin (5 μg/ml), antimycin A (5 μg/ml) and valinomycin (5 μg/ml); however, these inhibitors had little effect on the A8/6mut and A8/6mut cells expressing the ATP8 gene alone (Figure 6B). This suggests that although allotopic expression of ATP8 alone in these mutant cells can partially restore CV monomers, they fail to fully restore functionality to the monomers due to reduced ATP6 protein. Co-expression of ATP8 and ATP6 alleviated this problem including effective reconstitution of other electron transport chain complexes (Figure 3B).
Finally, we determined how well cells containing our various ATP8 and ATP6 expression constructs could survive under growth conditions requiring OxPhos. We found that WT cells grown using sugar-free media supplemented with galactose grew robustly and experienced little cell death (Figure 7). A8/6mut cells, however, experienced massive cell death and little or no cell division. While expressing ATP6 alone resulted in viability that is similar to that of the null cells, expressing ATP8 alone or together with ATP6 in the mutant cells resulted in substantially better survival (P < 0.0001).
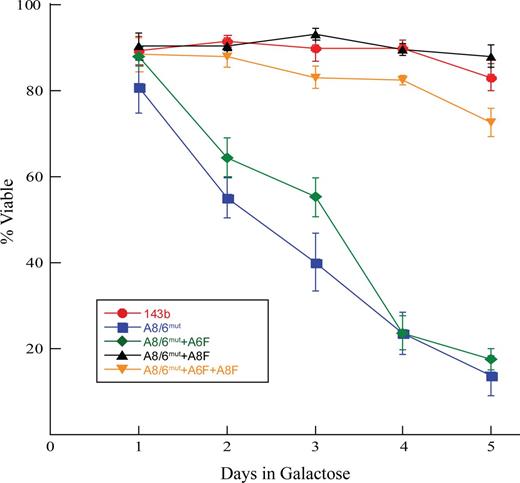
Viability of mutant and ATP8/6 expressing cells under restrictive growth conditions. Cells were cultured in media containing no glucose but supplemented with 25 mM galactose. Equal numbers of cells were plated in glucose containing media in replicates of 5, 24 h later cells were switched to galactose media. After another 24 h, one set of cells was collected and counted (day 1) and another on each successive day. Cells were counted by hemocytometer and viability determined by trypan blue exclusion. Results are an average of 5 independent experiments and error bars are SEM.
DISCUSSION
We describe the efficient rescue of a disease phenotype stemming from a single point mutation in the mitochondrial ATP8 gene (m.8529G→A) through the simultaneous allotopic expression of two mitochondrial genes: ATP8 and ATP6. ‘Allotopic’ expression, defined as relocation of genes from their natural location in the mitochondria to the nucleus and their retargeting to the organelle has been proposed and described previously (14–17,37,38). It has remained, however, a hotly debated area of research (24,25), even as approaches are tested in animals (18,19,38,39) and human clinical trials (40,41).
Several mutations in the mitochondrial ATP6 gene have been documented that result in substantially lowered capacity for ATP production (42–49). Depending on the heteroplasmy load and the precise nature of the mutation, these mutations often present clinically as neuropathy, ataxia and retinitis pigmentosa (NARP) syndrome or the more severe maternally inherited Leigh syndrome (MILS). A threshold effect in manifestation of the disease was observed in one such mutation; 9205delTA, that affects the ATP6 and CO3 genes (50). A role for altered mitochondrial membrane potential has been suggested in these ATP6 mutations (45). In contrast, to our knowledge, only two mutations have been reported in the human mitochondrial ATP8 gene (36,51). Both of these mutations are located in the overlap region between the ATP8 and ATP6 genes, and they both affect the translation start site of the ATP6 gene. In the case of the m.8528T→C mutation, a highly conserved tryptophan residue in ATP8 is converted to the basic residue arginine. As a result, the start methionine for ATP6 is converted to threonine (51). In the current study, a T→A substitution at the m.8529 position results in the premature truncation of the ATP8 protein (Trp55→stop), wherein the last 14 aa of the protein are absent (and we show that this results in cells that seem to be null for ATP8 protein and function, Figure 2A, left panel, lane 2 and Supplementary Figure S3B).
We selected this cell line in order to be able to be completely certain that the results that we observed were caused by our exogenously expressed ATP8 and could not be impacted by any endogenous protein. To our knowledge this is the first successful demonstration of allotopic expression of a mitochondrial gene in cells that are both null for a protein and homoplasmic for that mutation. Previously, the MT- ND1 gene was allotopically expressed in ND1 null cells, but these cells were not completely homoplasmic and the purpose of that study was to identify the role of ND1 in tumorigenisis rather than to establish the biochemical functionality of allotopically expressed ND1 (20). Our approach completely removes the ambiguity that might be caused by competing with either WT or mutant proteins.
The m.8529 T→A mutation also results in the conversion of the start codon of ATP6 from ATG to ATA. Theoretically, this is a silent mutation in mitochondrial methionine and should not influence translation of the ATP6 gene (at least three other mtDNA encoded proteins, ND1, ND3 and ND5, use ATA as their translation start codon, according to the Cambridge sequence (52)). Our observations suggest, however, that ATA may not always be an efficient mitochondrial start codon. An alternative hypothesis could be that the loss of ATP8 protein destabilized or otherwise led to reduced ATP6 protein levels. Our results do indicate, however, that ATP6 protein levels are somewhat improved from 13% in the A8/6mut cells to 36% in A8/6mut + A8F cells on exogenous functional ATP8 expression (Figure 2D). It is unclear from our results whether the loss of ATP6 in these cells is due completely to the loss of ATP8 or if the ATP6 start codon change also plays a role.
Transmitochondrial cybrids from patient fibroblasts showed marked CV defects, namely disassembled holo CV with increased subcomplexes, free F1 in-gel ATPase activity and minimal oligomycin-sensitive F1Fo ATPase (36). Others have demonstrated crosstalk between different complexes of the OxPhos machinery and in particular the assembly of the four complexes of the electron transport chain (53). Our data support the hypothesis that a fully assembled Complex V supports high levels of electron transport chain assembly (Figure 3B) and function, due to the restoration of oxygen consumption upon ATP8 complementation (Figure 5). Additionally, probing for TIM23 (one of the mitochondrial pre-protein translocase channel proteins) in BN-PAGE indicated a highly disrupted protein complex profile in the null cells compared to WT (Supplementary Figure S7C) suggesting a more pleiotropic effect for the absence of ATP8 protein in these mutant cybrid cells. Mitochondrial protein import is a highly energy dependent process and interactions between the TOM-TIM complexes and the respiratory chain has been re-iterated previously (54–56). It is not surprising, therefore, that disrupting the function of Complex V, the final complex in ATP generation leads to profound effects in the native molecular state of TIM23. The TIM23 complex profile was restored significantly on expressing ATP8 and ATP6 proteins (Supplementary Figure S7C).
We engineered expression of the mitochondrial ATP8 and ATP6 genes from the nucleus in the patient cybrids individually or together. This involved adding a MTS, the G1 MTS from the ATP5G1 gene (Complex V) or Cox10 MTS from COX10 gene (Complex IV) at the 5′ end followed by codon-corrected ATP8/6 genes and a Myc-FLAG tag at the 3′end for cytoplasmic translation. In our hands, constructs using either MTS could be expressed transiently, but only the G1 MTS containing ATP8 constructs were detected after stable selection (Figure 2B). This has implications for prospective gene therapies in that we must ensure that such therapies would maintain stable, long-term expression. Whether any of the problems with long-term expression that we have observed are mitochondria-specific is unknown to us.
While we have not yet had the opportunity to test a comparison, we tentatively conclude that epitope tags do not prevent the proper function of ATP8 and ATP6. Our sizable Myc-DDK (FLAG) tag-containing ATP8 construct is targeted to the mitochondria (Figure 2) and efficiently integrates stably into fully assembled Complex V (Figure 3A).
In order to better understand the impact of the mutation and the exogenous ATP8 and ATP6 expression on the energetic state of the cells, we measured the proton production rate (a crude measure of glycolytic rate) and the oxygen consumption rate in live cells using a Seahorse XF analyzer. Both the ATP8-FLAG and ATP8-FLAG/ATP6-FLAG exogenously expressing cell lines partially restored both basal and maximal oxygen consumption capacity and restored acidification rates closer to WT levels (Figure 5B). In summary of our metabolic and biochemical assays we show that, while our null cells are unable to perform OxPhos, expression of ATP8 with or without ATP6 can restore the ability to change their metabolic preference depending on the available carbon source.
While it was difficult to fully appreciate the improvement in ATPase activity from the in-gel activity assay (Figure 4B) when moving from A8/6mut + A8F to A8/6mut + A8F + A6F, the much more quantitative PKLDH assay clearly demonstrated a dramatic and reproducible difference between the ATP8 single (9.5%) and ATP8/6 co-expression (55.0%). This may be due simply to the quantitative nature of the assay, but it may also have something to do with the different natures of the assays, one of which (the in-gel assay) relies on isolated mitochondrial protein and the other (PKLDH) which is performed in somewhat intact mitochondria in which CV remains in the mitochondrial membrane.
The differences in the effects of expressing ATP8 alone or in combination with ATP6 reiterates the importance of ATP6 in CV function. The ATP6 protein has been shown to confer the proton gradient function in earlier studies (45). However, our ‘double complementation’ (A8/6mut + A8F + A6F) cells did not completely restore CV assembly or other mitochondrial function to WT levels. We attribute this to our inability to express and/or target sufficient quantities of ATP6 protein to the mitochondria (Figure 2C). It should be noted that the clearest explanation for the substantial rescue achieved by expressing exogenous ATP8 alone is that there is a residual amount of ATP6 (∼13%) present in the A8/6mut cells (Figure 2D). Improving stable ATP6 expression/targeting could improve the functional rescue and continues to be an active effort of our research.
We show that the two mtDNA encoded CV genes, which are two of the smallest mtDNA encoded genes, can be expressed in the nucleus and their gene products effectively targeted to the mitochondria. This suggests that Complex V might be an attractive target for gene therapy. CV mutations can be among the most severe in terms of clinical presentation and effective treatments are almost non-existent. CV mutations are mainly associated with Leigh syndrome or NARP, often resulting in skeletal myopathy, cardiomyopathy, encephalopathy, retinitis pigmentosa and neuropathy. Thus, targeting a particular organ, such as the heart, might provide a finite target short of full body gene therapy that, if effective, would yield tremendous health benefits for the patient. In transgenic mice, allotopically expressed ATP6 protein was observed to be imported into mitochondria and may be physiologically active (57). A small safety and efficacy clinical trial attempting to perform ND4 gene therapy was performed in China on LHON patients (58) and another is ongoing in the United States (59). Excitingly, a French company, GenSight Biologics, is now conducting Phase III clinical trials using allotopic expression of ND4 to treat blindness in LHON patients (60,61). The eye might be an attractive target for CV gene therapy as well, as CV mutations can cause retinitis pigmentosa, although these mutations usually cause loss of vision by affecting the muscles around the eye, rather than ophthalmoplegia (inside the immune privileged orb of the eye) as in the case of LHON.
We have achieved substantial success in rescuing a null OxPhos phenotype, including the re-assembly of CV. We do not wish to claim, based purely our results, that this approach would be effective using any or all of the mitochondrially encoded proteins. We achieved the greatest success with ATP8, which is also the smallest mitochondrially encoded protein. ATP6, while much larger than ATP8, is still one of the smaller proteins normally translated inside of the mitochondria. Other groups have published results demonstrating difficulty in importing other proteins into the mitochondria (24,25). Indeed, our group has thus far failed, after many attempts, to express and import CYB into the mitochondria (data not shown). We hope, however, that with careful experimentation and additional levels of targeting (such as RNA targeting to promote co-translational import) (5,62), that this approach will someday become generalized to any of the 13 proteins of the mitochondrial genome.
The authors would like to thank Scott Needham of Jomar Life Research who generously synthesized the ATP8 antibody for our use. Aubrey de Grey was instrumental in inspiring and driving this project. The colleagues of the authors Haroldo Silva, David Halvorsen, Anne Corwin and Michael Rae provided support and feedback during the course of this project. The authors thank Greg Chin of SRF Education for critical feedback on this manuscript, but especially for supporting them with fantastic interns to work with. The authors would like to thank Shona Mookerjee, Irina Perevoshchikova, Akos Gerencser and Katya Frazier for valuable feedback and help with the Seahorse measurements and data interpretation. The authors thank Marisol Corral-Debrinski (INSERM, Paris, France) for plasmids and valuable discussions. Finally, the authors would like to thank the Rodenburg lab (Radboud University Medical Center, The Netherlands) for providing the m.8529G→A cybrids which made this study possible.
FUNDING
SENS Research Foundation; The Foster Foundation; Longecity Foundation; Lifespan.io. Funding for open access charge: SENS Research Foundation. NIH shared instrumentation grant for the TripleTOF 6600 system at the Buck Institute [1S10 OD016281].
Conflict of interest statement. None declared.
REFERENCES

Comments