


Abstract
The order Rodentia contains half of all extant mammal species, and from an evolutionary standpoint, there are persistent controversies surrounding the monophyly of the order, divergence dates for major lineages, and relationships among families. Exons of growth hormone receptor (GHR) and breast cancer susceptibility (BRCA1) genes were sequenced for a wide diversity of rodents and other mammals and combined with sequences of the mitochondrial 12S rRNA gene and previously published sequences of von Willebrand factor (vWF). Rodents exhibit rates of amino acid replacement twice those observed for nonrodents, and this rapid rate of evolution influences estimates of divergence dates. Based on GHR sequences, monophyly is supported, with the estimated divergence between hystricognaths and most sciurognaths dating to about 75 MYA. Most estimated dates of divergence are consistent with the fossil record, including a date of 23 MYA for Mus-Rattus divergence. These dates are considerably later than those derived from some other molecular studies. Among combined and separate analyses of the various gene sequences, moderate to strong support was found for several clades. GHR appears to have greater resolving power than do 12S or vWF. Despite its complete unresponsiveness to growth hormone, Cavia (and other hystricognaths) exhibits a conservative rate of change in the intracellular domain of GHR.
Introduction
Rodents comprise the most speciose order of eutherian mammals, representing almost half of all living species and exhibiting a worldwide distribution. Basal divergences among major rodent groups are quite ancient, with many extant lineages dating to the Eocene, implying earlier divergence dates probably extending into the Paleocene or Cretaceous. Recent divergence dates derived from protein sequences (Kumar and Hedges 1998 ) suggest unusually ancient divergences for some rodent lineages, including ∼110 MYA for the separation of the two major suborders Hystricognathi and Sciurognathi and 41 MYA for Mus/Rattus. These molecular dates are surprising because they indicate extremely large gaps in the fossil record of rodents and of mammals in general that seem implausible given estimated rates of preservation (Foote et al. 1999 ).
Although the order Rodentia is diagnosed by several derived morphological traits (Luckett and Hartenberger 1985 ), many phylogenetic and molecular evolutionary problems persist. For instance, relationships among major rodent families are confounded by mosaic patterns of derived and primitive morphological traits (Luckett and Hartenberger 1985 ). Characteristics of the zygomasseteric structure and jaw musculature have long been used for classifying rodent families and suborders, but many of these structures reveal parallelism and reversals throughout the rodent radiations (Nedbal, Honeycutt, and Schlitter 1996 ). Even more surprising is the failure of many recent molecular studies to find strong support for the monophyly of Rodentia (Graur, Hide, and Li 1991 ; Graur et al. 1992 ; Ma et al. 1993 ; Wolf et al. 1993 ; Noguchi et al. 1994 ; D'Erchia et al. 1996 ; Janke, Xu, and Arnason 1997 ; Reyes, Pesole, and Saccone 1998 ). Perhaps the incongruence between the molecules and morphology is a consequence of the ancient evolutionary history of rodent lineages.
Until recently (Nedbal, Honeycutt, and Schlitter 1996 ; Huchon, Catzeflis, and Douzery 1999, 2000 ), most molecular studies of rodents consisted of limited taxonomic sampling. It is quite clear that any detailed study of rodent molecular phylogenetics and divergence times requires both increased taxonomic sampling and more molecular data. In this study, new nucleotide sequence data from two nuclear genes, one mitochondrial gene, and previously published molecular data were used to address several questions associated with the rodent radiations: (1) Are divergence times for rodent lineages older than suggested by the fossil record? (2) Do genes differ in their ability to resolve phylogenetic relationships among rodent lineages? (3) Is rodent monophyly supported by an increased amount of nucleotide sequences? (4) What is the sister group to the order Rodentia? (5) How does the molecular phylogeny compare with current morphological interpretations of rodent evolution?
Materials and Methods
Specimens and Genes Examined
One mitochondrial gene, 12S ribosomal RNA (rRNA), and three nuclear genes, growth hormone receptor (GHR), breast cancer susceptibility (BRCA1), and von Willebrand factor (vWF), were examined for representatives of 11 mammalian orders and 19 families of rodents (appendix). Although most 12S rRNA sequences were obtained from specimens reported by Nedbal, Honeycutt, and Schlitter (1996) , we extended the previously reported 900-bp sequence to include the entire 12S rRNA gene. In addition, several new species of caviomorph rodents were examined. Sequences of vWF were obtained from Huchon, Catzeflis, and Douzery (1999,2000) . Exon 10 of GHR and exon 11 of BRCA1 were sequenced in this study. BRCA1 was chosen because it had given robust resolution of relationships at varying levels of divergence in previous studies (Teeling et al. 2000; Madsen et al. 2001) and was a long exon (∼3.4 kb) that was easily amplified. GHR was chosen because it appeared to give strong support to relationships among rodents in preliminary analyses and possessed highly conserved sites for primer design at its extreme 5′ and 3′ ends.
Nucleotide Sequencing
All sequences were collected on an ABI 377 automated sequencer (P.E. Biosystems) subsequent to cycle sequencing using Big Dye chemistry and recommendations from the supplier (P.E. Biosystems). The sequences of all primers used for PCR are given in table 1 . PCR conditions for 12S were the same as those described in Nedbal, Honeycutt, and Schlitter (1996) . The tenth, and final, exon of the growth hormone receptor was examined in all of the taxa, and the 11th exon of the breast cancer susceptibility gene, BRCA1, was examined in a subset of those taxa. For GHR and BRCA1, touchdown PCR was used with the following conditions (Don et al. 1991 ): 95°C for 30 s, annealing for 30 s (first cycle at 65°C, with temperature decreased 0.5°C per cycle over 40 cycles), and 72°C for 2 min. GHR and BRCA1 PCR products were purified from 1% low-melting-point agarose gels. All new 12S rRNA, GHR, and BRCA1 sequences (appendix) and alignments (EMBL accession numbers ALIGN_000001–ALIGN_000004) were deposited in public databases.
Data Analysis
Sequences of the 12S rRNA gene were multiply aligned using both CLUSTAL W (Thompson, Higgins, and Gibson 1994 ) and visual inspection with reference to the secondary-structure model of mammalian 12S rRNA (Springer and Douzery 1996 ). Several regions revealed large numbers of indels among taxa, making alignment difficult. These ambiguous regions were excluded from further phylogenetic analyses. Indels, regardless of length, were treated as missing, with a presence/absence matrix appended to the end of the nucleotide sequence matrix (as per Nedbal, Honeycutt, and Schlitter 1996 ). Continuous indels of more than one base were treated as a single event in the presence/absence matrix. Alignment of GHR and BRCA1 were performed by eye, and sequences of vWF were aligned independently of that reported by Huchon, Catzeflis, and Douzery (1999) .
Molecular phylogenies were derived using PAUP*, version 4.0b2 (Swofford 1999 ), and both maximum-parsimony (MP) and maximum-likelihood (ML) analyses. In all cases, a representative of the mammalian infraclass Metatheria was designated as an outgroup. Initially, equal weighting was used for MP analyses. If more than one equally parsimonious topology resulted from equal weighting of sites, individual sites were reweighted in proportion to their rescaled consistency index (Farris 1969 ). MP analysis was performed for BRCA1 with the branch-and-bound search option. For GHR and 12S, heuristic searches were performed with at least 20 random taxon additions and tree bisection-reconnection branch swapping. Nonparametric bootstrap analyses (Felsenstein 1985 ) were performed with 100 replications, each involving 10 random taxon additions and tree bisection-reconnection branch swapping. ML analyses proceeded in an iterative manner (Sullivan and Swofford 1997 ). In all cases, empirically determined nucleotide frequencies and the model of Hasegawa, Kishino, and Yano (1985) were used. Initial estimates of the transition/transversion ratio and the shape parameter of a discrete gamma distribution (eight rate categories), describing the heterogeneity of rates among sites, were based on an MP phylogeny. For multiple equally parsimonious topologies, parameter estimates were based on the topology with the higher likelihood. After an ML search, parameters were reestimated, and a new search was performed. This procedure was repeated until the topology and parameter estimates stabilized. In every case, the values became stable after the second likelihood search. If feasible, nonparametric bootstrap analyses were performed under a likelihood criterion. Otherwise, rough indications of nodal support were derived from quartet puzzling (Strimmer and von Haeseler 1996 ). When determining the statistical significance of the difference in tree length or likelihood between competing phylogenetic hypotheses, the tests of Templeton (1983 ; parsimony) and Kishino and Hasegawa (1989 ; likelihood) were employed.
Four independent molecular data sets were considered in this study (appendix). Because the question of “combinability” of data sets has not been resolved, two extreme approaches were taken. According to the incongruence length difference test (ILD test; Farris et al. 1995 ), GHR, 12S, and vWF are significantly incongruent with each other (P < 0.05). Therefore, each gene was analyzed independently, and individually well supported nodes were considered. However, it still has not been demonstrated that a combination of genes deemed to be “incongruent” results in degradation of phylogenetic accuracy compared with separate analyses (our results indicate the opposite; see below). Therefore, a combined MP analysis of 12S, GHR, and vWF was performed for comparison with the separate analyses. Such a comparison may allow for a maximal exploration of the explanatory power of the available data (Larson 1994 ). An ML analysis of the concatenated sequences was not computationally feasible, because when parameters unique to each gene were implemented, the analysis using the Baseml 1.3 program of Yang (1997) was extremely slow. Tests for heterogeneity in the proportion of nucleotide substitutions among codon sites were performed with the program Monte Carlo RxC 2.21 (B. Engels, personal communication), which determines an empirical P value via the examination of random tables with the same marginal sums generated by a Monte Carlo procedure.
Results and Discussion
Patterns of Sequence Evolution
Neither GHR nor 12S exhibited significant heterogeneity in base composition (chi-square, P > 0.05). Both BRCA1 and vWF did exhibit significant heterogeneity in base composition across the entire data sets (P < 0.05). Mus, Rattus, and Meriones BRCA1 sequences have an excess of C nucleotides (20.9% versus 17.9%) and a deficit of A nucleotides (33.0% vs. 36.7%) relative to other species. These three taxa formed a clade in analyses of GHR and BRCA1, but not in analyses of 12S. Therefore, it seems likely that the reason for these taxa clustering in the BRCA1 analyses is common ancestry. Logdet distances presumably remove the influence of base compositional effects. A neighbor-joining tree using logdet distances also clustered Mus, Rattus, and Meriones. This diminishes the argument that base composition bias has created a spurious clade. After a subjective examination of base frequencies, removal of two AT-rich (Macropus and Cavia) and two GC-rich (Bradypus and Lepus) taxa rendered the heterogeneity of base composition for vWF nonsignificant (P > 0.05). None of these taxa tended to cluster phylogenetically, and there was no obvious misleading trend from base composition bias.
Each gene exhibited a unique pattern of evolution. Among the three protein-coding genes, the proportion of substitutions among the three codon positions (table 2 ) was significantly different (Monte Carlo procedure, P < 0.001). The highest rate of change and the greatest skew in the rates of substitution among sites (α parameter of the gamma distribution) were observed for 12S rRNA. This is not surprising because the mitochondrial genome has a higher rate of evolution than does the nuclear genome in general, and sites in rRNAs fall into two broad categories: double-stranded stems that change rather slowly, and single-stranded loops that appear to have few constraints on the substitutions that are accepted (with the few exceptions of sites involved in codon or tRNA-synthetase recognition). The next highest rates were displayed by GHR and vWF. Overall, vWF exhibited more bias in its substitution process. The transition/transversion ratio was slightly higher than that for GHR, but both were near the typical ratio of about 2:1 observed for most nuclear genes. However, vWF had greater skew in the distribution of substitution rates among sites (αvWF = 0.55 vs. αGHR = 0.96), with a slightly greater majority (60% vs. 53%) of substitutions occurring at third codon positions. Interestingly, BRCA1 had a rather low rate of substitution and had very little skew in rates of substitution (α = 2.7). However, this may be somewhat biased by the small number of sequences and may change as taxonomic sampling becomes denser. There is almost an equal distribution in the number of substitutions among the three codon positions in BRCA1.
Rodent Monophyly and Glires
There are two major unresolved problems in rodent phylogenetics: the question of rodent monophyly, and the determination of the sister group to rodents. In both cases, many molecular studies are incongruent with morphological and paleontological data. For instance, despite numerous morphological synapomorphies for the order Rodentia (Luckett and Hartenberger 1985 ), the monophyly of rodents is ambiguous based on molecular data, with some studies contradicting monophyly (Graur, Hide, and Li 1991 ; Graur et al. 1992 ; Ma et al. 1993 ; Wolf et al. 1993 ; Noguchi et al. 1994 ; D'Erchia et al. 1996 ; Janke, Xu, and Arnason 1997 ; Reyes, Pesole, and Saccone 1998 ) and others supporting it (Hasegawa et al. 1992 ; Honeycutt and Adkins 1993 ; Martignetti and Brosius 1993 ; Kuma and Miyata 1994 ; Frye and Hedges 1995 ; Porter, Goodman, and Stanhope 1996 ; Cao et al. 1997 ; Huchon, Catzeflis, and Douzery 1999 ). In addition, morphological, paleontological, and some molecular data support a sister group relationship between rodents and rabbits (order Lagomorpha), with both orders classified in the superorder Glires (Novacek 1992 ; Meng et al. 1994 ; Shoshani and McKenna 1998 ; Huchon, Catzeflis, and Douzery 1999 ; Liu and Miyamoto 1999 ; Madsen et al. 2001 ). Nevertheless, several recent molecular studies do not support the monophyly of Glires (Graur, Duret, and Guoy 1996 ; Janke, Xu, and Arnason 1997 ; Stanhope et al. 1998 ; Springer et al. 1999 ), and morphological traits have been proposed to support a close relationship between rodents and either primates (Wood 1962 ) or insectivores (Szalay 1985 ).
Both separate and combined analyses provided mixed results regarding rodent monophyly and a sister group relationship between Rodentia and Lagomorpha (superorder Glires). An MP analysis of GHR provided strong support (90% bootstrap) for a clade containing rodents and lagomorphs, yet suggested rodent paraphyly relative to lagomorphs (fig. 1a ). ML results for GHR supported rodent monophyly (54% quartet puzzling), yet only weakly supported (18% quartet puzzling) the monophyly of Glires (fig. 1b ). Although these results are similar to those observed by Huchon, Catzeflis, and Douzery (1999) , trees that do not support either rodent monophyly or the monophyly of Glires (e.g., MP trees one step longer and ML trees with slightly lower likelihood values) are not significantly worse by the criteria of either Templeton (1983) or Kishino and Hasegawa (1989) .
All analyses of 12S alone revealed a polyphyletic Rodentia (fig. 2 ). Both MP and ML analyses of 12S rRNA separate rodents into four groups, and both the compositions and the placements of these groups differ between analyses. This result is similar to that of Nedbal, Honeycutt, and Schlitter (1996) , and like this previous study, our reanalysis revealed low bootstrap values for deeper nodes. Therefore, rodent polyphyly, at least in terms of the 12S data, may be the consequence of this particular gene being of limited usefulness for comparisons of more divergent mammalian lineages (McNiff and Allard 1998 ).
BRCA1 provided extremely strong support for the monophyly of sciurognaths (fig. 3a ), as well as clades within Rodentia. Trees revealing rodent polyphyly were significantly worse (P < 0.01) under both parsimony and likelihood. This gene shows potential for more detailed studies of both rodent relationships and the placement of rodent lineages relative to other lineages of eutherian mammals. Any future study of BRCA1 should include hystricognath rodents (e.g., guinea pig and relatives), as the primary question of rodent monophyly was raised based on the placement of the guinea pig (Graur, Hide, and Li 1991 ; Graur et al. 1992 ; Ma et al. 1993 ).
The data presented in this paper plus previously published information on vWF (Huchon, Catzeflis, and Douzery 2000 ) provide an opportunity for a combined analysis of GHR, 12S, and vWF. This analysis included nine orders of mammals, and an MP analysis resulted in trees supporting rodent monophyly and nonmonophyly that differed by five steps (6,860 vs. 6,865). These trees were not significantly different. The combined analysis did not support Glires, and two trees three steps longer that were consistent with Glires were not significantly different (P > 0.05).
Previous molecular studies challenging rodent monophyly have included only two to four rodents, and it is possible that the inclusion of additional taxa (e.g., both rodents and nonrodents) would change these results. For example, Reyes, Pesole, and Saccone (1998) found that rodent polyphyly was the optimal result with available data from complete mitochondrial genomes. Nevertheless, a reanalysis of additional nonrodent mtDNA sequences produced optimal phylogenies with a monophyletic Rodentia in some analyses (personal observation).
The level of support among the analyses for a monophyletic Rodentia may be instructive. 12S rRNA did not support rodent monophyly at all. It is the most rapidly evolving of the four genes and has the greatest skew in rates of substitution among sites. GHR and vWF have intermediate rates of evolution and skew in the distribution of rates and gave moderate support for rodent monophyly (Huchon, Catzeflis, and Douzery 2000 ; fig. 1 ). BRCA1, on the other hand, has the lowest rate of evolution and very little skew in substitution rates. Some rodent lineages are quite ancient, dating to the early Eocene (Korth 1994 ). Given the antiquity of these lineages and a generalized increase in the rate of nucleotide substitution in rodents (Wu and Li 1985 ), it is possible that genes exhibiting rates of substitution or biases in the distribution of rates among sites that are near those of GHR and vWF may be accumulating sufficient homoplasy to begin to weaken the phylogenetic signal. In contrast, BRCA1 exhibits a low and fairly homogeneous distribution of rates among sites. This decrease in the amount of homoplasy may explain the unusually strong support BRCA1 gives to rodent monophyly and relationships within rodents. If this is the case, BRCA1 has great promise for rodent systematics and for superordinal relationships among mammals. Future studies of higher-level mammalian systematics should focus on genes with evolutionary dynamics similar to those of BRCA1.
Hystricognaths
Although the separate and combined analyses provided mixed results in terms of diagnosing the monophyly of either Glires or Rodentia, these data did provide strong support for specific rodent associations that have been debated extensively. For instance, the sister group to the suborder Hystricognathi (guinea pig and relatives) has been a long-standing problem in rodent phylogenetics. Although a large number of morphological and molecular traits suggest a sister group relationship between the family Ctenodactylidae and Hystricognathi (George 1985 ; Lavocat and Parent 1985 ; Luckett 1985 ; Sahni 1985 ; Wood 1985 ; Flynn, Jacobs, and Cheema 1986 ; Jaeger 1988 ; Beintema et al. 1991 ; Martin 1993 ; Huchon, Catzeflis, and Douzery 2000 ), others disagree (Hartenberger 1985 ).
Among the rodents in this study, Ctenodactylus and Pedetes were the only hystricomorphous and sciurognathous taxa. All hystricognaths are ancestrally hystricomorphous. GHR sequences produced very high support values (100% bootstrap and 95% quartet puzzling) for a sister group relationship between Ctenodactylus and hystricognaths, but trees that were contradictory to this sister group relationship were not significantly different under parsimony or likelihood (P > 0.05). Results from 12S were consistent with GHR in an unorthodox manner. According to 12S, Ctenodactylus clustered within Hystricognathi, and this broad clade received weak support. The nesting of Ctenodactylus within hystricognaths is not consistent with morphological data and possibly can be ascribed to homoplasy. In any case, the results for Ctenodactylus were not consistent with Hartenberger's (1985) suggestion that ctenodactyloids (along with geomyoids) represent the earliest branch among living rodents.
The placement of Pedetes was ambiguous based on single-gene and combined analyses. GHR and the combined analysis grouped Pedetes sister to myomorphs (muroids and dipodoids), and 12S clustered Pedetes with geomyoids, in agreement with previous results from 12S (Matthee and Robinson 1997 ). However, bootstrap and quartet puzzling values for those placements were low. BRCA1 placed Pedetes closer to muroids than to Sciurus, Aplodontia, and Graphiurus with strong bootstrap and quartet puzzling support (+19 steps, P < 0.002; ΔL = 9.3, P = 0.07). This supports Luckett's (1985) argument that there is not a particularly close relationship between Pedetes and sciuromorphous rodents as has sometimes been suggested (Fischer and Mossman 1969 ; Otiang'a-Owiti, Oduor-Okelo, and Gombe 1992 ). In general, the weight of evidence from morphology and molecules supports a close relationship of Ctenodactylus with hystricognaths but rejects a close relationship of Pedetes with those taxa.
There are two primary hypotheses for the origin of the hystricognath radiation. Hystricognaths may have originated in North America and dispersed into South America and the Old World (Wood 1985 ), or they may have an Old World origin with caviomorphs originating from African phiomorphs (Lavocat 1969 ). Both GHR and the combined analysis of GHR, 12S, and vWF support Lavocat's (1969) hypothesis in that caviomorphs are a monophyletic clade originating within a paraphyletic Phiomorpha. However, phylogenies contradicting the monophyly of caviomorphs are not, or are only marginally, significant under parsimony and likelihood (P ≥ 0.05).
In vWF analyses (Huchon, Catzeflis, and Douzery 2000 ), Thryonomys/Bathyergus was the basal hystricognath clade, with Trichys sister to caviomorphs. GHR reverses this arrangement in that Hystrix was the basal hystricognath and Thryonomys clustered with Heterocephalus. This arrangement was consistent with the hypothesis that bathyergids originated from thryonomyids (Lavocat 1973 ) and with immunological data (Sarich 1985 ). However, there was no significant difference (P > 0.05) from trees six steps longer that placed the Thryonomys/Heterocephalus clade basal among hystricognaths. In a combined analysis of GHR, 12S, and vWF, the hystricid lineage was basal, but a tree only four steps longer that placed the Thryonomys/Heterocephalus lineage basal was not significantly different (P > 0.05). To what extent this can be ascribed to the aberrant evolutionary pattern of Thryonomys (Huchon, Catzeflis, and Douzery 1999 ) or to homoplasy in the GHR data is unclear. The issue remains unresolved from a molecular perspective.
Dipodoidea and Muroidea
Numerous morphological and molecular studies (Klingener 1964 ; Bugge 1985 ; Luckett and Hartenberger 1985 ; Nedbal, Honeycutt, and Schlitter 1996 ; Huchon, Catzeflis, and Douzery 1999 ; Michaux and Catzeflis 2000 ) support a sister group relationship between muroid and dipodoid rodents. GHR alone and combined GHR, 12S, and vWF sequences provided strong support for this relationship (P < 0.02). For the combined analysis, all trees within 30 steps of the most parsimonious tree that separated muroid and dipodoid rodents either rooted the tree on that branch or rendered rodents paraphyletic with three separate lineages. Both of these scenarios are extremely discordant with other molecular data and with morphology, indicating that the separation of muroids and dipodoids is very unlikely based on combined GHR, 12S, and vWF sequences. For 12S, four trees three steps longer than the most parsimonious tree that placed Pedetes between Jaculus and muroids were not significantly different from the shortest tree (P > 0.05). Therefore, the addition of GHR sequences greatly bolstered previously weak molecular support for Myodonta (Muroidea and Dipodoidea).
Castor and Geomyoids
There are three sciuromorphous lineages of rodents, castorids, sciurids, and geomyoids. GHR analyses placed Castor sister to geomyoids (Geomys, Cratogeomys, and Perognathus) with high bootstrap and puzzling support values but separated Sciurus from these two groups. Nevertheless, trees that separated Castor from the geomyoids were not significantly different (+4 steps, ΔL = 5.2; P > 0.05). Although Sciuromorpha frequently is not regarded as a monophyletic taxon (Dawson and Krishtalka 1984 ; Bugge 1985 ; Hartenberger 1985 ; Luckett 1985 ; Wahlert 1985 ; Wood 1985 ), a sister group relationship between castorids and geomyoids is a novel finding. However, this would be consistent with a North American origin for these two groups (Vianey-Liaud 1985 ). A monophyletic Sciuromorpha was only slightly worse and was not significantly different (+2 steps, ΔL = 8.4, P > 0.05).
Aplodontia, Sciurus, and Graphiurus
A clade containing Aplodontia (protrogomorphous), Sciurus (sciuromorphous), and Graphiurus (myomorphous) appears in analyses of GHR, 12S, BRCA1, and vWF (Huchon, Catzeflis, and Douzery 1999 ; but see Huchon, Catzeflis, and Douzery 2000 ) and in combined analyses. These three taxa share a number of basicranial traits that support their close relationship (Lavocat and Parent 1985 ; Vianey-Liaud 1985 ; Wahlert 1985 ), and dormice and sciurids are united by B1-dID SINE sequences (Aplodontia was not examined; Kramerov, Vassetzky, and Serdobova 1999 ). The support for a glirid/aplodontid/scurid clade was not overwhelming in that the BRCA1 tree separating Graphiurus from Sciurus and Aplodontia was 21 steps longer and significantly different (P = 0.001), but trees that broke up this clade were not significantly different for GHR, 12S, or the combined analysis (P > 0.05). However, the frequent occurrence of this clade in molecular analyses suggests that the association may be real but difficult to support, perhaps due to a short period of common ancestry.
Relative Resolving Power of GHR, 12S, and vWF
Four genes were applied to rodent relationships in this paper. The “combinability” of three of these genes (GHR, 12S, and vWF) was assessed, and they were found to be significantly incongruent (ILD test, P < 0.05). Nevertheless, a concatenation of those three genes produced a phylogeny that was reasonable from a morphological and a paleontological standpoint and was supported with extremely high bootstrap proportions. In the presence of the incongruence, how much confidence can be placed in the total-molecular-evidence tree? Another way of putting this question is to ask if the phylogenetic signal is evenly distributed among the three genes or if one or two of the genes contain relatively little phylogenetic content. If the phylogenetic evidence is more or less evenly split among the genes, then each gene should be viewed as an equally strong hypothesis of relationships, and the separate analyses should be given the greatest credence. On the other hand, if one or two genes are weak, then either the combined result or the relationships constructed from one gene should be given the greatest credence.
Table 4 summarizes a comparison of the optimal parsimony topologies for each gene and for the combined analysis. For the combined data set, the tree of figure 3b was significantly different from any of the single-gene trees. Similarly, the optimal tree for GHR alone was significantly different from the combined data tree or the best trees for 12S or vWF alone. Interestingly, for 12S and vWF there was not a significant difference between the combined data tree and the tree optimal for either of those genes alone. For vWF, there was also a lack of significance for the difference between the vWF tree and the GHR tree. Which is the “best” phylogenetic hypothesis? We feel that the phylogeny of figure 3b is the best provisional hypothesis of rodent relationships because it is the one most compatible with the three individual genes (only GHR exhibits a significant difference), and it retains the monophyly of rodents, consistent with morphological data and some other molecular studies (Hasegawa et al. 1992 ; Novacek 1992 ; Honeycutt and Adkins 1993 ; Martignetti and Brosius 1993 ; Kuma and Miyata 1994 ; Meng et al. 1994 ; Frye and Hedges 1995 ; Porter, Goodman, and Stanhope 1996 ; Cao et al. 1997 ; Shoshani and McKenna 1998 ; Huchon, Catzeflis, and Douzery 1999 ; Liu and Miyamoto 1999 ).
Does the “phylogenetic signal” reside equally in the three genes? We took two approaches to address this question (table 4 ). First, we determined if one gene was more effective at distinguishing among alternative phylogenetic hypotheses. GHR appeared to have the greatest power in that it was the only one of the three genes that exhibited a significant difference in all of the comparisons of table 4 . This might indicate that a majority of the phylogenetic signal resides in GHR and that the other two genes have relatively little signal that differentiates among competing hypotheses. However, one must also consider the alternative hypothesis that GHR exhibits a pattern of evolution that biases analyses of the gene, such as nonstationary base composition or “long-branch attraction” (Felsenstein 1978 ). If so, this bias is not apparent from our consideration of base composition or rates of substitution (fig. 4 ). Second, we investigated where each gene provided the greatest support for individual nodes and whether that support decreased or increased in the combined analysis. Among the four trees considered in table 4 , the highest overall bootstrap proportions were found for the combined analysis. Relative to these bootstrap values, GHR exhibited the smallest reduction in overall nodal support with the average reduction in bootstrap proportions being −1.4. Indeed, of the 12 nodes that exhibited a difference in bootstrap proportions between GHR and the combined data set, 5 exhibited higher bootstrap proportions with GHR alone. Both vWF and 12S alone uniformly exhibited lower bootstrap proportions than those for the combined analysis. All of these lines of evidence indicate that most of the “phylogenetic signal” resides in the GHR data set alone. Why might GHR contain more “signal” than do either 12S or vWF? Divergences among some lineages examined in this study date at least to the Paleocene. Therefore, there is substantial potential for accumulation of homoplasy over this extensive period of divergence. GHR exhibited a significantly lower rate of substitution among parsimony-informative sites (table 4 ). As a result, GHR may accumulate less homoplasy, and this possibility is supported by the fact that the consistency index for the optimal GHR tree was the highest among the three genes. The hypothesis that a lower rate of substitution results in an increased amount of phylogenetic signal could be tested by collecting sequence data for the same taxa and from a more slowly evolving gene (i.e., BRCA1) than GHR.
Given the weaker performance of vWF and 12S relative to GHR, would it be better to disregard these less informative genes? This does not seem to be the case. Although vWF and 12S exhibited greater average reductions in bootstrap proportions than did GHR compared with the combined analysis, the bootstrap proportions were on average highest for the combined analysis. This indicates that there are some sites in both vWF and 12S that are consistent with the phylogeny of figure 3b. Therefore, as is widely postulated, it is possible that a combined analysis allows for cryptic signal to emerge.
Unequal Rates of Change and Dating Rodent Divergences
Dates of divergence among mammals are highly controversial. Kumar and Hedges (1998) recently estimated divergence dates for several vertebrate groups. For most mammalian taxa, particularly rodents, these dates are much earlier than those estimated from paleontological data. For example, Kumar and Hedges (1998) calculated a divergence date of 40.7 MYA and Huchon, Catzeflis, and Douzery (2000) calculated a date of 41.9 MYA (Equus-Ceratotherium calibration) for Mus and Rattus, whereas fossil data indicate a date no later than 14 MYA (Jacobs and Pilbeam 1980 ) and earlier molecular data suggested dates in the range of 5–30 MYA (Wilson, Carlson, and White 1977 ; Sarich 1985 ). Kumar and Hedges (1998) based their dates on a large number of proteins, a molecular clock, and a mammal-versus-bird calibration at 310 MYA. Although Kumar and Hedges (1998) tested for a molecular clock, the dates concerning rodents are of concern, because rodents are known to demonstrate an acceleration of molecular evolutionary rates (Wu and Li 1985 ). Indeed, exactly this pattern was seen for GHR (fig. 4 ). The rate of evolution of GHR is very heterogeneous among mammals, with the highest rates of change observed among rodents, and in a likelihood ratio test a molecular clock was rejected (without clock, −ln = 1,2507.5; with clock, −ln = 12,742.1; P < 0.001). Huchon, Catzeflis, and Douzery (2000) based their dates on either linearized trees or quartet dating, often using a fossil-based rodent divergence date for calibration. The inclusion of a rodent calibration point to estimate rodent divergence dates introduces a confounding influence in that a mistake in the calibration will have a uniformly inflating or deflating influence depending on whether the true date was under- or overestimated. We took the approach of calibrating molecular evolutionary rates based on nonrodent divergences that were highly concordant between paleontological and molecular studies followed by explicitly accounting for unequal rates of change among rodents.
A detailed examination of relative rates (Mindell and Honeycutt 1990 ) of change (fig. 4 ) demonstrates that Monodelphis, artiodactyls, and primates are evolving at clocklike rates but that rodents are evolving at a significantly faster rate. Therefore, it is not feasible to apply a uniform molecular clock to estimate dates of divergence for all mammalian orders. However, one can take advantage of the fact that primates, artiodactyls, and Monodelphis exhibit clocklike rates of change to estimate the absolute rate of change in rodents. Fossil and molecular data concur on two relevant divergence dates: that of apes versus Old World monkeys (i.e., Homo and Macaca; ∼23 MYA) and that of ruminants versus suids (i.e., Bos and Sus; ∼65 MYA). Using a Poisson correction of amino acid divergence, the distance between Homo and Macaca is 0.0471 (0.0471/2(23) = 0.001/Myr), and the distance between Bos and Sus is 0.172 (0.172/2(65) = 0.0013/Myr). The average of these two rates is 0.00115/Myr.
By assigning branch lengths to four-taxon trees (fig. 4b ; Monodelphis, primates, and two ingroup taxa), one can establish the relative rate of change of GHR among rodent lineages and assign dates to their divergences (table 3 ). These dates show concordance with fossil-based dates and a recent analysis of 87 separate genes (W.-H. Li, personal communication), whereas the dates of Kumar and Hedges (1998) do not. This is surprising, because our method for assigning dates implements a similar strategy to the one employed by Kumar and Hedges (1998) , in that both use a “lineage-specific method.” Both methods underestimate the real rate of evolution in rodents, because the period of rodent common ancestry preceding the rate acceleration is included in the estimation of evolutionary rate. However, our use of a mammal reference (primates) should underestimate the rate acceleration less drastically than Kumar and Hedges' (1998) use of a bird outgroup because of the shorter period of common ancestry following the primate-rodent divergence than that following the bird-rodent divergence.
A particularly interesting difference between our dates and those of Kumar and Hedges (1998) involves the split between Mus and Rattus, dated by us at 23 MYA. This is only slightly older than the paleontological date and well in line with previous molecule-based dates. The divergence dates for cricetids and gerbillids are older than the middle to early Miocene dates suggested by Flynn, Jacobs, and Cheema (1986) but are reasonable if a significant proportion of the muroid record is missing since their origin approximately 36 MYA. The dates suggested for the divergences between murids and cricetids and gerbillids are quite consistent with albumin immunology (Sarich 1985 ) but are only about half those suggested by Kumar and Hedges (1998) . It may be meaningful to note that the rate of GHR protein evolution in muroid rodents is about twice that observed in primates and artiodactyls. Aplodontids, geomyoids, and possibly dipodoids possess fossil records dating back to the Eocene (Bugge 1985 ; Vianey-Liaud 1985 ), and therefore their divergences from sciurids, castorids, and muroids, respectively, in the Paleocene seem quite reasonable. We date the divergence of hystricognaths and sciurognaths in the Late Cretaceous shortly before the K/T boundary at about 75 MYA, a much later date than the Early Cretaceous date of 109–112 MYA proposed by Kumar and Hedges (1998) .
Functional Changes in GHR
The action of the growth hormone–growth hormone receptor complex has been studied in a diversity of mammals, including Mus, Rattus, and Cavia (the guinea pig). Remarkably, the guinea pig is completely unresponsive to both its own and exogenous growth hormone, and its growth is totally unaffected by the absence of growth hormone (Mitchell, Guillemin, and Selye 1954 ). Despite this finding, it is clear that the guinea pig secretes a functional growth hormone, because it has somatotropic action in hypophysectomized Rattus (Knobil and Greep 1959 ). The extracellular domain of GHR binds growth hormone of other species, indicating that the lack of growth hormone responsiveness does not involve a reduction in binding affinity (Amit et al. 1992 ; Ymer, Stevenson, and Herington 1997 ). On this basis, it has been suggested that the lack of effect of growth hormone in Cavia is due to a defect in postreceptor signaling (Harvey and Fraser 1992 ; Keightley and Fuller 1996 ). We sequenced exon 10, which encodes the entire intracellular domain of the growth hormone receptor in a large number of mammals. As was found previously (Adkins, Vandeberg, and Li 2000), the intracellular domain of GHR of Cavia and of other hystricognath rodents is not unusually divergent in amino acid sequence (fig. 4 ). Growth hormone and the extracellular domain of GHR of Cavia are also highly conservative (Adkins, Vandeberg, and Li 2000). Therefore, it seems likely that the lack of responsiveness to growth hormone displayed by Cavia is due to a defect in intermediate messengers, such as STAT5, JAK2, or the growth-promoting insulin-like growth factor I, whose secretion is stimulated by growth hormone. Study of these proteins in Cavia might elucidate the abnormal response of the guinea pig to growth hormone. In this context, it is fascinating to note that Cavia has 10 times the normal level of insulin in its circulation and that its insulin molecule possesses growth-promoting activity (King and Kahn 1981 ). Is it possible that insulin has replaced the normal physiological function of growth hormone in the guinea pig, perhaps through interaction with the receptor for insulin-like growth factor I.
David Irwin, Reviewing Editor
Keywords: Rodentia molecular phylogeny divergence dates
Address for correspondence and reprints: Ronald Adkins, Department of Biology, 221 Morrill, University of Massachusetts, Amherst, Massachusetts 01002. radkins@bio.umass.edu.
Table 3 Determination of Relative Rates of GHR Evolution Between Rodents and Primates and Assignment of Divergence Dates to Rodent Speciation Events
Table 3 Determination of Relative Rates of GHR Evolution Between Rodents and Primates and Assignment of Divergence Dates to Rodent Speciation Events
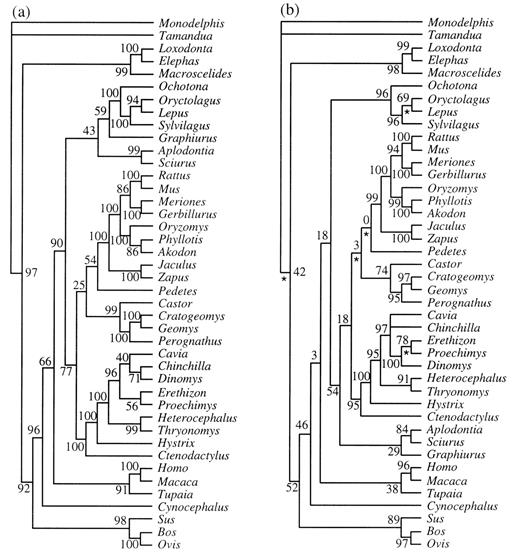
Fig. 1.—a, Maximum-parsimony phylogeny of GHR sequences with individual sites reweighted according to their rescaled consistency index. The reweighting was based on 18 initial equally weighted parsimony trees of 2,594 steps. The consistency index, excluding uninformative characters, is 0.43, and the retention index is 0.59. Nonparametric bootstrap partition frequencies are listed at each node. b, Maximum-likelihood (−ln likelihood = 13,155.0) phylogeny of GHR sequences. Quartet puzzling values are listed at each node. Asterisks indicate branches whose lengths are not significantly different from 0 based on a likelihood ratio test
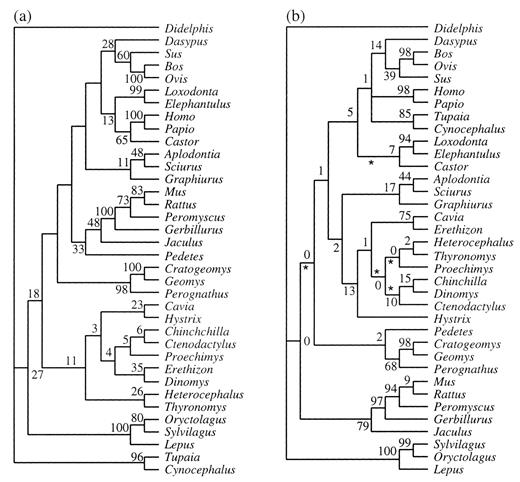
Fig. 2.—a, Maximum-parsimony phylogeny (2,556 steps) of 12S sequences (consistency index = 0.31, retention index = 0.39). Nonparametric bootstrap partition frequencies are listed at each node. b, Maximum-likelihood (−ln likelihood = 10,881.4) phylogeny of 12S sequences. Quartet puzzling values are listed at each node. Asterisks indicate branches whose lengths are not significantly different from 0
![Fig. 3.—a, Maximum-parsimony (3,937 steps, consistency index [CI] = 0.63 and retention index [RI] = 0.70) and maximum-likelihood (−ln likelihood = 22,720.6) phylogenies of BRCA1 sequences. At each node, nonparametric bootstrap partition frequencies for maximum parsimony (above) and for maximum likelihood (below) are given. Asterisks indicate branches whose lengths are not significantly different from 0. b, Maximum-parsimony phylogeny (6,860 steps, CI = 0.40 and RI = 0.40) for concatenated GHR, 12S, and vWF sequences. Nonparametric bootstrap partition frequencies are listed at each node](https://oup.silverchair-cdn.com/oup/backfile/Content_public/Journal/mbe/18/5/10.1093_oxfordjournals.molbev.a003860/4/m_mbev-18-05-09-f03.jpeg?Expires=1716335363&Signature=ygSBsfwMdbXzOmfm~6vafY-N19mz2g3fZpA2H9uZpzUOoKDm3-NQx3F7CumjB-hbz-lfpegCsfZ0STmL9hpIvplsFZfXCRtxpHBXUTIHbLJrLZ-p9-7Nl6tI93w7alHVdvAxX0NBfLr9oHRBt0vd5qdnqM~2ffdBFh7Z~1jJME2vsfbTp9gDXaMOuBGQ3WYNHtYj0kH1~VVaAjkWKRZP7Ak~561iTXzolc6htx5ccqx2yvo4cac4v-XfyWlSITaohyyLZfhDYul3~9DoMT~G-zrpIvBTetaqIAp1mVKn52AqxEIMaf8Q~lXANNALNZ6N4pCHGn8m2jaZtkKKt1LRRQ__&Key-Pair-Id=APKAIE5G5CRDK6RD3PGA)
Fig. 3.—a, Maximum-parsimony (3,937 steps, consistency index [CI] = 0.63 and retention index [RI] = 0.70) and maximum-likelihood (−ln likelihood = 22,720.6) phylogenies of BRCA1 sequences. At each node, nonparametric bootstrap partition frequencies for maximum parsimony (above) and for maximum likelihood (below) are given. Asterisks indicate branches whose lengths are not significantly different from 0. b, Maximum-parsimony phylogeny (6,860 steps, CI = 0.40 and RI = 0.40) for concatenated GHR, 12S, and vWF sequences. Nonparametric bootstrap partition frequencies are listed at each node
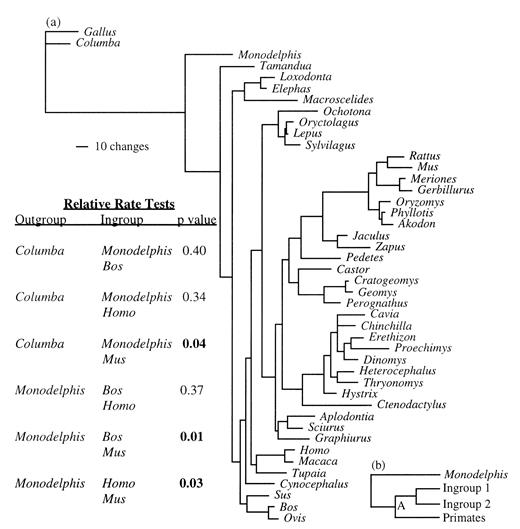
Fig. 4.—a, Phylogram illustrating the level of sequence divergence of GHR among eutherian mammals. Most orders of mammals exhibit similar rates of amino acid replacement, except rodents, in which GHR is evolving at an accelerated rate, as demonstrated by the relative-rate test of Mindell and Honeycutt (1990). b, The phylogeny upon which Poisson-corrected amino acid divergences of Monodelphis, primates, and two rodent ingroup taxa were plotted by the method of Fitch and Margoliash (1967)
We wish to thank the many individuals and institutions that generously shared samples with us: Mark Springer (Ochotona), the Carnegie Museum (Sylvilagus), the Royal Ontario Museum (Tamandua), Brookfield Zoo (Loxodonta), the Detroit Zoological Institute (Elephas), Graeme Wistow (Macroscelides), Jon Kaas (Tupaia), John Vandeberg (Monodelphis), Robert Baker (the Museum at Texas Tech University), and Terry Yates (Museum of the Southwest, University of New Mexico). The mitochondrial genome of the guinea pig is not present in GenBank and was kindly provided by Cecilia Saccone. We also express our gratitude to Bill Engels (Genetics Department, University of Wisconsin) for allowing us to use his software. This research was partially supported by a Faculty Research Grant from the University of Massachusetts to R.M.A. and a National Science Foundation grant to R.L.H. (DEB 9615163).
literature cited
Adkins, R. M., J. Vandeberg, and W.-H. Li.
Amit, T., Z. Hochberg, M. J. Waters, and R. J. Barkey.
Beintema, J. J., K. Rodewald, G. Braunitzer, J. Czelusniak, and M. Goodman.
Bugge, J.
Cao, Y., J. Adachi, T. Yano, and M. Hasegawa.
Dawson, M. R., and L. Krishtalka.
D'Erchia, A. M., C. Gissi, G. Pesole, C. Saccone, and U. Arnason.
Don, R. H., P. T. Cox, B. J. Wainwright, K. Baker, and J. S. Mattick.
Farris, J. S.
Farris, J. S., M. Kallersjo, A. G. Kluge, and C. Bult.
Felsenstein, J.
Fischer, T. V., and H. W. Mossman.
Flynn, L. J., L. L. Jacobs, and I. U. Cheema.
Foote, M., J. P. Hunter, C. M. Janis, and J. J. Sepkoski Jr.
Frye, M. S., and S. B. Hedges.
George, W.
Graur, D., L. Duret, and M. Guoy.
Graur, D., W. A. Hide, A. Zharkikh, and W.-H. Li.
Hartenberger, J.-L.
Harvey, S., and R. A. Fraser.
Hasegawa, M., H. Kishino, and T. Yano.
Honeycutt, R. L., and R. M. Adkins.
Huchon, D., F. M. Catzeflis, and E. J. P. Douzery.
———.
Jacobs, L. L., and D. Pilbeam.
Jaeger, J. J.
Janke, A., X. Xu, and U. Arnason.
Keightley, M.-C., and P. J. Fuller.
King, G. L., and C. R. Kahn.
Kishino, H., and M. Hasegawa.
Klingener, D.
Knobil, E., and R. O. Greep.
Kramerov, D., N. Vassetzky, and I. Serdobova.
Kuma, K. I., and T. Miyata.
Kumar, S., and S. B. Hedges.
Larson, A.
Lavocat, R.
———.
Lavocat, R., and J.-P. Parent.
Liu, F.-G., and M. M. Miyamoto.
Luckett, W. P.
Luckett, W. P., and J.-L. Hartenberger.
Ma, D.-P., A. Zharkikh, D. Graur, J. L. Vanderberg, and W.-H. Li.
McNiff, B. E., and M. W. Allard.
Madsen, O., M. Scally, C. J. Douady, D. J. Kao, R. W. DeBry, R. Adkins, H. M. Amrine, M. J. Stanhope, W. W. de Jong, and M. S. Springer.
Martignetti, J. A., and J. Brosius.
Martin, T.
Matthee, C. A., and T. J. Robinson.
Meng, J., A. R. Wyss, M. R. Dawson, and R. Zhai.
Michaux, J., and F. Catzeflis.
Mindell, D. P., and R. L. Honeycutt.
Mitchell, M. L., R. Guillemin, and H. Selye.
Nedbal, M. A., R. L. Honeycutt, and D. A. Schlitter.
Noguchi, T., S. Fujiwara, S. Hayashi, and H. Sakuraba.
Novacek, M. J.
Otiang'a-Owiti, G. E., D. Oduor-Okelo, and S. G. Gombe.
Porter, C. A., M. Goodman, and M. J. Stanhope.
Reyes, A., G. Pesole, and C. Saccone.
Sahni, A.
Sarich, V. M.
Shoshani, J., and M. C. McKenna.
Springer, M. S., H. M. Amrine, A. Burke, and M. J. Stanhope.
Springer, M. S., and E. J. P. Douzery.
Stanhope, M. J., O. Madsen, V. G. Waddell, G. C. Cleven, W. W. de Jong, and M. S. Springer.
Strimmer, K., and A. von Haeseler.
Sullivan, J., and D. L. Swofford.
Swofford, D. L.
Szalay, F. S.
Teeling, E. C., M. Scally, D. J. Kao, M. L. Romagnoli, M. S. Springer, and M. J. Stanhope.
Templeton, A. R.
Thompson, J. D., D. G. Higgins, and T. J. Gibson.
Vianey-Liaud, M.
Wahlert, J. H.
Wilson, A. C., S. S. Carlson, and T. J. White.
Wolf, B. K., K. Reinecke, K. D. Aumann, R. Briglius-Flohe, and L. Flohe.
Wood, A. E.
———.
Wu, C.-I., and W.-H. Li.
Yang, Z.
