
Postmortem T2*- Weighted MRI Imaging of Cortical Iron Reflects Severity of Alzheimer’s Disease
Abstract
The value of iron-based MRI changes for the diagnosis and staging of Alzheimer’s disease (AD) depends on an association between cortical iron accumulation and AD pathology. Therefore, this study determined the cortical distribution pattern of MRI contrast changes in cortical regions selected based on the known distribution pattern of tau pathology and investigated whether MRI contrast changes reflect the underlying AD pathology in the different lobes. T2*-weighted MRI was performed on postmortem cortical tissue of controls, late-onset AD (LOAD), and early-onset AD (EOAD) followed by histology and correlation analyses. Combining ex vivo high-resolution MRI and histopathology revealed that: 1) LOAD and EOAD have a different distribution pattern of AD pathological hallmarks and MRI contrast changes over the cortex, with EOAD showing more severe MRI changes; 2) per lobe, severity of AD pathological hallmarks correlates with iron accumulation, and hence with MRI. Therefore, iron-sensitive MRI sequences allow detection of the cortical distribution pattern of AD pathology ex vivo.
INTRODUCTION
The histopathological hallmarks of Alzheimer’s disease (AD) are cerebral amyloid-β protein (Aβ) and the paired helical filaments of hyperphosphorylated tau protein. During disease progression, both pathologies distribute throughout the brain in characteristic patterns, which are not the same for Aβ and tau. In end stage AD, as described previously, both Aβ plaques and tau tangles are found throughout the cortex [1–3]. However, not all cortical regions are equally affected; the temporal lobe is most affected by both pathologies, whereas the somatomotor and striatal cortex are relatively spared [2]. The staging of tau pathology as proposed by Braak better reflects cognitive impairment and is therefore considered as a more reliable biomarker for disease progression [4].
Although the progression of disease as described by Braak are widely accepted and used, distribution of AD pathology might differ between individuals and certain subtypes of AD [5]. It remains to be proven whether patients with a disease onset before 65 years old, often referred to as early-onset AD (EOAD), and late-onset AD (LOAD) patients show identical distribution patterns. It is already known that autosomal dominant mutations in the PSEN1, PSEN2, or APP genes often results in an earlier disease onset [5–7], but EOAD patients also have a more rapid cognitive decline [8, 9] and a more severe postmortem pathology [10, 11]. In addition, differences in the progression of gray matter (GM) atrophy have been reported, with EOAD patients showing a more widespread atrophy of the cortex, whereas in LOAD patients predominantly the temporal regions are affected [12, 13], suggesting different patterns of atrophy within the AD spectrum.
Apart from amyloid and tau, iron accumulation has received much attention as a putative biomarker and as a modulator of disease progression [14–16]. Recently, we and others showed that high-field (7T) MRI can be used to detect susceptibility-based cortical contrast changes, which are caused by differences in iron accumulation [17–20]. Susceptibility differences have been reported between non-demented healthy controls and AD subjects in vivo [19], with EOAD patients showing an increased cortical phase shift, indicating more iron accumulation, compared to LOAD patients in specific cortical regions [21]. The same technique has been used to show that in subjects with subjective cognitive impairment (SCI), which is associated with future cognitive decline and dementia suggesting that elderly with SCI may be at risk for the development of AD, increased cortical phase shift is associated with a poorer memory performance [22]. Moreover, Ayton et al. recently showed that higher hippocampal susceptibility is associated with more rapid cognitive deterioration in amyloid-positive MCI and AD patients [23].
The value of iron-based MRI changes for the diagnosis and staging of AD depends on an association between cortical iron accumulation and AD pathology. This association was recently confirmed by a postmortem study which showed a high correlation between cortical iron accumulation and the amount of Aβ plaques, tau pathology, and Braak score in the frontal cortex [24]. In another study, we showed that T2*-weighted contrast on postmortem MRI scans correlates with histologically confirmed iron changes. In the frontal cortex, both iron and myelin were found as important contributors to the observed MRI contrast changes, with EOAD patients showing more severe iron accumulation and MRI contrast changes than LOAD patients [17]. These previous studies were limited to the frontal cortex, thus the cortical distribution pattern of iron accumulation and the associated MRI contrast changes over the entire cortex remains unknown.
Therefore, the first objective of this study was to determine the distribution pattern of the observed MRI contrast changes in tissue blocks from different cortical regions selected based on the distribution pattern of tau pathology. Secondly, using both MRI and histology, we correlated the MRI contrast changes with the severity of the AD pathology in each region to investigate whether the observed MRI contrast changes reflect the underlying AD pathology in the different lobes. Finally, as mentioned above, differences between EOAD and LOAD patients in distribution patterns of pathology and cortical iron accumulation have been suggested. Therefore, we compared the cortical distribution patterns in both AD subtypes.
MATERIAL AND METHODS
Study design
To study the cortical distribution pattern of MRI contrast changes in AD, 7T MRI was performed on postmortem brain samples, using tissue blocks from all four cerebral lobes. The tissue blocks were selected based on the known distribution pattern of tau pathology as described previously by Braak [2]. MRI contrast changes and histopathology were assessed with the use of semi-quantitative ordinal scoring criteria. Correlation analysis was done to investigate the correlation of MRI contrast changes and severity of AD pathology.
In total, tissue samples of 13 control subjects with no clinical or pathological signs of AD, and 10 LOAD and 11 EOAD patients with a clinical and confirmed pathological diagnosis of AD were included. Control subjects and LOAD patients were sex- and age-matched. LOAD and EOAD patients were matched on sex and Braak scores; by definition EOAD patients had a significant lower age of onset and age of death compared to LOAD patients (p < 0.001). Patient-group characteristics are presented in Table 1.
Table 1
Case characteristics
| Controls (n = 13) | LOAD (n = 10) | EOAD (n = 11) | |
| Mean age of onset, y (range) | – | 79.4 (69–89) | 52.5 (34–64)++ |
| Mean age of death, y (range) | 80.2 (64–93) | 85.8 (73–96) | 67.3 (43–91)*, ++ |
| Male/female | 5/8 | 4/6 | 4/7 |
| Braak, median (range) | 2 (0–3) | 5 (4–6)** | 6 (4–6)** |
| APOE ɛ4 carriers | 1/8 | 8/10* | 5/11 |
| Mutation (number of known cases) | Unknown | Unknown | APP (1), PSEN1 (1) |
| Postmortem interval, mean (sd) | 6 h:39 m (1 h:21 m) | 5 h:17 m (1 h:20 m)* | 5 h:01 m (1 h:02 m)* |
| Duration formalin-fixation, median (range) | 1 year (0–3) | 1 year (0–3) | 1 year (0–3) |
*Indicates a significant difference between controls and LOAD and/or controls and EOAD patients. +Indicates a significant difference between LOAD and EOAD patients. */+indicates p < 0.05 and **/++indicates p < 0.001. APOE ɛ4, Apolipoprotein E ɛ4 gene allele; EOAD, early-onset Alzheimer’s disease patients; LOAD, late-onset Alzheimer’s disease patients.
Brain sample preparation
Brain tissue from all subjects was obtained from the Netherlands Brain Bank (NBB, Netherlands Institute for Neuroscience Amsterdam) and the Normal Aging Brain Collection (VU, Amsterdam). Following the Dutch national ethical guidelines, anonymity of all subjects was preserved by using a coded system for the tissue samples. For all subjects, tissue samples were retrieved from specific anatomical locations based on the known distribution pattern of tau pathology as described previously by Braak [2], including the middle frontal gyrus, superior parietal gyrus, superior occipital gyrus and middle temporal gyrus. Tissue was fixed in 4% phosphate-buffered formalin and to avoid formalin-induced artefacts on MRI, only material fixed for a minimum of 4 weeks and a maximum of three years was selected [25]. In both control subjects and AD patients, most cases were fixed for not more than one year. No significant differences in duration of formalin fixation were found between the groups.
Tissue blocks of approximately 20×15×15 mm were resected and put in a 15 ml tube (Greiner Bio-One). Before MRI, the MR relaxation parameters were partially restored by removing residual formalin and placing the tissue block in phosphate buffered saline (PBS) for >24 h [26]. Before scanning, PBS was replaced with a proton-free fluid (Fomblin LC08, Solvay). Care was taken to avoid the inclusion of trapped air bubbles.
Postmortem MRI acquisition
MRI scans were made at room temperature on a 7T horizontal bore Bruker MRI system equipped with a 23 mm receiver coil and Paravision 5.1 imaging software (Bruker Biospin, Ettlingen, Germany). Multiple gradient echo scans with a total imaging time of 210 min were acquired from each brain sample with repetition time = 75.0 ms, echo times = 12.5, 23.2, 33.9, and 44.6 ms, flip angle = 25° at 100μm isotropic resolution with 20 signal averages.
Postmortem MRI analysis
Magnitude images with an echo time of 33.9 ms were selected because these magnitude images visually had the best contrast compared to the other echoes, based also on previous publications [17, 20]. Assessment of the cortices was performed using a pre-defined scoring system for assessing MRI contrast changes on 7T MRI in the frontal cortex as described by Bulk et al. [17]. These included assessments of cortical homogeneity and the presence of a diffuse hypointense band.
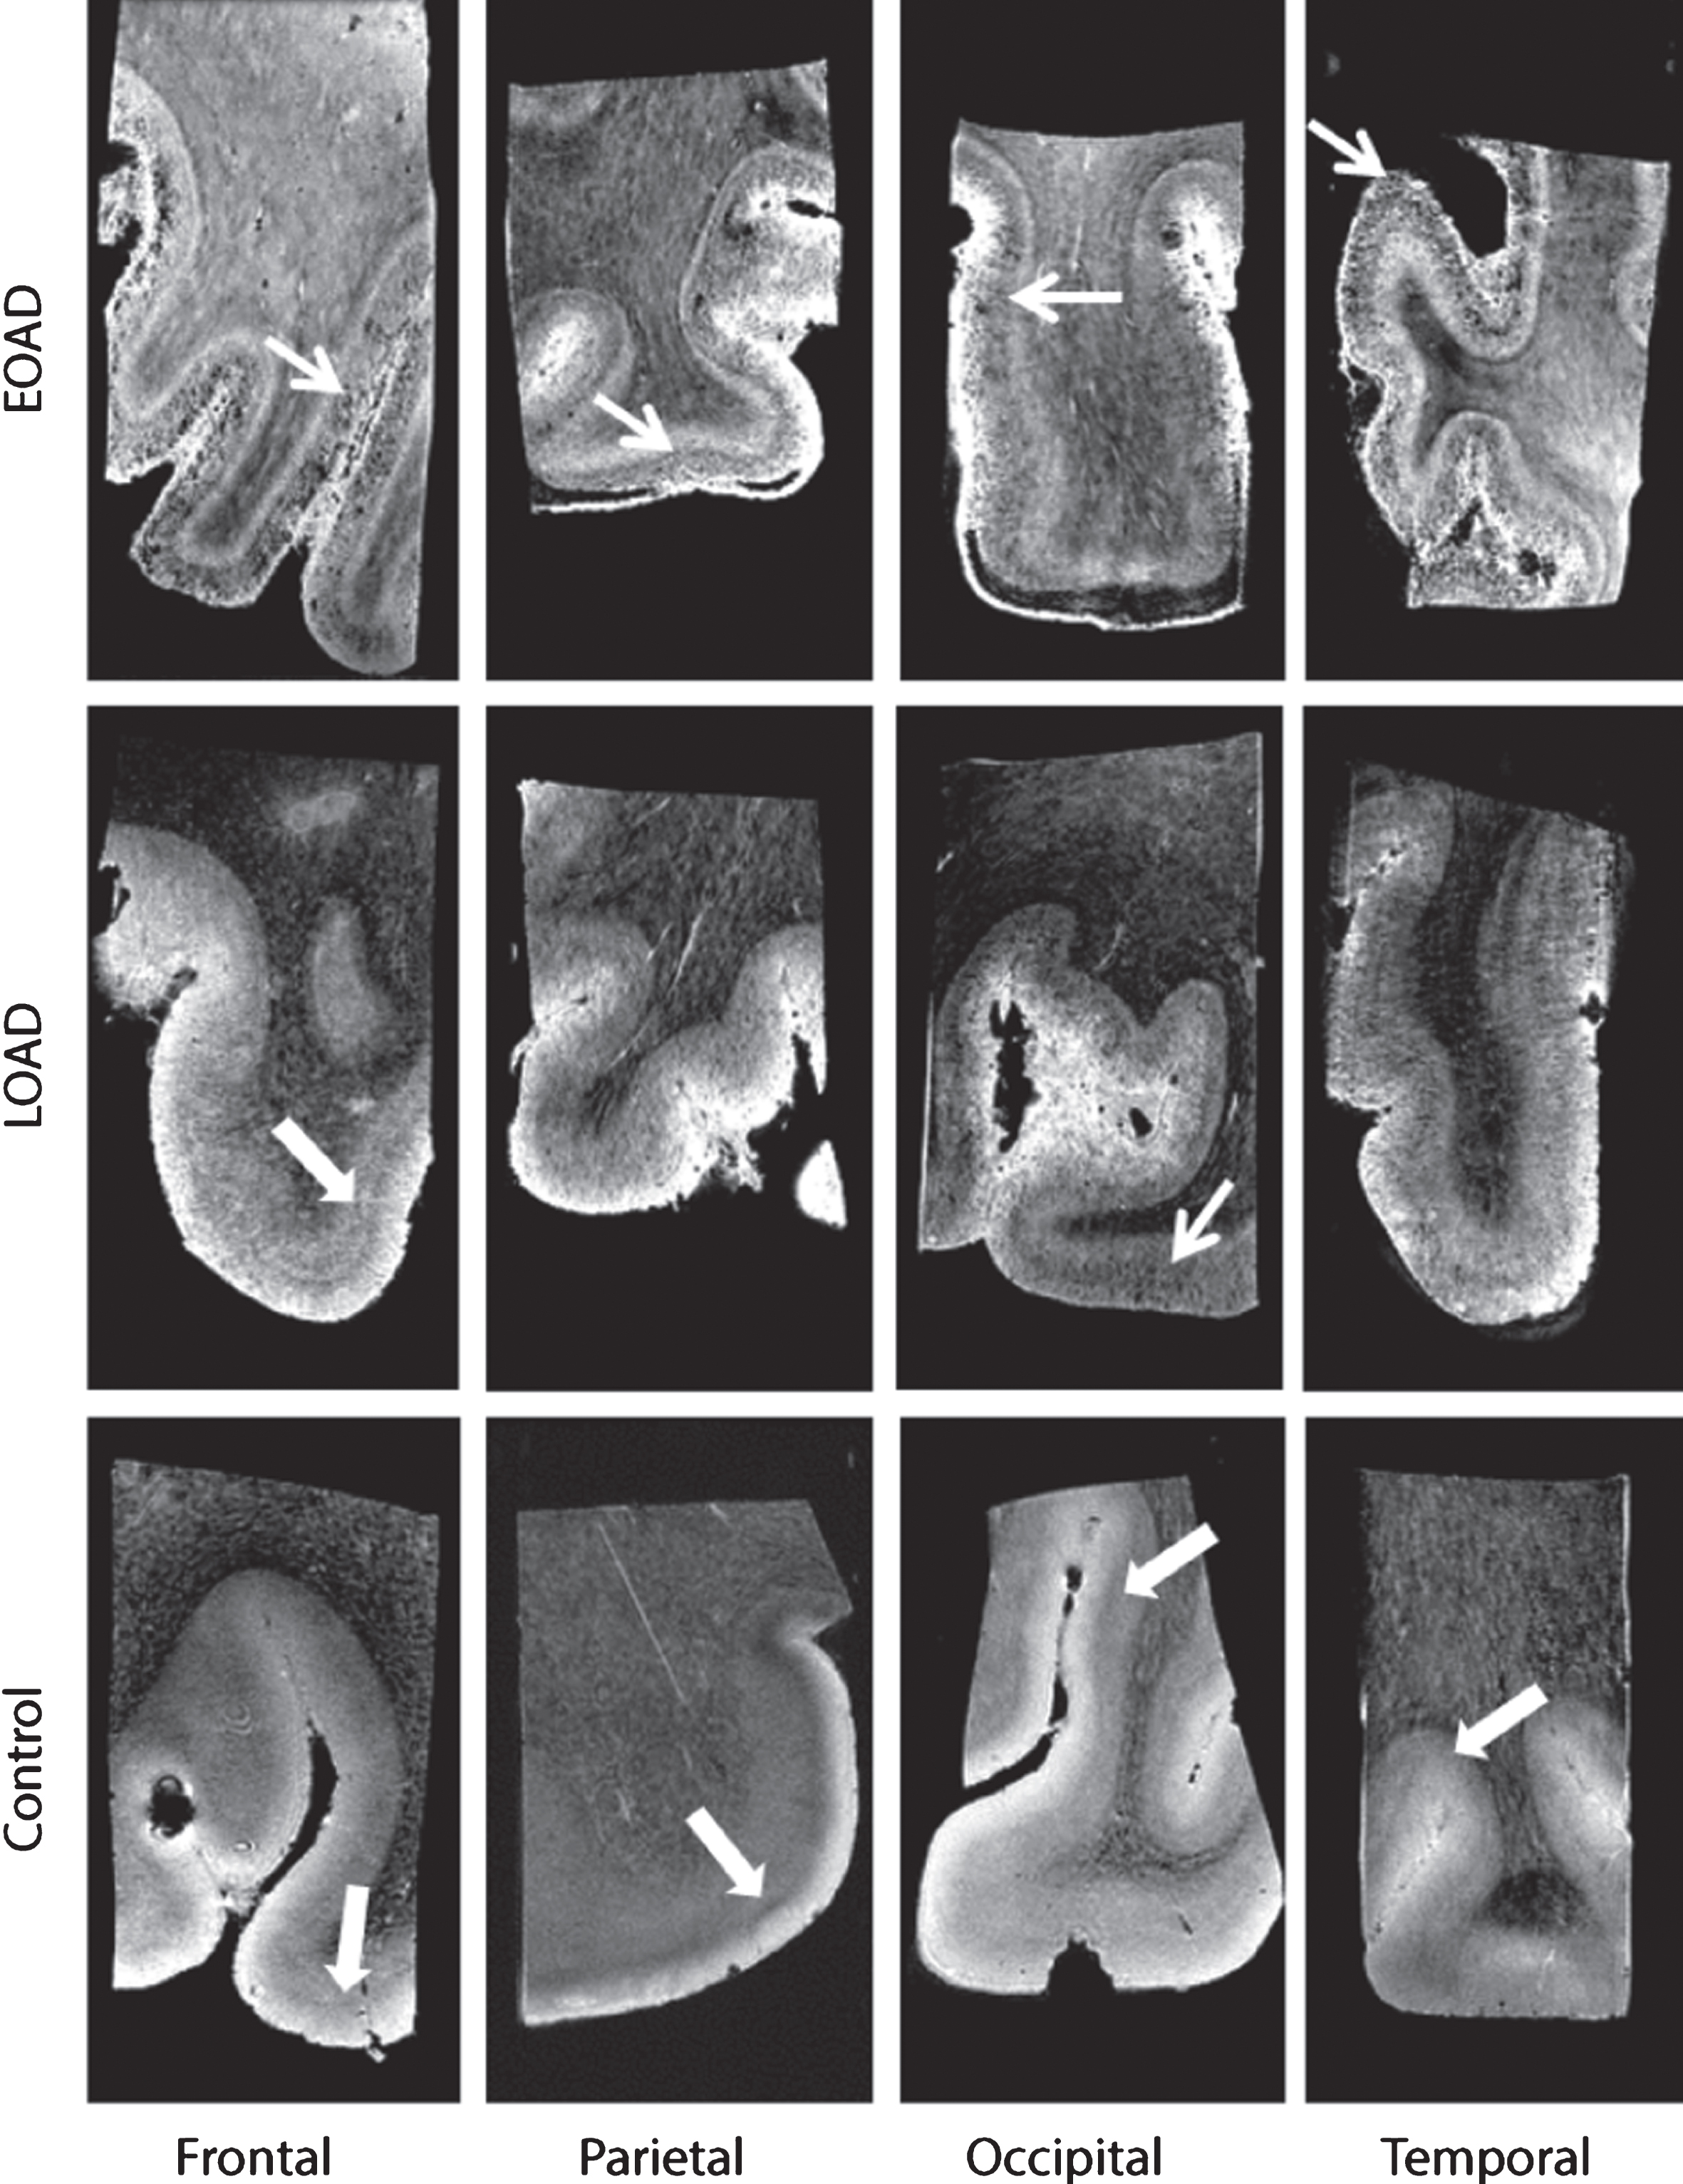
A normal cortex was defined as either a cortex containing one homogeneous hyperintense layer in comparison to the adjacent white matter (WM), or a homogeneous cortex containing two or three well-delineated layers observed as normal cortical lamination. The superficial layer has a higher signal intensity compared with the deepest layers. Additionally, in a cortex with three layers a thin middle layer with a lower signal intensity compared with the other layers as described previously in cortical regions with highly myelinated layers could be observed. This thin layer is known as the line of Baillarger, or in the striate cortex specifically as the line of Gennari [27]. In a normal cortex with normal cortical lamination, no diffuse hypointense band was observed (Fig. 1, thick arrow). An abnormal cortex was defined as a cortex with a granular/patchy structure containing foci of signal loss. In addition, a diffuse hypointense band was observed as diffuse areas of lower signal intensity covering the middle cortical layers, obscuring normal cortical lamination (Fig. 1, arrow).
Fig.1
Representative MRI images of a control, LOAD, and EOAD subject. Control subjects were characterized by a normal cortex defined as a homogeneous cortex including normal cortical lamination (thick arrow). AD patients have a different cortical appearance on T2*-weighted MRI compared to control subjects. The cortex of AD patients is characterized by inhomogeneities (granular and/or patchy structure and foci of signal loss) and a diffuse hypointense band covering and obscuring the central layers of the cortex (arrow).
All images were scored for absence or presence of above-mentioned criteria. As previously explained [17], different scoring values were used per criteria to indicate presence, partially presence or absence of the criteria. A weakly or intermittently observed diffuse hypointense band throughout the cortical ribbon was scored as partially present. For each cortical region, a total score was calculated from the values of each criteria, with a minimum score of 0/4 indicating a normal cortex and a maximum of 4/4 indicating an abnormal cortex. Window settings were standardized for each image and all scans were scored by two independent blinded trained observers (MB, BK). Consensus was reached in all cases of disagreement.
Lastly, to indicate severity of the MRI contrast changes as used in Fig. 5, a severity score was calculated based on the presence of a hypointense diffuse band on MRI. The scoring values for the presence of a diffuse hypointense band (0,1,2) were multiplied by the frequency of each criteria resulting in a sum score for each cortical region. Severity ranges from 0 to 22, with 0 indicating low severity and 22 high severity.
The most similar MRI slice with respect to the given histology was selected based on the physical location of the section in the tissue block, measured by counting the number of sections taken starting at the block surface. At this approximate location, the most similar MRI slice was chosen by visual comparing clearly detectable landmarks (contours, vasculature, tears etc.). The MRI slice thickness was 100μm and the total thickness of histological slices was 56μm (20μm iron, 20μm myelin, 8μm Aβ and 8μm tau), therefore the selected MRI slice was matched to all four histological stainings allowing correlation analyses between the MRI and histological scores.
Histology and immunohistochemistry
The same tissue blocks as used for MRI, were also used for histology. Tissue blocks were embedded in paraffin and serially cut into 8-μm and 20-μm-thick sections. Histochemical iron detection was done as previously described [17, 28]. After deparaffinization, 20-μm-thick sections were incubated for 80 min in 1% potassium ferrocyanide, washed, followed by 100 min incubation in methanol with 0.01 M NaN3 and 0.3% H2O2. Subsequently, sections were washed with 0.1 M phosphate buffer followed by 80 min incubation in a solution containing 0.025% 3’3-diaminobenzidine-tetrahydrochloride (DAB, (DakoCytomation)) and 0.005% H2O2 in 0.1 M phosphate buffer. The reaction was stopped by washing with tap water.
Another 20-μm-thick section was used for immunohistochemical detection of myelin, and the 8-μm sections were stained for Aβ and paired helical filament-tau (Supplementary Table 1). All sections were treated with 0.3% H2O2 in methanol to block endogenous peroxidase activity. Depending on the primary antibody this step was followed by an antigen retrieval step. Primary antibodies were incubated overnight at room temperature. The secondary antibody was incubated for one hour followed by a 30-min incubation with avidin-biotin complex (ABC, Vector Labs, CA, USA). Signal enhancement was completed by immersion in DAB. The 8-μm sections were counterstained with Harris Hematoxylin. All slides were digitized using an automatic bright field microscope (Philips Ultra Fast Scanner, Philips, Netherlands) for microscopic evaluation.
Semi-quantitative scoring of pathology
Histopathological stainings have been performed for: Aβ, tau tangles, iron, and myelin. The same stainings have previously been investigated [17, 28], and the same semi-quantitative scoring system was used in this study. All substrates were assessed by two trained blinded observers (MB, BK). In case of disagreement or doubtful scores, the specific subject was assessed by a neuropathologist (RN).
In short, severity of cortical Aβ plaque load was divided into four categories: absent (no Aβ plaques [scoring value 0]), mild (one or scattered Aβ plaques present [scoring value 1]), moderate (widespread Aβ plaques, but with one or more areas in layer II-IV without or with only little amount of Aβ plaques [scoring value 2]), severe (diffuse high Aβ plaque density in layer II-IV [scoring value 3]).
For hyperphosphorylated tau, the following categories were defined: absent (no hyperphosphorylated tau labeling present [scoring value 0]), light (occasional hyper-phosphorylated tau labeling of individual cells or neuropil threads [scoring value 1]), mild (at least one 20x area with hyperphosphorylated tau labeling, as adapted from Fig. 5B in Alafuzoff et al. [1] [scoring value 2]), moderate (macroscopically visible diffuse hyperphosphorylated tau labeling of part of the cortex, or restricted to one cortical layer [scoring value 3]), severe (macroscopically visible diffuse hyperphosphorylated tau labeling of more than one visible layer (mostly layer V and II/III) for the complete cortical ribbon [scoring value 4]).
Cortical iron and myelin were classified as no cortical staining (scoring value 1), normal cortical staining (scoring value 2), partially thickened cortical staining (scoring value 3), or abnormal, diffuse band shaped, cortical staining (scoring value 4). Abnormal cortical iron and myelin were both defined as a diffuse band-shaped pattern of respectively increased iron labeling and increased myelin immunohistochemistry, covering the middle cortical layers (III/IV), sometimes extending to layer II and V. A weak or intermittently observed band-shaped staining intensity throughout the cortical ribbon was scored as partially thickened cortical staining.
Statistical methods
Continuous variables, as for example age, were compared between groups using a one-way ANOVA. A chi-square test was used to compare categorical variables between groups and between regions. Since three groups were compared post-hoc chi-square and ANOVA tests were done using the method of Shaffer [29], that allows post hoc tests at the full level. Semi-quantitative MRI scores were correlated to semi-quantitative scores for Aβ plaque load, tau load, cortical iron accumulation and cortical myelin changes using a linear by linear association test for ordinal variables. All statistical analyses were performed using Statistical Package of Social Sciences (SPSS, version 23; SPSS, Chicago, USA). A significance level of 0.05 was used.
RESULTS
Cortical distribution pattern of MRI contrast changes
In a previous ex vivo 7T imaging study, we showed that AD patients have a different cortical appearance on T2*-weighted MRI compared to control subjects, characterized by inhomogeneities and a diffuse hypointense band covering the central layers of the frontal cortex. In the current study, we determined the cortical distribution pattern of MRI contrast changes over the brain, using tissue blocks of the frontal, parietal, occipital, and temporal cortex and the previously used MRI scoring system (Fig. 1) [17].
Both an inhomogeneous cortex and a diffuse hypointense band were more frequently found in LOAD and EOAD patients compared to control subjects (Table 2). Whereas an inhomogeneous cortex was observed equally across all cortical regions in AD patients, regardless of age of onset (Fig. 2A), the presence of a diffuse hypointense band showed a cortical distribution pattern (Fig. 2B). Generally, in LOAD patients we observed the diffuse hypointense band more prominently in the temporal and occipital regions, whereas the frontal regions were less severely affected. In contrast, in the EOAD patients we frequently observed heavy involvement of all lobes. Furthermore, the diffuse hypointense band was significantly more frequently visible in EOAD patients than in LOAD patients (p < 0.05, Table 2, Fig. 2B).
Table 2
MRI and histopathological findings
| Controls (n = 13) | LOAD (n = 10) | EOAD (n = 11) | |
| Homogeneity of the cortex, homogeneous/inhomogeneous | |||
| Frontal middle gyrus | 9/4 | 0/10* | 2/9* |
| Parietal superior gyrus | 11/2 | 1/9** | 3/8* |
| Occipital superior gyrus | 10/3 | 0/10** | 2/9* |
| Temporal middle gyrus | 10/3 | 1/9* | 1/10* |
| Diffuse hypointense band, absent/partially present/present | |||
| Frontal middle gyrus | 11/2/0 | 0/8/2** | 2/3/6*, + |
| Parietal superior gyrus | 12/1/0 | 1/7/2** | 3/1/7*, + |
| Occipital superior gyrus | 10/3/0 | 1/6/3** | 2/3/5* |
| Temporal middle gyrus | 8/5/0 | 1/4/5** | 1/2/8* |
| Total MRI score, mean (sd) | |||
| Frontal middle gyrus | 0.77 (1.092) | 3.20 (0.422)** | 3.00 (1.549)** |
| Parietal superior gyrus | 0.38 (0.961) | 2.90 (1.101)** | 2.82 (1.834)** |
| Occipital superior gyrus | 0.69 (1.316) | 3.20 (0.632)** | 3.00 (1.265)** |
| Temporal middle gyrus | 0.85 (1.280) | 3.20 (1.229)** | 3.45 (1.214)** |
| Aβ load, median (range) | |||
| Frontal middle gyrus | 1 (0–2) | 3 (2-3)* | 3 (–)**, + |
| Parietal superior gyrus | 0 (0–2) | 3 (2-3)** | 3 (–)** |
| Occipital superior gyrus | 0 (0–2) | 3 (2-3)** | 3 (2-3)** |
| Temporal middle gyrus | 0 (0–2) | 3 (1–3)** | 3 (–)** |
| Tau load, median (range) | |||
| Frontal middle gyrus | 0 (0-1) | 2 (1–3)** | 4 (3-4)**, + |
| Parietal superior gyrus | 0 (0-1) | 3 (1–4)** | 4 (3-4)**, + |
| Occipital superior gyrus | 0 (0-1) | 3 (0–3)* | 3 (3-4)** |
| Temporal middle gyrus | 1 (0-1)# | 3 (2–4)* | 4 (3-4)** |
| Cortical iron accumulation, median (range) | |||
| Frontal middle gyrus | 2 (1-2) | 2 (1–4) | 3 (1–4)* |
| Parietal superior gyrus | 2 (1-2) | 2.5 (1–4) | 3 (3-4)** |
| Occipital superior gyrus | 2 (1-2) | 2 (2-3) | 3 (2–4)* |
| Temporal middle gyrus | 1.5 (1-2) | 2.5 (1–4) | 4 (1–4)* |
| Cortical myelin organization, median (range) | |||
| Frontal middle gyrus | 2 (–) | 2 (2-3) | 4 (2–4)*, + |
| Parietal superior gyrus | 2 (2-3) | 2 (2-3) | 4 (3-4)**, + |
| Occipital superior gyrus | 2 (–) | 2 (2-3)* | 4 (2–4)**, + |
| Temporal middle gyrus | 2 (–) | 2 (2-3)* | 4 (2–4)*, + |
*Indicates a significant difference between controls and LOAD and/or controls and EOAD patients. +Indicates a significant difference between LOAD and EOAD patients. #Indicates a significant differences between cortical regions within the control group. */+/#indicates p < 0.05 and **/++indicates p < 0.001.
Fig.2
Distribution of MRI contrast changes over the cortex. A) An inhomogeneous cortex was observed equally across all cortical regions in AD patients regardless of age of onset. B) The presence of a diffuse hypointense band showed a cortical spreading pattern. In LOAD patients, the diffuse hypointense band was most frequently observed in the temporal and occipital regions, whereas the frontal regions were less severely affected. In contrast, in the EOAD patients all regions were similarly affected, and the diffuse hypointense band was significantly more visible in LOAD patients than in EOAD patients. C) For all cortical regions, control subjects had significantly lower total MRI scores compared to both AD groups indicating a normal cortical appearance on MRI. The temporal cortex was the most affected region in LOAD patients, followed by the other cortical regions. In EOAD patients all cortical regions were heavily affected.
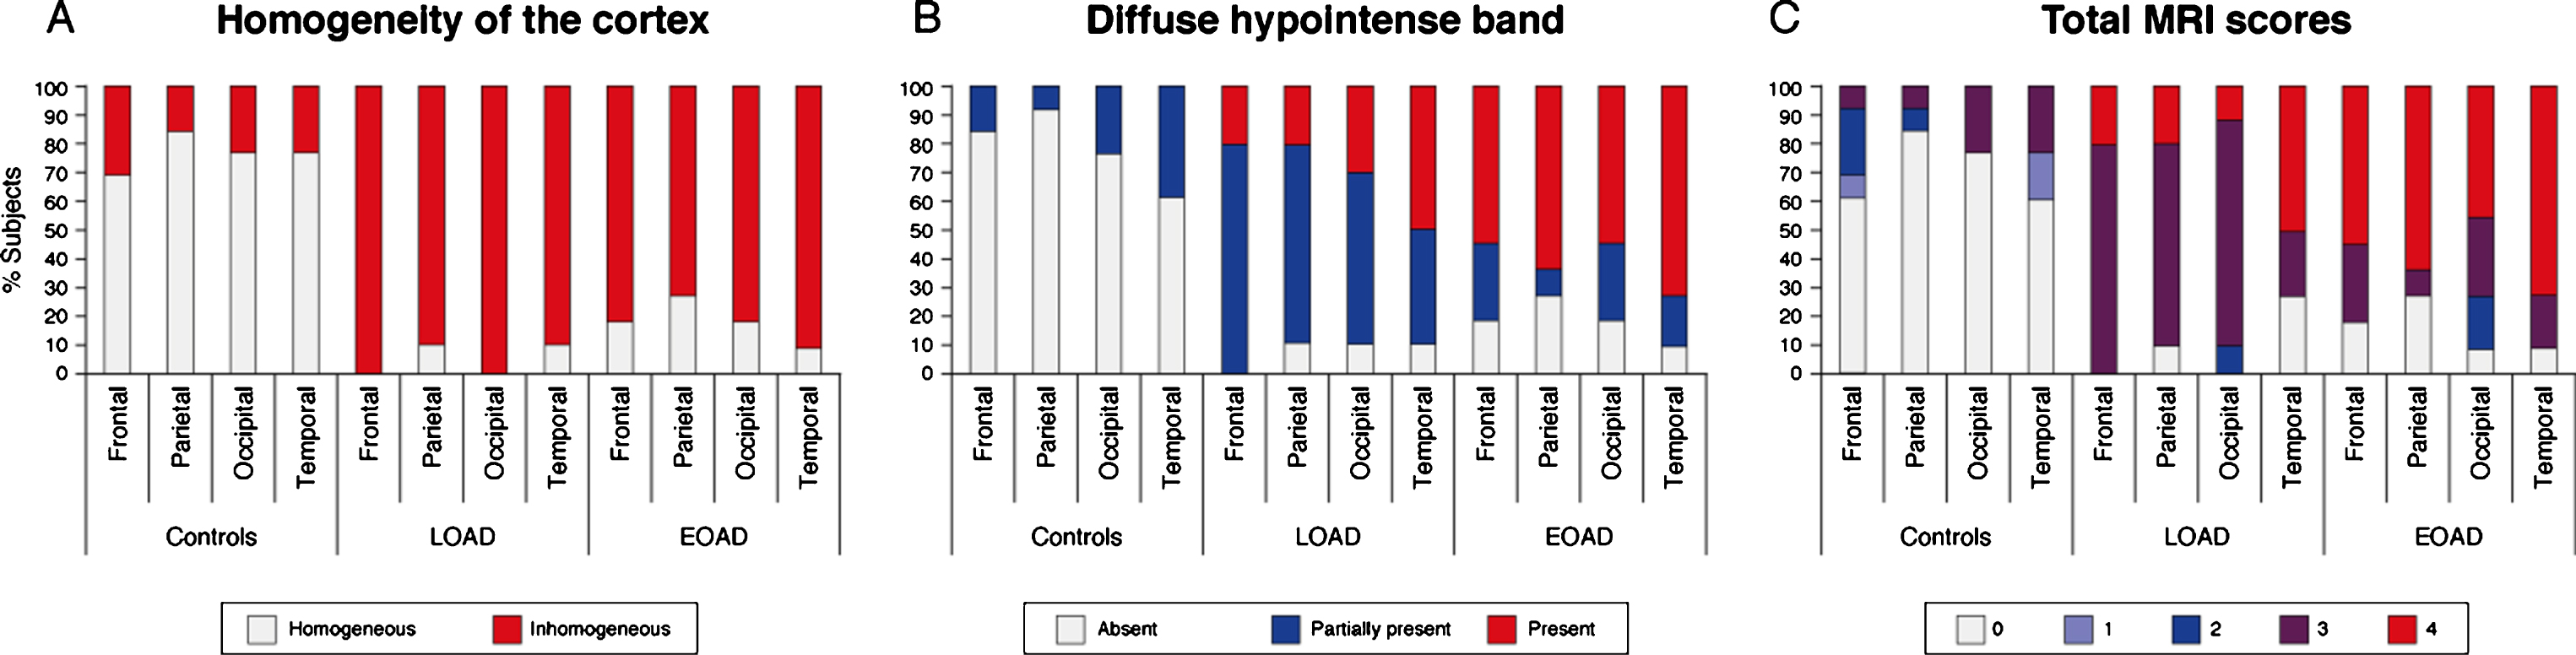
By summation of the individual scoring criteria, a total MRI score was calculated per cortical region. A low score indicated a normally-appearing cortex and a high score an abnormally-appearing cortex. For all cortical regions, control subjects had significantly lower total MRI scores compared to both AD groups (Table 2). The temporal cortex was the most affected region in LOAD patients, followed by the other cortical regions (Fig. 2C). This was not observed in the EOAD patients in whom all cortical regions were heavily affected.
Cortical distribution pattern of iron, myelin, and AD pathology
To assess the correlation between the pathological burden and the distribution pattern of AD pathology over the different cortical regions, the same tissue blocks as used for MRI were processed for histological analysis. Aβ plaques were abundantly present in all AD patients and all cortical regions were heavily affected. As expected, Aβ plaques were also present in some control subjects (Fig. 3A). Following Braak staging, the distribution pattern of hyperphosphorylated tau showed a predominance for the temporal cortex, with 69% of the control subjects already showing some presence of tau and nearly all LOAD patients showing severe tau pathology. In contrast, in EOAD patients all cortical regions were equally affected. In addition, EOAD patients showed significantly more hyperphosphorylated tau in the frontal and parietal cortex compared to LOAD patients (Table 2, Fig. 3B).
Fig.3
Distribution pattern of AD pathology and cortical iron and myelin changes over the cortex. A) Aβ plaques were abundantly present in all AD patients and all cortical regions were heavily affected. B) The spreading pattern of hyperphosphorylated tau showed a predominance for the temporal cortex, with 69% of the control subjects already showing some presence of tau and nearly all LOAD patients showing severe tau pathology. In EOAD patients, all cortical regions were equally affected. C) Nearly all control subjects and the majority of the LOAD patients showed a normal myelin distribution. In contrast, the majority of the EOAD patients showed an abnormal appearance of cortical myelin across all cortical regions. D) Compared to control subjects, in whom normal myelin-associated iron was observed, some AD patients showed an altered pattern of diffuse myelin-associated iron. In both LOAD and EOAD patients, the temporal cortex showed to most severe iron accumulation compared to the other cortical regions.
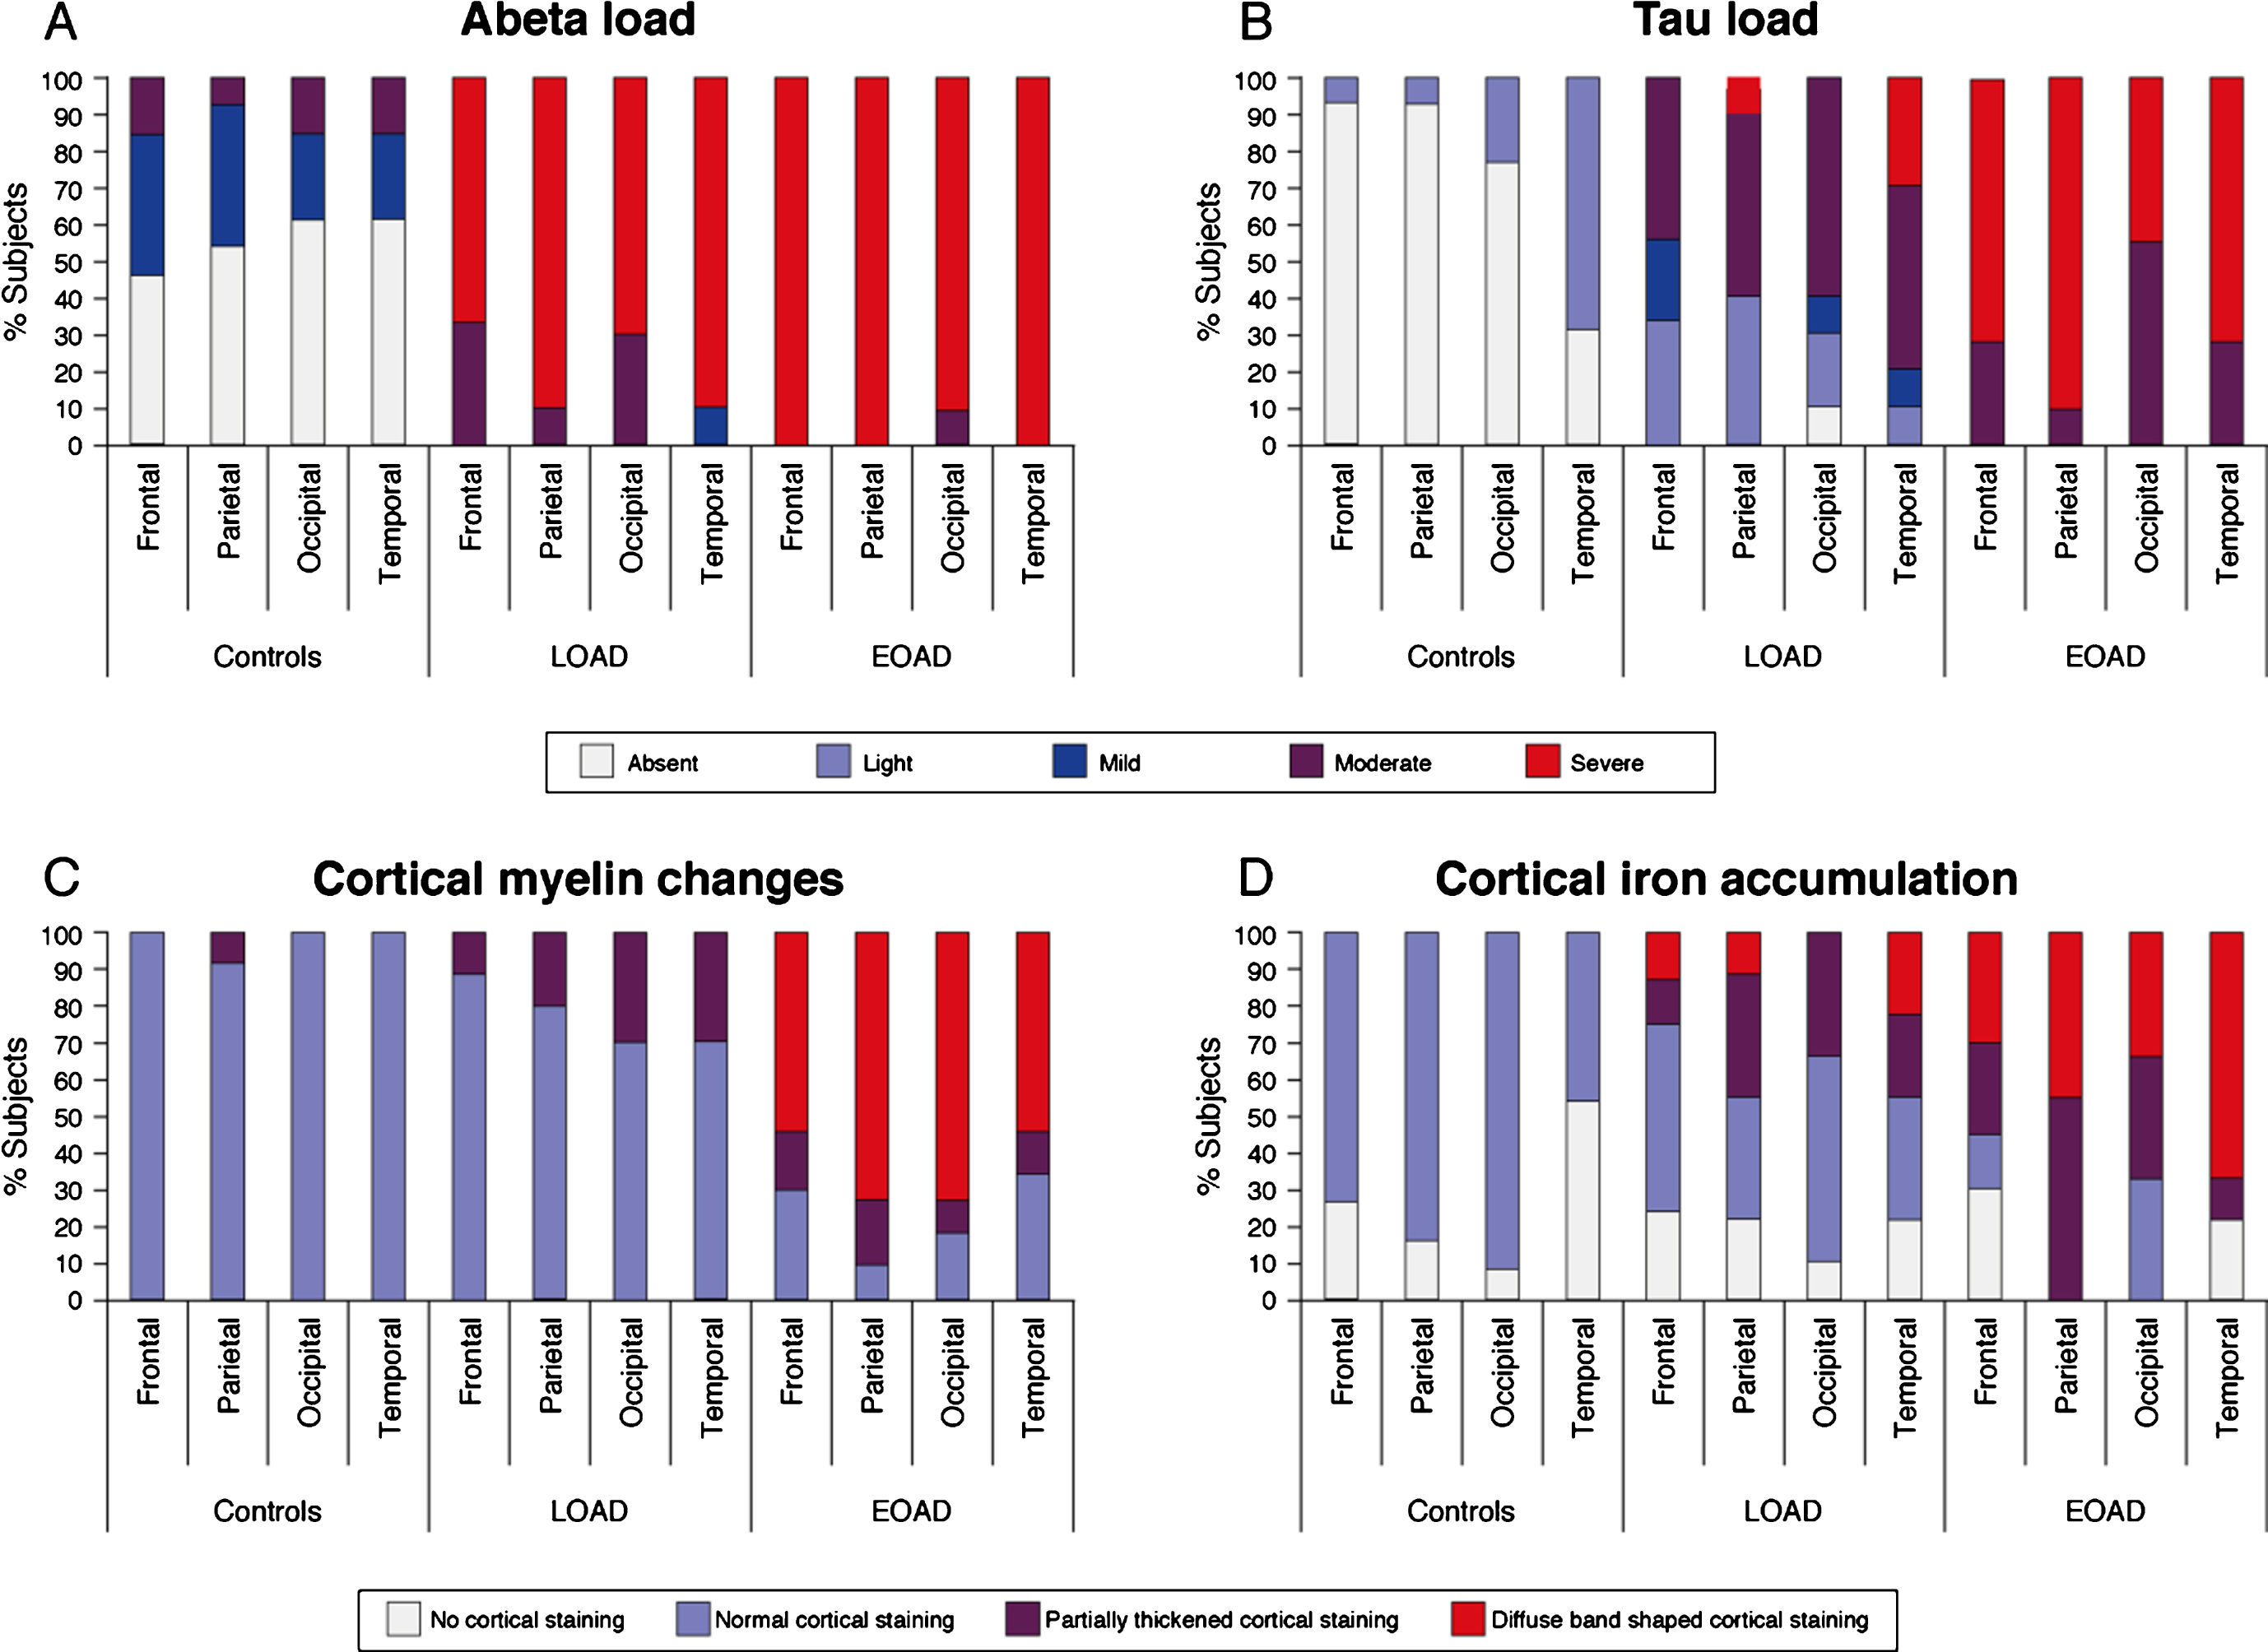
Since we previously showed that changes in cortical iron and myelin organization are the predominant sources of the observed MRI contrast changes in AD patients, cortical myelin and iron were also investigated (Table 2, Fig. 3C, D). Nearly all control subjects and the majority of the LOAD patients showed a normal myelin distribution with an increased staining intensity in myelin-rich areas (WM, lines of Baillarger, and myelinated fiber bundles transversing from the WM into the GM). In contrast, the majority of the EOAD patients showed an abnormal appearance of cortical myelin, observed as a diffuse band-shaped increased myelin staining of the middle layers of the cortex (III/IV), sometimes extending to layer II and V. This diffuse band-shaped increased myelin staining intensity was significantly more observed in EOAD patients compared to controls and LOAD patients across all cortical regions.
Compared to all control subjects, in whom normal myelin-associated iron was observed (i.e., in myelin-rich areas), some AD patients showed an altered pattern of cortical iron. This was observed as a diffuse band-shaped pattern of increased iron associated with and without cortical myelin covering the middle layers of the cortex (III/IV), sometimes extending till layer II and V. In both LOAD and EOAD patients, the temporal cortex showed to most severe iron accumulation compared to the other cortical regions (Fig. 3D).
MRI contrast is correlated with iron, myelin and AD pathology severity
Since the presence of the diffuse hypointense band on MRI is the most discriminating scoring criterion between control subjects, LOAD and EOAD patients, this scoring criterion was used to investigate the correlation between MRI contrast changes and severity of AD pathology (Fig. 4).
Fig.4
Heatmaps of the correlation between MRI contrast changes and AD pathology severity. Each individual square represents the percentage of cases. Each group of squares, for example the first group of squares in the upper left corner (i.e., MRI contrast versus changes in cortical iron accumulation in the frontal cortex), represents the correlation between the MRI scores and the histological scores. A positive correlation within each group of squares is observed as a flow of colored squares from the lower left corner towards the upper right corner. The presence of a diffuse hypointense band on MRI was significantly correlated with the semi-quantitative scored amount of cortical iron accumulation, cortical myelin changes, Aβ plaque load, and tau load in all cortical regions (p < 0.05). In our cohort, a diffuse hypointense band on MRI was always accompanied by moderate-to-high amounts of Aβ plaques and light-to-severe tau load. In subjects without a diffuse hypointense band on MRI, mostly absent-to-low amounts of hyperphosphorylated tau were found.
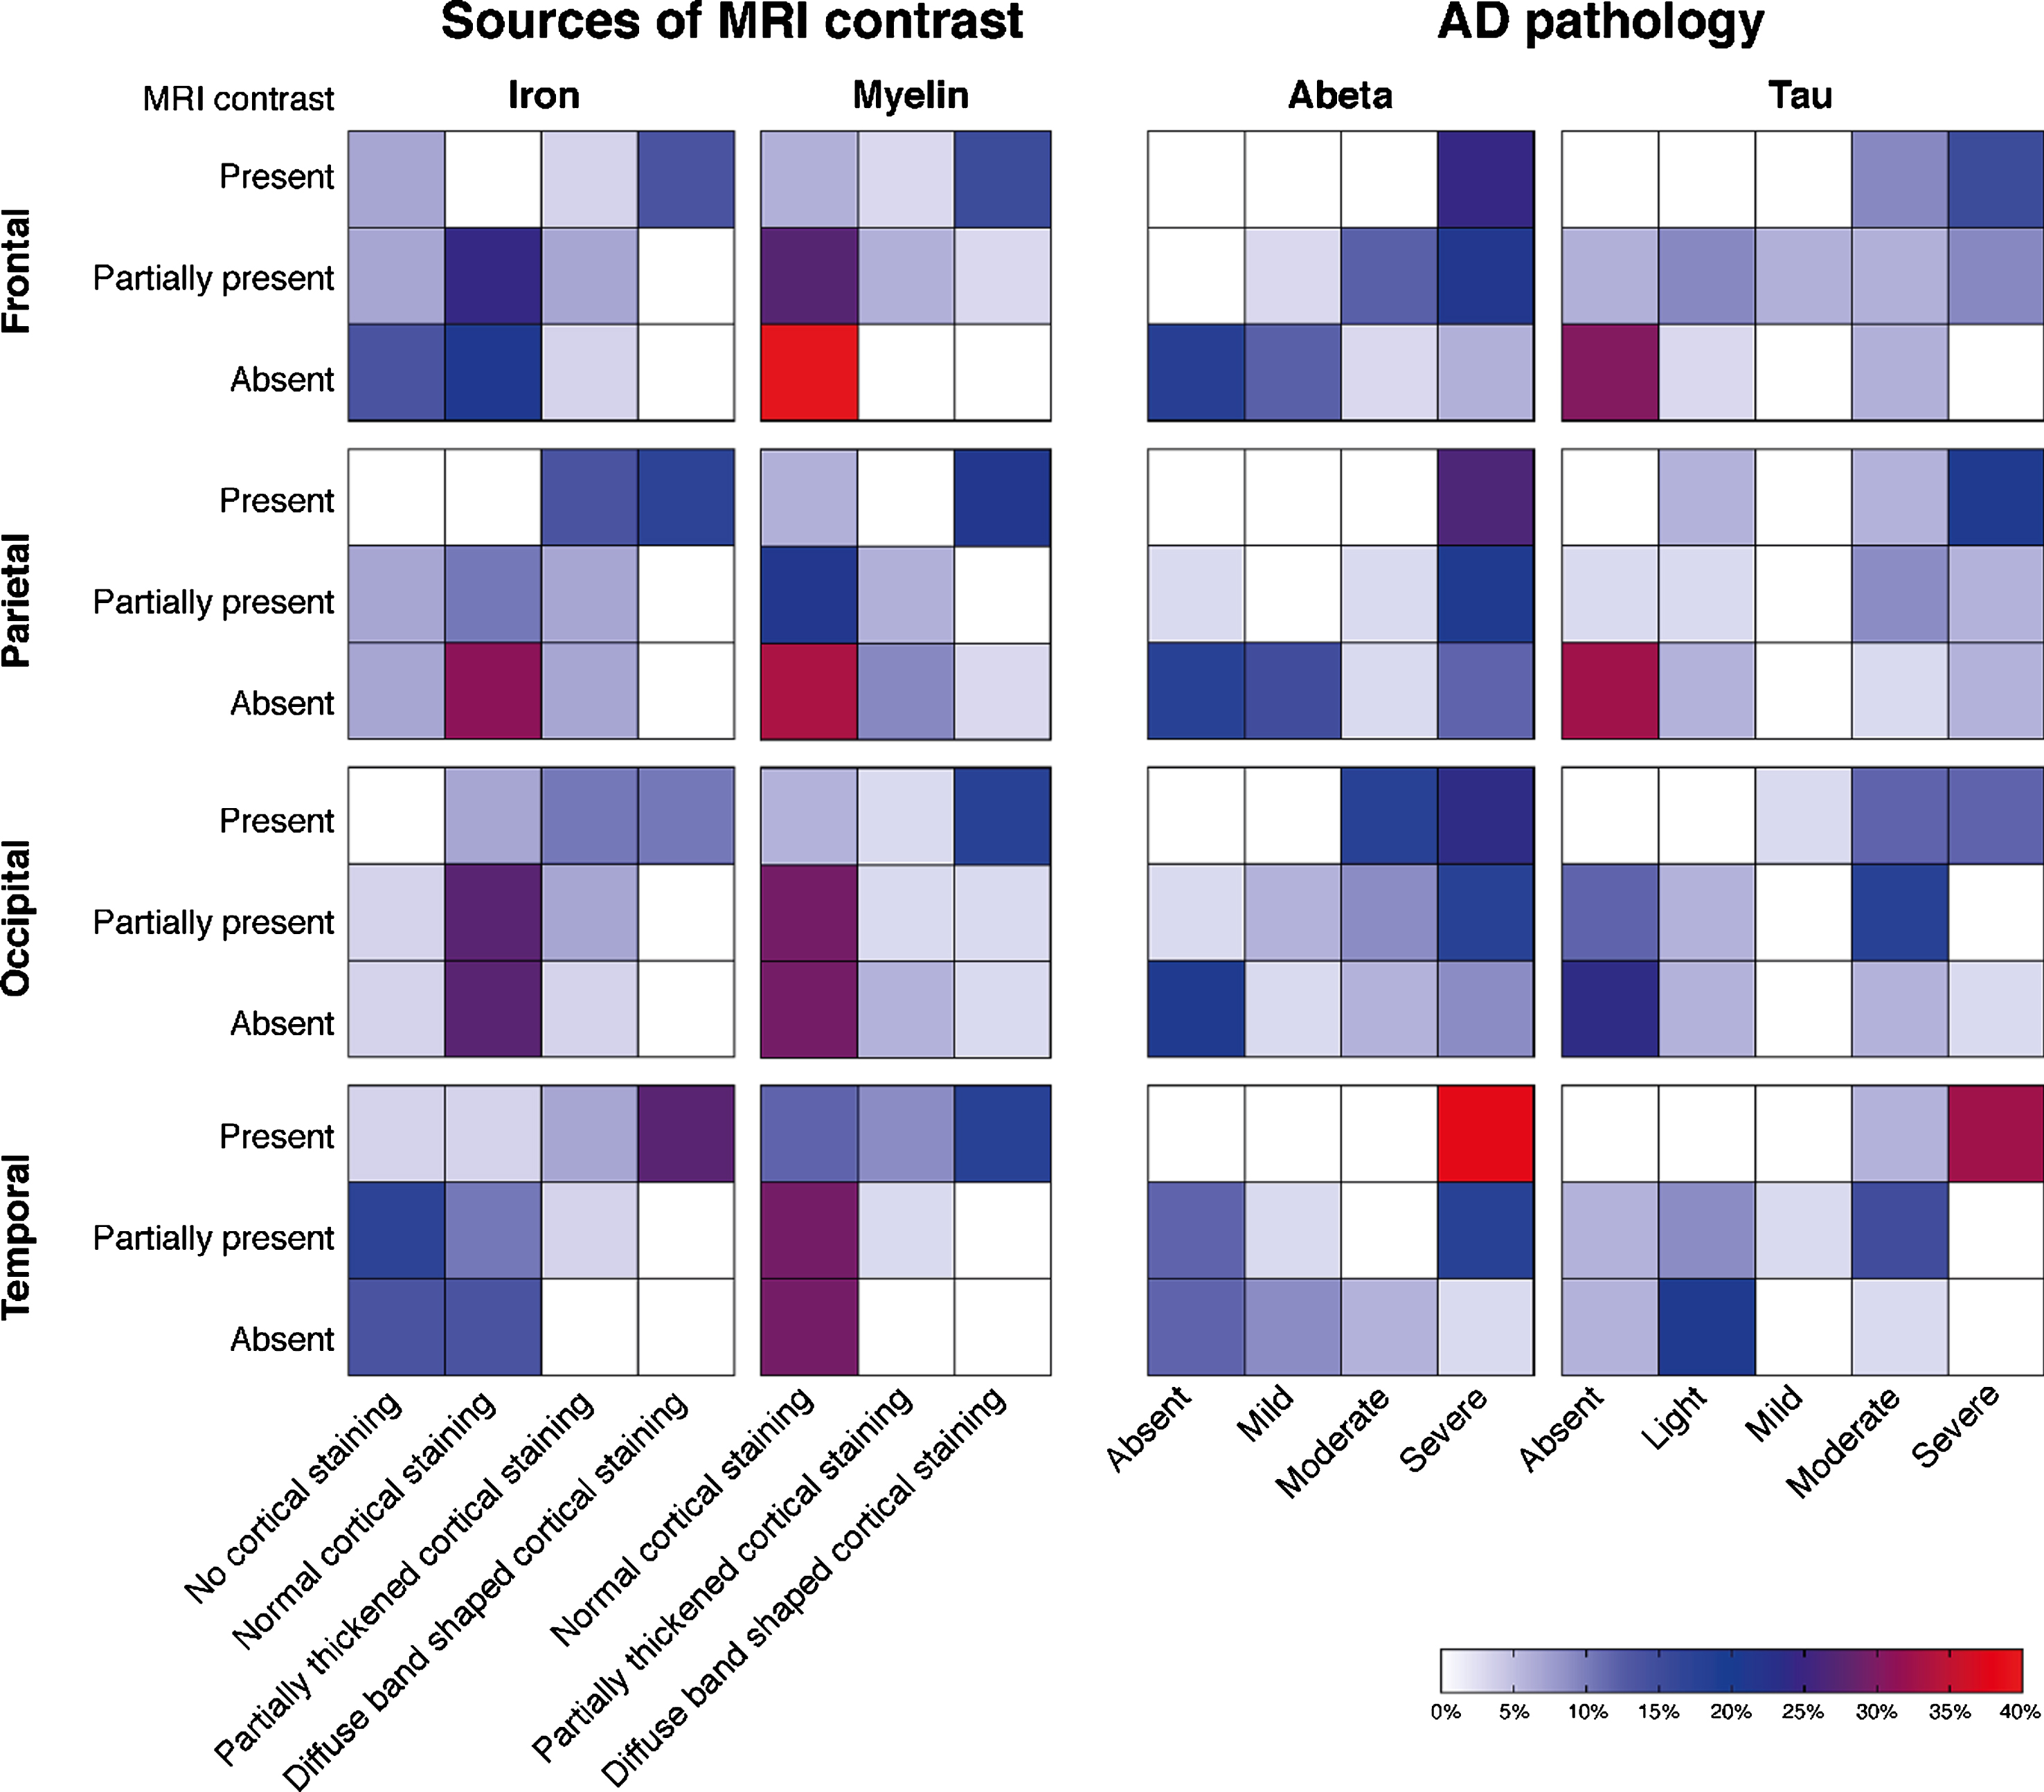
The presence of a diffuse hypointense band on MRI was significantly correlated with the semi-quantitative scored amount of cortical iron accumulation, Aβ plaque load, tau load, and cortical myelin changes in all cortical regions (p < 0.05). In our cohort, a diffuse hypointense band on MRI was always accompanied by moderate-to-high amounts of Aβ plaques and light-to-severe tau load. In subjects without a diffuse hypointense band on MRI, mostly absent-to-low amounts of hyperphosphorylated tau were found.
Cortical distribution pattern is not affected by APOE genotype
Besides differences between LOAD and EOAD patients, we also investigated the additional effect of APOE genotype on cortical distribution patterns. However, no difference was found between APOE ɛ4 carriers and non-carriers on cortical appearance on MRI, pathological burden or cortical distribution pattern of MRI contrast changes and AD pathology (data not shown).
DISCUSSION
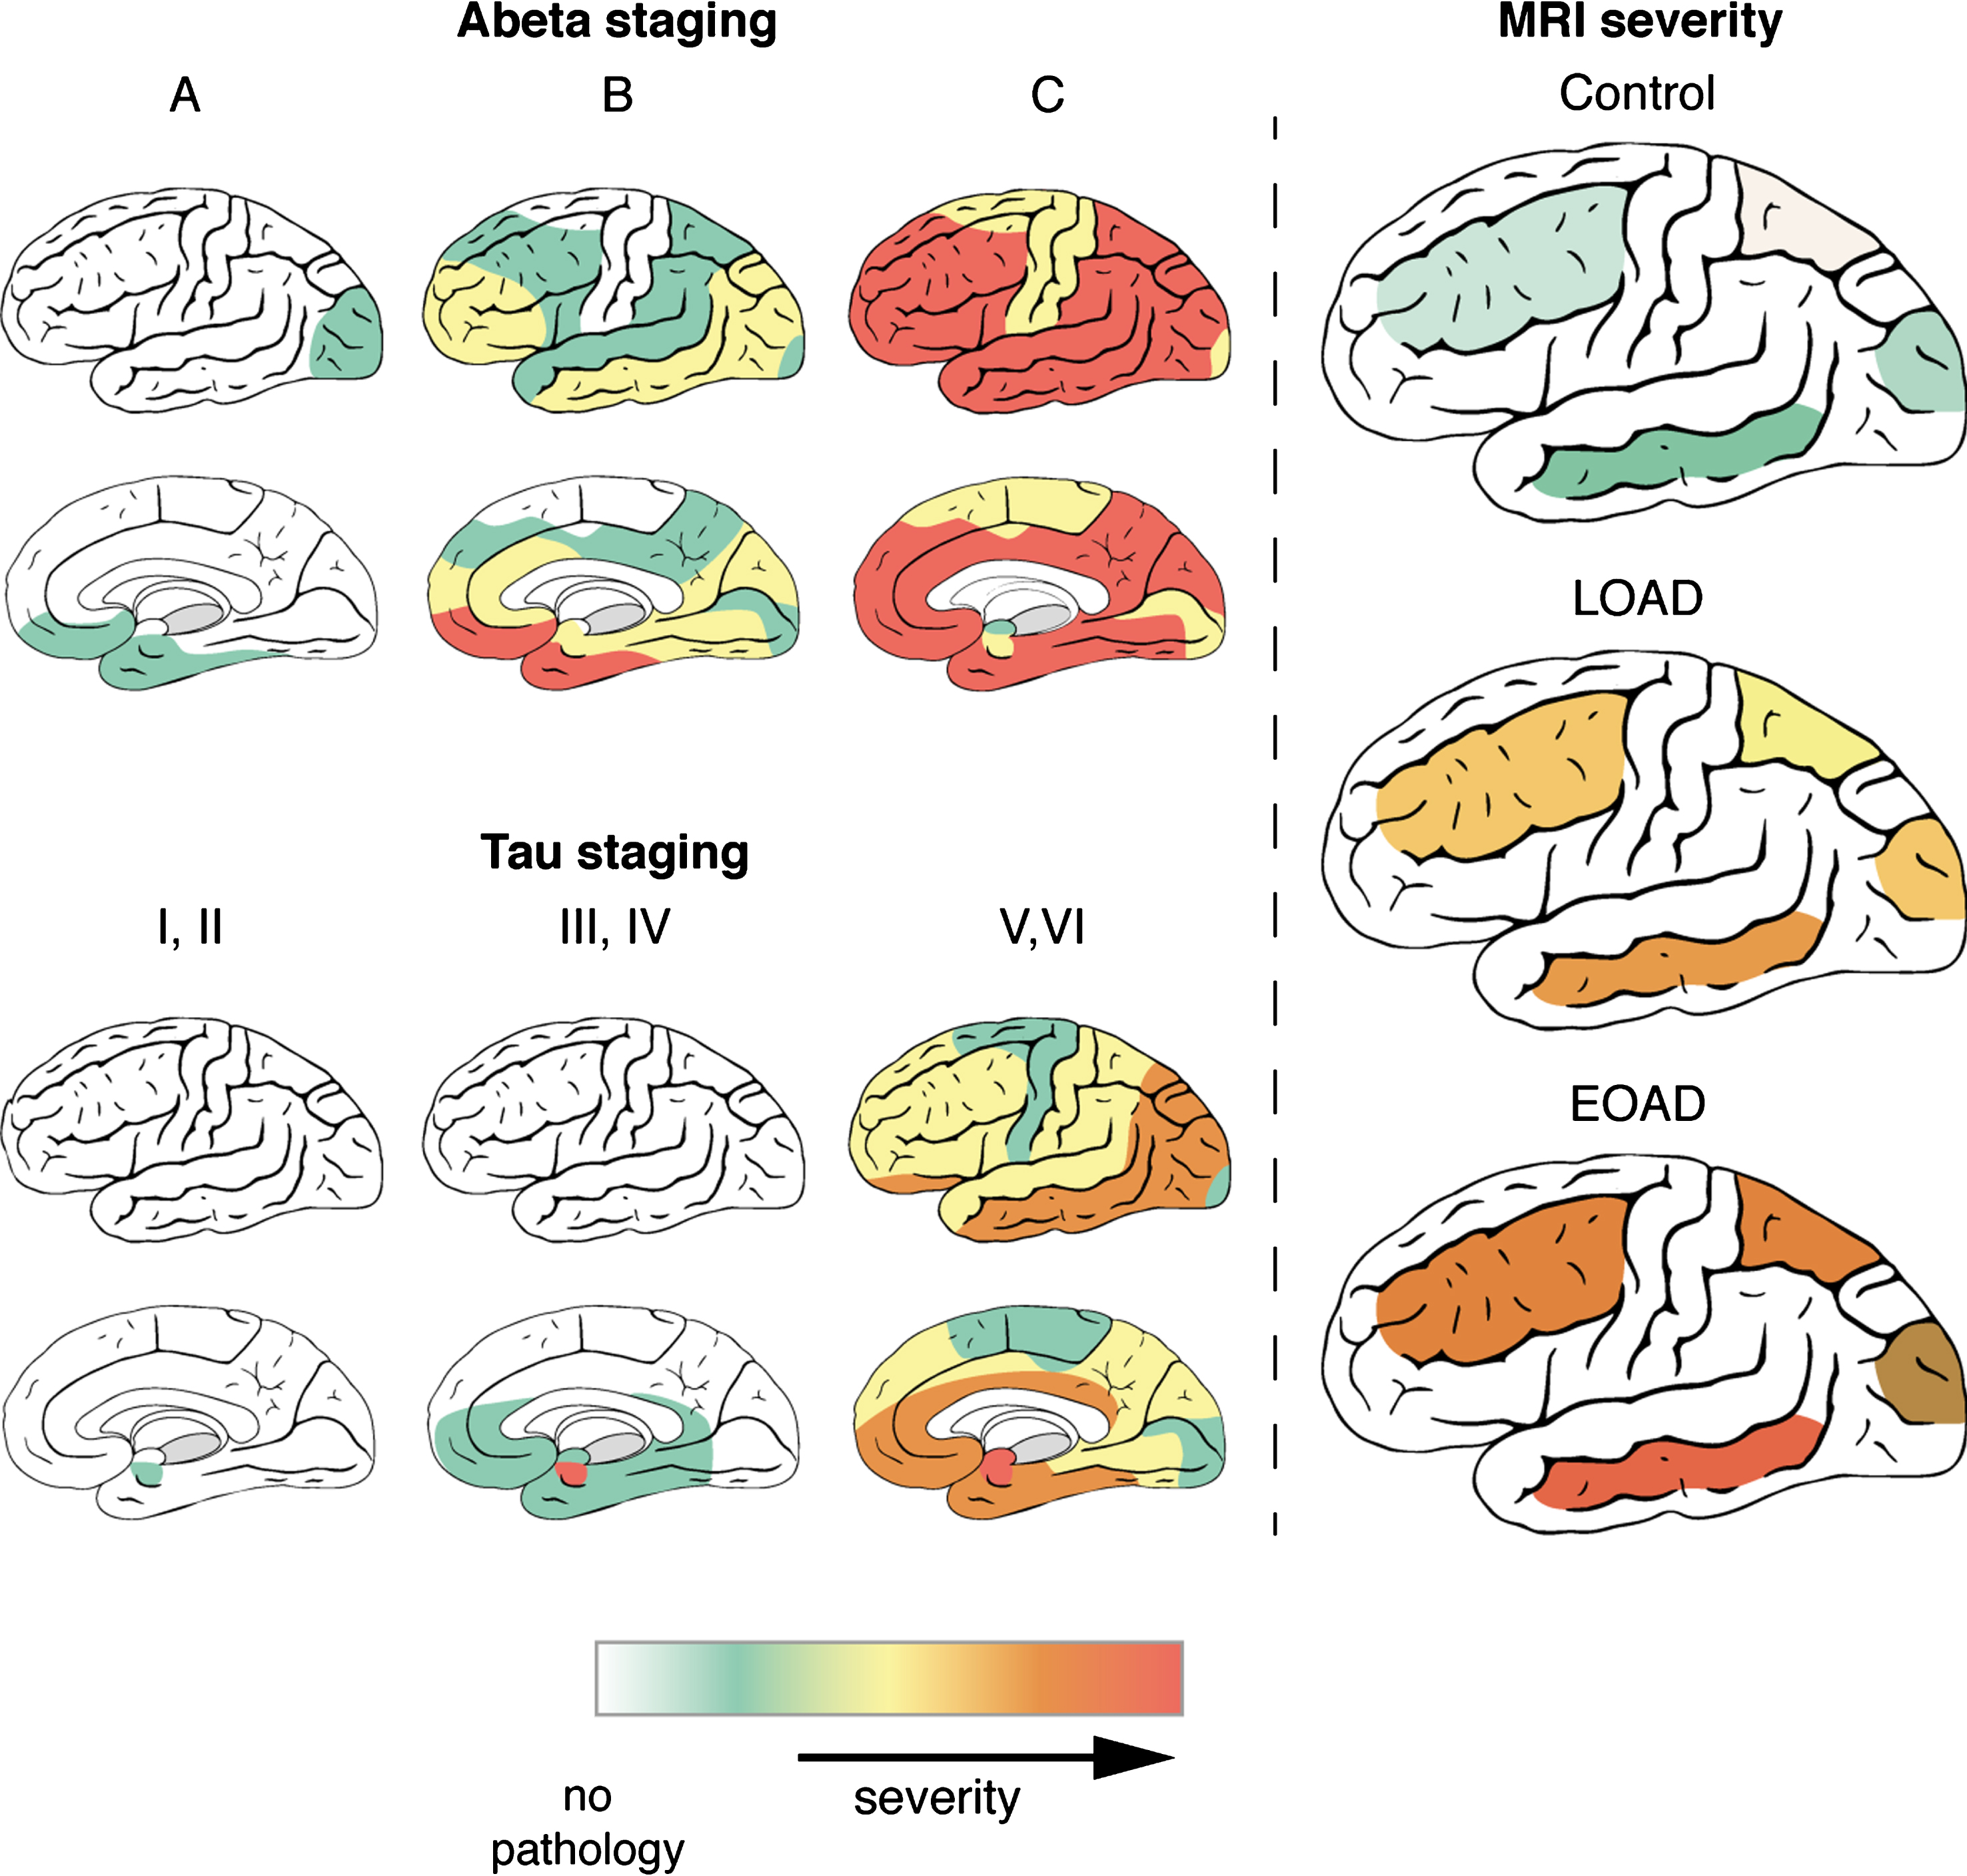
This study aimed to determine whether the cortical distribution pattern of T2*-weighted MRI contrast changes reflects the known progression of AD pathology over the cortex. In addition, we investigated whether the MRI contrast changes reflect the severity of AD pathology in the different lobes and described the differences between LOAD and EOAD patients in distribution patterns of both MRI contrast changes and pathology. The combination of ex vivo high-resolution MRI and histopathology on the same tissue block revealed that: 1) LOAD and EOAD patients have a different distribution pattern of AD pathological hallmarks and MRI contrast changes over the cortex, with EOAD patients showing more severe MRI changes; 2) per lobe, severity of AD pathological hallmarks correlates with iron accumulation, and hence with MRI. As visualized in Fig. 5, in the histologically determined stages of AD pathology as well as the MRI contrast changes, the temporal lobe is the most affected region corresponding to the distribution pattern of tau pathology. Even in controls, which have only limited tau pathology and MRI contrast changes, the temporal lobe is most affected. Therefore, using iron-sensitive MRI sequences, such as T2*-weighted MRI, we can non-invasively detect the cortical distribution pattern of AD pathology ex vivo.
Fig.5
Distribution of AD pathology and MRI contrast changes over the cortex. During disease progression, both AD pathological hallmarks spread throughout the brain in characteristic patterns, which are not the same for Aβ and tau. As described previously, Aβ plaques are first found in the basal parts of the frontal, occipital, and temporal lobe and gradually spread throughout the whole cortex. In later stages, Aβ plaques are also found in allocortical regions, the striatum, brainstem nuclei and eventually in the cerebellum. In contrast to Aβ plaques, tau tangles are first detected in the transentorhinal region of the middle temporal lobe. Subsequently, the basal parts of the frontal and temporal lobe are affected and finally the entire cortex, including the striatal cortex. In the histologically determined stages of AD pathology as well as the MRI contrast changes, the temporal lobe is the most affected region corresponding to the distribution pattern of tau pathology. Even in controls, which have only limited tau pathology and MRI contrast changes, the temporal lobe is most affected. Severity scales ranges for Aβ and tau staging from no pathology (white) to severe pathology (red). For MRI, MRI severity scores were calculated for specific cortical regions based on presence of a diffuse hypointense band (Methods). MRI severity scales ranges from severity not determined (white) to severe MRI changes (red).
We observed an abnormal appearance of the cortex in AD patients characterized by inhomogeneities and a diffuse hypointense band. Iron and myelin have been previously reported as an important source for T2*-weighted MRI contrast in the cortex [30–33]. We previously showed that also in AD, T2*-weighted contrast spatially correlated with changes in cortical iron accumulation and myelin organization [17]. Even though we did not find a spatial correlation of MRI contrast with the AD pathological hallmarks Aβ and hyperphosphorylated tau on a voxel-by-voxel basis, AD patients could clearly be distinguished from controls, indicating that susceptibility-based contrast changes reflect cortical alterations in AD other than Aβ and tau. In the current study, we did not investigate voxel-by-voxel correlations between MRI and AD pathological hallmarks; instead we focused on correlations of the observed MRI contrast changes with the semi-quantitative scored amount of cortical iron accumulation, Aβ plaque load, tau load, and cortical myelin changes in the different cortical regions.
The significant correlations between MRI and histological scores suggests that cortical iron accumulation, and consequently the MRI contrast, reflects the severity of AD pathology in each lobe. These findings correspond with recent findings on postmortem AD tissue showing that the degree of iron accumulation is positively correlated with the amount of Aβ plaques and tau load in the frontal cortex [24]. Moreover, an in vivo study by van Bergen et al., also found increased cortical iron levels measured by quantitative susceptibility mapping (QSM) MRI in PiB-positive APOE ɛ4 carriers with mild cognitive impairment [34], indicating an association between cortical iron and presence of Aβ plaques. The correlation between iron imaging and tau pathology has been less studied. Nevertheless, one study using a mouse model of tauopathy found magnetic susceptibility differences in the corpus callosum, striatum, hippocampus, and thalamus. Interestingly, these regions exhibited low NFT burden, but increased markers for reactive microglia and astrocytes, again confirming the notion that iron accumulation correlates with AD pathology, but is not directly caused by iron depositing in amyloid and/or tau aggregates [35].
We found a different distribution pattern of AD pathology and MRI contrast changes in LOAD and EOAD patients. Overall, on both MRI and histology LOAD patients followed the typical distribution patterns as described by the Braak stages, with predominantly temporal lobe involvement. In contrast, EOAD patients were generally more affected on both MRI and histology and besides the temporal lobe also the frontal, parietal, and occipital lobes were frequently affected. However, Aβ plaques were abundantly present in all AD patients and had reached a plateau for all cortical regions. The finding of a larger tau burden in EOAD patients is consistent with previous histological studies showing larger amounts of neurofibrillary tangles in EOAD patients [11]. Also, the changes in cortical iron accumulation were more frequently observed in EOAD patients. This is consistent with a previous in vivo 7T MRI study showing higher cortical phase MRI changes in EOAD compared to LOAD patients, reflecting increased cortical iron accumulation in EOAD [21].
Our observation of significant involvement of the frontal, parietal, and occipital lobe in addition to the temporal lobe in EOAD patients is supported by previous studies. Atrophy for example, is in EOAD patients more widespread, with more prominent involvement of regions other than the temporal lobe as the posterior and frontoparietal areas [12, 36]. Apart from structural and pathological differences, it is known that LOAD and EOAD patients differ in their clinical presentation. LOAD patients typically present with memory impairment corresponding with both the typical pattern of GM atrophy and our MRI contrast changes in the medial temporal lobe. In contrast, EOAD patients frequently present with atypical symptoms including visual dysfunction, apraxia and dyscalculia while the memory is relatively preserved [37]. This atypical presentation seemingly corresponds to the more widespread pattern of GM atrophy and the observed widespread cortical MRI contrast changes.
Apart from differences in iron accumulation due to age of onset, APOE gene status is also linked to iron [34, 38]. Ayton et al. showed recently that ferritin is strongly associated with CSF ApoE levels. Moreover, ferritin levels were elevated in APOE ɛ4 carriers [38]. The same association was shown by van Bergen et al. in MCI subjects; APOE ɛ4 carriers showed significantly higher magnetic susceptibility values compared to non-carriers [34]. These studies suggest that the APOE ɛ4 allele increases the risk of developing AD via iron accumulation in the brain. However, in our study we did not find significant differences between APOE ɛ4 carriers and non-carriers, most likely due to the small group sizes.
Despite the correlation between iron, T2*-weighted MRI, and AD pathology as shown in this study, the temporal correlation of iron accumulation and AD pathology remains to be elucidated. Currently, it is unknown whether iron follows the pathology, is accumulating at the same time, or is even earlier than Aβ and tau. However, in AD and other neurodegenerative diseases iron accumulation have been shown to play an important role in the progression of neurodegeneration [23, 34]. Recently it was shown that cortical iron accumulation might accelerate clinical progression in AD in Aβ-positive MCI patients [23]. Several mechanisms have been reported for the interaction of iron with amyloid and tau pathology. Apart from the production of ROS as being a well-known consequence of iron accumulation [39], iron also modulates amyloid-β protein precursor (AβPP) cleavage by furin and through the interaction with iron regulating proteins (IRP). Excessive amounts of iron decrease the activity of furin and thereby favor the amyloidgenic pathway of AβPP cleavage [16, 40]. In addition, iron might modulate AβPP translation through IRP; increased amounts of iron might upregulate AβPP translation resulting in an increased amount of AβPP available to be cleaved by the amyloidogenic pathway [16, 40]. Interestingly, intracellular iron storage and clearance is also regulated by AβPP and furin, and affected by the other pathological hallmark of AD, namely hyperphosphorylated tau [14, 40]. As has been shown in vitro, loss of functional tau disturbs AβPP-mediated iron export by decreasing trafficking of AβPP to the neuronal surface, eventually resulting in increased levels of intracellular iron [41]. Thus, cortical iron accumulation is likely a disease modifier and may be an independent biomarker to predict clinical progression.
ACKNOWLEDGMENTS
The authors thank I. M. Hegeman-Kleinn for her technical assistance and Gerrit Kracht for making the figures. This work was supported by a project grant from the EU Seventh Frame- work Programme: FP7-PEOPLE-2013-IAPP (612360 e BRAINPATH).
Authors’ disclosures available online (https://www.j-alz.com/manuscript-disclosures/18-0317r1).
SUPPLEMENTARY MATERIAL
[1] The supplementary material is available in the electronic version of this article: 10.3233/JAD-180317.
REFERENCES
[1] | Alafuzoff I , Arzberger T , Al-Sarraj S , Bodi I , Bogdanovic N , Braak H , Bugiani O , Del-Tredici K , Ferrer I , Gelpi E , Giaccone G , Graeber MB , Ince P , Kamphorst W , King A , Korkolopoulou P , Kovacs GG , Larionov S , Meyronet D , Monoranu C , Parchi P , Patsouris E , Roggendorf W , Seilhean D , Tagliavini F , Stadelmann C , Streichenberger N , Thal DR , Wharton SB , Kretzschmar H ((2008) ) Staging of neurofibrillary pathology in Alzheimer’s disease: A study of the BrainNet Europe Consortium. Brain Pathol 18: , 484–496. |
[2] | Braak H , Alafuzoff I , Arzberger T , Kretzschmar H , Del Tredici K ((2006) ) Staging of Alzheimer disease-associated neurofibrillary pathology using paraffin sections and immunocytochemistry. Acta Neuropathol 112: , 389–404. |
[3] | Braak H , Braak E ((1991) ) Neuropathological stageing of Alzheimer-related changes. Acta Neuropathol 82: , 239–259. |
[4] | Murray ME , Lowe VJ , Graff-Radford NR , Liesinger AM , Cannon A , Przybelski SA , Rawal B , Parisi JE , Petersen RC , Kantarci K , Ross OA , Duara R , Knopman DS , Jack CR Jr , Dickson DW ((2015) ) Clinicopathologic and 11C-Pittsburgh compound B implications of Thal amyloid phase across the Alzheimer’s disease spectrum. Brain 138: , 1370–1381. |
[5] | van der Flier WM , Pijnenburg YA , Fox NC , Scheltens P ((2011) ) Early-onset versus late-onset Alzheimer’s disease: The case of the missing APOE varepsilon4 allele. Lancet Neurol 10: , 280–288. |
[6] | Alzheimer’s Association ((2016) ) 2016 Alzheimer’s disease facts and figures. Alzheimers Dement 12: , 459–509. |
[7] | Reitz C , Mayeux R ((2014) ) Alzheimer disease: Epidemiology, diagnostic criteria, risk factors and biomarkers. Biochem Pharmacol 88: , 640–651. |
[8] | Koss E , Edland S , Fillenbaum G , Mohs R , Clark C , Galasko D , Morris JC ((1996) ) Clinical and neuropsychological differences between patients with earlier and later onset of Alzheimer’s disease: A CERAD analysis. Neurology 46: , 136–141. |
[9] | van der Vlies AE , Koedam EL , Pijnenburg YA , Twisk JW , Scheltens P , van der Flier WM ((2009) ) Most rapid cognitive decline in APOE epsilon4 negative Alzheimer’s disease with early onset. Psychol Med 39: , 1907–1911. |
[10] | Cho H , Seo SW , Kim JH , Suh MK , Lee JH , Choe YS , Lee KH , Kim JS , Kim GH , Noh Y , Ye BS , Kim HJ , Yoon CW , Chin J , Na DL ((2013) ) Amyloid deposition in early onset versus late onset Alzheimer’s disease. J Alzheimers Dis 35: , 813–821. |
[11] | Marshall GA , Fairbanks LA , Tekin S , Vinters HV , Cummings JL ((2007) ) Early-onset Alzheimer’s disease is associated with greater pathologic burden. J Geriatr Psychiatry Neurol 20: , 29–33. |
[12] | Migliaccio R , Agosta F , Possin KL , Canu E , Filippi M , Rabinovici GD , Rosen HJ , Miller BL , Gorno-Tempini ML ((2015) ) Mapping the progression of atrophy in early- and late-onset Alzheimer’s disease. J Alzheimers Dis 46: , 351–364. |
[13] | Moller C , Vrenken H , Jiskoot L , Versteeg A , Barkhof F , Scheltens P , van der Flier WM ((2013) ) Different patterns of gray matter atrophy in early- and late-onset Alzheimer’s disease. Neurobiol Aging 34: , 2014–2022. |
[14] | Hare D , Ayton S , Bush A , Lei P ((2013) ) A delicate balance: Iron metabolism and diseases of the brain. Front Aging Neurosci 5: , 34. |
[15] | Peters DG , Connor JR , Meadowcroft MD ((2015) ) The relationship between iron dyshomeostasis and amyloidogenesis in Alzheimer’s disease: Two sides of the same coin. Neurobiol Dis 81: , 49–65. |
[16] | Ward RJ , Zucca FA , Duyn JH , Crichton RR , Zecca L ((2014) ) The role of iron in brain ageing and neurodegenerative disorders. Lancet Neurol 13: , 1045–1060. |
[17] | Bulk M , Abdelmoula WM , Nabuurs RJA , van der Graaf LM , Mulders CWH , Mulder AA , Jost CR , Koster AJ , van Buchem MA , Natte R , Dijkstra J , van der Weerd L ((2018) ) Postmortem MRI and histology demonstrate differential iron accumulation and cortical myelin organization in early- and late-onset Alzheimer’s disease. Neurobiol Aging 62: , 231–242. |
[18] | Nabuurs RJ , Hegeman I , Natte R , van Duinen SG , van Buchem MA , van der Weerd L , Webb AG ((2011) ) High-field MRI of single histological slices using an inductively coupled, self-resonant microcoil: Application to ex vivo samples of patients with Alzheimer’s disease. NMR Biomed 24: , 351–357. |
[19] | van Rooden S , Versluis MJ , Liem MK , Milles J , Maier AB , Oleksik AM , Webb AG , van Buchem MA , van der Grond J ((2014) ) Cortical phase changes in Alzheimer’s disease at 7T MRI: A novel imaging marker. Alzheimers Dement 10: , e19–26. |
[20] | van Rooden S , Maat-Schieman ML , Nabuurs RJ , van der Weerd L , van Duijn S , van Duinen SG , Natte R , van Buchem MA , van der Grond J ((2009) ) Cerebral amyloidosis: Postmortem detection with human 7.0-T MR imaging system. Radiology 253: , 788–796. |
[21] | van Rooden S , Doan NT , Versluis MJ , Goos JD , Webb AG , Oleksik AM , van der Flier WM , Scheltens P , Barkhof F , Weverling-Rynsburger AW , Blauw GJ , Reiber JH , van Buchem MA , Milles J , van der Grond J ((2015) ) 7T T(2)*-weighted magnetic resonance imaging reveals cortical phase differences between early- and late-onset Alzheimer’s disease. Neurobiol Aging 36: , 20–26. |
[22] | van Rooden S , Buijs M , van Vliet ME , Versluis MJ , Webb AG , Oleksik AM , van de Wiel L , Middelkoop HA , Blauw GJ , Weverling-Rynsburger AW , Goos JD , van der Flier WM , Koene T , Scheltens P , Barkhof F , van de Rest O , Slagboom PE , van Buchem MA , van der Grond J ((2016) ) Cortical phase changes measured using 7-T MRI in subjects with subjective cognitive impairment, and their association with cognitive function. NMR Biomed 29: , 1289–1294. |
[23] | Ayton S , Fazlollahi A , Bourgeat P , Raniga P , Ng A , Lim YY , Diouf I , Farquharson S , Fripp J , Ames D , Doecke J , Desmond P , Ordidge R , Masters CL , Rowe CC , Maruff P , Villemagne VL , Australian Imaging B, Lifestyle Research Group, Salvado O , Bush AI ((2017) ) Cerebral quantitative susceptibility mapping predicts amyloid-beta-related cognitive decline. Brain 140: , 2112–2119. |
[24] | van Duijn S , Bulk M , van Duinen SG , Nabuurs RJ , van Buchem MA , van der Weerd L , Natte R ((2017) ) Cortical iron reflects severity of Alzheimer’s disease. J Alzheimers Dis 60: , 1533–1545. |
[25] | van Duijn S , Nabuurs RJ , van Rooden S , Maat-Schieman ML , van Duinen SG , van Buchem MA , van der Weerd L , Natte R ((2011) ) MRI artifacts in human brain tissue after prolonged formalin storage. Magn Reson Med 65: , 1750–1758. |
[26] | Shepherd TM , Thelwall PE , Stanisz GJ , Blackband SJ ((2009) ) Aldehyde fixative solutions alter the water relaxation and diffusion properties of nervous tissue. Magn Reson Med 62: , 26–34. |
[27] | Braak H , Braak E , Kalus P ((1989) ) Alzheimer’s disease: Areal and laminar pathology in the occipital isocortex. Acta Neuropathol 77: , 494–506. |
[28] | van Duijn S , Nabuurs RJ , van Duinen SG , Natte R ((2013) ) Comparison of histological techniques to visualize iron in paraffin-embedded brain tissue of patients with Alzheimer’s disease. J Histochem Cytochem 61: , 785–792. |
[29] | Shaffer JP ((1986) ) Modified sequentially rejective multiple test procedures. J Am Stat Assoc 81: , 826–831. |
[30] | Fukunaga M , Li TQ , van Gelderen P , de Zwart JA , Shmueli K , Yao B , Lee J , Maric D , Aronova MA , Zhang G , Leapman RD , Schenck JF , Merkle H , Duyn JH ((2010) ) Layer-specific variation of iron content in cerebral cortex as a source of MRI contrast. Proc Natl Acad Sci U S A 107: , 3834–3839. |
[31] | Langkammer C , Krebs N , Goessler W , Scheurer E , Ebner F , Yen K , Fazekas F , Ropele S ((2010) ) Quantitative MR imaging of brain iron: A postmortem validation study. Radiology 257: , 455–462. |
[32] | Wallace MN , Cronin MJ , Bowtell RW , Scott IS , Palmer AR , Gowland PA ((2016) ) Histological basis of laminar MRI patterns in high resolution images of fixed human auditory cortex. Front Neurosci 10: , 455. |
[33] | Stuber C , Morawski M , Schafer A , Labadie C , Wahnert M , Leuze C , Streicher M , Barapatre N , Reimann K , Geyer S , Spemann D , Turner R ((2014) ) Myelin and iron concentration in the human brain: A quantitative study of MRI contrast. Neuroimage 93: (Pt 1), 95–106. |
[34] | van Bergen JM , Li X , Hua J , Schreiner SJ , Steininger SC , Quevenco FC , Wyss M , Gietl AF , Treyer V , Leh SE , Buck F , Nitsch RM , Pruessmann KP , van Zijl PC , Hock C , Unschuld PG ((2016) ) Colocalization of cerebral iron with amyloid beta in mild cognitive impairment. Sci Rep 6: , 35514. |
[35] | O’Callaghan J , Holmes H , Powell N , Wells JA , Ismail O , Harrison IF , Siow B , Johnson R , Ahmed Z , Fisher A , Meftah S , O’Neill MJ , Murray TK , Collins EC , Shmueli K , Lythgoe MF ((2017) ) Tissue magnetic susceptibility mapping as a marker of tau pathology in Alzheimer’s disease. Neuroimage 159: , 334–345. |
[36] | Frisoni GB , Pievani M , Testa C , Sabattoli F , Bresciani L , Bonetti M , Beltramello A , Hayashi KM , Toga AW , Thompson PM ((2007) ) The topography of grey matter involvement in early and late onset Alzheimer’s disease. Brain 130: , 720–730. |
[37] | Koedam EL , Lauffer V , van der Vlies AE , van der Flier WM , Scheltens P , Pijnenburg YA ((2010) ) Early-versus late-onset Alzheimer’s disease: More than age alone. J Alzheimers Dis 19: , 1401–1408. |
[38] | Ayton S , Faux NG , Bush AI , Alzheimer’s Disease Neuroimaging Initiative ((2015) ) Ferritin levels in the cerebrospinal fluid predict Alzheimer’s disease outcomes and are regulated by APOE. Nat Commun 6: , 6760. |
[39] | Zecca L , Youdim MB , Riederer P , Connor JR , Crichton RR ((2004) ) Iron, brain ageing and neurodegenerative disorders. Nat Rev Neurosci 5: , 863–873. |
[40] | Silvestri L , Pagani A , Camaschella C ((2008) ) Furin-mediated release of soluble hemojuvelin: A new link between hyoxia and iron homeostasis. Blood 111: , 924–931. |
[41] | Lei P , Ayton S , Finkelstein DI , Spoerri L , Ciccotosto GD , Wright DK , Wong BX , Adlard PA , Cherny RA , Lam LQ , Roberts BR , Volitakis I , Egan GF , McLean CA , Cappai R , Duce JA , Bush AI ((2012) ) Tau deficiency induces parkinsonism with dementia by impairing APP-mediated iron export. Nat Med 18: , 291–295. |

