Recognizing Patterns: Spatial Analysis of Observed Microbial Colonization on Root Surfaces
 Hannes Schmidt1*
  Naoise Nunan2
  Alexander Höck1
  Thilo Eickhorst3
  Christina Kaiser4
  Dagmar Woebken1
  Xavier Raynaud2*
- 1Division of Microbial Ecology, Department of Microbiology and Ecosystem Science, Research Network ‘Chemistry Meets Microbiology’, University of Vienna, Vienna, Austria
- 2Sorbonne Université, CNRS, IRD, INRA, P7, UPEC, Institute of Ecology and Environmental Sciences - Paris, Paris, France
- 3Faculty 2 Biology/Chemistry, University of Bremen, Bremen, Germany
- 4Terrestrial Ecosystem Research, Department of Microbiology and Ecosystem Science, Research Network ‘Chemistry Meets Microbiology’, University of Vienna, Vienna, Austria
Root surfaces are major sites of interactions between plants and associated microorganisms. Here, plants and microbes communicate via signaling molecules, compete for nutrients, and release substrates that may have beneficial or harmful effects on each other. Whilst the body of knowledge on the abundance and diversity of microbial communities at root-soil interfaces is now substantial, information on their spatial distribution at the microscale is still scarce. In this study, a standardized method for recognizing and analyzing microbial cell distributions on root surfaces is presented. Fluorescence microscopy was combined with automated image analysis and spatial statistics to explore the distribution of bacterial colonization patterns on rhizoplanes of rice roots. To test and evaluate the presented approach, a gnotobiotic experiment was performed using a potential nitrogen-fixing bacterial strain in combination with roots of wetland rice. The automated analysis procedure resulted in reliable spatial data of bacterial cells colonizing the rhizoplane. Among all replicate roots, the analysis revealed an increasing density of bacterial cells from the root tip to the region of root cell maturation. Moreover, bacterial cells showed significant spatial clustering and tended to be located around plant root cell borders. The quantitative data suggest that the structure of the root surface plays a major role in bacterial colonization patterns. Possible adaptations of the presented approach for future studies are discussed along with potential pitfalls such as inaccurate imaging. Our results demonstrate that standardized recognition and statistical evaluation of microbial colonization on root surfaces holds the potential to increase our understanding of microbial associations with roots and of the underlying ecological interactions.
Introduction
The rhizosphere is of fundamental importance for nutrient cycling in terrestrial ecosystems. Within this small volume of soil, plants and microorganisms interact closely with each other. These interactions are likely to be strongest at the root surface (i.e., the rhizoplane) where root–derived substrates are accessible to microbial colonizers and microbial metabolites are immediately available for plant uptake. The rhizoplane can therefore be considered as one of the main regions driving nutrient flow and transformation in the rhizosphere. It differs in many aspects from bulk soil, including containing a specific microbial community with high cell density and reduced levels of diversity (Philippot et al., 2013; Reinhold-Hurek et al., 2015). While the diversity of rhizosphere and rhizoplane microorganisms is getting greater attention, information on the spatial organization of this diversity is still scarce. However, detailed knowledge of the spatial localisation and the microniches that root-associated microbes inhabit may shed light on the interactions between plant hosts and their microbiome and allow us to determine the magnitude of these interactions.
Due to their close association with plants, microorganisms colonizing the rhizoplane experience a range of stressors and/or rewards through mechanical or chemical interactions (e.g., root elongation or exudation; Lebeis et al., 2015; Dupuy and Silk, 2016). In turn, plants can be strongly influenced by the rhizoplane fraction of the root microbiome, for instance via the release of signaling molecules or via enzymatic cell wall degradation that may help microbes to enter the endospheric space of roots (Oldroyd, 2013; Reinhold-Hurek et al., 2015; Hacquard et al., 2017). Microbial cells that are able to thrive along this dynamic interface and to act upon plants are likely to colonize nutritional or spatial niches, which may help them to proliferate as clusters of cells or biofilms (Danhorn and Fuqua, 2007; Cardinale, 2014). Qualitative microscopic observations often report non-uniform rhizoplane colonization patterns, which suggests that the bulk of the interactions between roots and associated microorganisms occurs primarily in specific microniches (Foster and Bowen, 1982; Ofek et al., 2012; Cardinale, 2014; Hartmann et al., 2015). For example, nitrogen-fixing bacteria associated with sugar cane or rice were observed to particularly colonize root tips and lateral root junctions, with the latter providing potential entry points into the root endosphere (James et al., 1994; Faoro et al., 2017). While these observations provide us with valuable insights into host-microbe interactions, only quantitative approaches that recognize and evaluate spatial aspects of rhizoplane colonization allow for a reliable identification of potential hotspots of plant-microbe interactions. To date, few studies have measured spatial descriptors of rhizoplane colonization at the micrometer scale, such as bacterial clustering or communication distances between individual cells (Dandurand et al., 1997; Gantner et al., 2006; Watt et al., 2006). However, these microscale data, along with standardized approaches in microscopy and data interpretation (e.g., cell numbers per root unit; Cardinale, 2014; Schmidt and Eickhorst, 2014), are necessary for obtaining comparable data on root colonization and for estimating the dimensions of belowground substrate flux between microbiota and plants.
Spatial statistics provide useful tools to study patterns in sets of 2D points (Ilian et al., 2008), such as those that arise from the growth of microbial cells on a given surface. These methods provide us not only with a means to analyse spatial patterns but also allow us to make hypotheses about the constraints and drivers which underlie observed spatial patterns. In the field of microbial ecology, such approaches have been proven useful to study and model microbial cell distributions within the soil matrix (Raynaud and Nunan, 2014), the affiliation of bacterial phyla with different lichen species (Cardinale et al., 2012), as well as to analyze intra- and inter-specific interactions between bacterial cells on leaf surfaces and their relation to morphological features such as stomata and veins (Remus-Emsermann et al., 2014; Esser et al., 2015).
We therefore aimed at establishing a standardized workflow including fluorescence microscopy, automated signal recognition, and spatial statistics to investigate the arrangement of microbial rhizoplane colonization. The whole procedure has been compiled into imageJ and R scripts that are available online. We will present examples of analyzing the distribution of a putative nitrogen fixing bacterial strain on roots of wetland rice, one of the most important crop plants worldwide. Firstly, we describe the workflow including image acquisition, automated signal recognition, and statistical analyses of spatial patterns. Secondly, we present an application of the analysis pipeline on systematically obtained fluorescence micrographs to show the potential of such analyses in an ecological context. Thirdly, we will discuss the potentials and pitfalls of pattern recognition analyses to study the microbial colonization of root surfaces. The presented protocol and pipeline can be widely used to target mechanistic questions regarding root colonization but also to obtain insights into the ecology of plant-microbe interactions.
Materials and Methods
Setup of Gnotobiotic Experiment
The gnotobiotic experiment was performed with young wetland rice plants (Oryza sativa) and the in-house bacterial strain Kosakonia sacchari which, in previous experiments, has been shown to associate well with rice plants under nitrogen-fixing conditions (unpublished results). The glume of rice seeds (cultivar IR64) was removed by hand and seeds were surface sterilized by washing in 5% NaOCl for 10 min, followed by washing in 2% Na2SO3 for 3 min, and 6 successive washes in autoclaved MQ water (1 min each). Rice seedlings were pre-germinated on sterile plates with autoclaved LB medium (Bertani, 1951) in the dark at approximately 25°C for 10 days. Glass tubes (length: 25 cm, diameter: 2.5 cm) were autoclaved, sealed with aluminum foil, and baked at 300°C for 4 h. Nitrogen-free Yoshida solution was prepared according to Yoshida et al. (1976) without the addition of NH4NO3. A 1.5% gellan gum medium (Gelrite, Carl Roth, Germany) was autoclaved and kept at 70°C until planting of seedlings in tubes. K. sacchari was cultivated in Erlenmeyer flasks filled with 20 mL semisolid nitrogen-free NFCC medium (Mirza and Rodrigues, 2012) in an atmosphere containing 1% oxygen at 19°C without shaking. After reaching exponential phase, the cells were harvested by centrifugation for 10 min at 5,000 g, the supernatant was discarded, and the cells were resuspended in nitrogen-free Yoshida solution to a concentration of approximately 104 cells μL−1.
Only germinated seedlings free of microbial and fungal contamination were used for the gnotobiotic experiments. The radicle of the seedling (root length approximately 1 cm) was submerged in 500 μL of K. sacchari for 30 min under sterile conditions. Following inoculation, each seedling was transferred into an individual glass tube filled with 1.5% gellan gum medium with the radicle facing downwards into the medium. A layer of approx. 1 cm nitrogen-free Yoshida solution was added on top of the gel surface to mimic the submerged conditions of rice cultivation without completely drowning the aboveground parts of the plants. Individual tubes were tightly sealed with autoclaved wool and kept in a greenhouse for 2 weeks exposing the plants to a day-and-night cycle of 14 +10 h with average temperatures of 30° and 22°C, respectively. The tubes were opened under sterile conditions every 3 days to allow for an exchange of the atmosphere, to replace the Yoshida solution, and to inspect for potential contamination. Sterile controls without the bacterial inoculum were prepared in the same way.
Sample Preparation for Microscopy
After 16 days of growth in the greenhouse, the rice plants were gently removed from the glass tubes under sterile conditions. The roots were immediately subjected to chemical fixation in 4% formaldehyde solution for 3 h at 4°C. Followed by 2 washes in 1 × phosphate-buffered saline (PBS), the roots were stored in a mixture of 2:3 PBS:EtOH (vol:vol) at −20°C until further processing. For downstream microscopic analyses, only primary nodal roots were used to increase comparability among the replicates. Staining of rhizoplane-associated bacteria with SYBR-Green I (Lumiprobe, Germany) and preparation of the roots on objective slides for fluorescence microscopy was performed as described in Richter-Heitmann et al. (2016). In addition, bacteria were visualized on replicate root samples via CARD-FISH as described in Schmidt and Eickhorst (2014) with slight modifications (see Supplementary Materials). To reduce the detachment of bacterial cells from the rhizoplane prior to microscopy the number of washing steps was limited to the minimum (5 washing steps for CARD-FISH) while only soft spring-steel tweezers were used to handle roots at the part that was not used for imaging.
Image Acquisition
One nodal root per replicate rice plant (n = 3) was chosen for image acquisition. For each individual root, image stacks were taken in a systematic manner from three root regions: starting from right behind the apical meristem (i.e., zone of cell division; n = 3), via the zone of cell elongation (n = 3), to the zone of cell maturation (n = 3; Figure 1). For each root region, a fixed distance of 300 μm between the individual image stacks was chosen to avoid overlap but to ensure that the images were still obtained from the same region. The distance of 5,000 μm between the root regions was selected based on previous observations of nodal root development taken from 4 week old rice plants. A confocal laser scanning microscope (Leica TCS SP8X, Leica, Germany) equipped with a 63x glycerol objective and a white-light laser was used for image acquisition. SYBR Green I was excited at a wavelength of 489 nm and recorded from 500 to 540 nm. In the following, these settings will be referred to as the “dye channel.” Background autofluorescence of the root surface, giving information on root cell walls, was recorded via excitation at 565 nm and emission from 580 to 750 nm (in the following referred to as the “autofluorescence channel”). The following settings were used for each z-stack: image size: 184.5 × 184.5 μm, image resolution: 1024 × 1024 pixels, bit depth: 8 per channel, scan speed 100 Hz, line averaging: 4, frame averaging: 1, z-stack thickness: 10 μm, slice distance: 0.5 μm, zoom factor 1, pinhole: 1 AU. Image stacks were stored as Leica *.lif files without post-processing. Two other z-stacks with similar acquisition settings were also acquired to test the generality of the data extraction procedure. These z-stacks corresponded to an additional root region (zone of lateral root emergence; Supplementary Figure S1) and CARD-FISH-stained rhizoplanes (see Supplementary Figure S2).
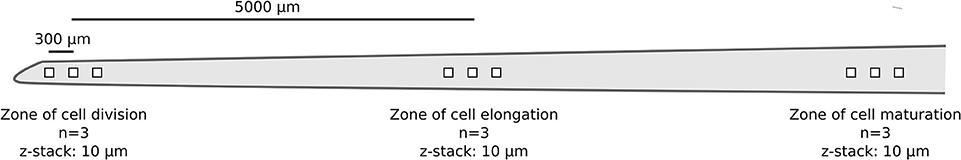
Figure 1. Schematic representation showing the main parameters of microscopic image acquisition (true-to-scale) per replicate root (n = 3). Distances between the individual z-stacks (300 μm) and root regions (5,000 μm) are indicated by bars.
Image Analysis
All microscopic images (raw *.lif files) were processed with Fiji (Schindelin et al., 2012) to extract information on the spatial distribution of bacterial cells as well as properties of their environment (root cell walls). Extracted data was then loaded into R 3.4 (R Development Core Team, 2017) and converted to spatstat objects (Baddeley et al., 2015) for analyses. All codes used in this manuscript (Fiji macro and R codes) are available for download at https://github.com/xraynaud/microbial-cell-detection. The overall detection procedure is shown in Figure 2 and specific details are given below.
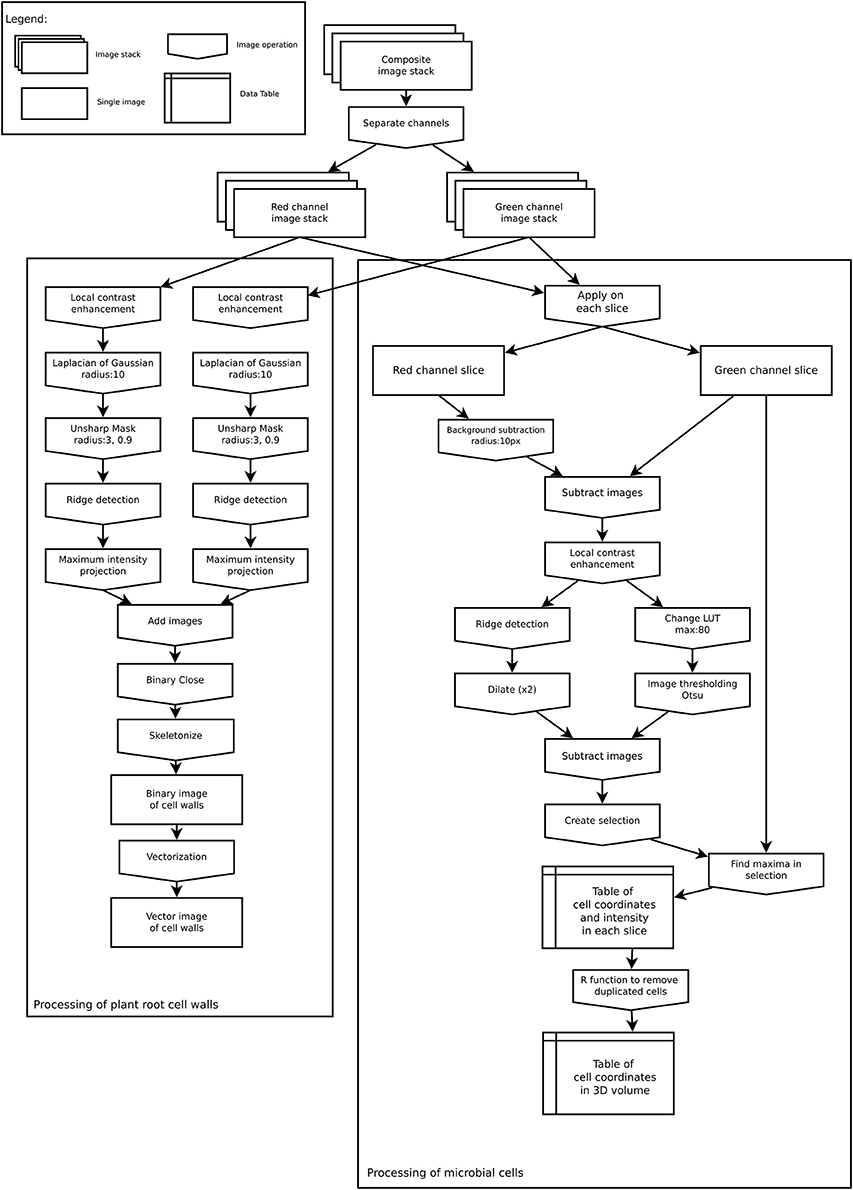
Figure 2. Image analysis workflow to extract root cell walls (Left) and microbial coordinates (Right).
Detection of Root Cell Walls
The spatial organization of root cell walls was extracted from both autofluorescence and dye channels. Both channels were processed similarly. First, a local contrast enhancement filter was applied to all slices. Then a 3D Laplacian of Gaussian filter (radius 10 μm) was applied to all slices followed by an Unsharp mask filter. These procedures allowed for the removal of all small features from images (such as bacterial cells), retaining only the larger ones. From these processed images, linear structures were identified in each slice using the Fiji plugin ij-ridgedetection (Steger, 1996; Wagner et al., 2017) to produce a binary 3D image set of root cell walls. 3D slices were then merged into a single 2D image, saved as TIFF black and white image, and converted to vector format (SVG) using the software autotrace (http://autotrace.sourceforge.net/). SVG files were then loaded into R and converted to a spatstat line segment pattern (psp object) for further analysis.
Detection of Bacterial Cells
The following procedure was applied to extract the coordinates of bacterial cells from each slice in the dye channel. First, the autofluorescence channel was subtracted from the dye channel as root cell walls were visible in both channels. This subtraction allowed for the removal of unwanted features from the dye channel prior to processing. Then, for each slice of the z-stack, a local enhancement filter was applied to the resulting image, which was thereafter thresholded following Otsu's method (Otsu, 1979). In parallel, a ridge detection filter was applied to each slice to identify unwanted linear features in the image. The linear features that were detected were then subtracted from each thresholded image. Because bacterial cells sometimes occur in groups of several individual cells, it was not possible to extract cells from the thresholded image. The thresholded images were thus used as a selection mask to look for signal maxima in the dye channel slice. These signal maxima were assumed to correspond to individual cells and their coordinates were saved into a table. This approach allowed us to obtain coordinates from cell clusters that sometimes appeared as bright spots with low signal variations due to scattered light. In the resulting table, each identified cell was characterized by its x, y, and z coordinates, as well as the measured signal intensity at this position.
As a single bacterial cell (approximately 1 μm in diameter) could produce a signal in two or three consecutive slices of the z-stack (slice distance: 0.5 μm), the coordinates were processed in R to remove duplicate cells. Coordinates in consecutive slices were assumed to correspond to the same cell if they were less than 0.9 μm apart. Where this occurred, the z coordinate of the cell was linearly interpolated from the signal intensity measured in each slice in which the cell was visible, assuming that the greater the intensity in a slice the closer the cell was to this slice. Finally, the obtained 3D distribution of cells was projected onto the 2D x,y plane for analysis. Although this might slightly distort the true distribution of cells due to the cylindrical shape of roots, preliminary tests indicated that this small distortion was very limited and did not alter the geometrical properties of distributions for roots having diameters similar to nodal rice roots at this development stage (data not shown). In rare cases, the extracted data was manually cleaned by removing coordinates that were falsely detected as bacterial cells (see Results section).
Data Analysis
All data analyses were carried out using R 3.4 (R Development Core Team, 2017). The spatial distribution of bacterial cells and root cell walls were analyzed using packages spatstat (Baddeley et al., 2015) and movMF (Hornik and Grün, 2014). The effect of root region on a number of spatial features was determined using mixed effect ANOVA (lme4 package, Bates et al., 2015) with root replicates set as the random effect.
Root Cell Walls
Root cells are approximately rectangular in shape when viewed in microscopic images, where the longer sides correspond to the growing direction of the root. For each plant cell, cell walls perpendicular to the microscope focal plane (anticlinal cell walls) were generally identified as several small line segments. To obtain the orientation of plant cells from the image, the angles of each segment with the horizontal were calculated and a mixture of three von Mises distributions was fitted to this data (movMF R package, Hornik and Grün, 2014). The total length of segments from the three identified sets was calculated and the orientation of plant cells, which correspond to the growing direction of the root, was assumed to correspond to the set having the greatest total length.
At the surface of roots, these cell walls form grooves which can be colonized by microbial cells. In the following, we will refer to root cell walls when dealing with root features and root cell borders when dealing with these grooves between plant cells.
Bacterial Cell Distributions
Observed distributions of bacterial cells were analyzed assuming they could be described as planar point patterns, i.e., cell distributions were considered to be set of single points (no volume) observed in a window (the image field of view). In order to characterize these distributions, different indices and summary functions were calculated. First, to obtain a broad overview of the spatial organization of cells, we calculated the intensity of the point process (i.e., the number of cells per unit surface) and the Hopkins-Skellam index of aggregation. Second, to get a better view of cell distributions characteristics at different spatial scales, the pair correlation function (g(r)), the empty space function (H(r)), and the nearest neighbor distance distribution function (D(r)) were also calculated. The pair correlation function is related to the number of neighbors a point of the distribution has at a distance r. The empty space function is the distribution of distances between points of the point pattern and an arbitrary location. As H(r) is a probability function, it gives the probability that there will be a point lying within distance r of any arbitrary location in the observed window. The nearest neighbor distance distribution function of a point pattern is the probability distribution of the distance r between a point to its nearest neighbor. Because preliminary inspection suggested that the density of cells was not homogeneous (i.e., the density of points changed depending on the location in the field of view), the inhomogeneous counterparts of these functions (Baddeley et al., 2015) were used, which require an estimate of the intensity function of the point distributions across the observed window. This estimate was calculated using a gaussian smoothing kernel with a bandwidth of 60.5 μm for all images. The bandwidth size was chosen because it allowed the capture of the large scale variations in cell density within the image but ignored smaller scale variations. The bandwidth size was also sufficiently large to ensure that interactions between bacterial cells were very limited, as interaction distances between cells have been estimated to lie within 20 μm of cells in most cases (Gantner et al., 2006; Franklin and Mills, 2008). The summary functions of the observed distributions were tested for significant aggregation or regularity using Monte-Carlo simulations envelopes. For this purpose, summary functions of 99 inhomogeneous Poisson processes (i.e., a point process for which the locations of points are independent of the presence of neighbors and in which spatial variations in intensity are accounted for) where calculated and compared to the measured cell distributions using the Diggle-Cressie-Loosmore-Ford goodness-of-fit test (Baddeley et al., 2014).
Finally, the relations between bacterial cells and root cell borders were characterized using two different metrics. First of all, the distances between each bacterial cell and the nearest root cell wall segment was measured. This was done to determine whether the distributions of bacterial cells were related to root cell borders. For each bacterial cell, the distance was considered to be positive or negative depending on the side of the root cell wall the bacterial cell was found. In this way, the shape of the distribution of distances provided information on the spatial relations between bacterial cells and root cell borders: a uniform distribution indicated no relationship meaning that the cell distributions were independent of cell borders, a humped shaped distribution of distances centered around 0 (the position of the cell walls, ± 2 μm due to the precision of the data extraction) indicated that cells were distributed preferentially near root cell borders. Secondly, the pair orientation distribution function was calculated for pairs of cells less than 25 μm apart. This function describes the distribution of angles between segments joining two cells and the horizontal (Baddeley et al., 2015). If the distribution of points is isotropic, the orientation of neighboring cells does not have a preferred direction. However, if it is not isotropic, the function determines the angle of the preferred direction with the horizontal. The effect of the root cell border on bacterial distributions was determined by comparing the directions of bacterial cell pair orientations with those of root cell walls in each z-stack.
Results
In the main experiment, we acquired 27 individual z-stacks from three replicate rice roots that were colonized by K. sacchari for 16 days after inoculation. A representative example of the z-stacks obtained from the zone of cell maturation and data extracted thereof is shown in Figure 3. Z-projections of the dye and autofluorescence channels are shown in Figures 3a,b along with the superimposition of both channels (Figure 3c) and the extracted data (Figure 3d). Images and data extraction for the other root regions are given in Supplementary Figure S3 (zone of cell division) and Supplementary Figure S4 (zone of cell elongation).
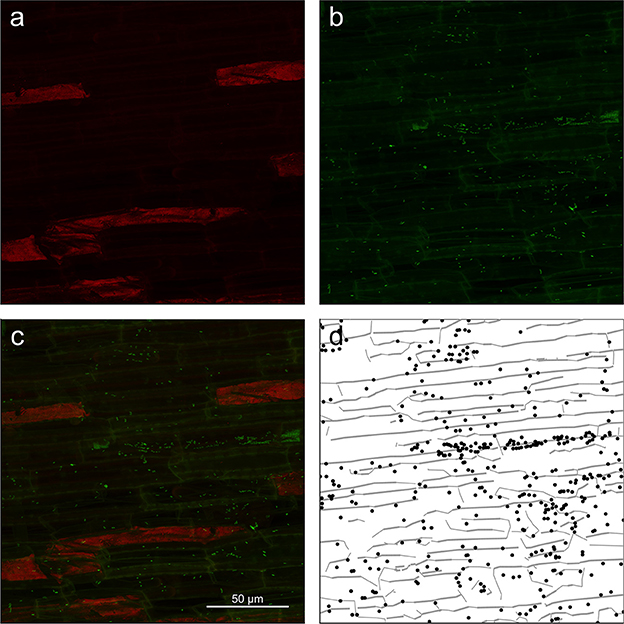
Figure 3. Z-projection from the root mature region of (a) autofluorescence channel (shown in red) of the image showing only root cell walls, (b) dye channel (in green) showing both plant roots cell walls and microbial cells, (c) composite image of the surface of root showing root cell walls (yellowish lines) as well as microbial cells (green dots). (d) Extracted data from the image with root cell walls shown as gray lines and microbial cells as black dots.
Quality of Data Extracted From Microscopic Images
Careful visual inspection of the microscopic images and the extracted data indicated that the signal extraction procedure allowed for the capture of most of the microbial cells, as well as some important information on their environment, such as root cell walls (Figure 3, Supplementary Figures S3, S4). Large unwanted visible structures were automatically and correctly discarded during the data extraction procedure (see large red patches in Figure 3). However, we also found that, in some cases, the procedure produced a high number of false positives or did not extract microbial cell coordinates correctly. False detection of cells arose under two conditions: firstly, overall low signal intensity in images (Supplementary Figure S5) or strong differences in signal intensity between the autofluorescence and dye channel (Supplementary Figure S6) resulted in an inefficient first step of the procedure (autofluorescence to dye subtraction; 6 z-stacks affected). In the latter case, junctions between root cell walls were slightly brighter than their surroundings and were detected as false positives. In addition, the overall high intensity level of the images left some bacterial cells undetected (see Supplementary Figure S6). Secondly, SYBR Green I was observed to also bind to root cell nucleic acids. In some z-stacks, plant cell nuclei were visible as green patches and detected as a small cluster of cells (3 z-stacks). Images with a low overall intensity were discarded. In other cases, false positives were manually removed from the images.
Colonization Density and Spatial Distribution of Bacteria on the Rhizoplane
The number of observed cells ranged from 90 to 3,398 per z-stack (n = 27), which corresponded to densities of 2.6 × 10³-9.9 × 10⁴ cells per mm2 of root surface. There were significant changes in cell density between the root regions studied (Figure 4). On average, there was a significant increase in cell numbers from the zone of cell division via the elongation zone to the mature region (GLM ANOVA, χ2 = 6,972.6, P < 0.001). Nevertheless, high variability in cell numbers was visible for each morphological region as well as between individual root replicates.
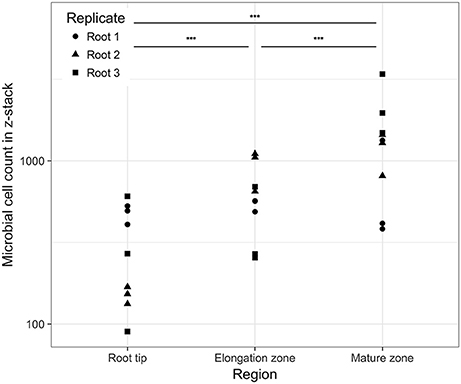
Figure 4. Cell counts (log scale) in the observed image as a function of the position on the root. Horizontal bars above the data indicate significant differences (P < 0.001) between regions.
Across all images, the nearest-neighbor distances ranged from 0.18 to 44.54 μm and bacterial distributions showed significant clustering (Hopkins-Skellam test, P < 0.001 for all z-stacks). These distances were highly skewed toward shorter distances. The median distance within images was 2.14 μm on average. The median of the nearest neighbor distance decreased slightly with the position along the root. Average values of 2.62, 1.93, and 1.88 μm were measured from the zone of cell division to the zone of cell maturation, respectively. Comparisons between summary statistics ginhom(r), Dinhom(r), and Hinhom(r) were calculated for all observed distributions and simulation envelopes of inhomogeneous Poisson distributions. These comparisons indicated that most observed distributions in the three root regions (21, 18, 27 distributions, respectively) were more aggregated than expected for complete spatial randomness for short distances < 10 μm (see Figure 5 for g and D functions of the distribution shown in Figure 3).
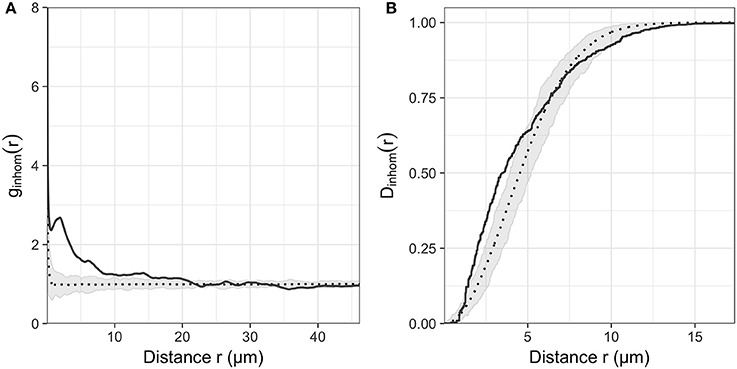
Figure 5. (A) Inhomogeneous pair correlation function ginhom(r) and (B) Nearest neighbor distance function Dinhom(r) of the microbial distribution shown in Figure 2. Gray envelope corresponds to the envelope of 99 realization of an inhomogeneous Poisson process of the same intensity as the observed distribution.
Relation Between Bacterial Distributions and Rhizoplane Features
In all images, bacterial cells were found to be closer to a root cell border than expected for complete spatial randomness. The distances between individual bacterial cells and the closest root cell border showed a symmetrical hump-shaped distribution (see Figure 6A for an example). Careful inspection of observed distributions and the estimation of the pair orientation function further indicated that the orientations of the lines between neighboring bacterial cells were not random and coincided with the orientation of root cells (Figure 6B). This was true for most observed distributions, for which the angle at which the pair orientation function reached its maximum was similar to the orientation of root cell walls (Figure 7).
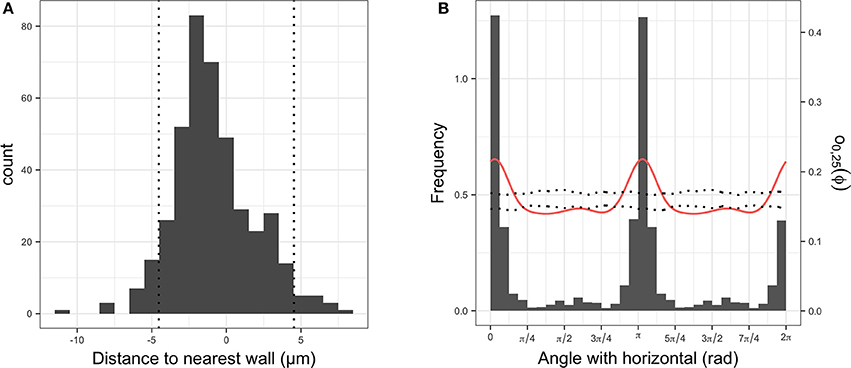
Figure 6. (A) Histogram of signed distances between plant root cells and their nearest cell wall. The two vertical dotted lines indicate the average distance between two parallel cell walls. (B) Histogram of angles between walls and horizontal (in gray), observed pair orientation function O0, 25(Φ) for cells less than 25 μm apart (i.e., distribution of angles between two cells and the horizontal; red line) and envelope of the pair orientation function for 99 simulation of complete spatial randomness point processes.
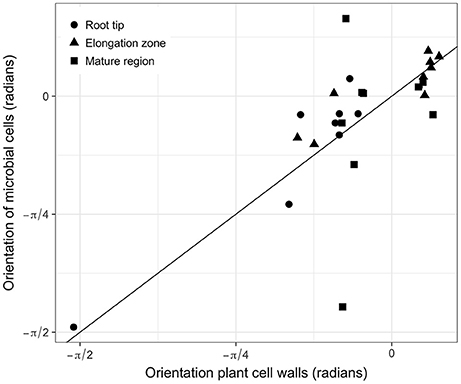
Figure 7. Relationships between the orientation of root cells and the angle at which the pair orientation function is maximum for all observed distributions. Solid line is the 1:1 line.
Discussion
Imaging Procedure and Data Acquisition
The aim of the paper was to provide a standardized method for analysing microbial cell distributions on the rhizoplane. The image analysis procedure was carried out using the Fiji software. Fiji, and ImageJ, upon which it is built, are multi-platform (Windows, Apple, Linux), general purpose, open-source software. Its main features include the availability of numerous plugins (e.g., ij-ridgedetection, which is used here), the possibility to develop new plugins for specific applications, as well as the automatized analysis of sets of images through the use of macros. Fiji is also able to directly import image stacks in the native Leica format that was used in this study. Other software such as daime (Daims et al., 2006) and IMARIS (Bitplane AG, Zürich, Switzerland) could have been used as well. However, we found that Fiji offered the most complete set of tools to extract the type of data needed for this study (identification of bacterial cells and linear features in images). Nevertheless, there are limitations to the procedure that the reader should be aware of. These are discussed below.
Choice of Dyes for Microbial Cell Visualization
SYBR Green I has been shown to give strong fluorescent signals that can be used to detect rhizoplane-colonizing microorganisms (Reinhold-Hurek et al., 2015; Richter-Heitmann et al., 2016). The signal-to-noise ratios obtained with SYBR Green I were found to be superior to other general nucleic acid stains such as DAPI. Nevertheless, it is virtually impossible to obtain images with a very high signal-to-noise ratio from rhizoplanes while avoiding capturing root autofluorescence in the dye channel. A lambda scan of an unstained, sterile root revealed that the peaks of root autofluorescence are in the regions that overlap with almost all commonly used fluorescent dyes (e.g., DAPI, fluorescein/SYBR Green I, Cyanine 3 - data not shown). Strategies to circumvent problems associated with low signal-to-noise ratios are the use of far-red dyes such as Cyanine 5.5 (Watt et al., 2006) or less commonly used dyes with high fluorescent quantum yields in combination with very narrow emission windows (Lukumbuzya and Daims, personal communication). However, these alternatives come with limitations, such as the inability to observe stained microbial cells by eye due to near-infrared emission wavelengths (e.g., Cy5.5: 694 nm).
Another option to enhance microbial cell detection while using fluorophores in the green and red light spectra is the use of CARD-FISH (Pernthaler et al., 2002). High signal intensities allow for a solid discrimination of microbial target cells on highly autofluorescent rhizoplanes (Schmidt and Eickhorst, 2014; Pett-Ridge and Firestone, 2017). Our pipeline was also tested with a z-stack showing CARD-FISH-stained bacteria on the surface of a soil-grown rice root (Supplementary Figure S2). The coordinates for most cells in the CARD-FISH image were correctly identified with the data extraction procedure. Despite varying signal intensities among target cells, a common feature of FISH applications to environmental samples (Amann and Fuchs, 2008), CARD-FISH is a valuable alternative to the presented approach when the aim is to detect specific target groups of microorganisms on roots.
Avoiding the natural autofluorescence of biological specimens via signal amplification or other strategies is also a reasonable approach to increase signal-to-noise ratios (Peredo and Simmons, 2018). In this study, however, we made use of the natural autofluorescence emitted by roots, a strategy that can be useful for the interpretation of confocal images in the context of plant-microbe interactions (Cardinale, 2014). In principle, every channel (e.g., blue, green, red) that emits background autofluorescence and that does not interfere with the specific fluorophore can be captured. We decided to acquire information from the red light spectrum to obtain background information on the surroundings of microbial rhizoplane colonizers. In this way it was possible to recognize morphological features such as root cell walls and to correlate them with microbial distribution patterns observed on rhizoplanes.
Image Quality and Data Extraction
Some z-stacks caused minor complications during data extraction (see Results section Quality of data extracted from microscopic images) stressing the importance of meticulous image acquisition prior to data extraction. It is necessary to avoid under- and over-exposure of the channels to enable the removal of the autofluorescence signals from the dye channel and to obtain an image with sufficiently high signal values for the image analysis procedure. It was challenging to record cell coordinates when signal intensities in the dye channel were too low (values < 100 for 8 bit images). This can, to a certain extent, be overcome by increasing the dynamic range of both autofluorescence and dye channels to bring values in the 0–255 range prior to image analysis. However, increasing the brightness of images creates additional noise, which in turn leads to an increase in false positives. In such cases, false positives were removed by hand at the end of the cell detection procedure prior to the removal of duplicated cells (Figure 2).
Signal recognition was sometimes challenging even with correctly exposed channels. Firstly, bacteria can form clusters at the surface of roots (see dense cluster at the right hand side of Figure 3 and bottom of Supplementary Figure S1). Such clusters often appear as a bright blur in which the identification of single cells is difficult due to light scattering that causes fluorescence signals to smear around objects (Sanderson et al., 2014). This is one of the reasons the presented analysis procedure does not detect cells based on their sizes but rather on variations in signal intensity within high intensity signal patches. Consequently, this approach might miss some bacteria in dense clusters where variation in signal intensity is not sufficient to allow detection of single cells. Spatial analyses carried out on extracted data (e.g., calculation of the pair correlation function) will underestimate aggregation so that the analyses presented here can be regarded as conservative. We believe, however, that this underestimation had a limited impact on our dataset because not all clusters were missed (see for example bottom of Supplementary Figure S4) and these clusters did not occur frequently. If clusters were more abundant, one way to obtain spatial information of single cells within clusters as well as more isolated cells could be to record images at two different signal intensities: a low intensity to detect features within clusters and a higher intensity to detect isolated cells (Eickhorst and Tippkötter, 2008) and to superimpose the resulting data. Secondly, single microbial cells can appear in two or three successive slices of images. As the extraction of cell coordinates is done independently for each slice of a z-stack, coordinates sets are post-processed in order to remove duplicate cells between two consecutive slices. This post-processing has the potential to make cell distributions more regular than they naturally occur as two neighboring cells in close proximity (i.e., separated by less than 0.9 μm) in two consecutive slices would be considered as a single cell. This would occur, however, only in very dense clusters of cells and most likely did not affect the results presented here.
Bacterial Cell Distributions on Roots
Overall, the analysis procedure resulted in reliable spatial data of bacterial cells colonizing the rhizoplane in different regions of the roots that matched well with earlier reports on microbial root colonization. The bacterial densities found here were of the same order of magnitude as those quantified manually on soil-grown rice roots (Schmidt and Eickhorst, 2014). Previous observations of increased bacterial densities at the base of lateral roots (e.g., James et al., 1994; Faoro et al., 2017) were in agreement with additional z-stacks analyzed in this study (Supplementary Figure S1), which supports the notion that lateral root junctions provide entry points for nitrogen-fixing bacteria with a facultative endophytic lifestyle. Although our dataset is limited to a small number of roots, in all observed images, bacterial cell distributions were not homogeneous, i.e., cells appeared as patches on the root surface. Taking this inhomogeneity into account the analyses still indicated that cells were clustered within distances of less than 10 μm, which corresponds to measured or modeled interaction distances for bacteria (Gantner et al., 2006; Franklin and Mills, 2008). High interaction rates between bacterial cells are thus to be expected on the rhizoplane even for single species populations.
Bacterial cell distributions also appeared to be strongly associated with root cell borders. Cells were closer to root cell borders than expected for completely random distributions and neighboring cells were oriented in the same direction as the growing direction of the roots. This suggests that root growth and activity is an important determinant of bacterial colonization of root surfaces (Dupuy and Silk, 2016). Indeed, epidermal cells of roots bulge at the surface and create grooves in between neighboring root cells. When observed from the top (as performed in this study), these grooves correspond to the cell walls that are visible in the microscopic images. Microscopic observations have indicated that mucilage and other exudates accumulate in these grooves (Foster and Bowen, 1982), which may create a suitable habitat for microbial growth. Furthermore, these grooves could also offer bacterial cells some physical protection, making them less susceptible to predation. Although replicating these observations is clearly needed, our data provide some elements to sketch how bacteria could colonize the rhizoplane. When roots grow into soil, some cells may attach to the root surface around the apex and near root cell borders, possibly because some exudates are released there, or because they form grooves that offer protection. This would be the origin of colonization of the region of root cell division and could lead to the observed inhomogeneity of microbial colonization patterns. Subsequently, microbial cell populations would grow through cell division with individual daughter cells preferentially growing along the junctions of cell borders. The resulting orientation of neighboring bacterial cells would then resemble the patterns found in this study. Similar observations were also reported for aboveground plant organs: bacterial cells have been observed to preferentially colonize leaves along cell borders (Verginer et al., 2010; Erlacher et al., 2015; Esser et al., 2015). Although the process of first contact of a microbial cell with a leaf surface may differ from a plant root, the mechanisms of finding a suitable micro-niche and growing along plant cell borders may represent the preferential way to colonize below- and above-ground plant organs by microorganisms.
In our experiment, only the emerging radicle of a seedling was inoculated with K. sacchari and immediately transferred into tubes filled with a sterile medium. At root sampling, the roots had an average length of 10 cm and the first centimeter of a root was analyzed for bacterial colonization in the zones of cell division, cell elongation, and cell maturation. The observation of high colonization densities in the zone of cell division after 16 days of root growth suggests that bacterial cells were able to keep up with an average root growth of approximately 0.6 mm per day. In our experimental system, recruitment of bacterial cells from the surrounding medium/soil can be excluded as the medium was sterile and bacterial cells were only introduced into the system through the inoculation process. Furthermore, the actual root cap was devoid of K. sacchari in almost all cases (data not shown). Consequently, the colonization of K. sacchari had to at least equal the root elongation in order to constantly colonize the zone of cell division behind the root tip.
Sterile controls without inoculum showed no bacterial signals (Supplementary Figure S7) and indicated that only K. sacchari cells colonized the roots in this experimental system. The increasing cell densities observed between the different root regions indicate that K. sacchari proliferated along the growing root. The strain used in this study is very closely related to type strain K. sacchari SP1T (99.89% 16S rRNA sequence identity, Chen et al., 2014), a heterotrophic bacterium that has been reported to colonize sugarcane plants and to exhibit plant-growth promotion through nitrogen fixation. In this study, the dense colonization of all observed regions indicates that carbon substrates provided by the plant (i.e., the necessary food source for K. sacchari in our experimental system) may not only have been available at the root tip but also at the elongation zone, as well was in the zone of maturity. In addition, our strain was observed to fix atmospheric nitrogen in association with rice roots in parallel experiments (data not shown) and could indeed act upon wetland rice (cultivar IR64) as plant-growth promoting rhizobacterium. However, an in situ confirmation of bacterial activity (i.e., nitrogen-fixation) on the single-cell level has yet to be reported for bacteria that colonize the rhizoplane. Such an endeavor (potentially via NanoSIMS) would benefit from the presented approach through the analysis of bacterial colonization patterns and a quantitative identification of hotspots of nutrient flux between roots and microbes. Furthermore, the analysis pipeline could be easily adapted to experiments with natural or synthetic multi-species communities and would allow for the assessment of competitive interactions among species in spatially structured communities. In order to determine how the spatial organization of communities affects these interactions, it would be interesting to trace the fate of stable isotope-labeled carbon, in the form of 13C-labeled photosynthates, into different components of the microbial communities and to determine how the spatial relations among single microbial cells affect allocation and competition for resources.
As an interesting aside, the significant differences in bacterial density along the rhizoplane, in particular when compared with the densities found in soil (101–104 mm−2; Raynaud and Nunan, 2014), show quite categorically how the micro-environment can affect microbial communities. To put the range of densities into perspective, a parallel with human societies may be drawn. Assuming that one bacterial cell mm−2 is equivalent to 1 person km−2, then the lowest rhizoplane density is roughly equivalent to the population density of a city such as Hamburg, whilst the highest density is greater than the population density of Dhaka, the world's most densely populated city (http://urbandata.unhabitat.org). There is a known super-linear power law relationship between population sizes of cities and many of their qualitative features such as wealth and innovation, which is believed to be driven by an increasing pace of social interactions with population density (Bettencourt et al., 2007). Similarly, microbial density may accelerate and/or alter interactions among microbes, such as competition, signaling (e.g., quorum sensing) or horizontal gene transfer, which may feed-back on the organization of the community in a qualitative way (West et al., 2007). It is therefore reasonable to assume, that not only do micro-environmental properties affect microbial metabolic activities but that they also have a significant effect on the ecology of microorganisms. Just as the practice of ignoring microscale phenomena is believed to have hindered progress in understanding and modeling C dynamics in soil (Wachinger et al., 2000; Falconer et al., 2015), the dramatic range in microbial densities found here and in other studies suggest that a complete understanding of many mechanisms in soil microbial ecology, and their relevance for ecosystem functioning can only be gained from a thorough examination of microscale processes.
Author Contributions
HS, NN, TE, CK, DW, and XR designed the study. HS and AH performed the gnotobiotic experiment and acquired the image stacks. XR compiled the imageJ and R scripts. XR, NN, and HS established and tested the analysis pipeline. XR analyzed the data. HS, NN, and XR wrote the manuscript.
Funding
This research was supported by bilateral programmes on scientific and technological cooperation between Austria and France (Amadée Project No. FR 11/2016, Amadeus Project No. 35603ZL) as well as between France and Germany (Procope Project No. 35486YA). HS was supported by a Marie Curie Intra European Fellowship within the 7th European Community Framework Program (grant agreement number 628361), by an Austrian Science Fund (FWF) project grant (P25700-B20 to DW) and by an ERC Starting grant (grant agreement number 636928, to DW) from the European Research Council (ERC) under the European Union's Horizon 2020 research and innovation program. TE was supported by a DAAD grant (grant number 57212076).
Conflict of Interest Statement
The authors declare that the research was conducted in the absence of any commercial or financial relationships that could be construed as a potential conflict of interest.
Acknowledgments
We would like to thank David Seki for his excellent assistance with gnotobiotic experiments. We would further like to thank the International Rice Research Institute for providing seeds of rice cultivar IR64.
Supplementary Material
The Supplementary Material for this article can be found online at: https://www.frontiersin.org/articles/10.3389/fenvs.2018.00061/full#supplementary-material
References
Amann, R., and Fuchs, B. M. (2008). Single-cell identification in microbial communities by improved fluorescence in situ hybridization techniques. Nat. Rev. Microbiol. 6, 339–348. doi: 10.1038/nrmicro1888
Baddeley, A., Diggle, P. P. J., Hardegen, A., Lawrence, T., Milne, R. K., and Nair, G. (2014). On tests of spatial pattern based on simulation envelopes. Ecol. Monogr. 84, 477–489. doi: 10.1890/13-2042.1
Baddeley, A., Rubak, E., and Turner, R. (2015). Spatial Point Patterns: Methodology and Applications with R. London: Chapman and Hall/CRC Press.
Bates, D., Mächler, M., Bolker, B., and Walker, S. (2015). Fitting linear mixed-effects models using lme4. J. Stat. Softw. 67, 1–48. doi: 10.18637/jss.v067.i01
Bertani, G. (1951). Studies on lysogenesis. I. The mode of phage liberation by lysogenic Escherichia coli. J. Bacteriol. 62, 293–300.
Bettencourt, L. M., Lobo, J., Helbing, D., Kühnert, C., and West, G. B. (2007). Growth, innovation, scaling, and the pace of life in cities. Proc. Nat. Acad. Sci. U.S.A. 104, 7301–7306. doi: 10.1073/pnas.0610172104
Cardinale, M. (2014). Scanning a microhabitat: plant-microbe interactions revealed by confocal laser scanning microscopy. Front. Microbiol. 5:94. doi: 10.3389/fmicb.2014.00094
Cardinale, M., Steinová, J., Rabensteiner, J., Berg, G., and Grube, M. (2012). Age, sun and substrate, triggers of bacterial communities in lichens. Environ. Microbiol. Rep. 4, 23–28. doi: 10.1111/j.1758-2229.2011.00272.x
Chen, M., Zhu, B., Lin, L., Yang, L., Li, Y., and An, Q. (2014). Complete genome sequence of Kosakonia sacchari type strain SP1T. Stand. Genomic Sci. 9, 1311–1318. doi: 10.4056/sigs.5779977
Daims, H., Lücker, S., and Wagner, M. (2006). Daime, a novel image analysis program for microbial ecology and biofilm research. Environ. Microbiol. 8, 200–213. doi: 10.1111/j.1462-2920.2005.00880.x
Dandurand, L. M., Schotzko, D. J., and Knudsen, G. R. (1997). Spatial patterns of rhizoplane populations of Pseudomonas fluorescens. App. Environ. Microbiol. 63, 3211–3217.
Danhorn, T., and Fuqua, C. (2007). Biofilm formation by plant-associated bacteria. Annu. Rev. Microbiol. 61, 401–422. doi: 10.1146/annurev.micro.61.080706.093316
Dupuy, L., and Silk, W. (2016). Mechanisms of early microbial establishment on growing root surface. Vadose Zone J. 15, 1–13. doi: 10.2136/vzj2015.06.0094
Eickhorst, T., and Tippkötter, R. (2008). Detection of microorganisms in undisturbed soil by combining fluorescence in situ hybridization (FISH) and micropedological methods. Soil Biol. Biochem. 40, 1284–1293. doi: 10.1016/j.soilbio.2007.06.019
Erlacher, A., Cardinale, M., Grube, M., and Berg, G. (2015). Biotic stress shifted structure and abundance of enterobacteriaceae in the lettuce microbiome. PLoS ONE 10:e0118068. doi: 10.1371/journal.pone.0118068
Esser, D. S., Leveau, J. H., Meyer, K. M., and Wiegand, K. (2015). Spatial scales of interactions among bacteria and between bacteria and the leaf surface. FEMS Microbiol. Ecol. 91:fiu034. doi: 10.1093/femsec/fiu034
Falconer, R. E., Battaia, G., Schmidt, S., Baveye, P., Chenu, C., and Otten, W. (2015). Microscale heterogeneity explains experimental variability and non-linearity in soil organic matter mineralisation. PLoS ONE, 10:e0123774. doi: 10.1371/journal.pone.0123774
Faoro, H., Rene Menegazzo, R., Battistoni, F., Gyaneshwar, P., do Amaral, F. P., Taulé, C., et al. (2017). The oil-contaminated soil diazotroph Azoarcus olearius DQS-4T is genetically and phenotypically similar to the model grass endophyte Azoarcus sp. BH72. Envir. Microbiol. Rep. 9, 223–238. doi: 10.1111/1758-2229.12502
Foster, R. C., and Bowen, G. (1982). “Plant surfaces and bacterial growth: the rhizosphere and rhizoplane prokaryotic pathogens and symbionts,” in Phytopathogenic Prokaryotes, 1, eds. M. S. Mount and G. H. Lacy (New York, NY: Academic Press), 159–189.
Franklin, R. B., and Mills, A. L. (2008). “The importance of microbial distribution in space and spatial scale to microbial ecology,” in The Spatial Distribution of Microbes in the Environment, eds R. B. Franklin and A. L. Mills (New York, NY: Kluwer Academic Publishers), 1–30.
Gantner, S., Schmid, M., Dürr, C., Schuhegger, R., Steidle, A., Hutzler, P., et al. (2006). In situ quantitation of the spatial scale of calling distances and population density-independent N-acylhomoserine lactone-mediated communication by rhizobacteria colonized on plant roots. FEMS Microbiol. Ecol. 56, 188–194. doi: 10.1111/j.1574-6941.2005.00037.x
Hacquard, S., Spaepen, S., Garrido-Oter, R., and Schulze-Lefert, P. (2017). Interplay Between Innate Immunity and the Plant Microbiota. Annu. Rev. Phytopathol. 55, 565–589. doi: 10.1146/annurev-phyto-080516-035623
Hartmann, A., James, E. K., deBruijn, F. J., Schwab, S., Rothballer, M., and Schmid, M. (2015). “In situ localization and strain-specific quantification of azospirillum and other diazotrophic plant growth-promoting rhizobacteria using antibodies and molecular probes,” in Handbook for Azospirillum: Technical Issues and Protocols, eds F. Cassan, Y. Okon, and C. Creus (Heidelberg: Springer), 45–64.
Hornik, K., and Grün, B. (2014). movMF: an R package for fitting mixtures of von Mises-Fisher distributions. J. Stat. Soft. 58, 1–31. doi: 10.18637/jss.v058.i10
Ilian, J., Penttinen, A., Stoyan, H., and Stoyan, D. (2008). Statistical Analysis and Modelling of Spatial Point Patterns. Chichester: Wiley.
James, E. K., Reis, V. M., Olivares, F. L., Baldani, J. I., and Döbereiner, J. (1994). Infection of sugar cane by the nitrogen-fixing bacterium Acetobacter diazotrophicus. J. Exper. Bot. 45, 757–766. doi: 10.1093/jxb/45.6.757
Lebeis, S. L., Paredes, S. H., Lundberg, D. S., Breakfield, N., Gehring, J., McDonald, M., et al. (2015). Salicylic acid modulates colonization of the root microbiome by specific bacterial taxa. Science 349, 860–864. doi: 10.1126/science.aaa8764
Mirza, B. S., and Rodrigues, J. L. (2012). Development of a direct isolation procedure for free-living diazotrophs under controlled hypoxic conditions. Appl. Env. Microbiol. 78, 5542–5549. doi: 10.1128/AEM.00714-12
Ofek, M., Hadar, Y., and Minz, D. (2012). Ecology of root colonizing Massilia (Oxalobacteraceae). PLoS ONE 7:e40117. doi: 10.1371/journal.pone.0040117
Oldroyd, G. E. (2013). Speak, friend, and enter: signalling systems that promote beneficial symbiotic associations in plants. Nat. Rev. Microbiol. 11, 252–256. doi: 10.1038/nrmicro2990
Otsu, N. (1979). A Threshold selection method from gray-level histograms. IEEE Trans. Syst. Man. Cybern. 9, 62–66. doi: 10.1109/TSMC.1979.4310076
Peredo, E. L., and Simmons, S. L. (2018). Leaf-FISH: Microscale Imaging of Bacterial Taxa on Phyllosphere. Front. Microbiol. 9:2669. doi: 10.3389/fmicb.2017.02669
Pernthaler, A., Pernthaler, J., and Amann, R. (2002). Fluorescence in situ hybridization and catalyzed reporter deposition for the identification of marine bacteria. Appl. Environ. Microbiol. 68, 3094–3101. doi: 10.1128/AEM.68.6.3094-3101.2002
Pett-Ridge, J., and Firestone, M. K. (2017). Using stable isotopes to explore root-microbe-mineral interactions in soil. Rhizosphere 3, 244–253. doi: 10.1016/j.rhisph.2017.04.016
Philippot, L., Raaijmakers, J. M., Lemanceau, P., and van der Putten, W. H. (2013). Going back to the roots: the microbial ecology of the rhizosphere. Nat. Rev. Microbiol. 11, 789–799. doi: 10.1038/nrmicro3109
Raynaud, X., and Nunan, N. (2014). Spatial ecology of bacteria at the microscale in soil. PLoS ONE 28:e87217. doi: 10.1371/journal.pone.0087217
R Development Core Team (2017). R: A Language and Environment for Statistical Computing. Vienna: R Development Core Team.
Reinhold-Hurek, B., Bünger, W., Burbano, C. S., Sabale, M., and Hurek, T. (2015). Roots shaping their microbiome: global hotspots for microbial activity. Annu. Rev. Phytopathol. 53, 403–424. doi: 10.1146/annurev-phyto-082712-102342
Remus-Emsermann, M. N. P., Lücker, S., Müller, D. B., Potthoff, E., Daims, H., and Vorholt, J. A. (2014). Spatial distribution analyses of natural phyllosphere-colonizing bacteria on Arabidopsis thaliana revealed by fluorescence in situ hybridization. Environ. Microbiol. 16, 2329–2340. doi: 10.1111/1462-2920.12482
Richter-Heitmann, T., Eickhorst, T., Knauth, S., Friedrich, M. W., and Schmidt, H. (2016). Evaluation of strategies to separate root-associated microbial communities: a crucial choice in rhizobiome research. Front Microbiol. 7:773. doi: 10.3389/fmicb.2016.00773
Sanderson, M. J., Smith, I., Parker, I., and Bootman, M. D. (2014). Fluorescence microscopy. Cold Spring Harb. Protoc. 2014, 1042–1065. doi: 10.1101/pdb.top071795
Schindelin, J., Arganda-Carreras, I., Frise, E., Kaynig, V., Longair, M., Pietzsch, T., et al. (2012). Fiji: an open-source platform for biological-image analysis. Nat. Methods 9, 676–682. doi: 10.1038/nmeth.2019
Schmidt, H., and Eickhorst, T. (2014). Detection and quantification of native microbial populations on soil-grown rice roots by catalyzed reporter deposition-fluorescence in situ hybridization. FEMS Microbiol. Ecol. 87, 390–402. doi: 10.1111/1574-6941.12232
Steger, C. (1996). An unbiased detector of curvilinear structures. IEEE Trans Pattern Anal. Mach. Intell. 20, 113–125. doi: 10.1109/34.659930
Verginer, M., Siegmund, B., Cardinale, M., Müller, H., Choi, Y., Míguez, C. B., et al. (2010). Monitoring the plant epiphyte Methylobacterium extorquens DSM 21961 by real-time PCR and its influence on the strawberry flavor. FEMS Microbiol. Ecol. 74, 136–145. doi: 10.1111/j.1574-6941.2010.00942.x
Wachinger, G., Fiedler, S., Zepp, K., Gattinger, A., Sommer, M., and Roth, K. (2000). Variability of soil methane production on the micro-scale: spatial association with hot spots of organic material and Archaeal populations. Soil Biol. Biochem. 32, 1121–1130. doi: 10.1016/S0038-0717(00)00024-9
Wagner, T., Hiner, M., and Raynaud, X. (2017). Thorstenwagner/ij-ridgedetection: Ridge Detection (Version v1.4.0). Zenodo. doi: 10.5281/zenodo.845874
Watt, M., Hugenholtz, P., White, R., and Vinall, K. (2006). Numbers and locations of native bacteria on field-grown wheat roots quantified by fluorescence in situ hybridization (FISH). Environ. Microbiol. 8, 871–884. doi: 10.1111/j.1462-2920.2005.00973.x
West, S. A., Diggle, S. P., Buckling, A., Gardner, A., and Griffin, A. S. (2007). The Social Lives of Microbes. Ann. Rev. Ecol. Evol. Syst. 38, 53–77. doi: 10.1146/annurev.ecolsys.38.091206.095740
Keywords: microbial ecology, root surface, bacterial colonization, point process, spatial statistics, image analysis, pattern recognition, wetland rice
Citation: Schmidt H, Nunan N, Höck A, Eickhorst T, Kaiser C, Woebken D and Raynaud X (2018) Recognizing Patterns: Spatial Analysis of Observed Microbial Colonization on Root Surfaces. Front. Environ. Sci. 6:61. doi: 10.3389/fenvs.2018.00061
Received: 27 February 2018; Accepted: 07 June 2018;
Published: 10 July 2018.
Edited by:
Alexandra Kravchenko, Michigan State University, United StatesReviewed by:
Massimiliano Cardinale, Justus Liebig Universität Gießen, GermanyMitja Nandi Paul Remus-Emsermann, University of Canterbury, New Zealand
Copyright © 2018 Schmidt, Nunan, Höck, Eickhorst, Kaiser, Woebken and Raynaud. This is an open-access article distributed under the terms of the Creative Commons Attribution License (CC BY). The use, distribution or reproduction in other forums is permitted, provided the original author(s) and the copyright owner(s) are credited and that the original publication in this journal is cited, in accordance with accepted academic practice. No use, distribution or reproduction is permitted which does not comply with these terms.
*Correspondence: Hannes Schmidt, hannes.schmidt@univie.ac.at
Xavier Raynaud, xavier.raynaud@sorbonne-universite.fr