 Bryan M. Musungu1,2
 Deepak Bhatnagar3
 Robert L. Brown3
 Gary A. Payne4Greg OBrian4
 Ahmad M. Fakhoury5*
 Matt Geisler1*
- 1Department of Plant Biology, Southern Illinois University, Carbondale, IL, USA
- 2Warm Water Aquaculture Unit, United States Department of Agriculture – Agricultural Research Service, Stoneville, MS, USA
- 3Southern Regional Research Center, United States Department of Agriculture – Agricultural Research Service, New Orleans, LA, USA
- 4Department of Plant Pathology, North Carolina State University, Raleigh, NC, USA
- 5Department of Plant Soil and Agriculture Systems, Southern Illinois University, Carbondale, IL, USA
A gene co-expression network (GEN) was generated using a dual RNA-seq study with the fungal pathogen Aspergillus flavus and its plant host Zea mays during the initial 3 days of infection. The analysis deciphered novel pathways and mapped genes of interest in both organisms during the infection. This network revealed a high degree of connectivity in many of the previously recognized pathways in Z. mays such as jasmonic acid, ethylene, and reactive oxygen species (ROS). For the pathogen A. flavus, a link between aflatoxin production and vesicular transport was identified within the network. There was significant interspecies correlation of expression between Z. mays and A. flavus for a subset of 104 Z. mays, and 1942 A. flavus genes. This resulted in an interspecies subnetwork enriched in multiple Z. mays genes involved in the production of ROS. In addition to the ROS from Z. mays, there was enrichment in the vesicular transport pathways and the aflatoxin pathway for A. flavus. Included in these genes, a key aflatoxin cluster regulator, AflS, was found to be co-regulated with multiple Z. mays ROS producing genes within the network, suggesting AflS may be monitoring host ROS levels. The entire GEN for both host and pathogen, and the subset of interspecies correlations, is presented as a tool for hypothesis generation and discovery for events in the early stages of fungal infection of Z. mays by A. flavus.
Introduction
A systems biology approach can greatly aid in understanding the dynamics of fast changing systems like stress and defense responses in plants, and allows for both discovery and novel hypotheses generation. The rise of the systems biology field has been brought on by the recent expansion of genomic, transcriptomic, and proteomic technologies and their large comprehensive datasets. “Omics" based techniques, such as gene co-expression networks (GENs), have aided in the discovery and functional analysis of genes and pathways involved in the response to biotic and abiotic stresses in plants (Sekhon et al., 2013). Gene expression analysis has been done individually on plants and fungi such as Zea mays, Glycine max (Libault et al., 2010), Arabidopsis thaliana (Mao et al., 2009), and Saccharomyces cerevisiae (Carlson et al., 2006).
In studies of host–pathogen interactions, however, two key limiting factors of system biology approaches involving genome-wide transcriptional studies have been typically observed. First, co-expression networks, especially those that have relied on microarrays, have been limited by the size of the array used to generate the data, which can lead to a loss in information. Secondly, the more extensive RNA-sequencing based studies thus far have often been limited to either the host or the pathogen.
The opportunistic pathogen Aspergillus flavus produces the potent mycotoxin aflatoxin upon infecting of Z. mays. This interaction was chosen to study because the pathogen has been reported to transition from a saprophytic to a necrotrophic lifestyle during the infection process (Abdel-Hadi et al., 2012; Fountain et al., 2014). Moreover, A. flavus typically infects maize kernels at a specific stage of maize development (Diener et al., 1987). A transcriptomic network study of this host–pathogen interaction is thus a good complement to other developmental RNA-seq based co-expression network studies in maize and A. flavus (Sekhon et al., 2013; Schaefer et al., 2014). Additionally, the A. flavus GEN represents the first GEN published for A. flavus.
What is currently known about A. flavus and Z. mays has been primarily derived though a focus on either the host or the pathogen. These approaches have been beneficial and have resulted in the discovery and characterization of multiple secondary metabolite clusters in A. flavus (Kale et al., 2008; Chanda et al., 2010; Chang et al., 2013; Rohlfs, 2015). Examples of this have been in the transcriptome analysis of clusters such as the aflatoxin, aflatrem, and cyclapanozic acid (Chang et al., 1995, 2004; Ehrlich et al., 1999; Duran et al., 2007; Kale et al., 2008; Hong et al., 2015). These whole transcriptome studies strongly complemented bottom up experimental approaches, and filled in gaps toward a better understanding of these secondary metabolite pathways.
In Z. mays, multiple pathways have been discovered to be involved in resistance to A. flavus. In fact, pathways such as the phenylpropanoid, jasmonic acid, and salicylic acid pathways have been reported to play a significant role in resistance to the fungus (Warburton et al., 2015). Moreover, genome-wide association studies (GWASs) have indicated that the jasmonic acid pathway plays the largest role in conferring resistance across the current publically available breeding studies involving maize lines resistant to A. flavus (Tang et al., 2015; Warburton et al., 2015).
In this dual transcriptomic study of A. flavus and Z. mays, our focus was to infer a GEN of both host and pathogen during the initial stages of infection, and to develop a tool that could be utilized to understand the complex interaction between A. flavus and Z. mays. The approach used in this study differs from what has been previously reported in that the correlation of expression between genes in host and pathogen (cross-species) is captured along with correlations restricted to the host or the pathogen. The network approach used reveals features that are lost, particularly when relying on co-expression analysis using only heat maps and gene clustering. This work shows that there is significant cross-species co-expression during the initial stages of infection. It also reveals resistance and virulence mechanisms, particular to A. flavus and Z. mays, which are important at the initial stages of the interaction between the two organisms. The generated network maps can also serve as a tool to infer functional annotation for poorly annotated genes in both Z. mays and A. flavus.
Materials and Methods
Growth and Inoculation of Maize
Maize B73 was grown in Clayton, NC during the years 2011 and 2013. Seeds were planted on April 16. Ears were hand pollinated from July 5–8 and covered with a paper bag. A time course study was performed by pin bar inoculating one ear (per time point) of maize B73 with A. flavus NR3357 and harvesting at 0, 6, 12, 18, 24, 30, 36, 42, 48, and 72 h post-inoculation. Four biological replicates for the samples were produced for the time points 12, 24, 48, and 72 h post-inoculation. Samples were frozen in liquid nitrogen, placed on dry ice and stored at –80°C until RNA was isolated. Maize B73 and A. flavus NR3357 were used in this study because of the availability of genomic resources for them, and because of the relatively large amount of studies that were previously conducted using either or both of them. Maize B73 and A. flavus NR3357 were therefore used in this study to make comparisons to other available experimental data sets more straightforward.
RNA Isolation
Eight kernels per ear were ground and used for RNA isolation. Approximately, 100 mg of ground tissue was homogenized in a Virtis homogenizer (Virtis, Gardiner, NY, USA) in Saturated Phenol, pH 6.6 for 2 min. Samples were then dissolved in Tris EDTA buffer, pH 8.0 (ACROS Organics, Morris Plains, NJ, USA), purified with 5:1 Acid Phenol: Chloroform, pH 4.5, and precipitated with ice-cold 100% ethanol overnight. Total RNA was purified again with RNeasy Mini Kit (Qiagen, Hilden, Germany) according to the manufacturer’s instructions. The quality and concentration of RNA was analyzed using an RNA Pico chip on an Agilent Bioanalyzer (Agilent, Santa Clara, CA, USA).
Sequencing and Mapping
cDNA library construction and sequencing was performed at the Genomic Sciences Laboratory, North Carolina State University. Libraries were made from each time point, pooled and run on a single lane. Sequencing was performed on an Illumina HiSeq (single reads, 100 bp). Raw reads were deposited in the Sequence Read Archive (SRA) at NCBI, accession numbers [SRP082421]. Mapping, trimming and fastqc quality control of the reads, for both Z. mays and A. flavus, were done with CLC workbench 4.9 (Qiagen, Hilden, Germany). CLC genomics workbench default parameters were used for doing the mapping and trimming. The reference genomes used in this study where Z. mays (AGPv3, INSDC Assembly GCA_000005005.5, April 2013) and A. flavus (JCVI-afl1-v2.0, INSDC Assembly GCA_000006275.1, January 2009). Reads that had a total unique gene count of 1 were removed from the counts table.
Gene Ontology Analysis
Gene ontology analysis of the co-expression subnetwork was done with the gprofiler and significant go-terms were selected based upon a false discovery rate (FDR <0.05) (Reimand et al., 2016).
Regularized Log Normalization, M-Value Calculation, and K-Means Clustering
Unique mapped read counts were normalized by regularized log transformation using the DESeq2 package in the R software environment (ver. 3.3). The mapped reads were than used to calculate M-values for the different samples by using samples 0 and 6 h as controls for Dataset 1 (Love et al., 2014).
The DESeq2 function plotPCA() was used to generate principal component plots to analyze the variation in the samples. For Z. mays, mRNA extracted from samples collected 0 hpi were used as control. As for A. flavus, samples collected 24 hpi were used as control. The original matrix contains 7408 genes (3331 Z. mays and 4115 A. flavus) showed significant differential expression with a q-value cutoff <0.1 (after Benjamini Hochberg FDR correction) and were selected for clustering and gene co-expression analysis. After duplicate gene models were removed the matrix was reduced to a size of 6035 genes (A. flavus 3290 and Z. mays 2745). TM4 (Saeed et al., 2006) and Cluster 3.0 (de Hoon et al., 2004) software platforms were used to analyze these genes by K-means clustering using the absolute Pearson correlation metric and average cluster sampling method into two different bin sizes (10, 100) (Supplementary Table S1).
Correlation Calculation and Network Analysis
Pearson correlation analysis was done on differentially expressed genes by utilizing the cor() function in R using the Z-scores calculated (see above). The resulting matrix was then transformed into a pair-wise gene table using the reshape2 melt() package in R. The resulting table (∼30 million gene pairs) was filtered using the subset() function in R for gene pairs showing 0.95 or greater correlation. This resulted in 980,280 gene pairs. In addition a randomly generated matrix was done similarly for the data which was obtained generating random log2Fold changes were generated in R for subsequent Kolmogorov–Smirnov supplemental test (Massey, 1951).
Network Visualization and Cytoscape
To visualize the network 980280 gene pairs were load into the cytoscape network. Gene Annotation was then added to the network using the (AGPv3, INSDC Assembly GCA_000005005.5, April 2013) and A. flavus (JCVI-afl1-v2.0, INSDC Assembly GCA_000006275.1, January 2009). It is important to note that the best method for visualizing the network is to import the data into Cytoscape without building the network if not using a large memory computer. To select gene pairs of interest the user can refer to the Cytoscape manual in order to select for genes of interest and first neighbors without a high memory PC. Network topological analysis was then done on this set of gene pairs using Cytoscape Ver. 3.2.1 (Shannon et al., 2003; Maere et al., 2005; Cline et al., 2007). The network analysis was performed using the NetAnalyzer tool in Cytoscape and network clusters were identified using the MCODE app for Cytoscape (Bader and Hogue, 2003).
Results
RNA-seq
RNA-seq was carried out on mRNA extracted from Z. mays kernels inoculated with A. flavus over a 3-day time course. The individual reads were competitively mapped to a combined gene model set of both A. flavus (13775 gene models) and Z. mays (181929 gene models). 44264 gene models had unique mapped reads in at least one pooled kernel sample, while 151440 gene models did not have any expression (0 unique mapped reads) across all the samples. 6035 genes were then selected for co-expression analysis based upon their significant level of differential expression (see Materials and Methods). The A. flavus 3290 and Z. mays 2745 genes are stored in a matrix (Supplemental File 1).
Principal Component and K-Means Clustering Analyses
Principal component analysis (PCA) showed a high level of variation between samples, but many of the later time points clustered together (Figure 1). The analysis also showed that a high level of variation occurred between samples collected at the same hpi (hours post-infection) for both host and pathogen (Figures 1A,B). When visualized using centroid graphs from K-means clustering to observe expression patterns there was a high level of variation between Z. mays and A. flavus at 12 hpi (hours post-infection), 48 hpi, and 72 hpi for genes in both systems. These observations lead us to conclude that although these were indeed biological replicates, inoculated with the same culture of A. flavus, and harvested for RNA at the same time, the progression of the infection could be quite different from replicate to replicate. These replicates thus likely represent leading and lagging infection progress at early and middle stages of infection. There is tight replicate grouping in early time points (Figure 1A, 12–18 hpi) and clear separation of these from later stages of infection (48–72 hpi). The pathogen A. flavus (Figure 1B), seems to have a more variable expression in early infection stages, but these have caught up to each other and give a more consistent expression profile at 72 hpi. For this reason, we treated each replicate as a separate data point (representing a different stage of infection), rather than using replicate averages in downstream clustering and correlation analyses. When the genes were clustered into 10 bins (clustering groups), the largest bin had 2599 correlated genes for Z. mays and for A. flavus. This largest cluster had a similar overall trend of down-regulation over time. Functional analysis of this cluster found genes enriched in multiple biological processes with no obvious pattern related to resistance to pathogens. Examples included response to cadmium ion, response to inorganic substance, protein folding, DNA replication, glucose homeostasis, and nucleosome assembly. Other bins contained smaller numbers of genes but produced similar results for functional enrichment.
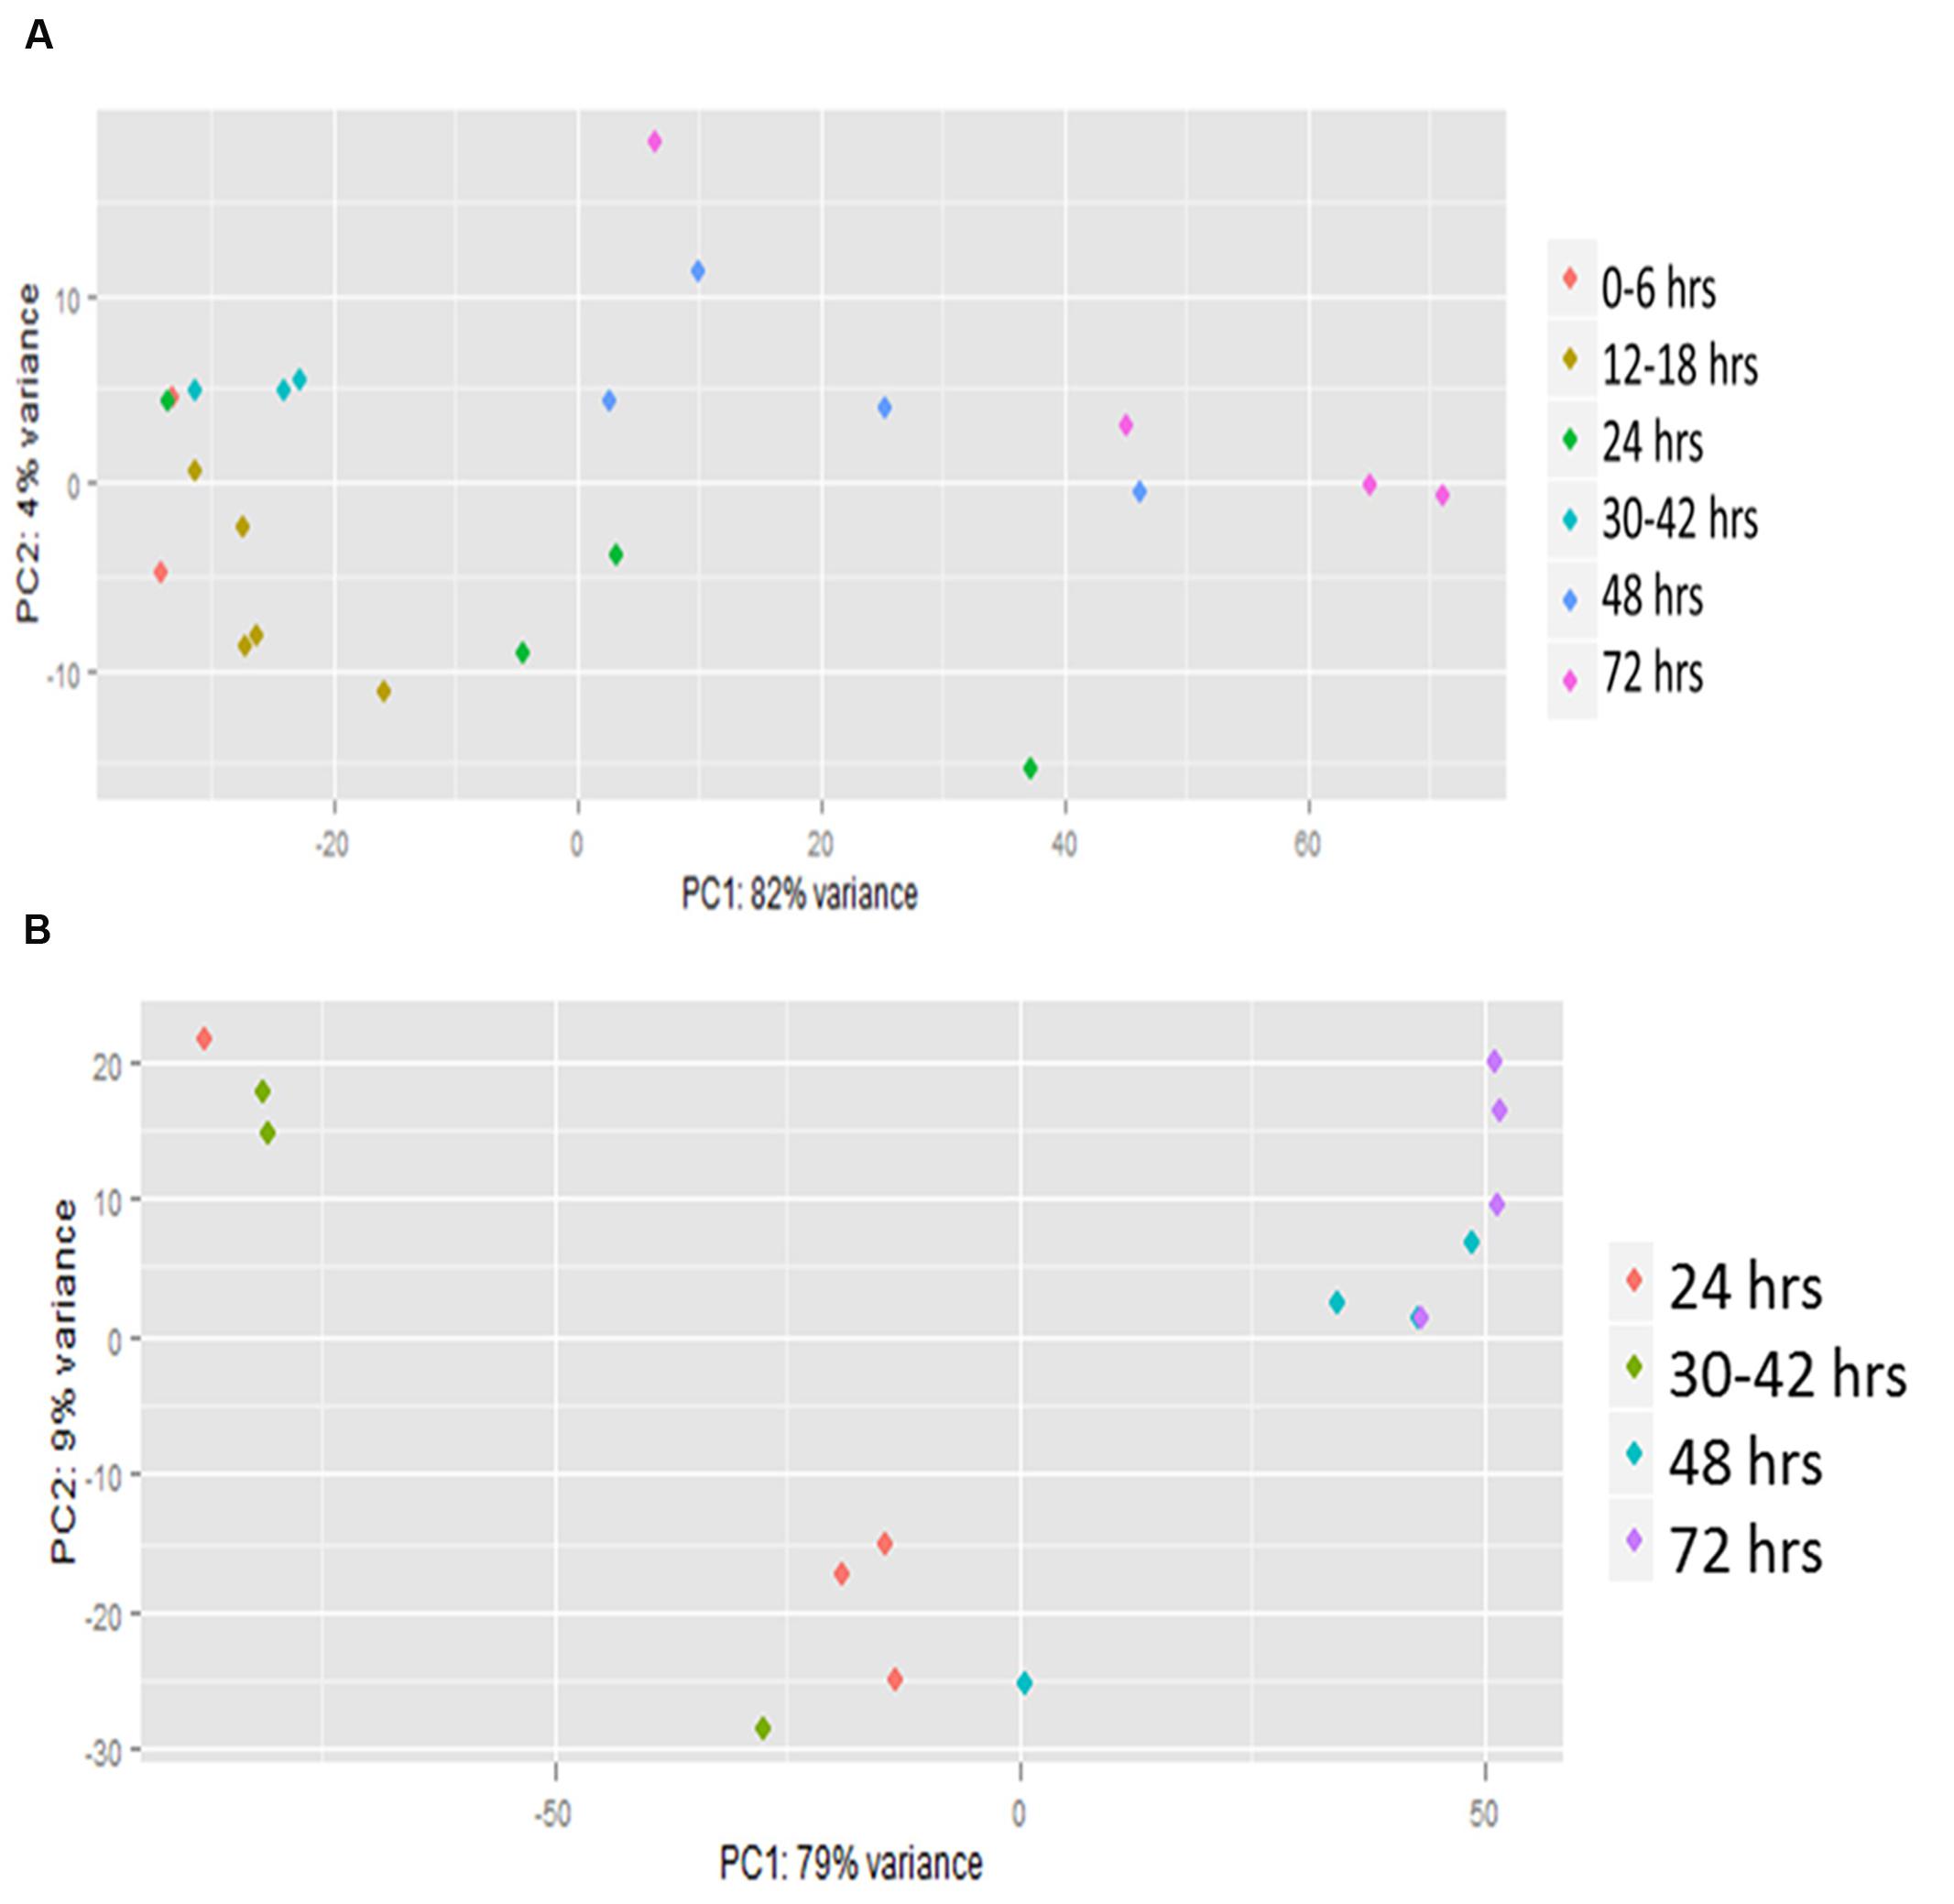
FIGURE 1. Principal component analysis (PCA) of RNA-seq. Transcriptomic (global gene expression) data from each of the time points of (A) Zea mays and (B) Aspergillus flavus were analyzed by principal component analysis using R statistical language. Colored dots represent individual biological replicates harvested at different time points during the infection. These were grouped based on similarity of infection by hpi (hours post-inoculation).
Genes were then K-means clustered into 100 bins to determine functional enrichment of tightly inter-correlated groups of A. flavus and Z. mays genes (Supplementary Table S2). These bins had a smaller number of genes (3–1488) and many included clusters with genes from a single species. Nineteen clusters contained genes from both species. In many cases, genes related to disease resistance in Z. mays, even those with somewhat different biological roles (i.e., multi-domain genes and resistance to different pathogen types), appeared in the same cluster. For example, cluster 21 (from Supplementary Table S2) contained multiple primary metabolism and signaling kinase genes such as 3-Deoxy-Darabinoheptulosonate 7-phosphate (DAHP) synthase (GRMZM2G396212) and Inositol 1 3 4 trisphosphate 5/6-kinase family protein (GRMZM2G084609). Another cluster contained the genes encoding for SPP2 Sucrose-phosphatase 2 (GRMZM2G097641) and LOX10 lipoxygenase-10 (GRMZM2G015419). These genes were found to be co-expressed with multiple heat shock genes and with myb transcription factors. Many of the genes in this cluster were noted in previous studies involving resistance of maize to A. flavus and Fusarium verticillioides. An example is the presence in our dataset of WRKY19 (GRMZM2G063880), WRKY53 (GRMZM2G012724), and PR10.1 in Z. mays which have been previously shown to be up-regulated upon infection by A. flavus (Fountain et al., 2015).
Gene Co-expression Network
An alternative approach to K-means clustering is to examine all significant pairwise correlations between genes as a network graph. This overcomes limitations in arbitrary group number selection. It also assays specific correlations between genes relying on fitting genes based on the group average expression of a bin. Moreover, networks can reveal patterns of interrelationships between individual genes not readily apparent in other clustering methods, and thus provide a complementary analysis to what can be gaged from other analysis approaches.
A co-expression network for the 6035 Z. mays and A. flavus differentially expressed genes was generated using pairwise Pearson correlation across all samples, and choosing an edge adjacency matrix with a cutoff of a (0.95) correlation coefficient. Surprisingly, even at this high correlation cutoff, the network was quite dense, and 980,280 significantly correlated gene pairs (edges) were discovered for 3638 genes (nodes). The distribution of the correlation values is shown in Figure 2. It can be seen from the distribution correlation values, that a majority of the correlations are skewed to the right (positive correlations) as has been shown in other co-expression analyses, including Arabidopsis and rice (Geisler-Lee et al., 2007; Ho et al., 2012). Further exploration of this network was to determine how similar the distribution was to a randomly generated distribution (see Materials and Methods). A Kolmogorov–Smirnov test showed a significant difference between the random and observed correlation value distributions (p-value 2.26 × 10⁻¹⁶) (Supplemental Figure S1). The observed distribution represents ∼1% of all the possible edges in the network. The high density is likely because we are looking at the small subset of differentially expressed genes involved in a single (kernel) tissue, subject to a large singular condition (pathogen attack) while most other similar GENs tend to involve all genes in multiple tissues and different stresses in their analysis. The selection of differentially expressed genes also likely reduced the noise in the dataset from spurious correlations between non-responding genes.
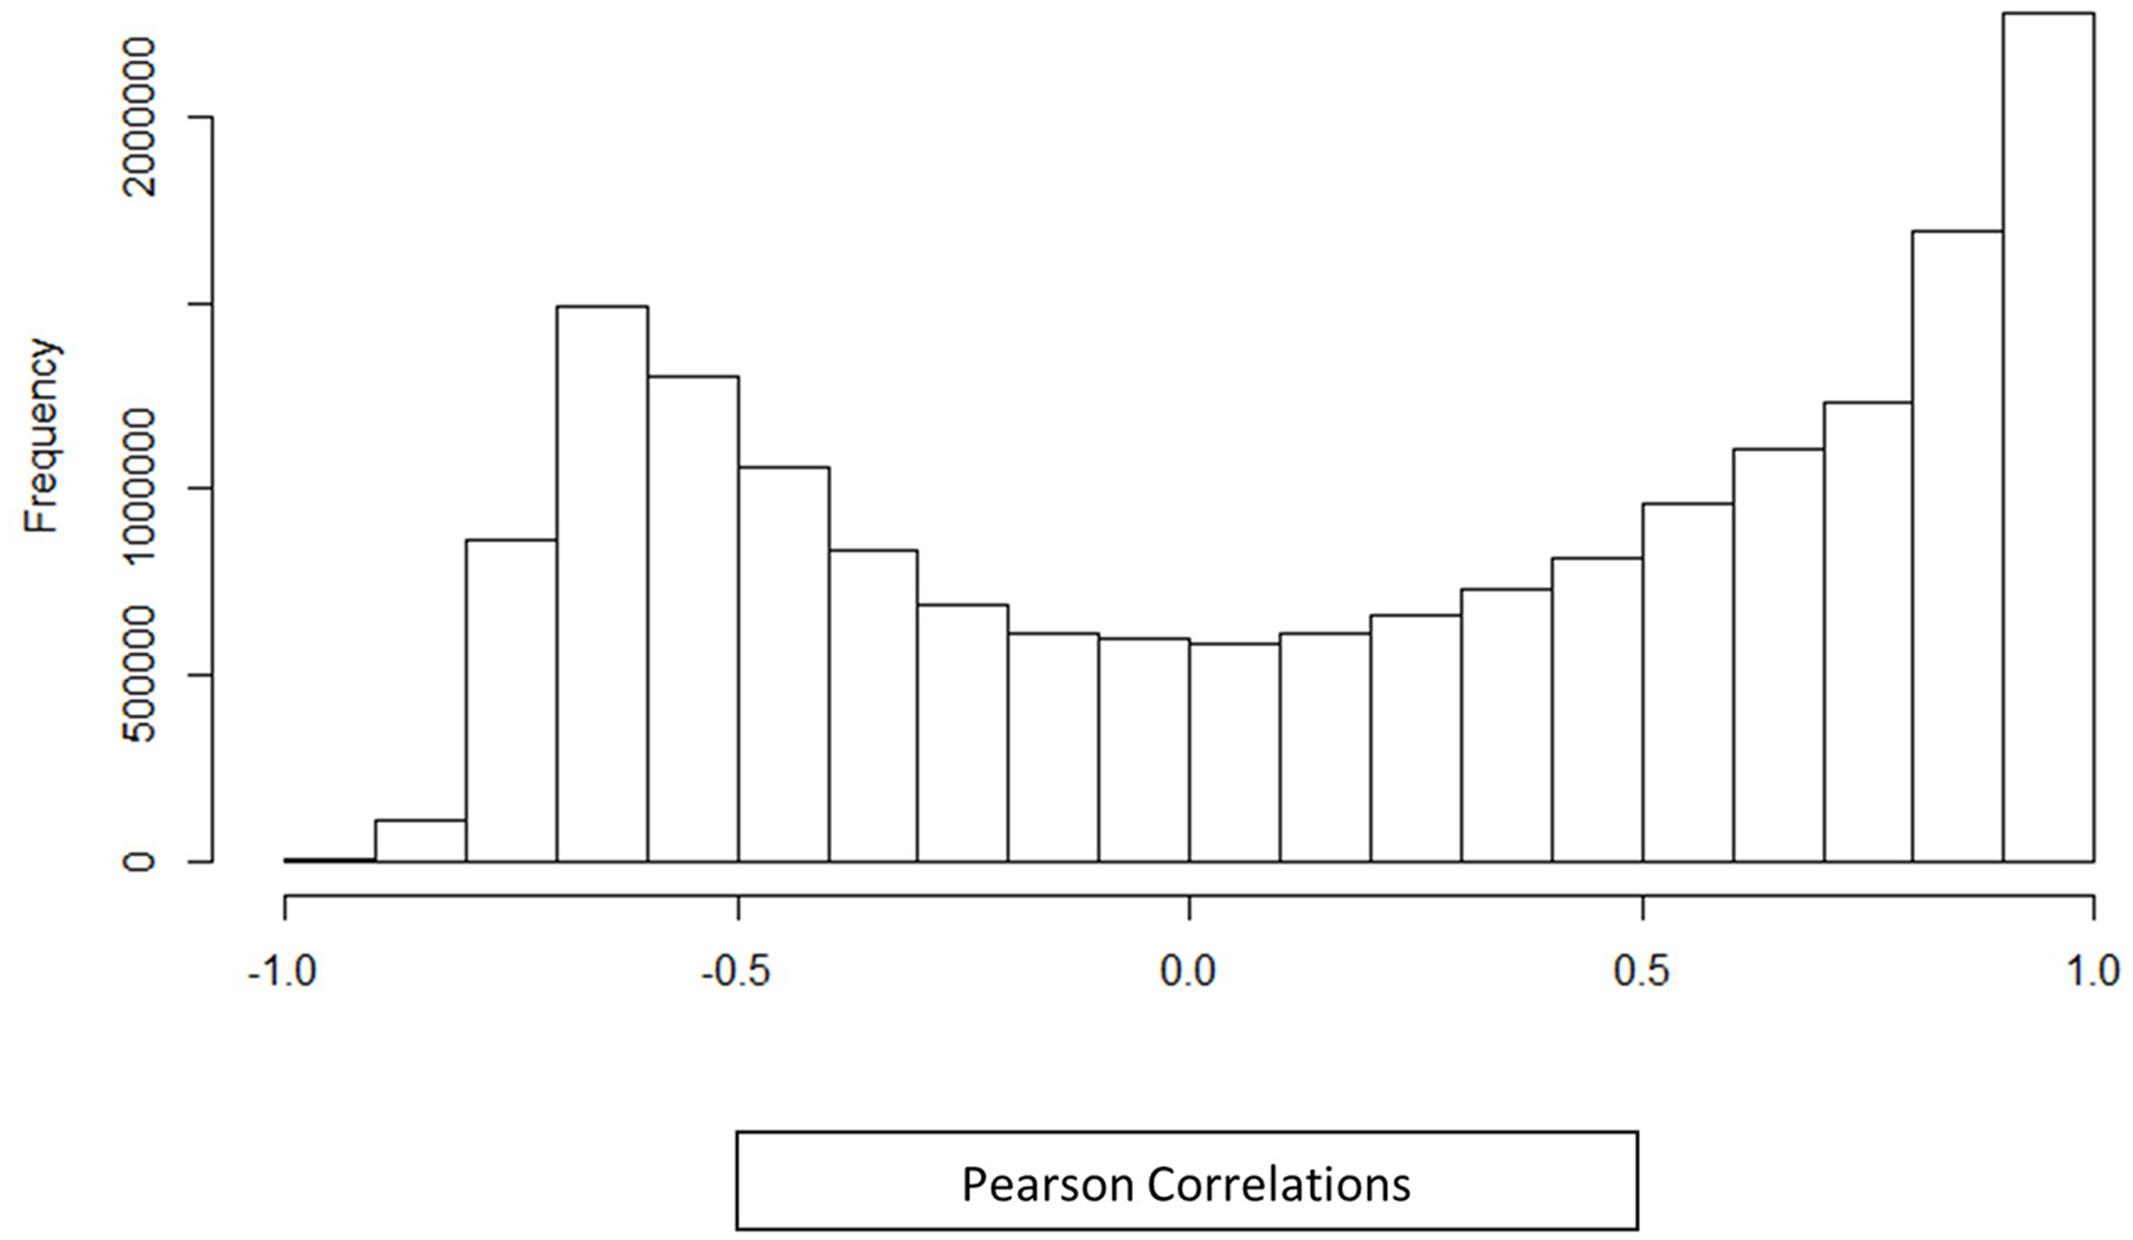
FIGURE 2. Histogram distribution of Pearson correlations. Histogram shows the correlation between differentially expressed genes identified in an in vivo simultaneous RNA-seq experiment with A. flavus and Z. mays. The histogram includes all differentially expressed genes along with their Pearson correlation distribution for (Z. mays vs. Z. mays), (A. flavus vs. A. flavus), and (Z. mays vs. A. flavus). The correlations that were found to be significant in the analysis were greater >0.95 Pearson correlation.
Maize Jasmonate Related Network
Jasmonate signaling, and especially the jasmonate biosynthetic pathway have been implicated as a major determinant of resistance to fungal infection in multiple studies involving Z. mays and A. flavus (Lyons et al., 2013; Christensen et al., 2015; Magnin-Robert et al., 2015). This has also been demonstrated with multiple genes in Arachis hypogaea (Tsitsigiannis et al., 2005), A. thaliana (Pauwels and Goossens, 2011; Christensen et al., 2015), indicating some degree of conservation of these pathways in plants. Mining the GEN specifically for known genes in this pathway and identifying their neighboring genes (those genes strongly co-expressed with individual genes in this pathway) therefore provide one approach to discover new candidate genes involved in fungal resistance in Z. mays. The jasmonate pathway biosynthesis genes including OPR1 (GRMZM2G106303; 12-oxophytodienoic acid reductase), OPR2 (GRMZM2G000236; 12-oxophytodienoate reductase 2) and LOX (GRMZM2G156861_P01; Lipoxygenase) were all in the same co-expressed cluster of 446 A. flavus and Z. mays genes when the genes were clustered into 10 bins. When 100 bins (Supplementary Table S2) were used in the analysis, OPR1 and LOX5 (GRMZM2G102760; Lipoxygenase 5) occurred in cluster 39 and OPR2, LOX2 (GRMZM2G156861; Lipoxygenase 2) and PRMS (AC205274.3_FGP001; Pathogenesis-related protein) occurred in cluster 65.
In the co-expression network, OPR2 and OPR1 were found to be connected (tightly co-expressed) to six A. flavus genes, and one Z. mays gene (GRMZM2G371167) that is annotated only for “a response to low sulfur.” The A. flavus genes were (AFLA_061840) Xaa-Pro aminopeptidase P, Bax inhibitor (AFLA_061840), BZIP transcription factor (Bzip) (AFLA_083100), 4-nitrophenylphosphatase (AFLA_083100), Endo-1, 4-beta-xylanase A, putative (AFLA_083100), and Mitochondrial translation initiation factor IF-2 (AFLA_028660). OPR2 gene expression was not consistently up-regulated in all time points, but showed a complex pattern of induction and suppression over time after infection. Significant correlations were found for (LOX), SSP2 (GRMZM2G097641). The A. flavus genes autophagy cysteine endopeptidase Atg4 was found to be co-regulated with OPR2.
The COB co-expression network includes more than 100 experimental conditions and tissues; the network is typical of a global comprehensive expression correlation map, but notably does not include fungal pathogen experiments. When OPR2 was analyzed in the COB online co-expression network for Z. mays, no genes were found to be co-expressed with it Schaefer et al. (2014). Thus, the co-expression and clustering of genes shown in this study, including those involving OPR2, may reflect a specific response to fungal infection.
Maize Ethylene Related Genes
Ethylene signaling and biosynthetic pathways were also significantly up-regulated in response to fungal pathogenesis, and many genes in those pathways were found to be co-expressed in the co-expression network with novel genes, or genes previously not associated with disease resistance. One of the ethylene genes found in the co-expression network, the ethylene signaling gene EREB129, an AP2ERE element binding protein-transcription factor (GRMZM2G016434), was found to have different connections (representing tight co-expression) within the network; it was linked with avr9/C-9 (GRMZM2G172695) an avirulence protein which has been shown to be involved in pathogen resistance studies involving A. flavus, Cladosporium fulvum (Chen et al., 2004; Rowland et al., 2005; Luo et al., 2008, 2011). EREB108 was also found to be connected to (GRMZM2G137802), a WRKY7 transcription factor (GRMZM2G154828) a cytochrome P450 putative expressed gene, and to (GRMZM2G175076) a chalcone-flavanone isomerase family protein.
The ethylene-responsive transcription factor GRMZM2G474326 had 13 connections with multiple Z. mays genes including two reactive oxygen producing genes; (GRMZM2G087875) cytochrome P450, and AOX2, an alternative oxidase gene which had been implicated as being important in disease resistance by other studies (HanQing et al., 2010). Additionally, GRMZM2G474326 was found to be connected to (GRMZM2G104626) 3-ketoacyl-CoA synthase, and (GRMZM2G086869) haloacid dehalogenase-like hydrolase (HAD) superfamily protein. To our knowledge, these genes have not been previously implicated in disease resistance. Some of the other genes that were found to be linked to ethylene signaling related genes in this study, were experimentally determined to be involved in resistance to Fusarium graminearum (Hart et al., 2015).
A. flavus Transport Genes
In A. flavus, a complex transport system is involved in secondary metabolism (Linz et al., 2011; Amare and Keller, 2014; Rohlfs, 2015). Specialized vesicles, aflatoxisomes, have been identified and were found to be involved in the transport of aflatoxin and other secondary metabolites (Chanda et al., 2010; Roze et al., 2011). Multiple vesicular transport genes were detected among the genes induced after inoculation within the GEN for A. flavus. These were genes that are conserved across eukaryotes, including the SNARE protein Snc2 (AFLA_016950), Vacuolar protein sorting associated protein vps17 (AFLA_057210) and many others (Supplementary Table S1).
Interspecies Networks of Gene Expression Correlation
One of the advantages of using GENs is the ability to identify interspecific gene expression correlations. The GEN was mined for interactions between A. flavus and Z. mays. This yielded a subnetwork of 2046 genes comprised of 102 Z. mays genes and 1944 A. flavus genes, and 9450 co-expression edges that crossed species (Figure 3A). Functional analysis was conducted on all 2046 genes. The 102 Z. mays genes were found to be involved in biological processes such as oxidation reduction (GO:0055114), oxidoreductase activity (GO:0016491), hydrolase activity (GO:0016787). One of the Z. mays genes, GST7, was connected with 776 A. flavus genes. The 776 A. flavus genes fell into different significant GO-terms including GO:0048193 (Golgi Vesicle Transport), and (GO:0030163) protein catabolic process (Figure 3B; Klionsky et al., 1990). An absence of maize intraspecific correlation was observed when these 102 genes were mined using the COB co-expression network (Schaefer et al., 2014). In A. flavus, the 1944 genes in the sub-network included genes involved in trehalose-related metabolic processes, transferase activity, and L-amino acid peptides-related peptidase activity.
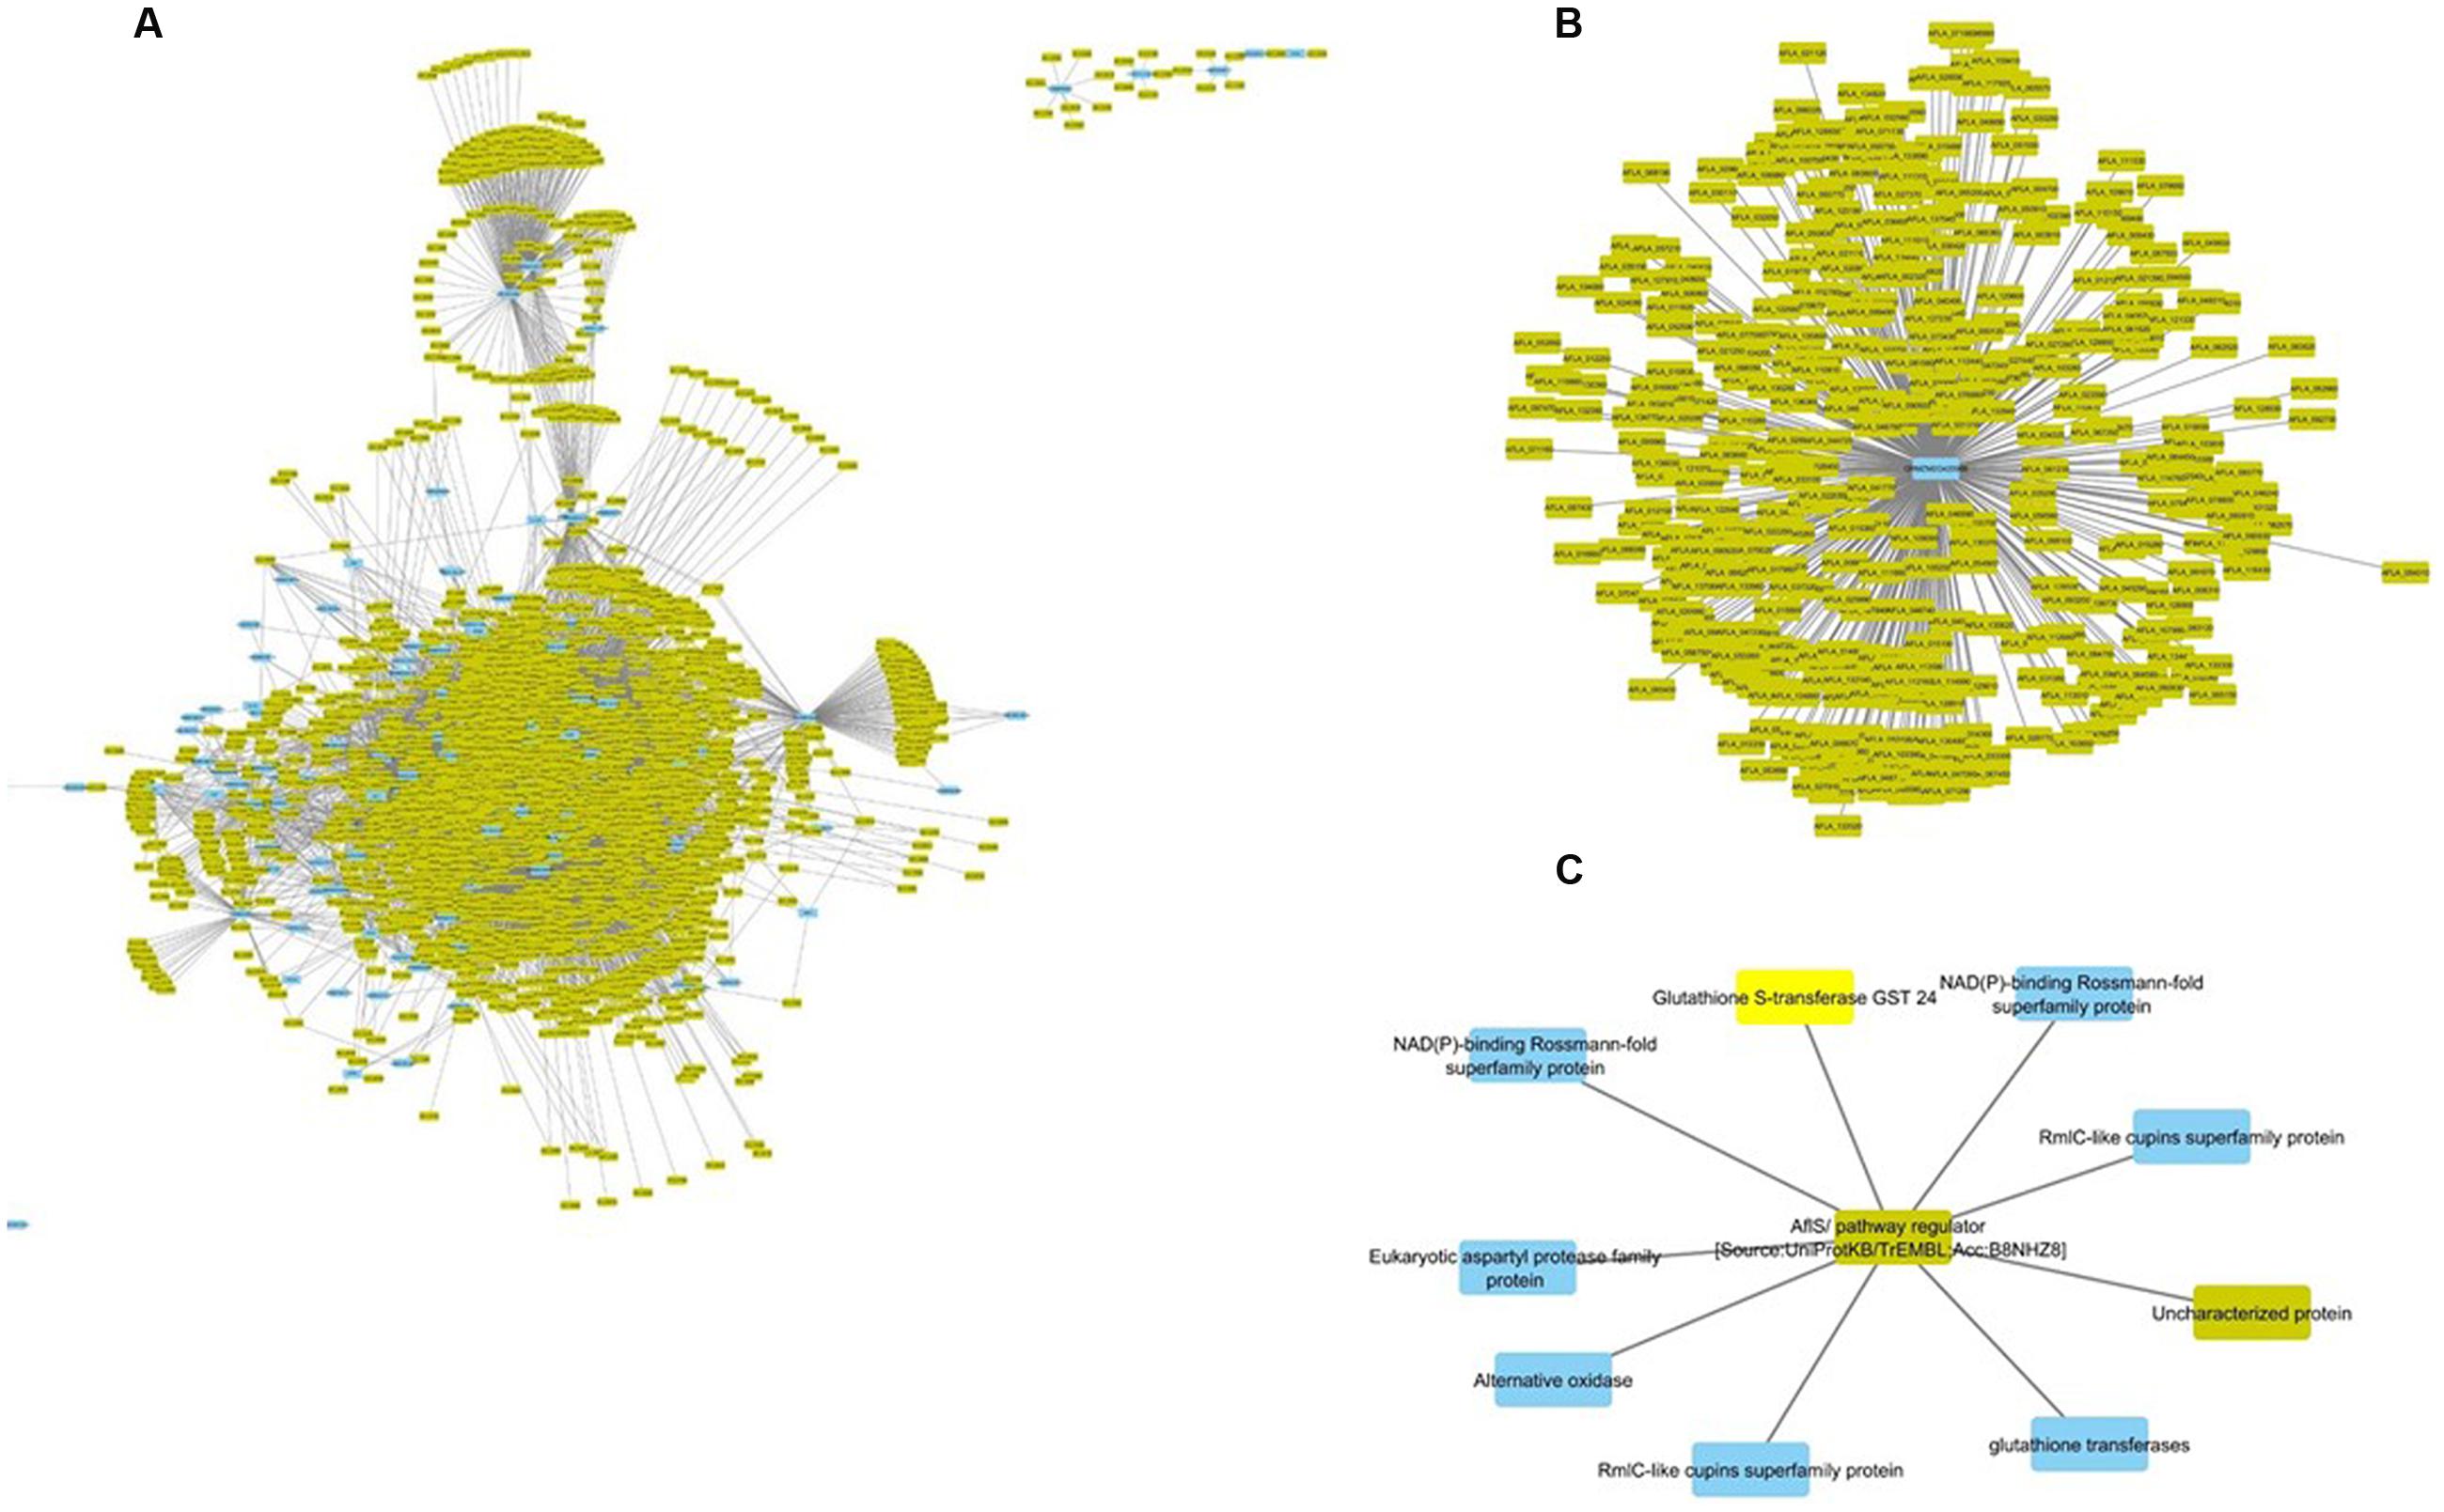
FIGURE 3. Interspecific Z. mays and A. flavus co-expression network Pearson correlation analysis was performed on Z. mays and A. flavus genes to generate a cytoscape network. The network contains edges (lines implying linkage) which had a Pearson correlation >0.95. Blue nodes (Z. mays) and yellow nodes (A. flavus) are found within the network. Within the network (A) represents the Z. mays genes that were found to be co-expressed with at least one A. flavus gene. (B) (GRMZM2G420988) Solute Carrier Protein which was found to be associated with 421 A. flavus genes. (C) Shows a subnetwork with the co-regulator for the aflatoxin cluster AflS.
The interspecies sub-network additionally revealed that many known resistance genes in maize are co-expressed with A. flavus genes. For example, the Z. mays pathogen resistance-5 gene (PR-5; GRMZM2G402631), which has been shown to be involved in systemic acquired resistance, was found to be correlated with AFLA_002560 (60S ribosomal protein) (Gómez-Ariza et al., 2007; Lanubile et al., 2015; Shu et al., 2015). This particular A. flavus ribosomal protein had previously been shown to be inhibited by antifungal activity (Delgado et al., 2015). Additionally, PR5 expression was correlated with 4303 A. flavus genes and 76 Z. mays genes that consisted of likely resistance gene candidates. The Z. mays gene included GRMZM2G039639, a Thaumatin family protein which has been shown to be transcriptionally up-regulated during host–pathogen interactions (Petre et al., 2011; Scarpari et al., 2014; Christensen et al., 2015). The three other additional partners where two cytochrome P450 and PR-1 which has also been implicated in resistance to A. flavus (Guo et al., 2008; Lanubile et al., 2015).
The most important finding of the interspecies sub-network was the presence of secondary metabolism genes related to aflatoxin biosynthesis. In fact, these genes formed a large interconnected module within the sub-network. One of the key regulatory genes of the aflatoxin biosynthesis cluster, AflS (AFLA_139340 formerly AflJ), had a dense connection of 1169 genes (nine maize, 1160 A. flavus). It was also found to be co-regulated with seven Z. mays reactive oxygen species (ROS) production genes including a Rmlc-like cupin protein, a glutathione S-transferase and an alternative oxidase 3 (Figure 3C). The expression for this secondary metabolism module of genes was highly similar, which is why it formed such a hub in the co-expression network. Many of these Z. mays genes co-expressed with AflS were involved specifically in the production of peroxides, which have been typically shown to be involved in the response of plants to abiotic and biotic stress (Mori and Schroeder, 2004; Torres et al., 2006). For example, Rmlc-like genes are involved in the production of peroxides via oxalate oxidase (Lane et al., 1993). Multiple germin-like proteins similar to these are known to be present within the Z. mays kernel tissue. The group of maize genes linked to AflS also included genes reported to be indicators of resistance (induced upon infection and associated with resistance in breeding studies) such as AOX, an alternative oxidase (Simons et al., 1999; Fung et al., 2004).
AflS was also found to be co-regulated with 1162 A. flavus genes in the network; the aflatoxin cluster genes AflX, AflE, AflW, AflV, AflK, AflL, AflN, AflM, AflH, AflS, AflA, AflD, and AflC were all found to be co-expressed with AflS. AflS was also found to be co-regulated with A. flavus secretion and transport protein encoding genes including the endomembrane trafficking proteins COPI vesicle (AFLA_044000), COPII vesicle (AFLA_030110) and the Golgi to endosome transport protein Ent3 (AFLA_092060). This agrees with a previous report of AflS being found to interact with multiple A. flavus genes involved in transport and development (Ehrlich et al., 2012). It is to be noted that AflR, a known regulator of the aflatoxin biosynthesis cluster, was absent in our network. This is mainly due to its exclusion from the network since it did not meet the cut-off criteria used in the initial filtering of the differentially expressed genes (see Materials and Methods). Similarly, several A. flavus genes from the aflatoxin biosynthesis cluster were not present in the network.
Network Analysis
One of the key advantages of working with GENs over utilizing a traditional clustering approach, is exploiting the ability of graph theory to assess genes of importance. A key metric, connectivity, which is a measure of how many genes a given gene is co-expressed with, can also be used to infer possible biological connections including physical interactions and shared common regulators. The connectivity of some of the genes in the GEN is shown in Table 1. This type of connectivity has been demonstrated in multiple interactomes, co-expression networks for humans (Homo sapiens), A. thaliana and Z. mays due to the overlap between interactomes and co-expression data (Wachi et al., 2005; Gu et al., 2011; Musungu et al., 2015). Among Z. mays genes, several ROS genes were found to have the largest number of connections in the network. For example, the Z. mays glutathione S-transferase 7 (GST7), which has been previously implicated in ROS (Mideros et al., 2014; Yin et al., 2014; Fountain et al., 2015), had 776 connections, while cytochrome P450 family 72 (GRMZM2G147752), also involved in oxidative stress, had 223 connections in the interspecies network. Interestingly, the top 20 most connected genes in the network were A. flavus genes (Table 2). This group of genes includes A. flavus genes involved in the biosynthesis of methionine, carbohydrate metabolism genes such SNF1, and vesicular transport gene. The presence of highly co-regulated transport genes is not very surprising since endomembrane transport is a highly coordinated process. In fact, transport genes are typically found to be tightly connected in networks such as in the interactomes of Z. mays, S. cerevisiae, and A. thaliana (Yu et al., 2008; De Bodt et al., 2009; Musungu et al., 2015).
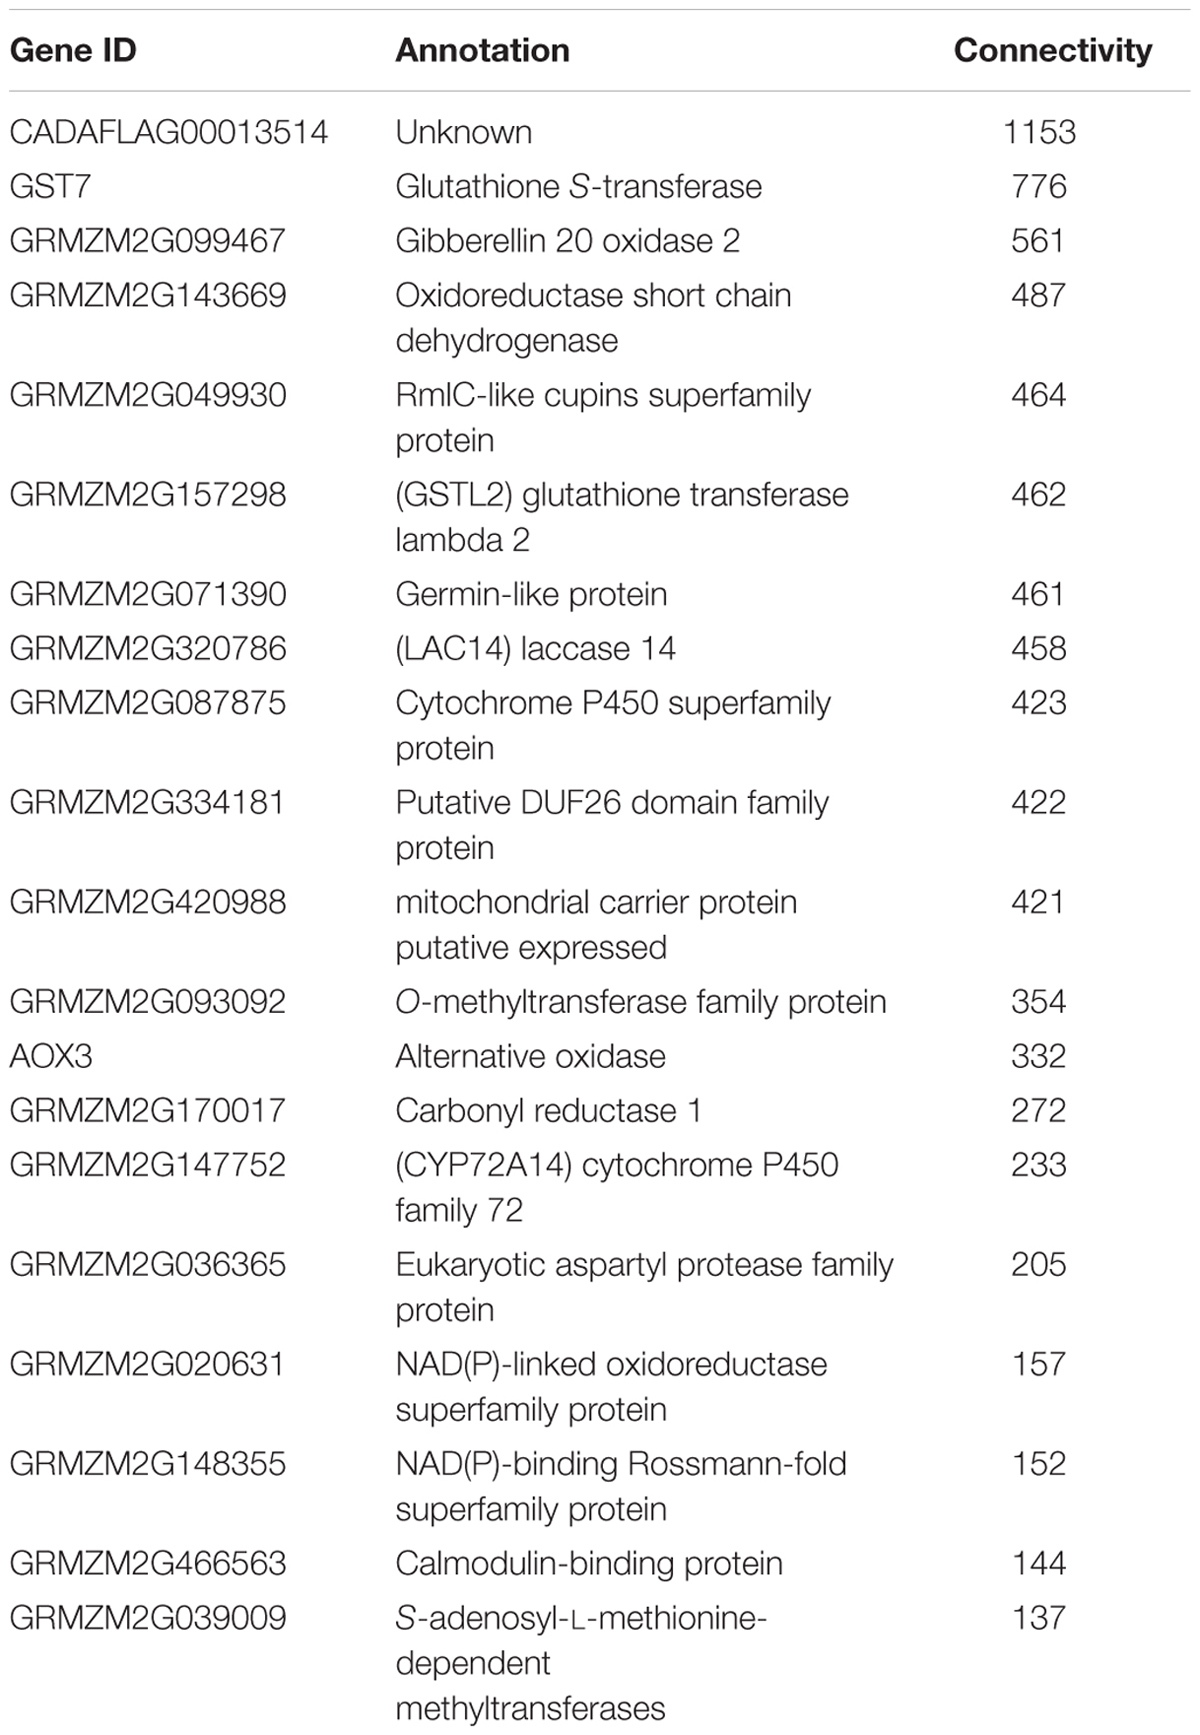
TABLE 1. Connectivity for the interspecific co-expression sub-network.
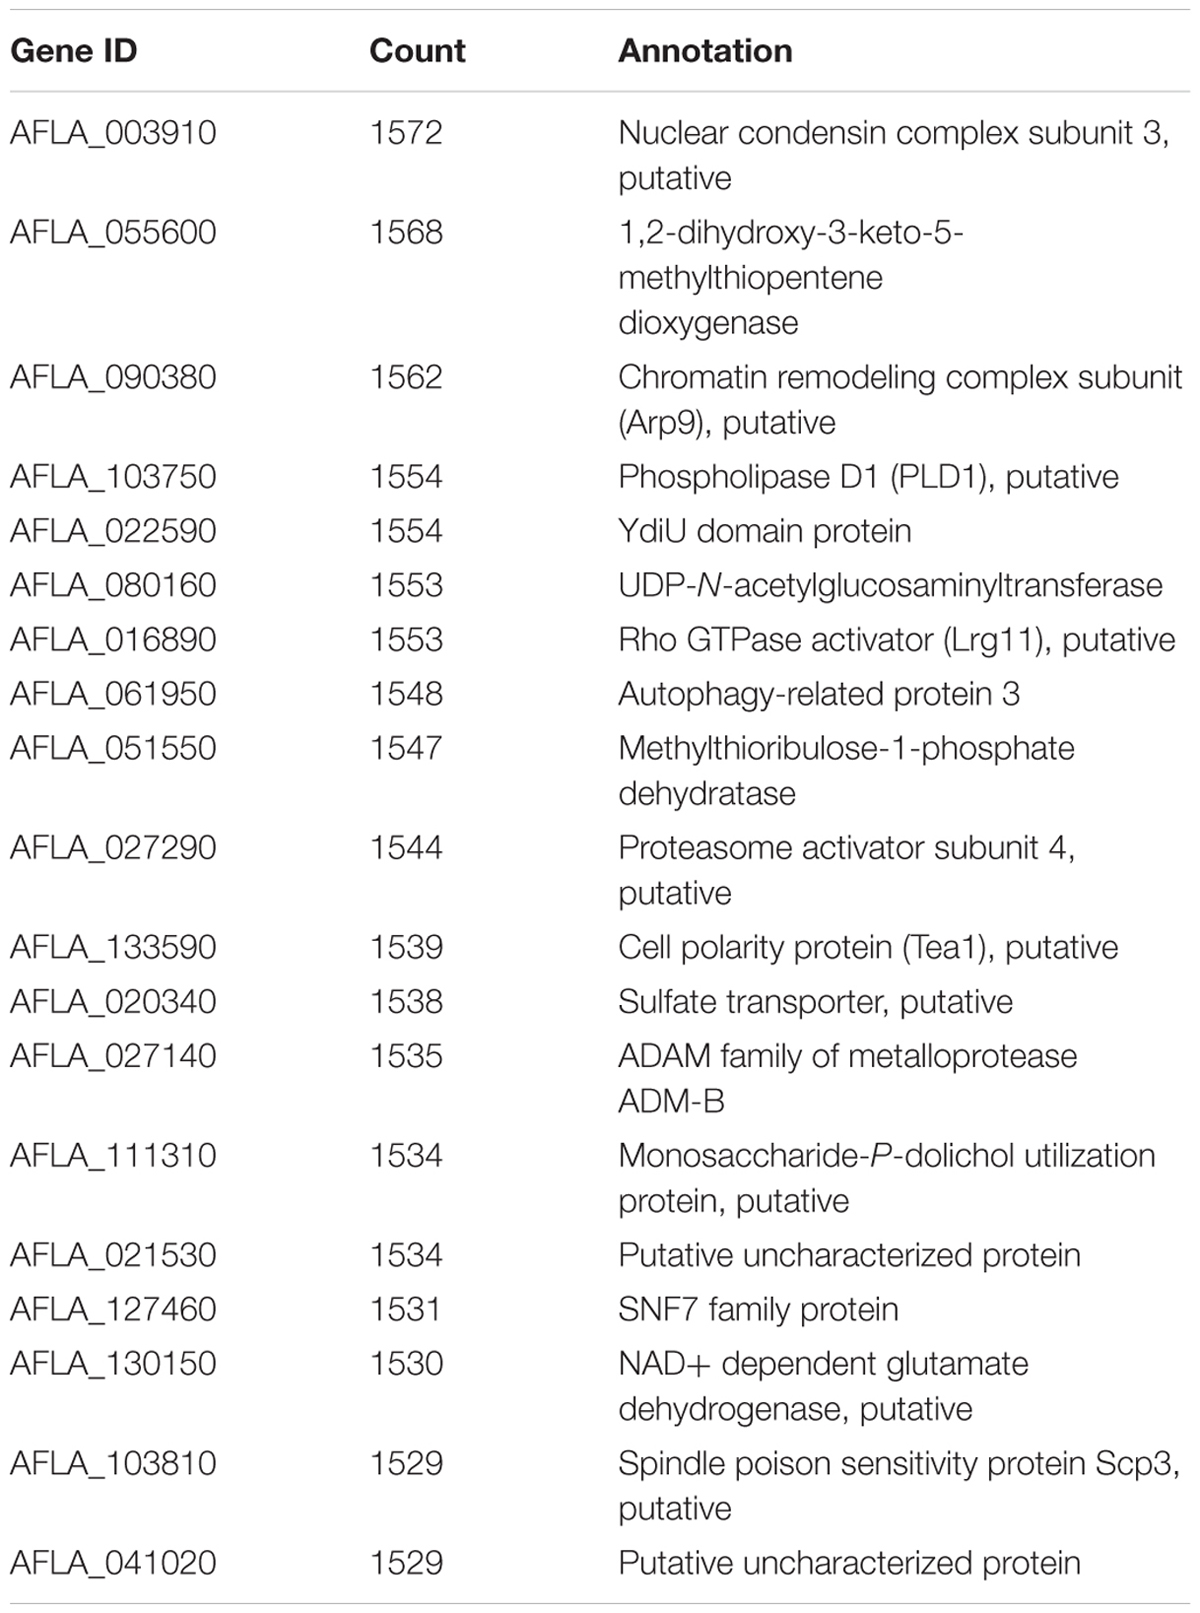
TABLE 2. Connectivity of the top 20 most connected genes in the gene co-expression network.
Further analysis of the GEN with the network analyzer module in Cytoscape revealed that the characteristic path lengths of the network was 2.773, which was smaller than the previously reported co-expression network for A. thaliana (5.065) (Cline et al., 2007; Carrera et al., 2009). This is likely due to the approach we used to select the input genes from the initial analysis of the network. In similar work described in the literature, all possible genes, as opposed to a select few, are sometimes used to generate co-expression networks (Schaefer et al., 2014). Our network, however, had a larger clustering coefficient of 0.606 in comparison to the reported 0.309 clustering coefficient in the Arabidopsis network.
Module Discovery of the Gene Co-expression Network Utilizing MCODE
MCODE clustering analysis identifies highly interconnected subgraphs within the co-expression network to determine significant clusters (Bader and Hogue, 2003). Initial analysis of our network identified multiple modules specific to Z. mays- Z. mays that were either coordinately up-regulated or down-regulated (Figure 4A). A large number of the gene expression patterns in Z. mays and A. flavus are oscillatory in nature due, among other things, to the circadian rhythm. The network was split into two subnets as shown in (Figures 4B,C). In one of the down-regulated modules, a set of differentially expressed genes of Z. mays included carrier proteins, protein biosynthesis genes, and response to abiotic stress genes. Significant clusters determined by MCODE clustering coefficient had functions that were related to circadian rhythm and vacuolar processes and were down-regulated through all of the samples (Figure 4C). Surprisingly, a number of heat shock proteins were also found to be significantly downregulated in these clusters; these genes are typically up-regulated during biotic stresses (Figure 4C; Chen et al., 2002; Jones and Dangl, 2006).

FIGURE 4. (A) Mcode Analysis of the Z. mays to Z. mays subnetwork from the gene co-expression network (GEN) was performed. (B,D) Shows subnetworks and the functionally enriched terms present within each of subnets that had greater than two interactions. (C,E) Show the genes that had the largest clustering coefficient in the subnetworks. (C) Represents the mcode analysis of (B,E,F) represents (D). For the tables show expression of the columns were order by a relative to the abundance of A. flavus. The gene ontology values were calculated using gprofiler and only significant terms were kept in the table (FDR <0.1).
Multiple genes related to resistance to pathogens are visualized in one of the subgraphs featuring up-regulated genes (Figure 4D). These genes were highly enriched for fungal specific responses, including the production of phytoalexins and chitin sensing, as well as for abiotic stress response. This sub-network seems to represent an up-regulated defense module. Figure 4E displays a subgraph with 4 Z. mays genes including (GRMZM2G358153) chitinase 1, GRMZM2G161472 (cytochrome P450), GRMZM2G122654 (cytochrome P450) and GRMZM2G415529 (pleiotropic drug resistance 11). The chitinase 1 gene has been often shown to be involved in resistance to pathogens. Moreover, MCODE pulled a gene subnetwork with a nine gene module believed to be related to pathogen resistance (Figure 4F). The module included (GRMZM2G129189) Endochitinase PR-4, which has been associated to the resistance to A. flavus and to other ear rots causing fungi (Wang et al., 1996; Borad and Sriram, 2008; Sels et al., 2008; Fountain et al., 2010).
Similar steps were taken to identify highly interconnected subgraphs within the A. flavus-A. flavus network. One module contains the aflatoxin cluster genes, including O-methyltransferase (AFLA_120990), O-methylsterigmatocytsin oxidoreductase (AFLA_139200), Noranthrone monoxygenase (AFLA_081900) as well as a previously uncharacterized gene (AFLA_081900) which may represent a new gene associated with the aflatoxin biosynthesis pathway.
Interactome Overlap
Interactomes have been noted to overlap with gene co-expression, presumably due to the selection toward improved efficiency in forming pathways and protein complexes (Bhardwaj and Lu, 2005). Therefore, Z. mays genes that were present within the GEN were mined for any potential physical connections in the maize interactome PiZeaM (Musungu et al., 2015). Of the 102 Z. mays genes that were found in the interspecies GEN (Figure 3), a small subnetwork of interacting proteins and first neighbors was identified. None of the Z. mays genes in that protein interactome subnet were significantly co-expressed in the GEN. Many of these proteins were involved in defense specific responses, such as oxidative stress pathway and jasmonic acid pathway, and thus may represent plant and maize specific patterns of co-expression not likely to be identified using the interlog method that produced the maize interactome. In the first neighbor analysis of the interactome proteins, we found multiple resistance genes that can be utilized for further investigation, such as OPR2. The interactome subnetwork analysis revealed that OPR2 was the largest hub, and that it interacted with heat shock proteins, glutathione proteins and PAD-1 domain containing proteins. Some of these genes have been previously implicated in resistance (Figure 5; Ferrari et al., 2003).
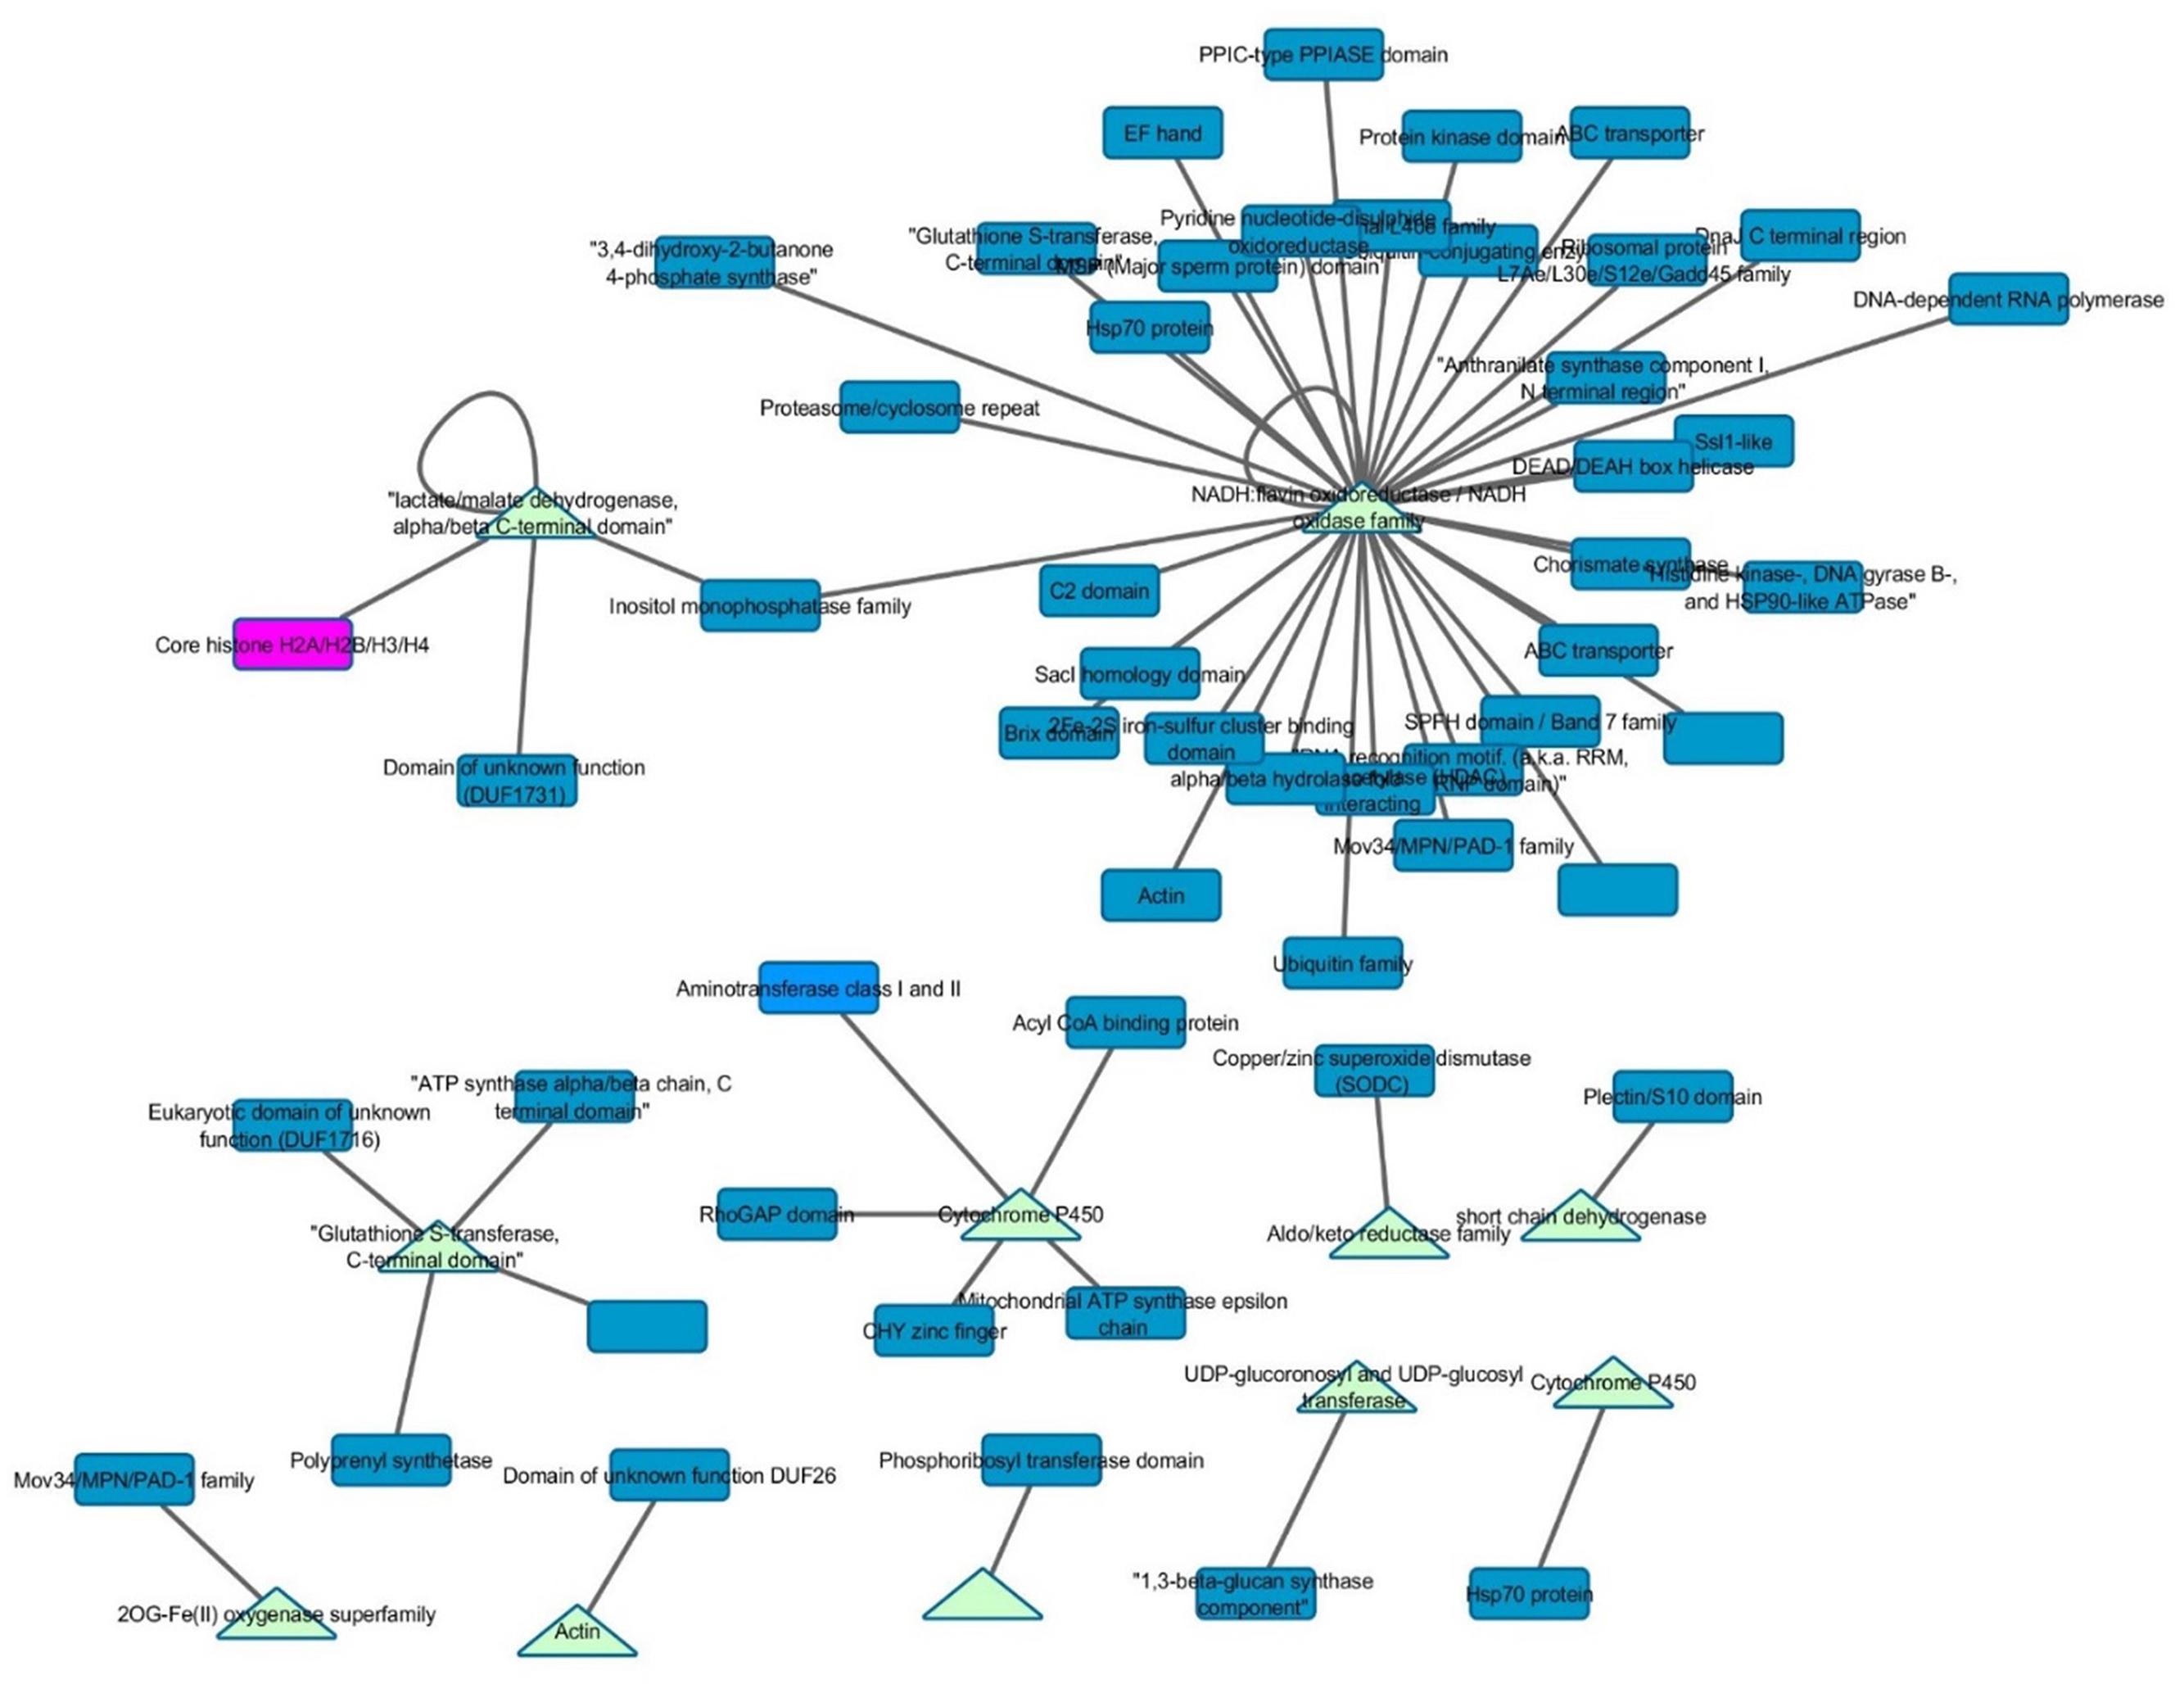
FIGURE 5. Gene co-expression and interactome overlap network. Genes found in the interspecies co-expression network (baits) were mined in the predicted maize interactome (PiZeaM) to determine novel interacting protein partners (preys). Triangles indicate that a gene is a bait gene from the static co-expression network and rectangles indicate first neighbors within the interactome.
Discussion
This work represents the first cross species co-expression network study of maize and A. flavus, and is also the first A. flavus co-expression network study to our knowledge. Our approach was taken to allow the mining of the data for non-traditional information in order to determine significant pathways that are correlated in A. flavus and Z. mays. The GENs are beneficial tools that are able to address questions dealing with complex biological systems. Because of the benefits of these types of analyses, RNA-seq gene expression data from an A. flavus/Z. mays time course experiment was used to identify novel genes of interest that are involved in this interaction. Initial analysis of the network demonstrated key properties that are shared with co-expression studies such as the high density of edges produced from the data set. One of the benefits from the gene co-expression analysis is the ability to infer the functional characteristics of a group of interacting genes. It also permits the analysis of genes that can otherwise be lost when doing QTL analysis for polygenic resistance studies. When combining these benefits with systems biology, it is possible to build networks of interest that allow for the use of guilt by association to infer possible common regulators of co-expressed genes and pathways. Moreover, GENs allow the use of a priori information to mine for new hypotheses.
In this analysis, novel genes identified by clustering and network analysis may be involved in aflatoxin production and transport, maize resistance to pathogens, and possibly host recognition. The central importance of jasmonate, ethylene, and ROS is clearly evident on the maize side, as is the co-expression linkage between pathogen toxin production and transport. Gene correlations were also detected across species. This subnetwork was highly asymmetric, with only 102 maize genes and 1944 pathogen genes. For the 102 maize genes that were found in the co-expressed network, it was determined that their functions were highly related to resistance to pathogens. This was seen by the presence of genes such as PR1and PR5. This is highly unusual, as roughly equal numbers of maize and A. flavus genes were differentially expressed, thus equivalent numbers of genes for host and pathogen co-expression would be expected by random chance. That A. flavus had almost 20 fold more genes than maize that responded across species may indicate that the pathogen was closely monitoring and responding to the host through these 102 key maize genes. These “pathogen” genes may thus represent part of the host recognition and response gene pathways.
One of the beneficial aspects of GENs is the ability to use them to complement the data generated from differentially expressed genes studies. One of the interesting findings in this study that correlates with previously reported research is the importance of Z. mays genes, such as LOX4, LOX6, OPR1, OPR2, in the A. flavus/Z. mays interaction. In this study, these genes were captured in the GEN. Also identified in the GEN were A. flavus genes related to transport signaling, such as COPI and COPII, as well as the ROS production genes in Z. mays AOX, peroxidase, and glutathione S-transferase. This matches previous studies reporting that mutations in lipoxygenases in Z. mays can have downstream effects on disease development and on aflatoxin production (Burow et al., 1997; Park et al., 2010; Scarpari et al., 2014; Throckmorton et al., 2016). Additionally, the GEN developed in this study revealed that several genes involved in ethylene induction are correlated with multiple A. flavus genes, exposing another facet of the interaction between A. flavus and Z. mays. This correlation could reflect one of the mechanisms A. flavus employs to respond to Z. mays ROS producing enzymes.
To fully exploit an A. flavus predicted protein–protein interactome (SUBEDI et al., 2015) multiple clustering, and GEN analyses were used. The generated data complemented the co-expression analysis, and multiple A. flavus genes were found to play a significant role in the A. flavus/Z. mays interaction as revealed in GENs and by K-means clustering. In fact, a hub containing 128 genes of interest was found to be co-expressed with secondary metabolite genes and transport genes in A. flavus. Each one of these 128 genes was mined in the String database of A. flavus to determine which genes should be considered as candidates for further studies (Szklarczyk et al., 2015). Interestingly, the gene (AFLA_026380) UbiD/Ubi4 was a center hub in the network interacting with multiple vesicle, endosome, and carbohydrate metabolism genes. This gene also interacted with (AFLA_025590) PalF, a pH regulator, and (AFLA_049870) AreA, a nitrogen regulator. This interaction is a key one because it has not been reported in previous studies, and involves two key domains involved in pH and nitrogen metabolism (Ehrlich et al., 2005; Tudzynski, 2014). Moreover, UbiD, also ranked the highest by connectivity in the A. flavus interactome (PiAF; SUBEDI et al., 2015), which reflects the biological importance of this protein.
Another interesting result from this study is the revealed importance of ROS in both A. flavus and Z. mays during the early interaction between these two organisms. The generated GEN reveals an extensive co-regulation of A. flavus genes involved in the aflatoxin biosynthesis cluster involving and Z. mays ROS genes. For instance, AflJ/S was found to be co-regulated with multiple Z. mays resistance genes that are known to be involved in the production of peroxides. This is, to our knowledge, the first report demonstrating that this interaction may be occurring during the early interaction between A. flavus and Z. mays. It also reveals one of the potential roles of AflJ/S which probably has multiple functions as demonstrated by transformation studies with AflJ/S orthologs (Chettri et al., 2015). It is to be noted here that the majority of the previously reported studies investigating genes such as AP-1, AtfB, Hsf-2, Skn-7, and Msn2-4, which are known regulators of ROS, were performed in culture and therefore not necessarily reflective of what actually occurs during the interaction between a pathogen and its host (Reverberi et al., 2005, 2008, 2010).
Conclusion
This work goes beyond the identification of genes relying primarily on differential expression of genes and uses GENs to infer functions of interest in A. flavus and Z. mays. Novel information from this study shows that A. flavus utilizes different mechanisms in response to the induction of resistance genes in Z. mays during the early interaction between the two organisms.
Accession Number
NCBI Accession Number SRP082421.
Author Contributions
Field work and RNA extraction was done by GO and GP. The data was analyzed by BM and MG. The manuscript was written and edited with BM, DP, AF, GP, and RB.
Conflict of Interest Statement
The authors declare that the research was conducted in the absence of any commercial or financial relationships that could be construed as a potential conflict of interest.
Acknowledgments
This work was funded through the USDA cooperative agreement (No. 58-6435-5-0-461), Agriculture and Food Research Initiative Competitive Grants Program of the US Department of Agriculture National Institute of Food and Agriculture (No. 2013-68004-20359) and USDA REE Cooperative Agreement (No. 58-6435-1-61).
Supplementary Material
The Supplementary Material for this article can be found online at: http://journal.frontiersin.org/article/10.3389/fgene.2016.00206/full#supplementary-material
FIGURE S1 | A random matrix of counts was converted to M-values (see Materials and Methods) and Pearson correlation values were calculated. The random correlation values are represented by the light blue color and yellow represents the differentially expressed correlation values for Aspergillus flavus and Zea mays. Additionally to determine if the distributions were significantly different a Kolmogorov–Smirnov test two sided was performed and significant p-value 2.2e × 10–16, D = 0.40356.
TABLE S1 | Gene expression matrix for correlation analysis.
TABLE S2 | Data from K-means clustering analysis.
References
Abdel-Hadi, A., Schmidt-Heydt, M., Parra, R., Geisen, R., and Magan, N. (2012). A systems approach to model the relationship between aflatoxin gene cluster expression, environmental factors, growth and toxin production by Aspergillus flavus. J. R. Soc. Interface 9, 757–767. doi: 10.1098/rsif.2011.0482
Amare, M. G., and Keller, N. P. (2014). Molecular mechanisms of Aspergillus flavus secondary metabolism and development. Fungal Genet. Biol. 66, 11–18. doi: 10.1016/j.fgb.2014.02.008
Bader, G. D., and Hogue, C. W. (2003). An automated method for finding molecular complexes in large protein interaction networks. BMC Bioinformatics 4:1. doi: 10.1186/1471-2105-4-1
Bhardwaj, N., and Lu, H. (2005). Correlation between gene expression profiles and protein–protein interactions within and across genomes. Bioinformatics 21, 2730–2738. doi: 10.1093/bioinformatics/bti398
Borad, V., and Sriram, S. (2008). Pathogenesis-related proteins for the plant protection. Asian J. Exp. Sci. 22, 189–196.
Burow, G. B., Nesbitt, T. C., Dunlap, J., and Keller, N. P. (1997). Seed lipoxygenase products modulate Aspergillus mycotoxin biosynthesis. Mol. Plant Microbe Interact. 10, 380–387. doi: 10.1094/MPMI.1997.10.3.380
Carlson, M. R., Zhang, B., Fang, Z., Mischel, P. S., Horvath, S., and Nelson, S. F. (2006). Gene connectivity, function, and sequence conservation: predictions from modular yeast coexpression networks. BMC Genomics 7:1. doi: 10.1186/1471-2164-7-1
Carrera, J., Rodrigo, G., Jaramillo, A., and Elena, S. F. (2009). Reverse-engineering the Arabidopsis thaliana transcriptional network under changing environmental conditions. Genome Biol. 10:R96. doi: 10.1186/gb-2009-10-9-r96
Chanda, A., Roze, L. V., and Linz, J. E. (2010). A possible role for exocytosis in aflatoxin export in Aspergillus parasiticus. Eukaryot. Cell 9, 1724–1727. doi: 10.1128/EC.00118-10
Chang, P.-K., Ehrlich, K. C., Yu, J., Bhatnagar, D., and Cleveland, T. E. (1995). Increased expression of Aspergillus parasiticus aflR, encoding a sequence-specific DNA-binding protein, relieves nitrate inhibition of aflatoxin biosynthesis. Appl. Environ. Microbiol. 61, 2372–2377.
Chang, P. K., Scharfenstein, L. L., Li, P., and Ehrlich, K. C. (2013). Aspergillus flavus VelB acts distinctly from VeA in conidiation and may coordinate with FluG to modulate sclerotial production. Fungal Genet. Biol. 5, 71–79. doi: 10.1016/j.fgb.2013.08.009
Chang, P. K., Yu, J., and Yu, J. H. (2004). aflT, a MFS transporter-encoding gene located in the aflatoxin gene cluster, does not have a significant role in aflatoxin secretion. Fungal Genet. Biol. 41, 911–920. doi: 10.1016/j.fgb.2004.06.007
Chen, Z.-Y., Brown, R. L., and Cleveland, T. E. (2004). Evidence for an association in corn between stress tolerance and resistance to Aspergillus flavus infection and aflatoxin contamination. Afr. J. Biotechnol. 3, 693–699.
Chen, Z. Y., Brown, R. L., Damann, K. E., and Cleveland, T. E. (2002). Identification of unique or elevated levels of kernel proteins in aflatoxin-resistant maize genotypes through proteome analysis. Phytopathology 92, 1084–1094. doi: 10.1094/PHYTO.2002.92.10.1084
Chettri, P., Ehrlich, K. C., and Bradshaw, R. E. (2015). Regulation of the aflatoxin-like toxin dothistromin by AflJ. Fungal Biol. 119, 503–508. doi: 10.1016/j.funbio.2015.01.007
Christensen, S. A., Huffaker, A., Kaplan, F., Sims, J., Ziemann, S., Doehlemann, G., et al. (2015). Maize death acids, 9-lipoxygenase–derived cyclopente(a)nones, display activity as cytotoxic phytoalexins and transcriptional mediators. Proc. Natl. Acad. Sci. U.S.A. 112, 11407–11412. doi: 10.1073/pnas.1511131112
Cline, M. S., Smoot, M., Cerami, E., Kuchinsky, A., Landys, N., Workman, C., et al. (2007). Integration of biological networks and gene expression data using Cytoscape. Nat. Protoc. 2, 2366–2382. doi: 10.1038/nprot.2007.324
De Bodt, S., Proost, S., Vandepoele, K., Rouzé, P., and Van de Peer, Y. (2009). Predicting proteinprotein interactions in Arabidopsis thaliana through integration of orthology, gene ontology and co-expression. BMC Genomics 10:288. doi: 10.1186/1471-2164-10-288
de Hoon, M. J. L., Imoto, S., Nolan, J., and Miyano, S. (2004). Open source clustering software. Bioinformatics 20, 1453–1454. doi: 10.1093/bioinformatics/bth078
Delgado, J., Owens, R. A., Doyle, S., Asensio, M. A., and Nunez, F. (2015). Impact of the antifungal protein PgAFP from Penicillium chrysogenum on the protein profile in Aspergillus flavus. Appl. Microbiol. Biotechnol. 99, 8701–8715. doi: 10.1007/s00253-015-6731-x
Diener, U. L., Cole, R. J., Sanders, T., Payne, G. A., Lee, L. S., and Klich, M. A. (1987). Epidemiology of aflatoxin formation by aspergillus flavus*. Annu. Rev. Phytopathol. 25, 249–270. doi: 10.1146/annurev.py.25.090187.001341
Duran, R. M., Cary, J. W., and Calvo, A. M. (2007). Production of cyclopiazonic acid, aflatrem, and aflatoxin by Aspergillus flavus is regulated by veA, a gene necessary for sclerotial formation. Appl. Microbiol. Biotechnol. 73, 1158–1168. doi: 10.1007/s00253-006-0581-5
Ehrlich, K., Montalbano, B., and Cary, J. (1999). Binding of the C6-zinc cluster protein, AFLR, to the promoters of aflatoxin pathway biosynthesis genes in Aspergillus parasiticus. Gene 230, 249–257. doi: 10.1016/S0378-1119(99)00075-X
Ehrlich, K. C., Mack, B. M., Wei, Q., Li, P., Roze, L. V., Dazzo, F., et al. (2012). Association with AflR in endosomes reveals new functions for AflJ in aflatoxin biosynthesis. Toxins 4, 1582–1600. doi: 10.3390/toxins4121582
Ehrlich, K. C., Montalbano, B. G., and Cotty, P. J. (2005). Divergent regulation of aflatoxin production at acidic pH by two Aspergillus strains. Mycopathologia 159, 579–581. doi: 10.1007/s11046-005-1150-7
Ferrari, S., Plotnikova, J. M., De Lorenzo, G., and Ausubel, F. M. (2003). Arabidopsis local resistance to Botrytis cinerea involves salicylic acid and camalexin and requires EDS4 and PAD2, but not SID2, EDS5 or PAD4. Plant J. 35, 193–205. doi: 10.1046/j.1365-313X.2003.01794.x
Fountain, J. C., Chen, Z.-Y., Scully, B. T., Kemerait, R. C., Lee, R. D., and Guo, B. (2010). Pathogenesis-related gene expressions in different maize genotypes under drought stressed conditions. Afr. J. Plant Sci. 4, 433–440.
Fountain, J. C., Khera, P., Yang, L., Nayak, S. N., Scully, B. T., Lee, R. D., et al. (2015). Resistance to Aspergillus flavus in maize and peanut: molecular biology, breeding, environmental stress, and future perspectives. Crop J. 3, 229–237. doi: 10.1016/j.cj.2015.02.003
Fountain, J. C., Scully, B. T., Ni, X., Kemerait, R. C., Lee, R. D., Chen, Z. Y., et al. (2014). Environmental influences on maize-Aspergillus flavus interactions and aflatoxin production. Front. Microbiol. 5:40. doi: 10.3389/fmicb.2014.00040
Fung, R. W., Wang, C. Y., Smith, D. L., Gross, K. C., and Tian, M. (2004). MeSA and MeJA increase steady-state transcript levels of alternative oxidase and resistance against chilling injury in sweet peppers (Capsicum annuum L.). Plant Sci. 166, 711–719. doi: 10.1016/j.plantsci.2003.11.009
Geisler-Lee, J., O’Toole, N., Ammar, R., Provart, N. J., Millar, A. H., and Geisler, M. (2007). A predicted interactome for Arabidopsis. Plant Physiol. 145, 317–329. doi: 10.1104/pp.107.103465
Gómez-Ariza, J., Campo, S., Rufat, M., Estopà, M., Messeguer, J., Segundo, B. S., et al. (2007). Sucrose-mediated priming of plant defense responses and broad-spectrum disease resistance by overexpression of the maize pathogenesis-related PRms protein in rice plants. Mol. Plant Microbe Interact. 20, 832–842. doi: 10.1094/MPMI-20-7-0832
Gu, H., Zhu, P., Jiao, Y., Meng, Y., and Chen, M. (2011). PRIN: a predicted rice interactome network. BMC Bioinformatics 12:161. doi: 10.1186/1471-2105-12-161
Guo, B., Chen, Z. Y., Lee, R. D., and Scully, B. T. (2008). Drought stress and preharvest aflatoxin contamination in agricultural commodity: genetics, genomics and proteomics. J. Integr. Plant Biol. 50, 1281–1291. doi: 10.1111/j.1744-7909.2008.00739.x
HanQing, F., Kun, S., MingQuan, L., Hongyu, L., Xin, L., Yan, L., et al. (2010). The expression, function and regulation of mitochondrial alternative oxidase under biotic stresses. Mol. Plant Pathol. 11, 429–440. doi: 10.1111/j.1364-3703.2010.00615.x
Hart, L., Catal, M., and Wang, Z. (2015). “Microarray analysis of Fusarium head blight toxin deoxynivalenol (DON) regulated genes of Arabidopsis thaliana,” in Proceedings of the National Fusarium Head Blight Forum, Milwaukee, WI, 36–40.
Ho, C.-L., Wu, Y., Shen, H.-B., Provart, N., and Geisler, M. (2012). A predicted protein interactome for rice. Rice 5:15. doi: 10.1186/1939-8433-5-15
Hong, E. J., Kim, N. K., Lee, D., Kim, W. G., and Lee, I. (2015). Overexpression of the laeA gene leads to increased production of cyclopiazonic acid in Aspergillus fumisynnematus. Fungal Biol. 119, 973–983. doi: 10.1016/j.funbio.2015.06.006
Jones, J. D., and Dangl, J. L. (2006). The plant immune system. Nature 444, 323–329. doi: 10.1038/nature05286
Kale, S. P., Milde, L., Trapp, M. K., Frisvad, J. C., Keller, N. P., and Bok, J. W. (2008). Requirement of LaeA for secondary metabolism and sclerotial production in Aspergillus flavus. Fungal Genet. Biol. 45, 1422–1429. doi: 10.1016/j.fgb.2008.06.009
Klionsky, D. J., Herman, P. K., and Emr, S. D. (1990). The fungal vacuole: composition, function, and biogenesis. Microbiol. Rev. 54, 266–292.
Lane, B., Dunwell, J. M., Ray, J., Schmitt, M., and Cuming, A. (1993). Germin, a protein marker of early plant development, is an oxalate oxidase. J. Biol. Chem. 268, 12239–12242.
Lanubile, A., Maschietto, V., De Leonardis, S., Battilani, P., Paciolla, C., and Marocco, A. (2015). Defense responses to mycotoxin-producing fungi Fusarium proliferatum, F. subglutinans, and Aspergillus flavus in kernels of susceptible and resistant maize genotypes. Mol. Plant Microbe Interact. 28, 546–557. doi: 10.1094/MPMI-09-14-0269-R
Libault, M., Farmer, A., Joshi, T., Takahashi, K., Langley, R. J., Franklin, L. D., et al. (2010). An integrated transcriptome atlas of the crop model Glycine max, and its use in comparative analyses in plants. Plant J. 63, 86–99. doi: 10.1111/j.1365-313X.2010.04222.x
Linz, J. E., Chanda, A., Hong, S.-Y., Whitten, D. A., Wilkerson, C., and Roze, L. V. (2011). Proteomic and biochemical evidence support a role for transport vesicles and endosomes in stress response and secondary metabolism in Aspergillus parasiticus. J. Proteome Res. 11, 767–775. doi: 10.1021/pr2006389
Love, M. I., Huber, W., and Anders, S. (2014). Moderated estimation of fold change and dispersion for RNA-seq data with DESeq2. Genome Biol. 15:550. doi: 10.1186/s13059-014-0550-8
Luo, M., Brown, R. L., Chen, Z.-Y., Menkir, A., Yu, J., and Bhatnagar, D. (2011). Transcriptional profiles uncover Aspergillus flavus-induced resistance in maize kernels. Toxins 3, 766–786. doi: 10.3390/toxins3070766
Luo, M., Liu, J., Lee, R., and Guo, B. (2008). Characterization of gene expression profiles in developing kernels of maize (Zea mays) inbred Tex6. Plant Breed. 127, 569–578.
Lyons, R., Manners, J. M., and Kazan, K. (2013). Jasmonate biosynthesis and signaling in monocots: a comparative overview. Plant Cell Rep. 32, 815–827. doi: 10.1007/s00299-0131400-y
Maere, S., Heymans, K., and Kuiper, M. (2005). BiNGO: a Cytoscape plugin to assess overrepresentation of Gene Ontology categories in Biological Networks. Bioinformatics 21, 3448–3449. doi: 10.1093/bioinformatics/bti551
Magnin-Robert, M., Le Bourse, D., Markham, J., Dorey, S., Clement, C., Baillieul, F., et al. (2015). Modifications of sphingolipid content affect tolerance to hemibiotrophic and necrotrophic pathogens by modulating plant defense responses in Arabidopsis. Plant Physiol. 169, 2255–2274. doi: 10.1104/pp.15.01126
Mao, L., Van Hemert, J. L., Dash, S., and Dickerson, J. A. (2009). Arabidopsis gene co-expression network and its functional modules. BMC Bioinformatics 10:346. doi: 10.1186/1471-2105-10-346
Massey, F. J. Jr. (1951). The Kolmogorov-Smirnov test for goodness of fit. J. Am. Stat. Assoc. 46, 68–78. doi: 10.1080/01621459.1951.10500769
Mideros, S. X., Warburton, M. L., Jamann, T. M., Windham, G. L., Williams, W. P., and Nelson, R. J. (2014). Quantitative trait loci influencing mycotoxin contamination of maize: analysis by linkage mapping, characterization of near-isogenic lines, and meta-analysis. Crop Sci. 54, 127–142. doi: 10.2135/cropsci2013.04.0249
Mori, I. C., and Schroeder, J. I. (2004). Reactive oxygen species activation of plant Ca2+ channels. A signaling mechanism in polar growth, hormone transduction, stress signaling, and hypothetically mechanotransduction. Plant Physiol. 135, 702–708. doi: 10.1104/pp.104.042069
Musungu, B., Bhatnagar, D., Brown, R. L., Fakhoury, A. M., and Geisler, M. (2015). A predicted protein interactome identifies conserved global networks and disease resistance subnetworks in maize. Front. Genet. 6:201. doi: 10.3389/fgene.2015.00201
Park, Y.-S., Kunze, S., Ni, X., Feussner, I., and Kolomiets, M. V. (2010). Comparative molecular and biochemical characterization of segmentally duplicated 9-lipoxygenase genes ZmLOX4 and ZmLOX5 of maize. Planta 231, 1425–1437. doi: 10.1007/s00425-010-1143-8
Pauwels, L., and Goossens, A. (2011). The JAZ proteins: a crucial interface in the jasmonate signaling cascade. Plant Cell 23, 3089–3100. doi: 10.1105/tpc.111.089300
Petre, B., Major, I., Rouhier, N., and Duplessis, S. (2011). Genome-wide analysis of eukaryote thaumatin-like proteins (TLPs) with an emphasis on poplar. BMC Plant Biol. 11:33. doi: 10.1186/1471-2229-11-33
Reimand, J., Arak, T., Adler, P., Kolberg, L., Reisberg, S., Peterson, H., et al. (2016). g:Profiler-a web server for functional interpretation of gene lists (2016 update). Nucleic Acids Res. 44, W83–W89. doi: 10.1093/nar/gkw199
Reverberi, M., Fabbri, A., Zjalic, S., Ricelli, A., Punelli, F., and Fanelli, C. (2005). Antioxidant enzymes stimulation in Aspergillus parasiticus by Lentinula edodes inhibits aflatoxin production. Appl. Microbiol. Biotechnol. 69, 207–215. doi: 10.1007/s00253-005-1979-1
Reverberi, M., Punelli, F., Scarpari, M., Camera, E., Zjalic, S., Ricelli, A., et al. (2010). Lipoperoxidation affects ochratoxin A biosynthesis in Aspergillus ochraceus and its interaction with wheat seeds. Appl. Microbiol. Biotechnol. 85, 1935–1946. doi: 10.1007/s00253-009-2220-4
Reverberi, M., Zjalic, S., Ricelli, A., Punelli, F., Camera, E., Fabbri, C., et al. (2008). Modulation of antioxidant defense in Aspergillus parasiticus is involved in aflatoxin biosynthesis: a role for the ApyapA gene. Eukaryot. Cell 7, 988–1000. doi: 10.1128/EC.00228-07
Rohlfs, M. (2015). “Fungal secondary metabolism in the light of animal–fungus interactions: from mechanism to ecological function,” in Biosynthesis and Molecular Genetics of Fungal Secondary Metabolites, Vol. 2, eds S. Zeilinger, J.-F. Martín, and C. García-Estrada (New York, NY: Springer), 177–198.
Rowland, O., Ludwig, A. A., Merrick, C. J., Baillieul, F., Tracy, F. E., Durrant, W. E., et al. (2005). Functional analysis of Avr9/Cf-9 rapidly elicited genes identifies a protein kinase, ACIK1, that is essential for full Cf-9–dependent disease resistance in tomato. Plant Cell 17, 295–310. doi: 10.1105/tpc.104.026013
Roze, L. V., Chanda, A., and Linz, J. E. (2011). Compartmentalization and molecular traffic in secondary metabolism: a new understanding of established cellular processes. Fungal Genet. Biol. 48, 35–48. doi: 10.1016/j.fgb.2010.05.006
Saeed, A. I., Bhagabati, N. K., Braisted, J. C., Liang, W., Sharov, V., Howe, E. A., et al. (2006). [9] TM4 microarray software suite. Methods Enzymol. 411, 134–193. doi: 10.1016/S0076-6879(06)11009-5
Scarpari, M., Punelli, M., Scala, V., Zaccaria, M., Nobili, C., Ludovici, M., et al. (2014). Lipids in Aspergillus flavus-maize interaction. Front. Microbiol. 5:74. doi: 10.3389/fmicb.2014.00074
Schaefer, R. J., Briskine, R., Springer, N. M., and Myers, C. L. (2014). Discovering functional modules across diverse maize transcriptomes using COB, the Co-expression Browser. PLoS ONE 9:e99193. doi: 10.1371/journal.pone.0099193
Sekhon, R. S., Briskine, R., Hirsch, C. N., Myers, C. L., Springer, N. M., Buell, C. R., et al. (2013). Maize gene atlas developed by RNA sequencing and comparative evaluation of transcriptomes based on RNA sequencing and microarrays. PLoS ONE 8:e61005. doi: 10.1371/journal.pone.0061005
Sels, J., Mathys, J., De Coninck, B., Cammue, B., and De Bolle, M. F. (2008). Plant pathogenesisrelated (PR) proteins: a focus on PR peptides. Plant Physiol. Biochem. 46, 941–950. doi: 10.1016/j.plaphy.2008.06.011
Shannon, P., Markiel, A., Ozier, O., Baliga, N. S., Wang, J. T., Ramage, D., et al. (2003). Cytoscape: a software environment for integrated models of biomolecular interaction networks. Genome Res. 13, 2498–2504. doi: 10.1101/gr.1239303
Shu, X., Livingston, D. P. III, Franks, R. G., Boston, R. S., Woloshuk, C. P., and Payne, G. A. (2015). Tissue-specific gene expression in maize seeds during colonization by Aspergillus flavus and Fusarium verticillioides. Mol. Plant Pathol. 16, 662–674. doi: 10.1111/mpp.12224
Simons, B. H., Millenaar, F. F., Mulder, L., Van Loon, L. C., and Lambers, H. (1999). Enhanced expression and activation of the alternative oxidase during infection of Arabidopsis with Pseudomonas syringae pv tomato. Plant Physiol. 120, 529–538. doi: 10.1104/pp.120.2.529
Subedi, A., Musungu, B. M., Geisler, M., Brown, R. L., Bhatnagar, D., and Fakhoury, A. M. (2015). “PiAF, a Predicted Protein-Protein Interactome of Aspergillus flavus,” in Proceedings of the American Phytopathological Society Annual Meeting, Pasadena, CA.
Szklarczyk, D., Franceschini, A., Wyder, S., Forslund, K., Heller, D., Huerta-Cepas, J., et al. (2015). STRING v10: protein–protein interaction networks, integrated over the tree of life. Nucleic Acids Res. 43, D447–D452. doi: 10.1093/nar/gku1003
Tang, J. D., Perkins, A., Williams, W. P., and Warburton, M. L. (2015). Using genome-wide associations to identify metabolic pathways involved in maize aflatoxin accumulation resistance. BMC Genomics 16:673. doi: 10.1186/s12864-015-1874-9
Throckmorton, K., Lim, F. Y., Kontoyiannis, D. P., Zheng, W., and Keller, N. P. (2016). Redundant synthesis of a conidial polyketide by two distinct secondary metabolite clusters in Aspergillus fumigatus. Environ. Microbiol. 18, 246–259. doi: 10.1111/1462-2920.13007
Torres, M. A., Jones, J. D. G., and Dangl, J. L. (2006). Reactive oxygen species signaling in response to pathogens. Plant Physiol. 141, 373–378. doi: 10.1104/pp.106.079467
Tsitsigiannis, D. I., Kunze, S., Willis, D. K., Feussner, I., and Keller, N. P. (2005). Aspergillus infection inhibits the expression of peanut 13 S-HPODE-forming seed lipoxygenases. Mol. Plant Microbe Interact. 18, 1081–1089. doi: 10.1094/MPMI-18-1081
Tudzynski, B. (2014). Nitrogen regulation of fungal secondary metabolism in fungi. Front. Microbiol. 5:656. doi: 10.3389/fmicb.2014.00656
Wachi, S., Yoneda, K., and Wu, R. (2005). Interactome-transcriptome analysis reveals the high centrality of genes differentially expressed in lung cancer tissues. Bioinformatics 21, 4205–4208. doi: 10.1093/bioinformatics/bti688
Wang, X., Zafian, P., Choudhary, M., and Lawton, M. (1996). The PR5K receptor protein kinase from Arabidopsis thaliana is structurally related to a family of plant defense proteins. Proc. Natl. Acad. Sci. U.S.A. 93, 2598–2602. doi: 10.1073/pnas.93.6.2598
Warburton, M. L., Tang, J. D., Windham, G. L., Hawkins, L. K., Murray, S. C., Xu, W., et al. (2015). Genome-wide association mapping of and aflatoxin accumulation resistance in maize. Crop Sci. 55, 1857. doi: 10.3390/toxins8090258
Yin, Z., Wang, Y., Wu, F., Gu, X., Bian, Y., Wang, Y., et al. (2014). Quantitative trait locus mapping of resistance to Aspergillus flavus infection using a recombinant inbred line population in maize. Mol. Breed. 33, 39–49. doi: 10.1007/s11032-013-9932-y
Keywords: Aspergillus flavus Zea mays, networks, RNA-sequencing, gene co-expression analysis
Citation: Musungu BM, Bhatnagar D, Brown RL, Payne GA, OBrian G, Fakhoury AM and Geisler M (2016) A Network Approach of Gene Co-expression in the Zea mays/Aspergillus flavus Pathosystem to Map Host/Pathogen Interaction Pathways. Front. Genet. 7:206. doi: 10.3389/fgene.2016.00206
Received: 22 August 2016; Accepted: 04 November 2016;
Published: 21 November 2016.
Edited by:
Xiaogang Wu, Institute for Systems Biology, USAReviewed by:
Mingyi Wang, Samuel Roberts Noble Foundation, USAMehdi Razzaghi-Abyaneh, Pasteur Institute of Iran, Iran
Copyright © 2016 Musungu, Bhatnagar, Brown, Payne, OBrian, Fakhoury and Geisler. This is an open-access article distributed under the terms of the Creative Commons Attribution License (CC BY). The use, distribution or reproduction in other forums is permitted, provided the original author(s) or licensor are credited and that the original publication in this journal is cited, in accordance with accepted academic practice. No use, distribution or reproduction is permitted which does not comply with these terms.
*Correspondence: Matt Geisler, mgeisler@plant.siu.edu Ahmad M. Fakhoury, amfakhou@siu.edu