Unraveling the Repertoire in Wiskott–Aldrich Syndrome
 Amy E. O’Connell1
 Stefano Volpi1
 Kerry Dobbs1
 Claudia Fiorini2
 Erdyni Tsitsikov3Helen de Boer2
 Isil B. Barlan4
 Jenny M. Despotovic5Francisco J. Espinosa-Rosales6
 I. Celine Hanson5
 Maria G. Kanariou7
 Roxana Martínez-Beckerat8
 Alvaro Mayorga-Sirera9Carmen Mejia-Carvajal10Nesrine Radwan11
 Aaron R. Weiss12
 Sung-Yun Pai2
 Yu Nee Lee1
 Luigi D. Notarangelo1,13*
- 1Department of Immunology, Boston Children’s Hospital, Boston, MA, USA
- 2Department of Hematology/Oncology, Boston Children’s Hospital, Boston, MA, USA
- 3Department of Laboratory Medicine, Boston Children’s Hospital, Boston, MA, USA
- 4Marmara University Medical Center, Istanbul, Turkey
- 5Texas Children’s Hospital, Houston, TX, USA
- 6Instituto Nacional de Pediatría, Mexico City, Mexico
- 7Aghia Sophia Children’s Hospital, Athens, Greece
- 8Department of Pediatric Hemato-Oncology, Hospital Mario Catarino Rivas, San Pedro Sula, Honduras
- 9Centro de Neumologia y Alergia, San Pedro Sula, Honduras
- 10Manati Medical Center, Manati, Puerto Rico, PR, USA
- 11Ain Shams University, Cairo, Egypt
- 12Maine Medical Center, Portland, ME, USA
- 13Manton Center for Orphan Disease Research, Boston Children’s Hospital, Boston, MA, USA
The Wiskott–Aldrich syndrome (WAS) is due to mutations of the WAS gene encoding for the cytoskeletal WAS protein, leading to abnormal downstream signaling from the T cell and B cell antigen receptors (TCR and BCR). We hypothesized that the impaired signaling through the TCR and BCR in WAS would subsequently lead to aberrations in the immune repertoire of WAS patients. Using next generation sequencing (NGS), the T cell receptor β and B cell immunoglobulin heavy chain (IGH) repertoires of eight patients with WAS and six controls were sequenced. Clonal expansions were identified within memory CD4+ cells as well as in total, naïve and memory CD8+ cells from WAS patients. In the B cell compartment, WAS patient IGH repertoires were also clonally expanded and showed skewed usage of IGHV and IGHJ genes, and increased usage of IGHG constant genes, compared with controls. To our knowledge, this is the first study that demonstrates significant abnormalities of the immune repertoire in WAS patients using NGS.
Introduction
The Wiskott–Aldrich syndrome (WAS) is an X-linked disease characterized by the triad of eczema, microthrombocytopenia, and immunodeficiency (1, 2). Patients are also predisposed to autoimmunity and malignancy, resulting in poor clinical outcome overall (3, 4). The WAS gene encodes for the WAS protein (WASp) (5), which is expressed solely in hematopoietic cells, and is recruited to the inner cell membrane in response to activating signals, including engagement of the T and B cell antigen receptors (TCR and BCR) (6, 7). Upon activation, WASp recruits the Arp2/3 complex, triggering actin polymerization (8).
Deficiency of WASp is associated with significant immune abnormalities that affect all leukocytes (9). In particular, WAS patients manifest progressive T cell lymphopenia (10) and impaired formation of the immune synapse, defective IL-2 secretion, and reduced proliferation in response to TCR ligation (11, 12). The B cell compartment is also affected in WAS. Increased autoantibody production has been demonstrated in WASp-deficient patients and mice, and studies in mice lacking WASp solely in B lymphocytes have showed that this immune dysregulation reflects B cell intrinsic mechanisms, with increased hyper-responsiveness of WASp-deficient B cells to both BCR and toll-like receptor signaling (13, 14). WASp is also an important regulator of marginal zone (MZ) B cell maturation and positioning (15). It has been also reported that patients with WAS have an increased proportion of circulating CD19+ CD21low CD38low B cells (16, 17), which have been characterized as autoreactive-prone B cells (18). Finally, WAS patients have an increased number of peripheral transitional B cells and a concomitant decrease in immature B cells in the bone marrow (16). These abnormalities are probably secondary to decreased responsiveness to the chemotactic factor CXCL12, which signals through CXCR4 to retain immature B cells in the bone marrow.
T cell receptor- and BCR-mediated signaling plays a critical role in determining T and B cell fate during development and antigen-specific responses, and therefore, contributes to shaping the peripheral T and B cell repertoire. The diversity and complexity of the immune repertoire may in turn affect robustness of the immune response and disease outcome (19). Only limited information is available on TCR and BCR repertoire diversity and composition in WAS. Using complementarity determining region 3 (CDR3) spectratyping, Wada et al. demonstrated reduced diversity of the T cell receptor β (TRB) repertoire in WAS patients >15 years of age (20). More recently, limited diversity of the TRB repertoire was demonstrated with the same technique also in young WAS patients, and this abnormality was corrected by gene therapy (21). Finally, two groups have recently reported skewed usage of IGHV genes belonging to the VH3 and VH4 families in circulating B cells from patients with WAS, and reduced rate of somatic hypermutation (SHM) among Cγ- and Cα-containing immunoglobulin transcripts (16, 17). However, studies of T and B cell receptor repertoire diversity in WAS have been conducted using techniques (CDR3 spectratyping, targeted cloning, and sequencing) that permit only a descriptive assessment, or that sample only a limited number of sequences. Next generation sequencing (NGS) involves the use of high throughput sequencing technology to simultaneously amplify and analyze thousands of DNA or RNA sequences [reviewed in Ref. (22–25)]. Using this approach, single TCR and BCR rearranged genomic products or transcripts contained in a given sample can be amplified and individually sequenced. This permits robust analysis of repertoire diversity, and to assess the possible presence of clonotypic expansions; V, D, and J segment usage patterns; distribution and amino acid composition of CDR3 regions; sharing of CDR3 clonotypes between cell compartments; and SHM frequency. Here, we report for the first time on the use of NGS to analyze the expressed TRB and IGH repertoire of circulating T and B lymphocyte subsets isolated from patients with WAS and healthy controls. Our results demonstrate that patients with WAS present significant restriction of the TRB repertoire as well as abnormal distribution of the CDR3 length and skewed usage of V and J gene elements both at TRB and at the IGH loci. These abnormalities are present already at young age and are especially prominent within CD8+ T lymphocytes, possibly reflecting recurrent and/or chronic infections or the emergence of somatic revertant clones. Restriction of repertoire diversity may further contribute to the immunodeficiency of WAS.
Materials and Methods
Study Subjects
Approval for the study was obtained from the Boston Children’s Hospital (BCH) institutional review board prior to initiation. Informed consent (and informed assent where appropriate) was granted by all study subjects and/or parents/guardians at the time of enrollment. Peripheral blood samples from patients with WAS (W1–W8) and healthy controls (C1–C6) were obtained by venipuncture either at BCH or at the collaborating institutions. Samples shipped from collaborators were processed within 4 days of the sample being drawn.
Sample Preparation
Isolating cell sub-populations
Peripheral blood mononuclear cells (PBMCs) were isolated from peripheral blood using Ficoll Paque Plus (GE Healthcare, Boston, MA, USA) gradient cell separation according to manufacturer’s instructions. Red blood cells were lysed using a 1× dilution of BD Pharm lyse (BD Biosciences) in sterile water and incubating the cells for 5–10 min. For total CD4, CD8, and B cell samples, isolated PBMCs were labeled sequentially with anti-human CD4 and CD8 magnetic beads (Miltenyi Biotec, San Diego, CA, USA) and respective fractions were obtained by positive magnetic selection while B cell-enriched fraction was obtained by negative selection of CD4+ and CD8+ PBMCs. For CD4 and CD8 naïve and memory populations, isolated PBMCs were labeled with mouse anti-human fluorescent antibodies: anti-CD3 PE/Cy7, anti-CD4 PE, anti-CD8 APC, anti-CD45RA FITC, and anti-CCR7 Pacific Blue (eBiosciences, San Diego, CA, USA). Cells were stained for 30 min and then washed and sorted on a BD FACS Aria II cell sorter. Naïve CD4+ and CD8+ T cells were sorted based on the CD45RA+ CCR7+ phenotype. With this sorting strategy, the naïve T cell compartment did not include CD45RA+ CCR7− cells that correspond to the exhausted effector memory T cell (TEMRA), which is often expanded in patients with WAS (Table 1). Cell purity was checked after sorting and was consistently >92%.
TABLE 1
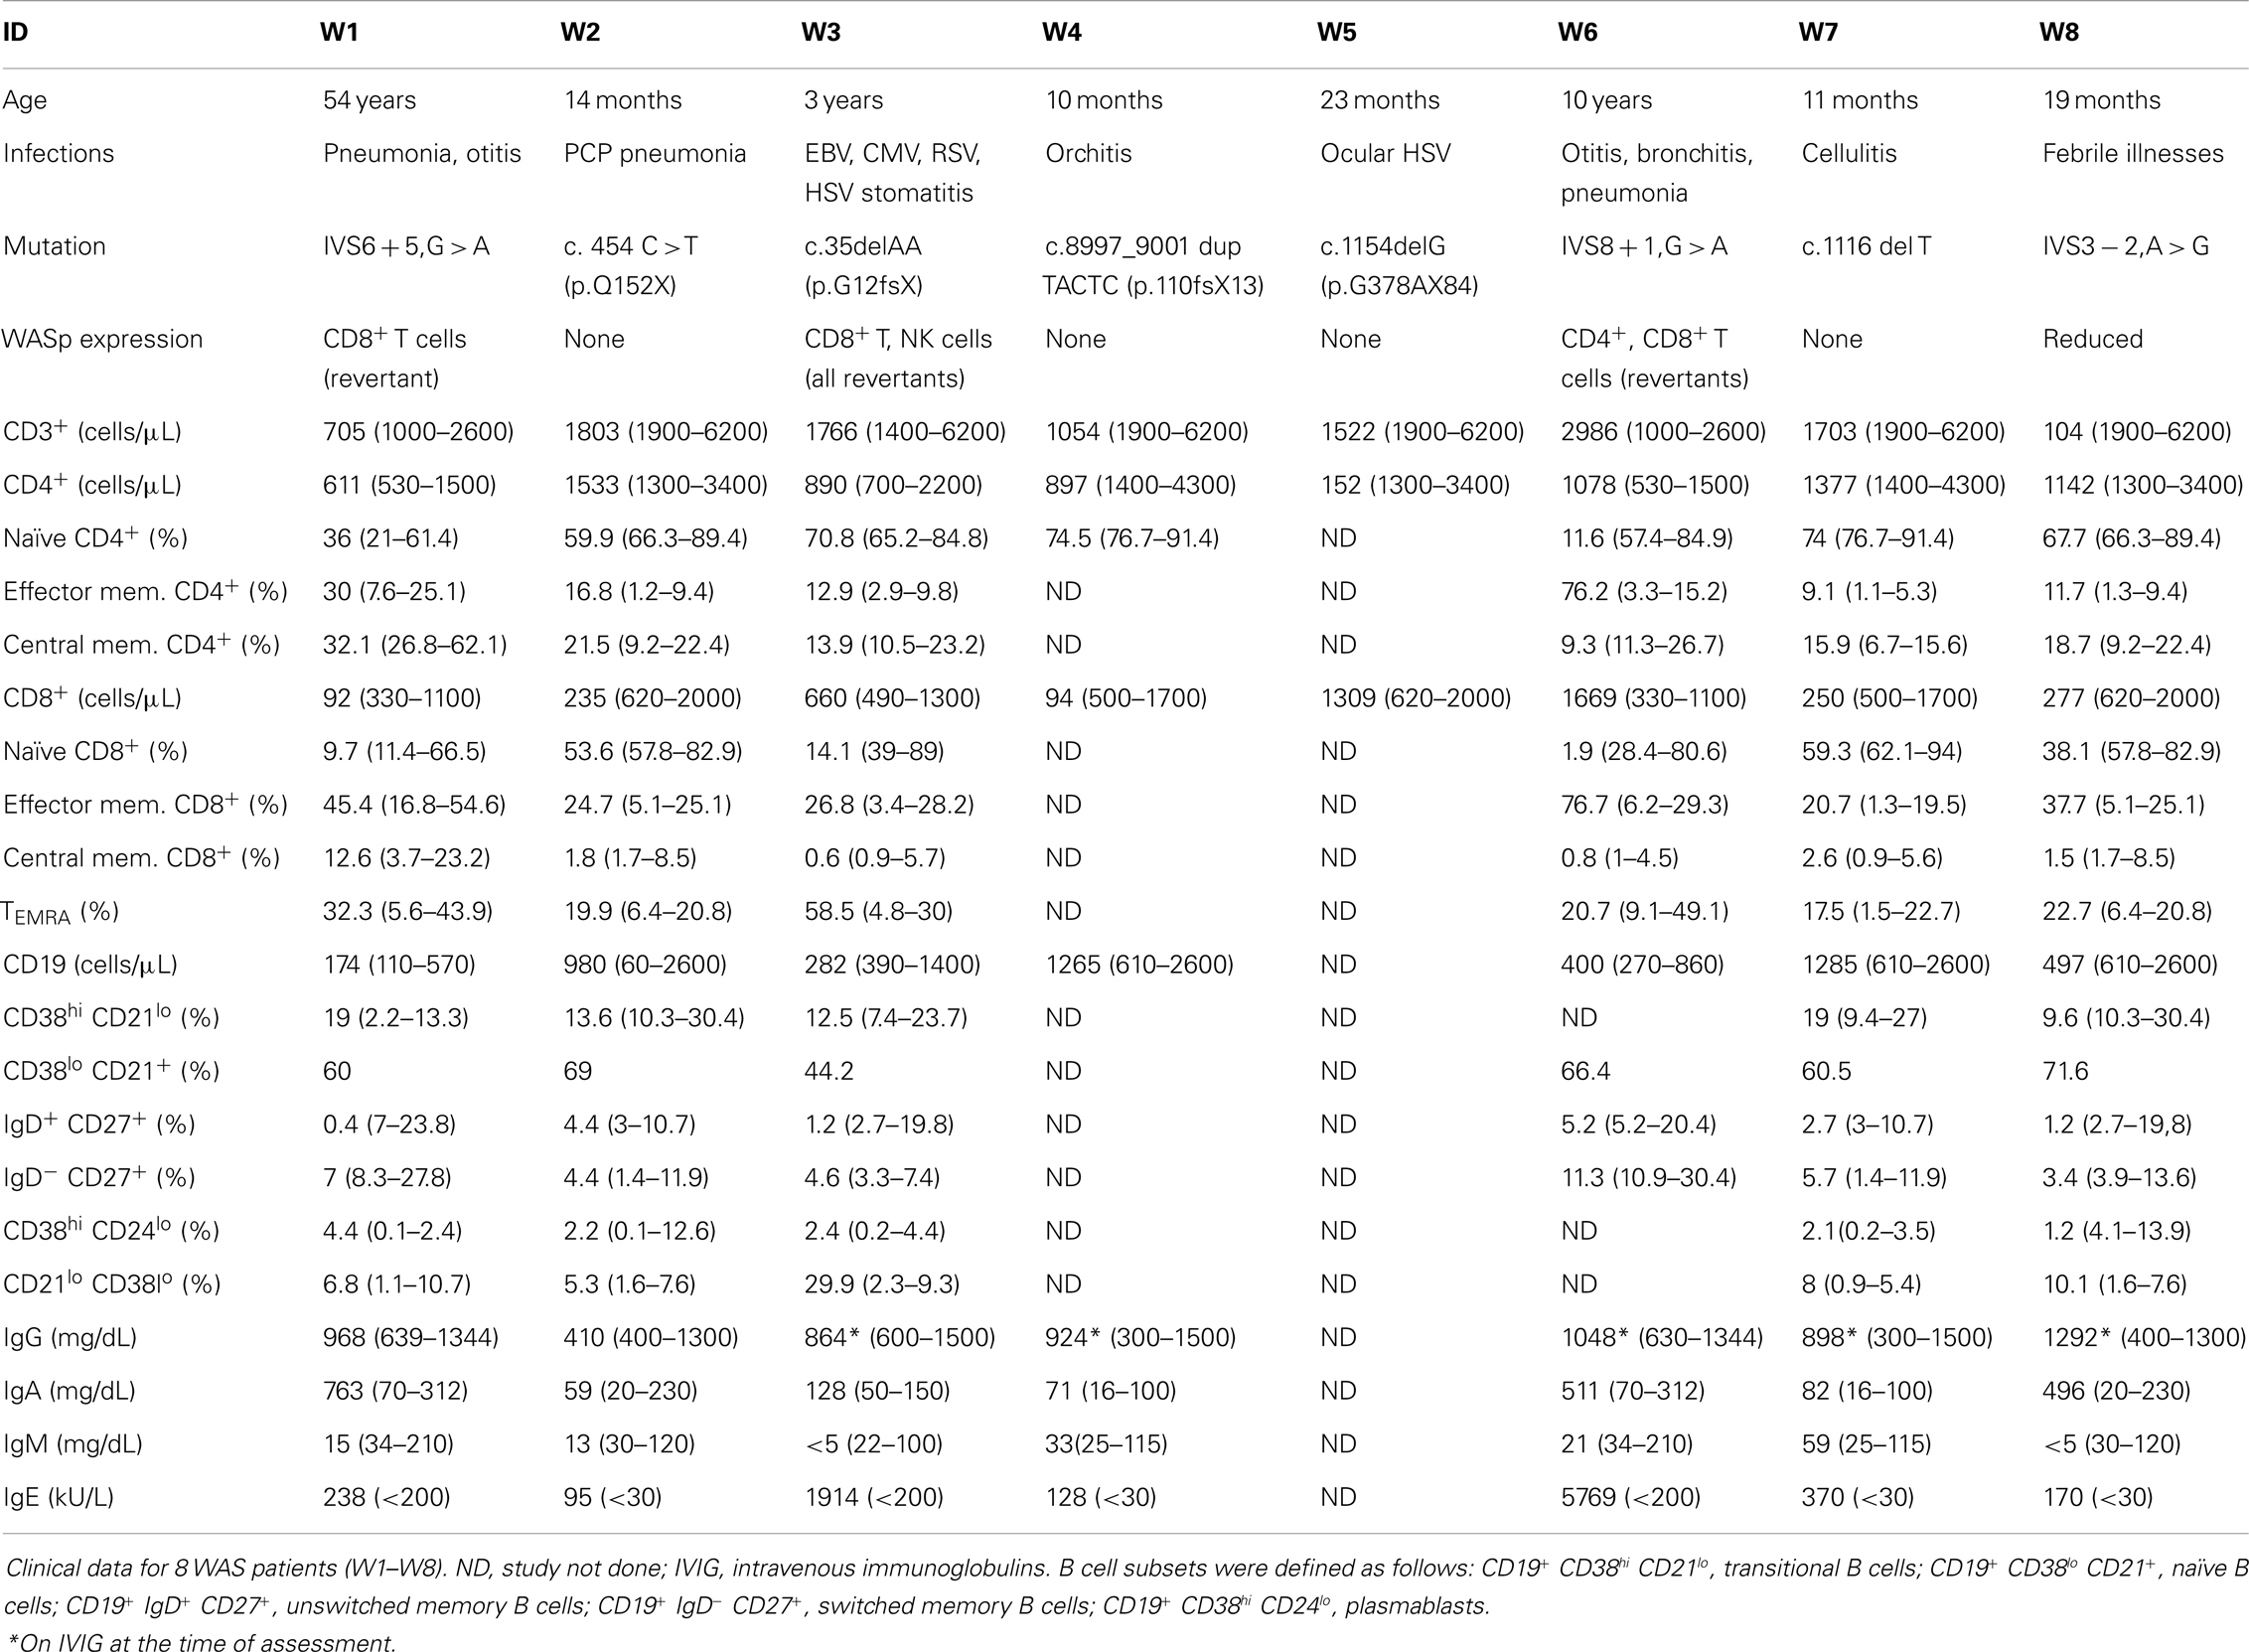
Table 1. Patient characteristics.
Reverse transcription PCR and sequencing
Sorted cells were placed in Trizol (Ambion, Inc/Life Technologies, Grand Island, NY, USA) and mRNA was extracted according to the manufacturer’s instructions. mRNA samples were then subjected to reverse transcription PCR (RT-PCR) using a Qiagen OneStep RT-PCR kit (Qiagen Inc., Valencia, CA, USA) and iRepertoire® human T cell beta receptor (HTBR) primers (iRepertoire Inc., Huntsville, AL, USA) for T cell samples, or human immunoglobulin heavy chain (HIGH) primers for B cell samples, under the reaction conditions specified by iRepertoire®. Each primer contained a barcode that was integrated into the PCR, allowing donor identification. A second PCR was then carried out using a Qiagen Multiplex PCR kit and the iRepertoire® 454 Lib-A primers, again under conditions specified by iRepertoire®. The samples were run on a 2% agarose gel, and then the DNA in the 350–500 bp range was excised and extracted from the gel using a Qiagen Gel Extraction kit, according to manufacturer’s instructions. The samples were then gel-purified second time in order to further eliminate primers and non-specific amplification from the samples. Finally, the DNA content of the samples was assessed using the Flash Gel System (Lonza, Hopkinton, MA, USA) and PicoGreen (Invitrogen, Inc/Life Technologies, Grand Island, NY, USA) quantification system to determine qualitative and quantitative concentration of the PCR products. Pooled sample libraries were then sequenced using the GS Junior 454 platform (Roche, Mannheim, Germany).
Analysis of Sequencing Data
iRepertoire® provided raw data on V, D, and J segment usage for T and B cell samples and C-region usage for B cell samples. They also provided filtered DNA sequences utilized for additional analyses. Information on CDR3 length was obtained from these filtered sequence files. Unique filtered DNA sequences were also multiplied to reflect the number of copies present for each sequence in a population using Microsoft excel. CSV output files from Excel were then converted into FASTA format using Geneious software. FASTA files were uploaded to the ImMunoGeneTics (IGMT) database and the IMGT/high V-Quest web-based analysis tool (26), which provided sequence output files. The IGMT mutation analysis files were used to calculate the number of mutations at each amino acid residue for the various CDR and framework regions (FR). The mutation index was calculated by dividing the total number of mutations in each FR or CDR region, by the total nucleotide length of the FR or CDR region analyzed, and finally dividing that by the total number of unique sequences obtained for each population analyzed. IGMT output files were uploaded into IgAT analysis tool (27) to allow analysis of biodiversity. Finally, rarefaction curves for each sample were generating using PAST (28).
Statistical Analyses
As outcome variables were ordinal in nature and a normal distribution could not be assumed for any of the dependent variables, the Mann–Whitney test was used to assess for differences between controls and WAS patients. Analysis was performed using PRISM version 6 (Graph Pad).
Results
Clinical and Laboratory Features
Eight WAS patients (age range: 10 months to 54 years; median: 21 months) and 6 healthy controls (age range: 9 months to 5 years; median 4 years) were included in the study. None of the patients had received hematopoietic cell transplantation (HCT) or gene therapy at the time of the study. The clinical, immunological, and molecular features of WAS patients are reported in Table 1. A history of recurrent infections was documented in seven of the eight WAS patients, and one of them (W3) had chronic viral infections. None of the patients had significant autoimmunity. WASp expression was analyzed in all patients (data not shown). Four patients lacked WASp expression in all blood lineages (W2, W4, W5, and W7); one patient (W8) had residual, but reduced, protein expression. Three patients (W1, W3, and W6) had somatic reversions allowing WASp expression in CD8+ T cells only (W1), CD8+ and NK lymphocytes (W3), or in CD4+ and CD8+ cells (W6). Immunological abnormalities detected in patients included a variable degree of T cell lymphopenia, accumulation of effector memory and of CD8+ TEMRA cells, a low number of unswitched memory B cells, and an increased proportion of CD19+ CD21low CD38low B cells (Table 1). Immunoglobulin serum levels were tested in seven patients; low IgM were observed in five patients, and increased IgA in three. Finally, all seven patients tested had elevated serum IgE (Table 1).
Sequencing Output and Quality Analysis
The mean number of reads obtained for all samples was 7,080 (median: 4,631; range 114–31,731). No reads were obtained for CD4+ cells from patients W4 and W5, due to an error in sample processing; these samples were therefore excluded from all analyses. The richness of each sample’s data was determined by rarefaction curves, which measure increase of diversity along the depth of sequencing. Rarefaction curves plateau as the vast majority of species present in a population have been sampled. Rarefaction curves indicated thorough capturing of unique TRB sequences for most of the T cell subsets analyzed (data not shown). Similar results were also obtained for IGH repertoire (data not shown).
Analysis of the TRB Repertoire Demonstrates Clonotypic Expansions and Skewed Usage of V and J Segments in CD8+ Lymphocytes from Patients with WAS
To investigate whether CD4+ and CD8+ cells from WAS patients contained expanded clonotypes, the frequency of the top 100 most abundant unique clonotypes was expressed as a percentage of the total number of sequences obtained. Clonotypic expansions were identified among CD4+ lymphocytes from patients W2 and W3 and among CD8+ cells from patients W1, W2, W3, and W5 (Figure 1A). To investigate evenness of clonotype size distribution, we plotted the cumulative percentage of total TRB amino acid repertoire vs. the cumulative percentage of unique TRB amino acid clonotypes ordered by increasing clonotype size. In this representation, an even clonotype size distribution (i.e., all clonotypes being of the same size) would be represented by the bisector line, and the extent of deviation from the bisector would indicate the unevenness of the distribution. As shown in Figure 1B, clonotypic expansions were demonstrated for CD4+ cells from patient W1, and for CD8+ cells from patients W1, W2, W3, and W5. In particular, the top 10% most abundant unique clones accounted for <20% of the CD4+ total sequences and <30% of the CD8+ total sequences in control subjects. In contrast, the top 10% most abundant unique sequences accounted for as many as 50% of the CD4+ total sequences in patient W1 and more than 90% of the CD8+ total sequences in patients W3 and W5.
FIGURE 1
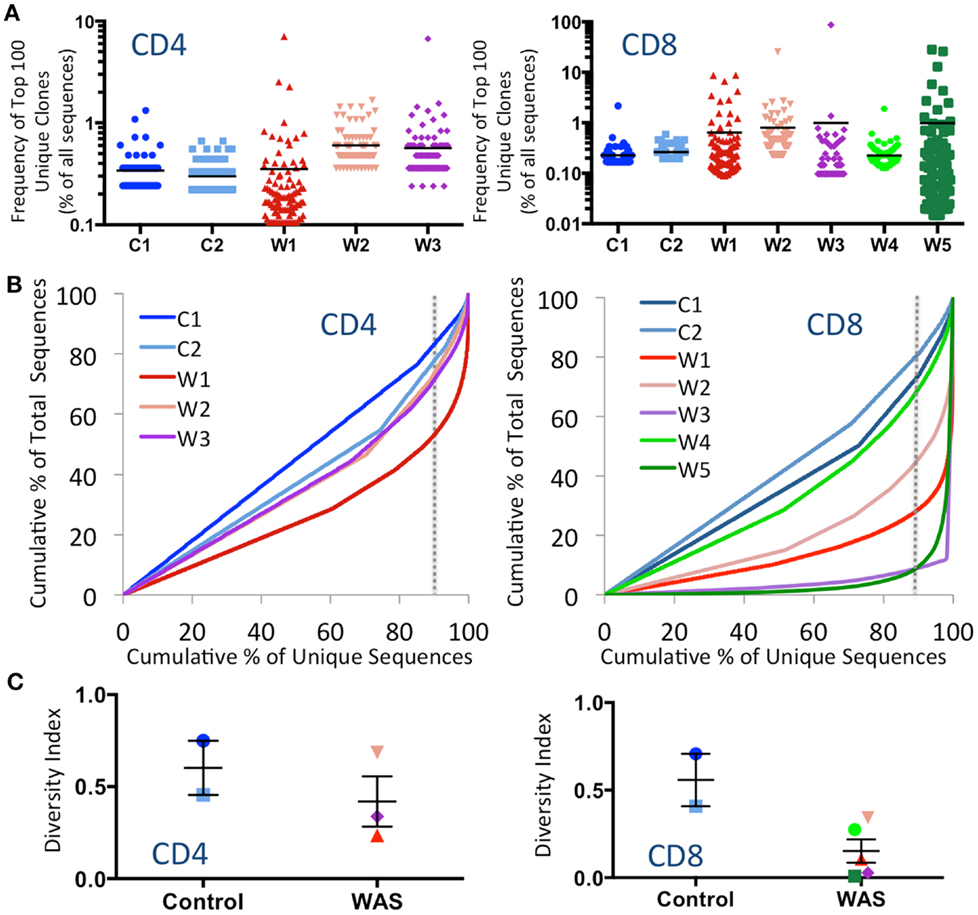
Figure 1. Clonal expansions and diversity of the CD4+ and CD8+ TRB repertoire. (A) The relative frequency of the 100 most abundant clones is displayed as a proportion of the total sequences for both CD4+ (left panel) and CD8+ (right panel) populations. The black line indicates the mean of the sample. (B) The degree of clonal expansion for CD4+ and CD8+ populations is displayed by plotting the cumulative percentage of unique clones (x) vs. the cumulative percentage of total sequences (y). A slope of one would indicate an even distribution of clonotypes. The dotted gray vertical line indicates 90% of cumulative unique sequences, with sequences to the right of the line corresponding to the top 10% most abundant unique clonotypes. (C) The diversity of each patient’s repertoire was determined by dividing the number of unique sequences over the total sequences for CD4+ and CD8+ populations. Bars represent mean and SE. In all panels, the same color is used to identify individual control subjects and patients.
To measure diversity, the number of unique clones in each sample was divided by the total number of sequences obtained. A diversity index of 1 indicates that each unique clone is represented only one time, whereas diversity approaching 0 indicates that only a few clones were redundantly expressed. As shown in Figure 1C, the diversity of WAS CD4+ cells was variable, but overall similar to that of CD4+ cells from healthy controls. In contrast, CD8+ cells from WAS patients had markedly reduced diversity, although statistical significance was not reached, due to the limited sample size.
Analysis of the frequency of usage of individual TRBV genes among unique CD4+ clonotypes revealed a similar pattern in WAS patients and controls (Figure 2A). In contrast, for CD8+ cells, there was a wider distribution in the frequency of TRBV segment usage in unique CD8+ clonotypes from WAS patients compared with controls (Figure 2B). In particular, TRBV2 was less frequently expressed in CD8+ cells from WAS patients than controls (p = 0.05). A few other genes (TRBV29-1, TRBV9, TRBV10-3, and TRBV12-3) tended to be under- or hyper-represented in CD8+ T cells from patients vs. controls, but the trends did not reach significance. It is important to note that V gene results are displayed on a logarithmic graph, so while values were obtained for all WAS patients for each gene, genes with expression approaching 0 will fall below the lower limit of the y-axis on these graphs, and therefore, not be displayed.
FIGURE 2
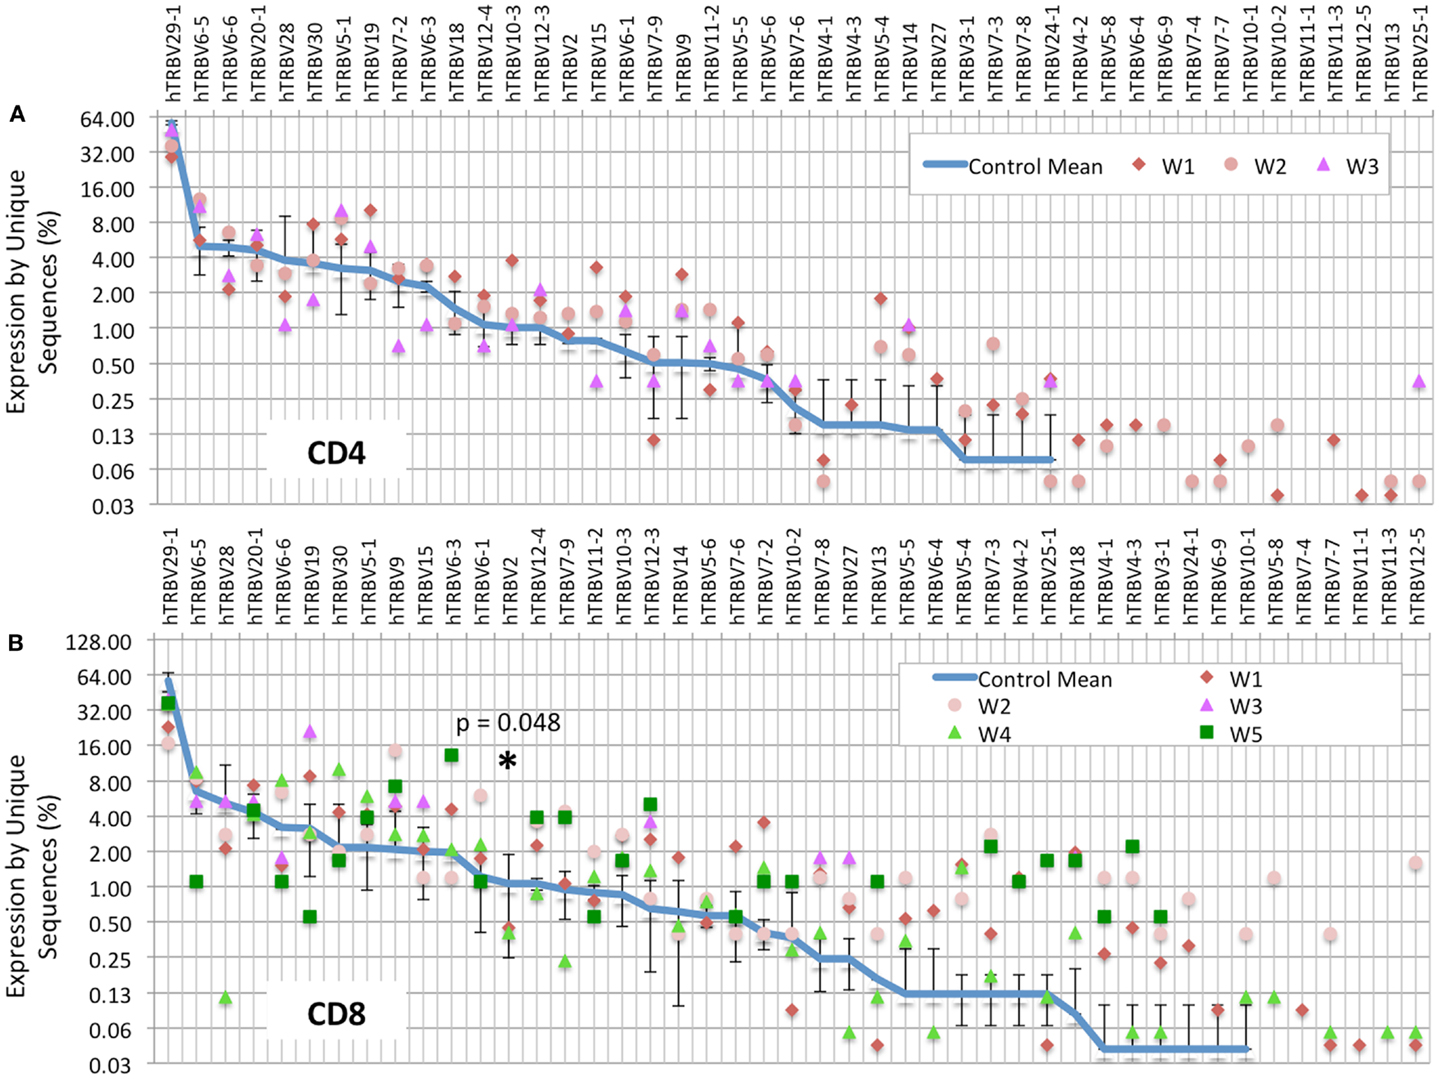
Figure 2. TRBV gene usage is skewed in the CD8+ population of WAS patients. The frequency of usage of individual TRBV genes among unique TRB sequences is displayed for the CD4+ (A) or CD8+ (B) cells. The blue line indicates the average frequency of the two control subjects, and the error bars indicate the SD of the frequency of the controls. p Values were calculated using Mann–Whitney test between controls and WAS for each V segment. *p < 0.05.
Computational analysis permits to construct “virtual spectratyping” to indicate the relative frequency with which sequences of CDR3 region of the TRB (CDR-B3) of various lengths are represented among both the total and the unique TRB sequences. A similar distribution of the CDR-B3 length was observed for both unique and total sequences obtained from CD4+ cells from patients and controls (Figure 3A). In contrast, significant deviation from the bell-shaped curve was observed for total CDR-B3 sequences from CD8+ cells from patients W1, W3, and W5 (Figure 3B), and aberrant kurtosis was detected in patient W2 (Figure 3B). Furthermore, an abnormal distribution of CDR-B3 length was also detected for unique sequences obtained from CD8+ cells from patients W3 and W5. Overall, these data confirm that skewing of the TRB repertoire is especially prominent in CD8+ cells from patients with WAS. Discrepancy in virtual spectratyping between unique and total sequences obtained from CD8+ cells from patients W1 and W2 is consistent with the uneven distribution of clonotype sizes in these patients (Figure 1B). However, abnormalities of virtual spectratyping among unique sequences from CD8+ lymphocytes from patients W3 and W5 is indicative of markedly reduced diversity of the TRB repertoire, as also shown in Figure 1C.
FIGURE 3
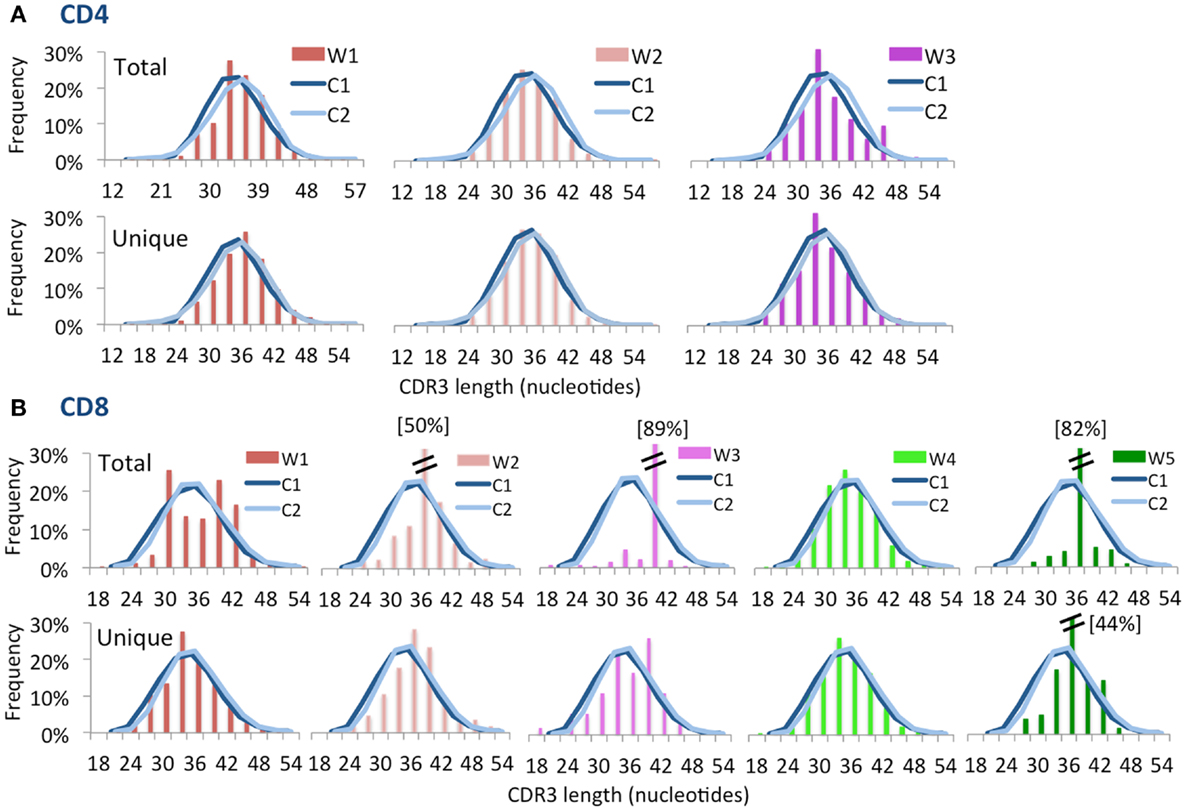
Figure 3. Complementarity determining region 3 length distribution of unique and total sequences for CD4+ and CD8+ TRB repertoire. Distribution of CDR3 nucleotide length frequencies of CD4+(A) and CD8+ (B) populations for both total and unique clones for each WAS patient compared to control subjects C1 and C2 (shown as curves). A double bar indicates the value of the bar has exceeded the axis limit, and the maximum value is indicated within brackets.
To further confirm that virtual spectratyping may identify specific abnormalities of the immune repertoire, we analyzed distribution of CDR-B3 length among unique and total sequences containing TRBV6-5, a gene that was abundantly used both in patients and controls (Figure 2). As shown in Figure 4, frequency of CDR-B3 transcripts of various lengths followed a bell-shaped pattern among both unique and total sequences from CD4+ and CD8+ lymphocytes from healthy controls (blue line). A similar pattern was also observed for unique CD4+ and CD8+ clonotypes from patient W1. In contrast, an aberrant distribution of CDR-B3 length was detected among total sequences from CD4+ and CD8+ lymphocytes of the same patient, consistent with clonotypic expansions, previously shown in Figure 1B. On the other hand, skewing of CDR-B3 distribution was observed among both unique and total CD8+ sequences from patients W3 and W5, indicative of severe repertoire restriction. Indeed, only three unique TRBV6-5-containing sequences were detected in CD8+ lymphocytes from patient W3, and two such sequences in patient W5. Overall, these data demonstrate the analytical power of NGS in revealing abnormalities of the immune repertoire, and confirm that the TRB repertoire of WAS patients is characterized by both reduced diversity and clonotypic expansions.
FIGURE 4
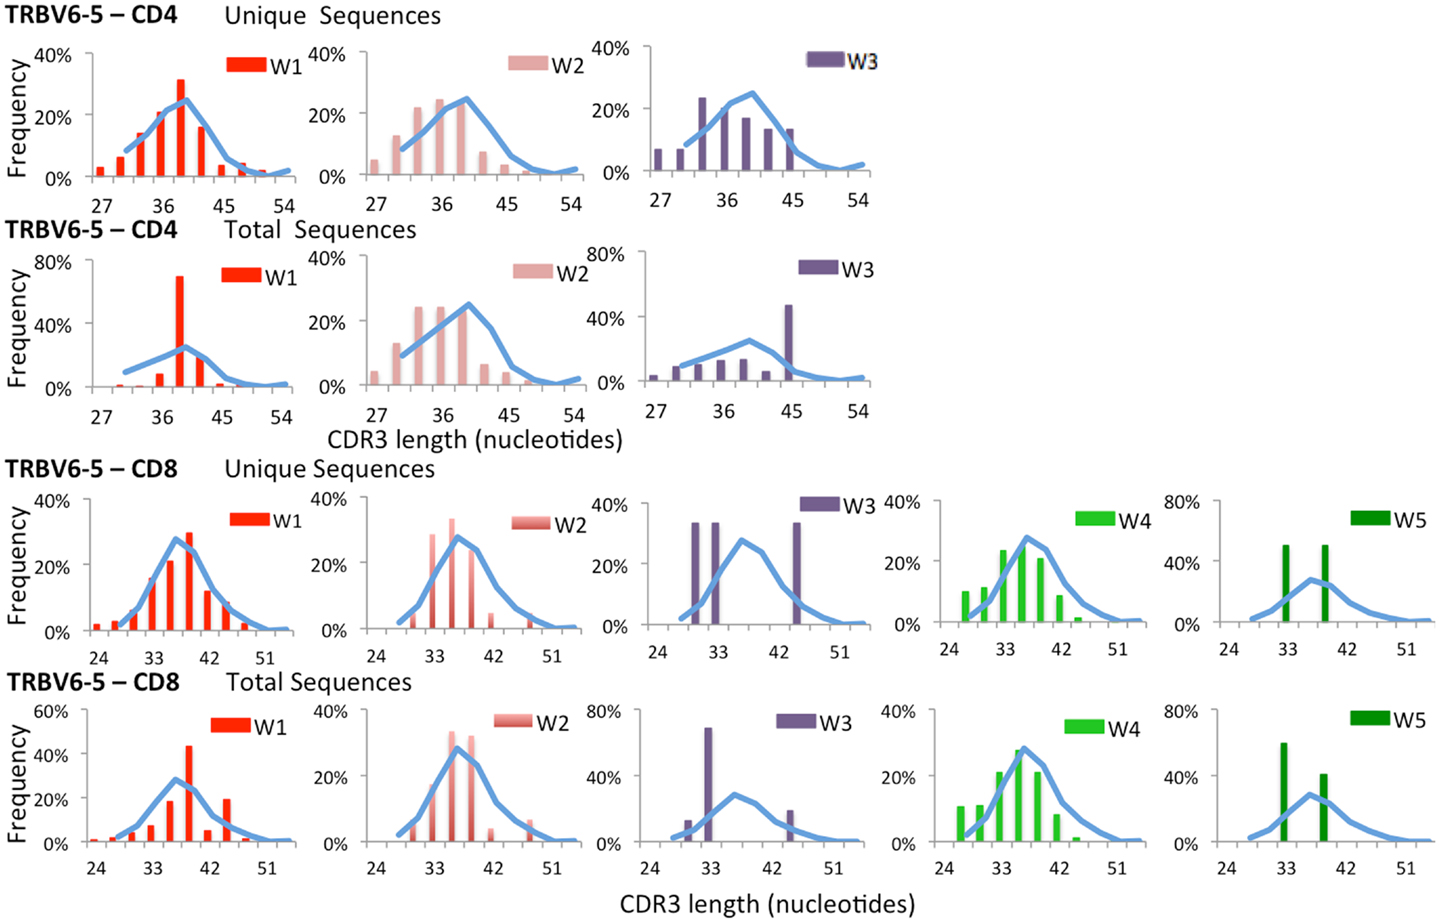
Figure 4. Complementarity determining region 3 length analysis of TRBV6-5 expressing clonotypes subgroups. Length distribution of the CDR3 region of unique and total clones containing TRBV6-5 in both CD4 and CD8 populations from WAS patients (bars) and controls (blue line).
The frequency of TRBJ genes usage was also analyzed for both CD4+ and CD8+ lymphocytes of patients and controls, and results for both total (inner ring) and unique (outer ring) sequences were plotted using Microsoft donut graphical representation (Figure 5A). With this function, clonotypic expansions manifest as significant differences in the pattern of outer vs. inner ring. Minor differences were observed in usage of TRBJ segments between total and unique clones in CD4+ cells from WAS patients. In contrast, remarkable differences in the distribution of TRBJ gene usage between unique vs. total sequences were observed for CD8+ cells from WAS patients W1, W2, W3, and W5 (Figure 5A), confirming the presence of clonotypic expansions in this population. Analysis of the frequency of TRBJ segment usage showed that WAS patients had decreased usage of TRBJ2-1 (among both CD4+ and CD8+ cells) and an increased usage of TRBJ2-6 among CD8+ lymphocytes (Figure 5B).
FIGURE 5
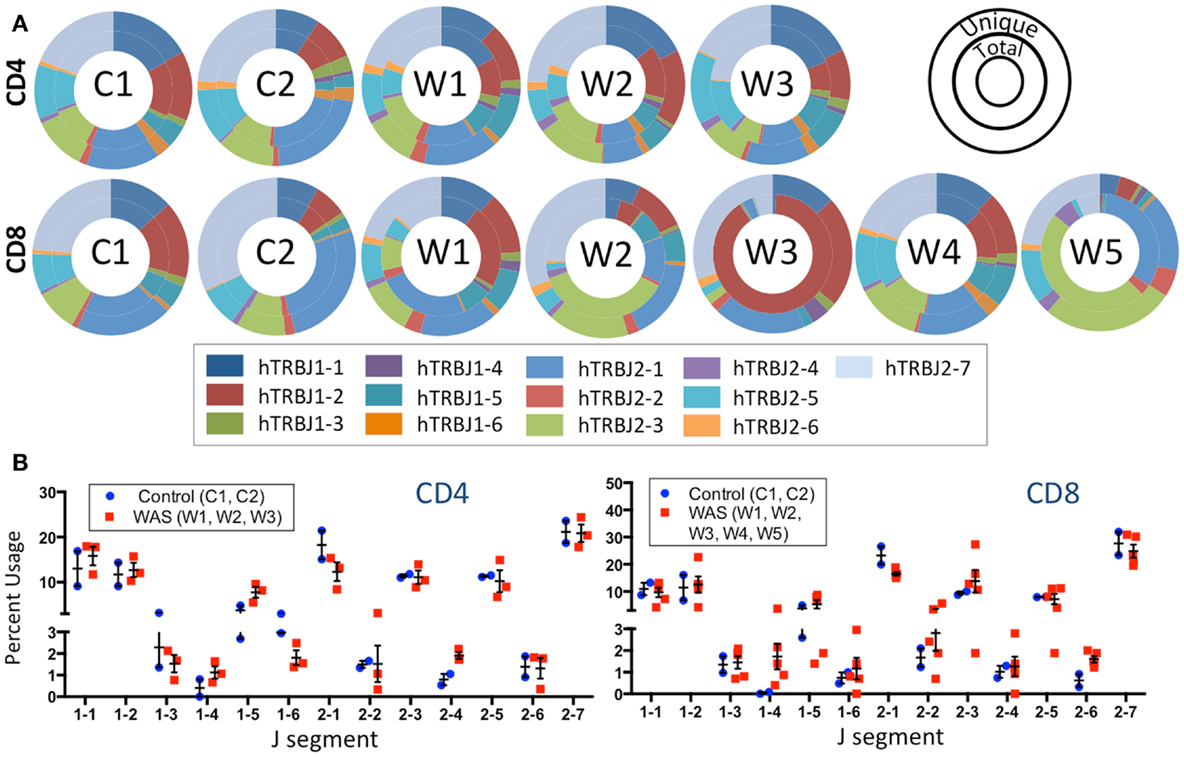
Figure 5. J segment usage is skewed in the TRB repertoire of CD8+ cells in WAS patients. (A) Donut graphs compare the representative frequencies of TRBJ segment usage for total (inner ring) and unique (outer ring) sequences for controls and WAS patients (see also inset key). (B) Direct comparison of J segment usage between WAS patients and controls.
Analysis of TRB Repertoire in Naïve and Memory T Cells Reveals a Variable Pattern of Uneven Clonotype Size Distribution in Patients with WAS
Analysis of the distribution of cumulative percentages of unique and total sequences demonstrated a similar pattern for naïve and memory CD4+ and CD8+ cells from controls, with the top 10% most abundant unique clones accounting for 35–50% of the total clones (Figure 6). In contrast, clonotypic expansions were identified in memory CD4+ cells from patient W6 (where the top 10% unique sequences accounted for more than 75% of total sequences), and in both naïve and memory CD8+ cells from the same patient, with the top 10% most abundant unique clonotypes accounting for over 90% of the total sequences (Figure 6). Uneven distribution of clonotype size (albeit not as pronounced as for patient W6) was also observed for naïve and memory CD8+ cells from patient W7.
FIGURE 6
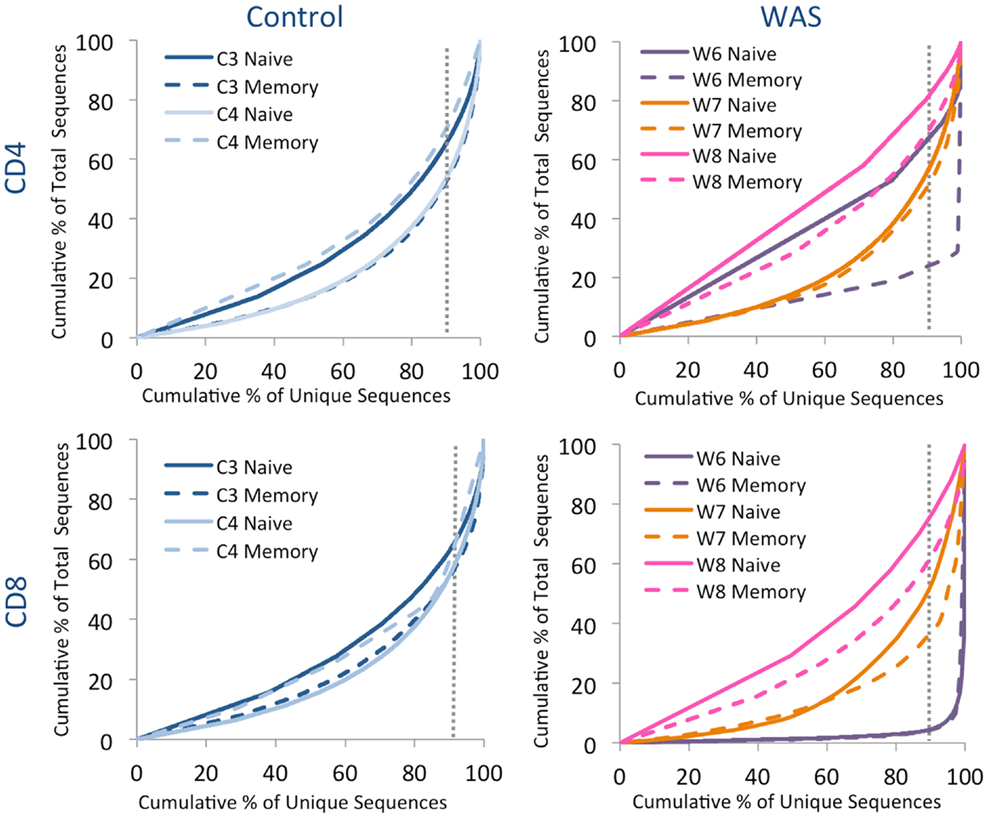
Figure 6. Clonal expansion of the TRB repertoire in CD4+ and CD8+ naïve and memory lymphocytes. The degree of clonal expansion for each patient’s repertoire is displayed by plotting the cumulative percentage of unique sequences (x) vs. the cumulative percentage of total sequences (y) in controls (left panels) and patients (right panels). A slope of one would indicate an even distribution of clonotypes. The dotted gray vertical line indicates 90% of cumulative unique sequences, with sequences to the right of the line corresponding to the top 10% most abundant clonotypes.
Analysis of the frequency of TRBV segment usage for all unique sequences revealed a similar pattern in naïve CD4+ lymphocytes from patients and controls (Figure 7, top panel). However, a broader distribution was observed in TRBV gene usage among memory CD4+ cells from patients with WAS (Figure 7, lower panel), with increased usage of the TRBV30 and reduced usage of the TRBV7-9 genes as compared to controls. A similar analysis, performed on CD8+ lymphocytes, showed that naïve CD8+ cells from WAS patients had a tendency toward increased usage of TRBV genes that are rarely utilized in healthy controls (Figure 8, top panel). A broad distribution of TRBV gene usage was observed among memory CD8+ cells from patients with WAS (Figure 8, lower panel). In order to investigate further usage of TRBV genes in WAS, the TRBV genes were grouped into a D-proximal set (from TRBV30 to TRBV27) and a D-distal set (from TRBV25-1 to TRBV2-1). Increased usage of D-distal TRBV genes was demonstrated in CD8+ lymphocytes (and in particular, among memory CD8+ cells) from patients with WAS vs. controls (p < 0.05; data not shown). Altogether, these data confirm that abnormalities of the TRB repertoire in WAS are more often observed in the CD8+ and in memory T cell compartments.
FIGURE 7
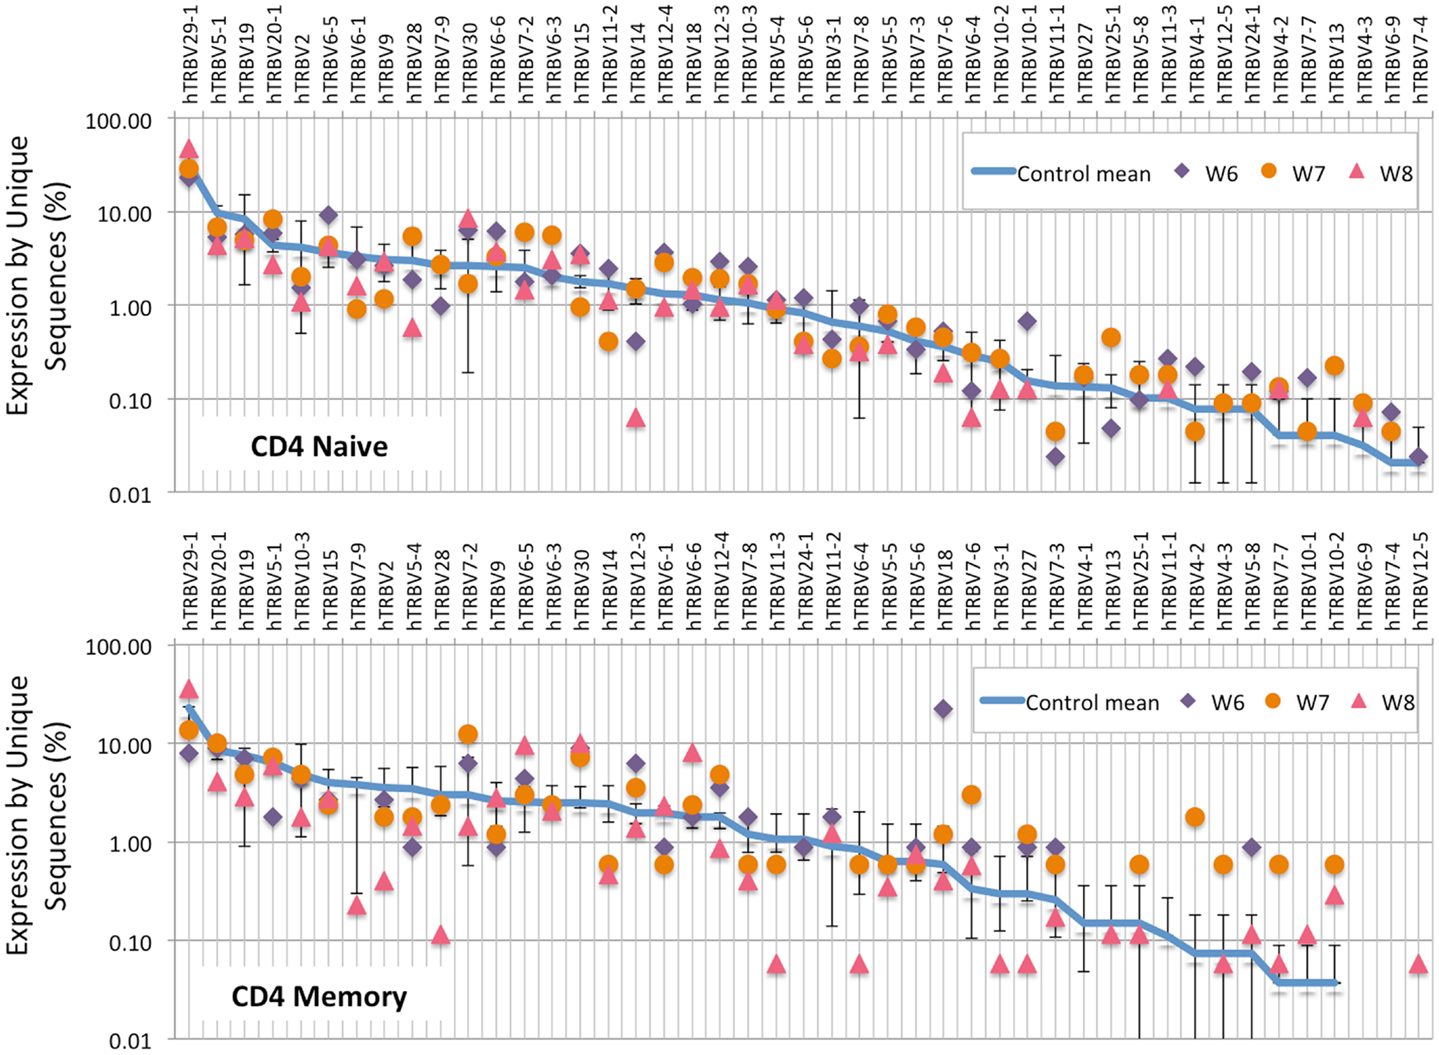
Figure 7. TRBV gene usage in CD4+ naive and memory lymphocytes from healthy controls and patients with WAS. The frequency of usage of individual TRBV genes in unique TRB sequences is displayed for CD4+ naïve (top panel) or memory (bottom panel) lymphocytes. The blue line indicates the average frequency of the two control patients, and the error bars indicate the SD of the frequency of the controls.
FIGURE 8
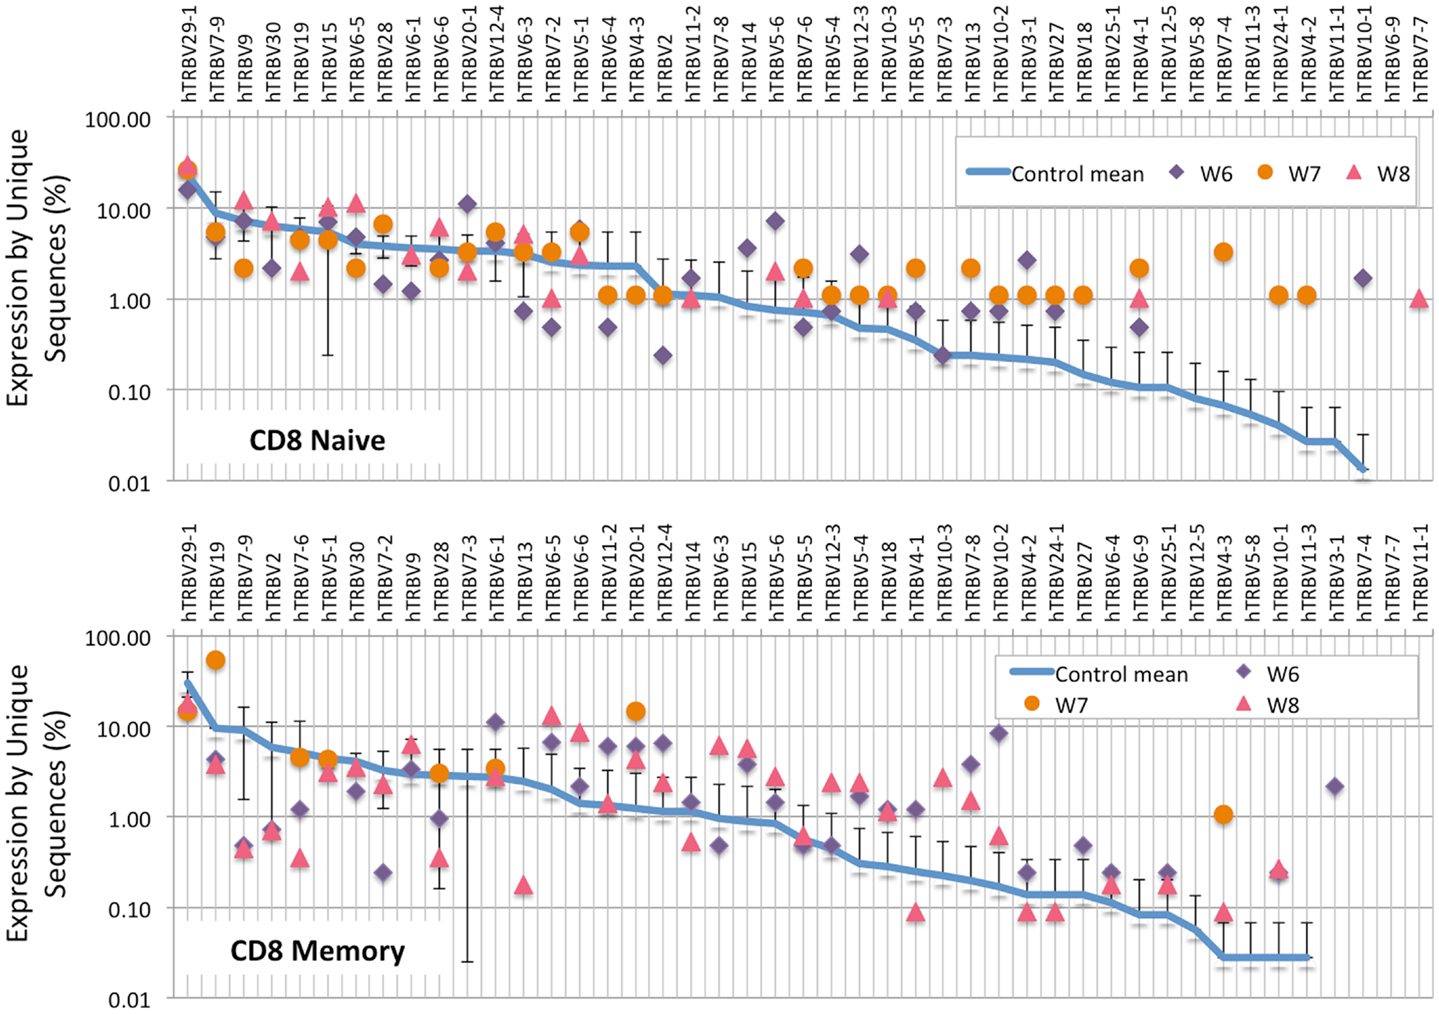
Figure 8. TRBV gene in CD8+ naive and memory lymphocytes from healthy controls and patients with WAS. The frequency of usage of individual TRBV genes in unique TRB sequences is displayed for CD8+ naïve (top panel) or memory (bottom panel) lymphocytes. The blue line indicates the average frequency of the two control patients, and the error bars indicate the SD of the frequency of the controls.
Analysis of the IGH Repertoire Reveals Clonotypic Expansions and Skewed Usage of IGHV and IGHJ Segments in Peripheral B Cells from Patients with WAS
As shown in Figure 9A, there was a trend for the mean frequency of the top 100 most abundant unique IGH clonotypes to be higher in patients with WAS than in controls. The uneven distribution of clonotype size was confirmed when plotting the cumulative percentage of unique vs. total sequences (Figure 9B). Furthermore, virtual spectratyping of the CDR3 region of IGH transcripts (CDR-H3) demonstrated deviation from the bell-shaped pattern for both total and unique IGH transcripts from patient W7, with presence of a large fraction of clonotypes with longer CDR-H3 length (51 nucleotides) (Figure 9C).
FIGURE 9
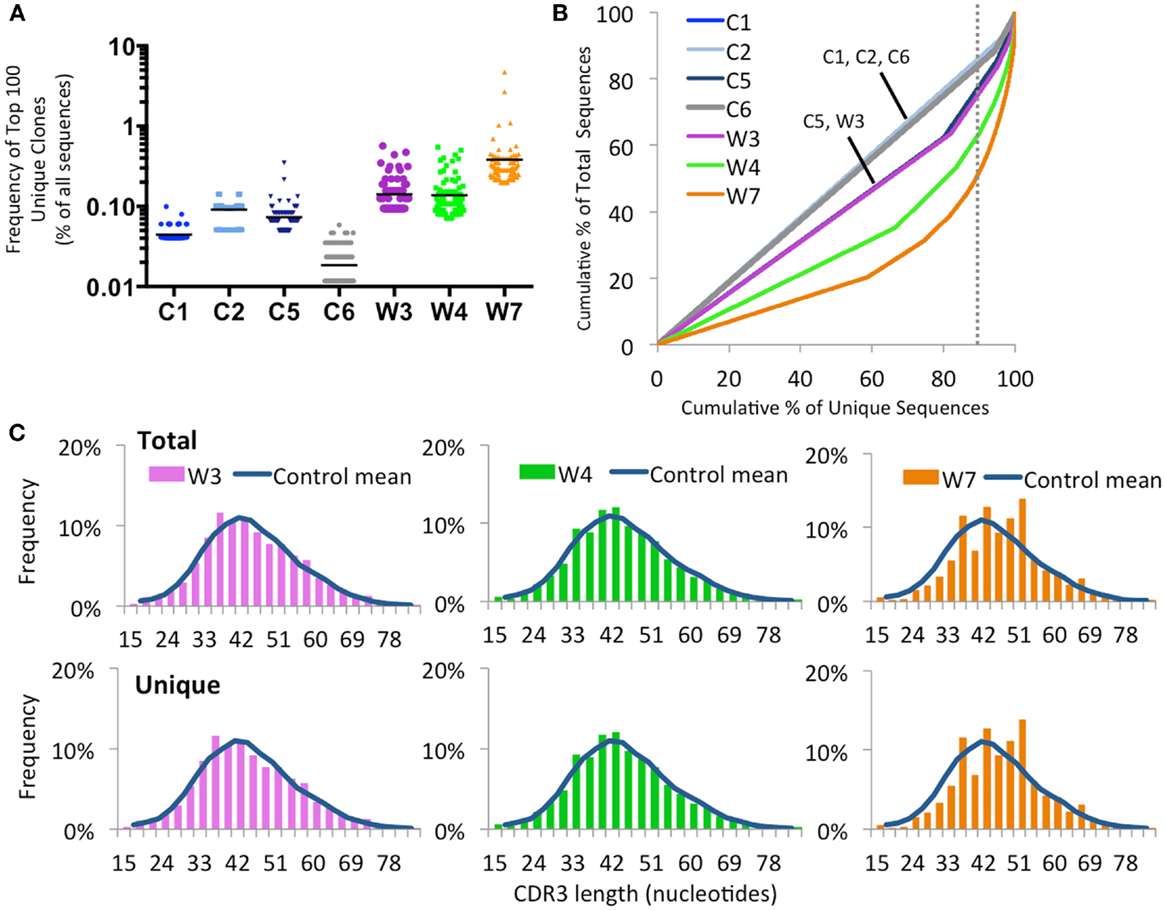
Figure 9. Clonal expansion of the IGH repertoire in circulating CD19+ lymphocytes. (A) The relative frequency of the 100 most abundant clones is displayed as a proportion of the total sequences in four healthy controls (C1–C4) and three WAS patients (W3, W4, and W7). The black line indicates the mean of the sample. (B) The degree of clonal expansion for each patient’s repertoire is displayed by plotting the cumulative percentage of unique clones (x) vs. the cumulative percentage of total sequences (y). A slope of one would indicate an even distribution of clonotypes. The dotted gray vertical line indicates 90% of cumulative unique sequences, with sequences to the right of the line corresponding to the top 10% most abundant clonotypes. (C) Distribution of CDR3 nucleotide length frequencies for both total and unique sequences in individual WAS patients compared to the mean in controls C1 and C2 (shown as a curve).
An increased frequency of γ-containing IGH transcripts was detected within unique and total sequences from patients with WAS, associated with a trend toward reduced frequency of μ-containing transcripts (Figure 10A). Overall, μ-containing transcripts were most predominantly expressed both in controls and WAS patients. No differences were observed in the frequency of usage of IGHD genes (Figure 10B). When usage of IGHV families was analyzed, patients with WAS showed decreased usage of IGHV5 (Figure 10C). Overall, the pattern of IGHV gene usage by unique and total sequences was similar in patients and controls (Figure 11), indicating a minimal effect from clonotypic expansions in the B cell repertoire. However, there was a tendency toward decreased usage of VH3-66, VH5-51, VH3-74, VH3-53, and VH3-72, whereas VH3-9, VH3-15, VH4-31, VH4-30-2, and VH4-30-4 tended to be overexpressed in WAS patients compared with controls. One patient (W4) had an increase in VH4-34 expression.
FIGURE 10
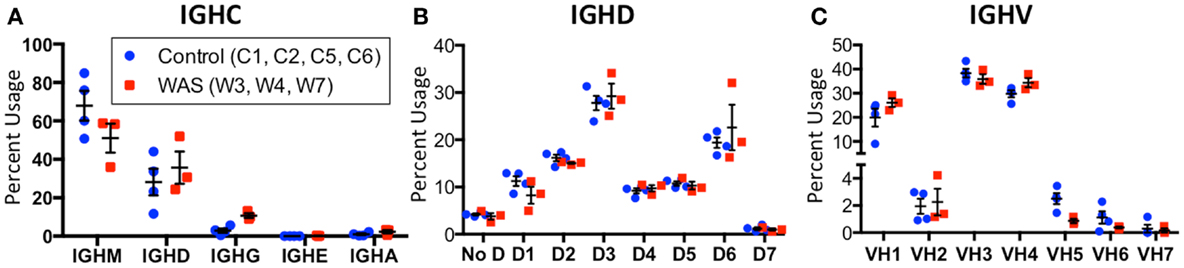
Figure 10. Usage of IGHV, IGHD, and IGHC families in circulating B cells from controls and WAS patients. Percent usage of V (A), D (B), and constant (C) segment families in unique IGH clonotypes is shown for both controls (blue dots) and WAS patients (red squares). Bars indicate the mean and SE.
FIGURE 11
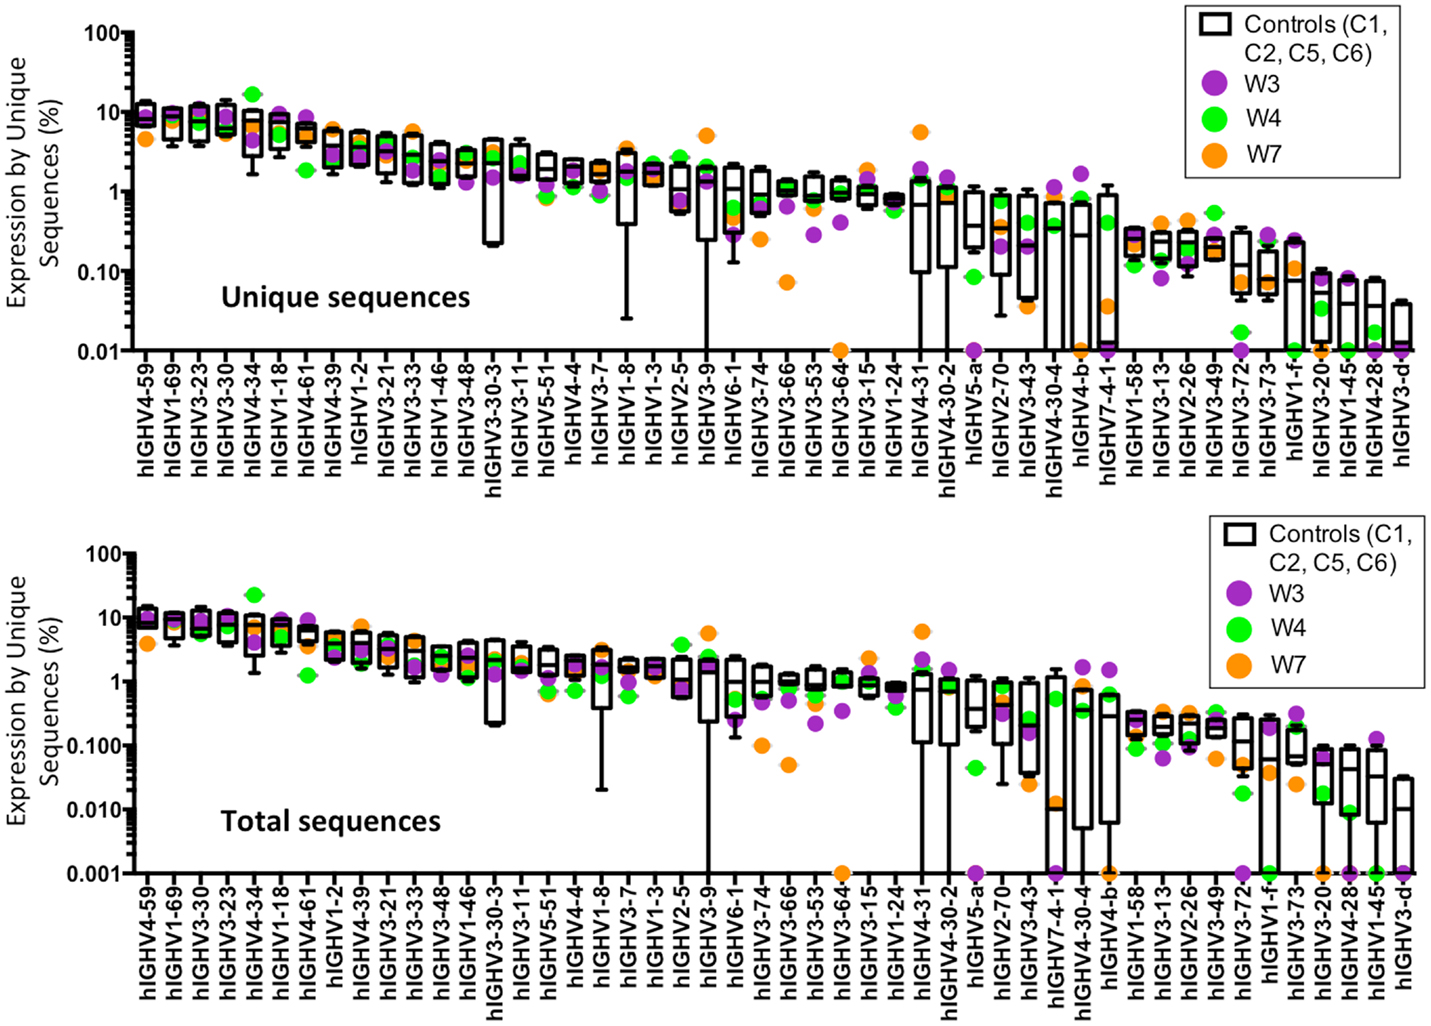
Figure 11. Individual IGHV gene usage in circulating CD19+ cells from WAS patients and controls. The frequency of usage of individual IGHV genes in unique IGH sequences is displayed. Boxes indicate the high, low, and median values, and error bars indicate the 5th and 95th percent confidence intervals for controls. WAS patients are identified by filled symbols.
Next, we sought to investigate whether virtual spectratyping applied to single IGHV genes or families could reveal abnormalities of CDR-H3 length in patients vs. controls. Distribution of CDR-H3 length for the abundantly used IGHV1-18 revealed deviations from the bell-shaped curve in patients W3, W4, and W7 as compared to controls (Figure 12A). Abnormalities of CDR-H3 length in patients with WAS were even more obvious for the IGHV5 family (Figure 12B) and for the IGHV3-66 gene (Figure 12C), which were less frequently used in WAS patients. Of note, abnormal distribution of CDR-H3 length was documented also among unique sequences, indicating restricted diversity of B lymphocytes expressing these genes.
FIGURE 12
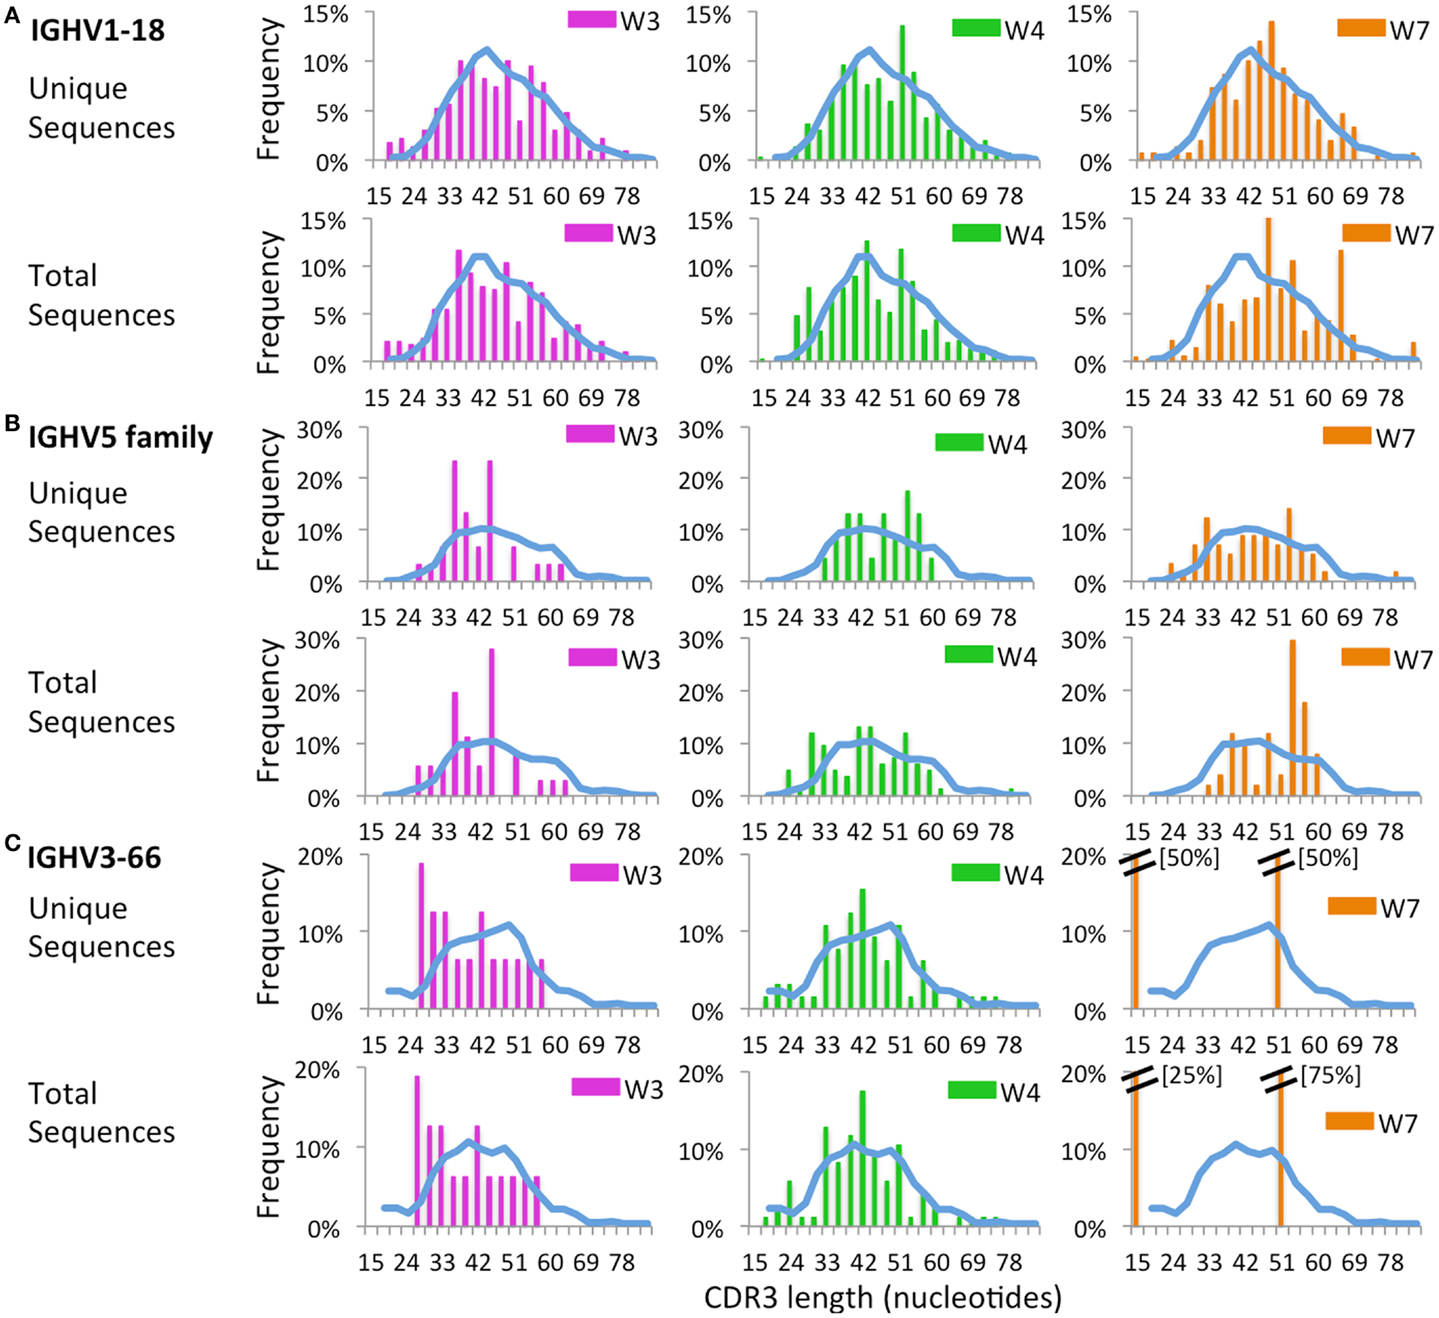
Figure 12. Complementarity determining region 3 length analysis of IGHV subgroups. CDR3 length analysis was performed on CD19+ cells expressing IGHV1-18 (A), IGHV5 (B), or IGHV3-66 (C). The mean distribution of controls (C1 and C2) is displayed as a blue bar. A double bar indicates the value of the bar has exceeded the axis limit, and the maximum value is indicated within brackets.
When usage of IGHJ gene families was analyzed for all unique sequences, an increased usage of IGHJ3 was observed in WAS patients than in controls (Figure 13). This was also confirmed when IGHM- and IGHD-containing transcripts were considered, and a similar trend was observed for IGHA-expressing clonotypes. In contrast, usage of IGHJ5 was reduced within IGHA-expressing clonotypes from patients with WAS, and a similar trend was observed also for IGHM- and IGHG-expressing unique sequences (Figure 13).
FIGURE 13
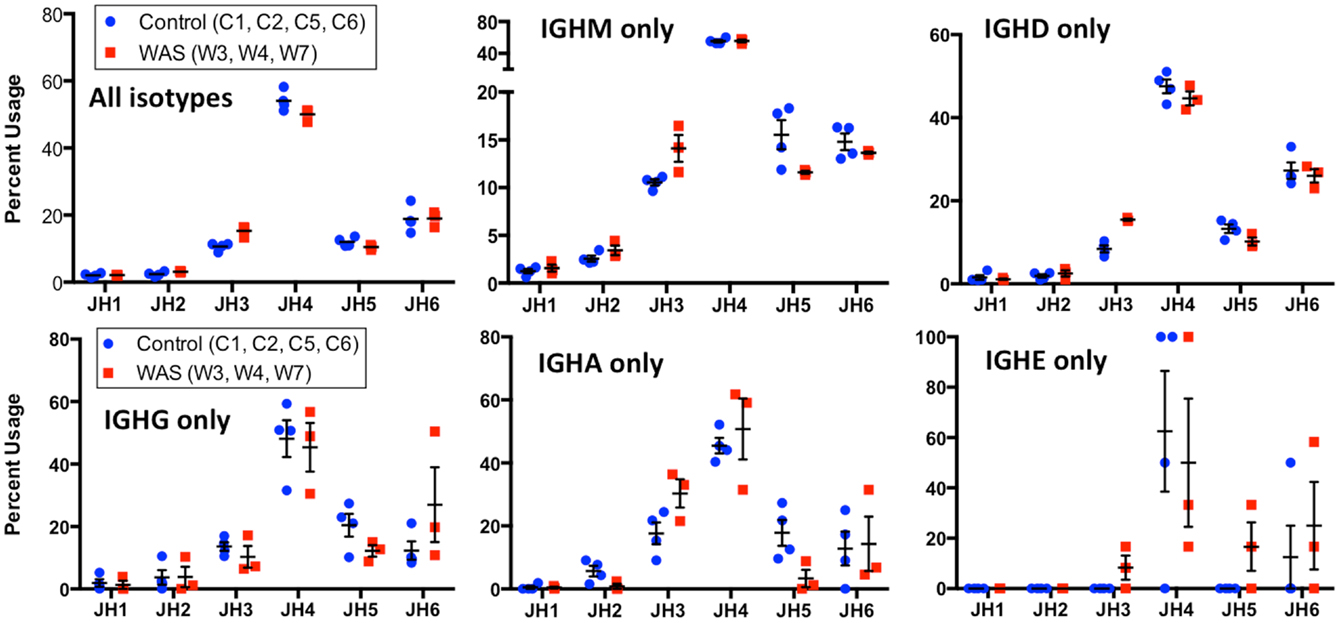
Figure 13. Usage of IGHC genes in unique IGH sequences from WAS patients and controls. Usage of IGHC families is displayed as the percentage of the total number of unique clonotypes for both control (blue dots) and WAS patients (red squares). Results are shown for all isotypes and for individual isotypes. Bars indicate the mean and SE.
Next, we assessed the frequency and distribution of somatic mutations within CDR1, CDR2, and FR 2 and 3 for the total B cell population as well as within IGHM- and IGHG-expressing sequences. Overall, the rate and distribution of somatic mutations were not significantly different in patients and controls (Figure 14). However, when the analysis was restricted to IGHG-containing transcripts, there was a trend toward reduced mutation frequency in the CDR1 and CDR2 regions in WAS patients as compared to controls.
FIGURE 14
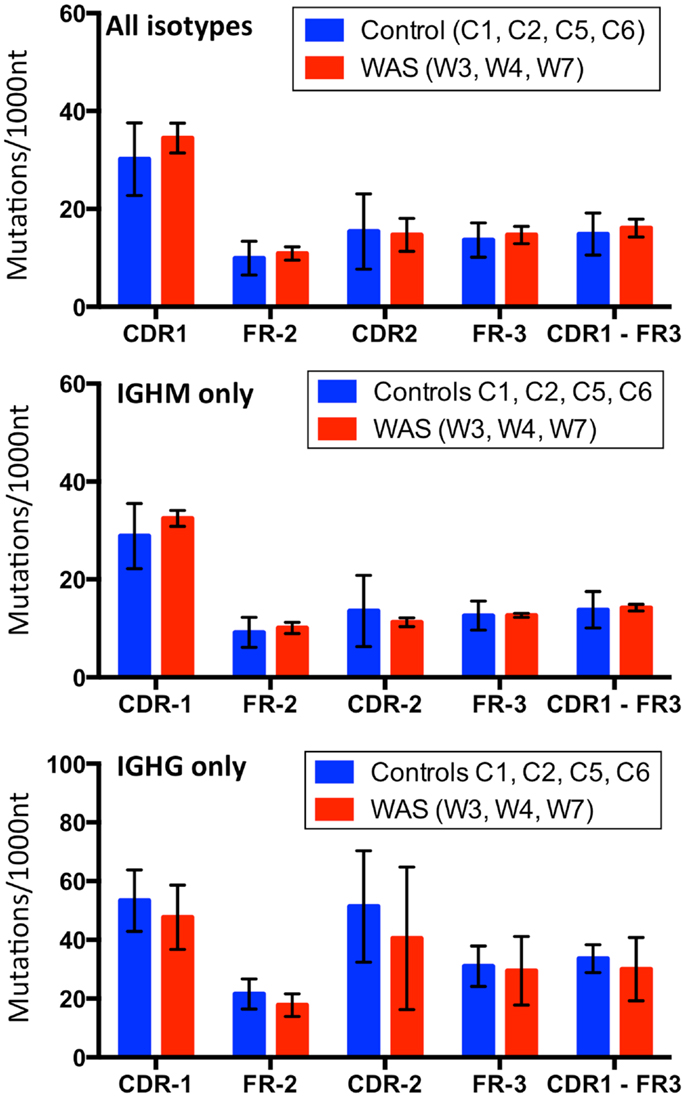
Figure 14. Analysis of somatic hypermutation. The rate (per 1,000 nucleotides) of somatic hypermutation in complementarity determining regions (CDR) and framework regions (FR) is shown for controls and WAS patients. Bars indicate the mean ± SD.
Discussion
Development of NGS techniques has permitted analysis of the immune repertoire in healthy status and in various pathologic conditions to a depth that could not be achieved with previously available techniques. In the field of primary immunodeficiencies, NGS analysis of the antigen receptor repertoire has been limited so far to patients with leaky variants of SCID, in particular RAG defects (29–31). In this manuscript, we have reported for the first time on the use of NGS to analyze the T and B cell repertoire in patients with WAS. It had been initially thought that WAS is characterized by progressive T cell lymphopenia (32). Consistent with this, Wada et al. had demonstrated skewing of the TRB repertoire in patients older than 15 years of age, but not in younger patients (20). In contrast, Park et al. had found that T cell lymphopenia is common also in young WAS patients, and affects predominantly the naïve T cell compartment (10). More recently, Braun et al. have shown that indeed also young patients with WAS often have a perturbed TCR repertoire profile, with oligoclonal expansions of Vβ-expressing clonotypes (21). Here, we have confirmed and extended these observations. In particular, our data indicate that patients with WAS have a skewed TRB repertoire, with abundance of clonotypic expansions especially within memory CD4+ cells and in the entire CD8+ cell compartment. The vast majority of the patients studied were children, thus confirming that skewing of the TRB repertoire is a characteristic of WAS already early in life.
Several mechanisms may account for skewing of the TRB repertoire in patients with WAS. Because of the underlying immunodeficiency, patients with WAS are prone to recurrent infections, including chronic viral infections, which are often associated with expansion of effector memory T lymphocytes and CD8+ CD45RA+ CCR7− TEMRA cells (33). Seven of the eight patients studied here had a history of recurrent and/or chronic infections, and their immunological phenotype was characterized by increased proportion of effector memory and TEMRA lymphocytes. Previous studies had demonstrated a higher degree of clonotypic expansions and reduced diversity of the TRB repertoire within memory than naïve T lymphocytes (34), possibly reflecting selective pressure conferred by antigenic stimuli. However, while recurrent and chronic infections may contribute to determine abnormalities of the TRB repertoire in patients with WAS, additional causal mechanisms must also be invoked.
Reduced, but detectable, WASp expression was demonstrated in patient W8, who maintained largely preserved TRB repertoire diversity. The clinical phenotype of this patient was less severe than in other patients reported in this study. Additional studies are needed to confirm whether partially preserved WASp expression and function, and less severe clinical phenotype, are also associated with maintenance of repertoire diversity.
Abnormalities of antigen receptor repertoire diversity and complexity have been demonstrated in various autoimmune diseases. This may reflect chronic self antigen-mediated stimulation or reduced plasticity of immune receptor generation in these patients (35, 36). However, it should be noted that none of the patients included in this study had clinically significant autoimmune disease.
Restoration of WASp expression by somatic reversion has been associated with partial or full rescue of TCR-mediated signaling (37), and may therefore, lead to emergence of clonotypic expansion of WASp-expressing cells. In this study, all three patients with somatic reversion showed uneven distribution of TRB clonotypes within T cell subsets in which somatic reversion was demonstrated (CD8+ lymphocytes from patients W1, W3, and W6; CD4+ lymphocytes in patient W6). On the other hand, a previous study demonstrated that revertant WASp-expressing cells from a single patient showed broader TRB repertoire diversity than WASp-cells from the same patient (37). The apparent contradiction between this observation and our data may be reconciled if reduced TCR signaling in WASp− cells leads to impaired cell survival, and progressive reduction of repertoire diversity.
Indeed, our data clearly suggest that skewing of TRB repertoire diversity in WAS is not solely due to factors (chronic infections and somatic reversion) that sustain clonotypic expansions. In particular, use of NGS allows analysis of repertoire diversity and complexity also at the level of unique clonotypes. In normal individuals, generation of a broad spectrum of antigen receptor specificities translates into a polyclonal repertoire of expressed unique sequences, with a bell-shaped pattern of the distribution of CDR3 lengths demonstrated by virtual spectratyping. In contrast, we have observed increased usage of otherwise rarely utilized TRBV genes (and D-distal genes in particular), and abnormal distribution of CDR-B3 length among unique clonotypes expressed by CD8+ lymphocytes from patient with WAS. These data indicate for the first time that generation and/or maintenance of a diversified repertoire of CD8+ cells is compromised in patients with WAS. Impairment of thymic output in patients with WAS had been previously postulated (10); however, the possibility that reduced survival of peripheral CD8+ cells may also lead to progressive reduction of repertoire diversity cannot be excluded. Longitudinal studies, performed on uninfected patients identified at birth because of positive family history or of bleeding episodes associated with thrombocytopenia, may help dissect the role of impaired thymic output vs. reduced peripheral cell survival in determining skewing of the TRB repertoire.
Abnormalities of the B cell compartment in WAS include B cell lymphopenia, reduced number of CD21/CD35-expressing B cells and of unswitched and switched CD27+ memory B cells, and an increased proportion of circulating CD19+ CD21low CD38low autoreactive-prone B cells (16, 17, 38). Moreover, WASp-deficient B cells have increased signaling through the BCR and via toll-like receptors (13, 14), and this may trigger production of autoantibodies. Limited information is available on B cell repertoire diversity in patients with WAS. Two groups have recently reported skewed usage of IGHV genes and reduced rate of SHM in circulating B cells from patients with WAS (16, 17). However, only VH3 and VH4-expressing clonotypes were included in these studies, and the method (cloning and sequencing) used allowed only for a limited number of sequences to be analyzed. By using NGS, we have confirmed skewing of the B cell IGH repertoire in three patients with WAS with presence of clonotypic expansions. Moreover, one of the three patients tested (W7) had an aberrant distribution of CDR-H3 length. Although usage of IGHV genes was relatively preserved, we have detected decreased usage of VH3-66 within total sequences compared with controls. Castiello et al. have recently reported increased usage of VH3-30 and VH4-34 genes in WAS patients compared with controls (16), and increased usage of VH4-34, among both Cμ-expressing transitional B cells and CD21lo CD38lo B cells has been also reported (17). The VH4-34 gene encodes for self-reactive cold agglutinin antibodies (39, 40), whereas VH3-30 is highly represented among anti-platelet antibodies (41, 42). In this study, WAS patients and controls did not differ for the frequency of VH3-30 usage, and increased usage of VH4-34 was detected in one patient only (W4). However, none of the patients included in this study had clinical evidence of autoimmunity, and this may explain the lack of increased usage of IGHV genes associated with autoimmunity.
Although usage of IGHV genes was not significantly different in WAS patients vs. controls, virtual spectratyping demonstrated important abnormalities of CDR-H3 length distribution in WAS patients vs. controls. Of note, such abnormalities were also documented when analyzing CDR-H3 length of unique IGH expressed sequences. Castiello et al. have recently demonstrated increased release of bone marrow transitional B cells in WAS, secondary to decreased signaling through CXCL12 (16). Accelerated release of transitional B cells, whose repertoire is enriched for self-reactive specificities, may contribute to skewing of distribution of CDR-H3 length among expressed unique IGH clonotypes. However, the extent of such skewing is such that it is likely that reduced peripheral B cell survival may also play a role, similar to what discussed for T cells above.
WAS patients have increased serum levels of IgG, IgD, and IgE, and their IgM serum levels are often low (43). Consistent with this, we found the WAS IGH repertoire to have lower frequency of IGHM-containing sequences and increased frequency of IGHD and IGHG-expressing sequences, the lattermost being statistically significant. Despite all of our patients having elevated peripheral IgE levels and a history of eczema, the frequency of IGHE-expressing sequences was not different than in controls. This may reflect the observation that with the exception of patients W3 and W6, all other patients had only modest elevation of serum IgE. It is also possible that IGHE-expressing B cells are predominantly residing in tissues rather than in peripheral blood. Finally, it is important to keep in mind that IgE molecules account for a striking minority of all serum immunoglobulin molecules even in patients with a hyper-IgE phenotype, and larger sample sizes may be required to detect differences in the frequency of IGHE-containing transcripts.
Simon et al. have reported reduced rate of SHM among VH3 and VH4-containing IGHG transcripts in sorted memory B cells from patients with WAS (17). Similarly, Castiello et al. have observed reduced rate of SHM within the V region of Cγ and Cα-containing IGH transcripts expressing IGHV3 and IGHV4 families (16). In the present study, the mean mutational rate of the V region (CDR1-FR3) of Cγ-containing transcripts was lower in patients with WAS than in controls, but the difference did not reach statistical significance, also because of the limited sample size. Finally, we observed a higher mutational rate in CDR than in FR regions, suggestive of in vivo antigen-driven selection (44).
In summary, by using NGS, we have demonstrated that the immune repertoire of WAS patients is characterized by clonotypic expansion and skewing of TRBV gene usage in memory CD4+ and total and memory CD8+ cells as well as skewing of IGHV, IGHJ, and IGHC usage in peripheral blood B cells. We have also shown that clonotypic expansions were especially prominent in patients with chronic infections and/or somatic reversion. Moreover, taking advantage of the analytical power of NGS, we have demonstrated that abnormalities of CDR-B3 and CDR-H3 length are also present among unique expressed clonotypes, suggesting inability to sustain generation or maintenance of a diversified repertoire. This adds a novel aspect to the complexity of the immune deficiency of this disease. Additional studies are needed to define diversity of the antigen receptor repertoire in other cell subpopulations that have been shown to be affected by the disease, such as regulatory T cells, unswitched memory B cells, and CD21low CD38low B cells. It will also be important to use NGS to investigate the antigen receptor repertoire in a larger number of WAS patients, including those with autoimmunity, in order to assess whether additional abnormalities may be detected. Finally, along with recently published data (16, 17, 21), this study may provide a framework to monitor WAS disease correction with HCT and gene therapy.
Conflict of Interest Statement
The authors declare that the research was conducted in the absence of any commercial or financial relationships that could be construed as a potential conflict of interest.
Acknowledgments
This manuscript has been supported by NIH grant 5P01HL059561-13 (to Luigi Daniele Notarangelo). Amy E. O’Connell is supported by T32 fellowship grant AI007512. The authors would like to thank all of the patients and controls as well as their families for their time and their contribution to our work. We would also like to thank the technicians in the Boston Children’s Hospital flow cytometry core facility for their assistance with cell sorting.
References
2. Aldrich RA, Steinberg AG, Campbell DC. Pedigree demonstrating a sex-linked recessive condition characterized by draining ears, eczematoid dermatitis and bloody diarrhea. Pediatrics (1954) 13:133–9.
3. Sullivan KE, Mullen CA, Blaese RM, Winkelstein JA. A multiinstitutional survey of the Wiskott-Aldrich syndrome. J Pediatr (1994) 125:876–85. doi: 10.1016/S0022-3476(05)82002-5
4. Mahlaoui N, Pellier I, Mignot C, Jais JP, Bilhou-Nabera C, Moshous D, et al. Characteristics and outcome of early-onset, severe forms of Wiskott-Aldrich syndrome. Blood (2013) 121:1510–6. doi:10.1182/blood-2012-08-448118
5. Derry JM, Ochs HD, Francke U. Isolation of a novel gene mutated in Wiskott-Aldrich syndrome. Cell (1994) 78:635–44. doi:10.1016/0092-8674(94)90528-2
6. Calvez R, Lafouresse F, De Meester J, Galy A, Valitutti S, Dupre L. The Wiskott-Aldrich syndrome protein permits assembly of a focused immunological synapse enabling sustained T-cell receptor signaling. Haematologica (2011) 96:1415–23. doi:10.3324/haematol.2011.040204
7. Matalon O, Reicher B, Barda-Saad M. Wiskott-Aldrich syndrome protein – dynamic regulation of actin homeostasis: from activation through function and signal termination in T lymphocytes. Immunol Rev (2013) 256:10–29. doi:10.1111/imr.12112
8. Symons M, Derry JM, Karlak B, Jiang S, Lemahieu V, McCormick F, et al. Wiskott-Aldrich syndrome protein, a novel effector for the GTPase CDC42Hs, is implicated in actin polymerization. Cell (1996) 84:723–34. doi:10.1016/S0092-8674(00)81050-8
9. Ochs HD, Thrasher AJ. The Wiskott-Aldrich syndrome. J Allergy Clin Immunol (2006) 117:725–38. doi:10.1016/j.jaci.2006.02.005
10. Park JY, Kob M, Prodeus AP, Rosen FS, Shcherbina A, Remold-O’Donnell E. Early deficit of lymphocytes in Wiskott-Aldrich syndrome: possible role of WASP in human lymphocyte maturation. Clin Exp Immunol (2004) 136:104–10. doi:10.1111/j.1365-2249.2004.02409.x
11. Cianferoni A, Massaad M, Feske S, De La Fuente MA, Gallego L, Ramesh N, et al. Defective nuclear translocation of nuclear factor of activated T cells and extracellular signal-regulated kinase underlies deficient IL-2 gene expression in Wiskott-Aldrich syndrome. J Allergy Clin Immunol (2005) 116:1364–71. doi:10.1016/j.jaci.2005.09.006
12. Trifari S, Sitia G, Aiuti A, Scaramuzza S, Marangoni F, Guidotti LG, et al. Defective Th1 cytokine gene transcription in CD4+ and CD8+ T cells from Wiskott-Aldrich syndrome patients. J Immunol (2006) 177:7451–61. doi:10.4049/jimmunol.177.10.7451
13. Becker-Herman S, Meyer-Bahlburg A, Schwartz MA, Jackson SW, Hudkins KL, Liu C, et al. WASp-deficient B cells play a critical, cell-intrinsic role in triggering autoimmunity. J Exp Med (2011) 208:2033–42. doi:10.1084/jem.20110200
14. Recher M, Burns SO, De La Fuente MA, Volpi S, Dahlberg C, Walter JE, et al. B cell-intrinsic deficiency of the Wiskott-Aldrich syndrome protein (WASp) causes severe abnormalities of the peripheral B-cell compartment in mice. Blood (2012) 119:2819–28. doi:10.1182/blood-2011-09-379412
15. Westerberg LS, De La Fuente MA, Wermeling F, Ochs HD, Karlsson MC, Snapper SB, et al. WASP confers selective advantage for specific hematopoietic cell populations and serves a unique role in marginal zone B-cell homeostasis and function. Blood (2008) 112:4139–47. doi:10.1182/blood-2008-02-140715
16. Castiello MC, Bosticardo M, Pala F, Catucci M, Chamberlain N, Van Zelm MC, et al. Wiskott-Aldrich Syndrome protein deficiency perturbs the homeostasis of B-cell compartment in humans. J Autoimmun (2013) 50:42–50. doi:10.1016/j.jaut.2013.10.006
17. Simon KL, Anderson SM, Garabedian EK, Moratto D, Sokolic RA, Candotti F. Molecular and phenotypic abnormalities of B lymphocytes in patients with Wiskott-Aldrich syndrome. J Allergy Clin Immunol (2014) 133:896.e–9.e. doi:10.1016/j.jaci.2013.08.050
18. Rakhmanov M, Keller B, Gutenberger S, Foerster C, Hoenig M, Driessen G, et al. Circulating CD21low B cells in common variable immunodeficiency resemble tissue homing, innate-like B cells. Proc Natl Acad Sci U S A (2009) 106:13451–6. doi:10.1073/pnas.0901984106
19. Nikolich-Zugich J, Slifka MK, Messaoudi I. The many important facets of T-cell repertoire diversity. Nat Rev Immunol (2004) 4:123–32. doi:10.1038/nri1292
20. Wada T, Schurman SH, Garabedian EK, Yachie A, Candotti F. Analysis of T-cell repertoire diversity in Wiskott-Aldrich syndrome. Blood (2005) 106:3895–7. doi:10.1182/blood-2005-06-2336
21. Braun CJ, Boztug K, Paruzynski A, Witzel M, Schwarzer A, Rothe M, et al. Gene therapy for Wiskott-Aldrich syndrome – long-term efficacy and genotoxicity. Sci Transl Med (2014) 6:227ra233. doi:10.1126/scitranslmed.3007280
22. Baum PD, Venturi V, Price DA. Wrestling with the repertoire: the promise and perils of next generation sequencing for antigen receptors. Eur J Immunol (2012) 42:2834–9. doi:10.1002/eji.201242999
23. Benichou J, Ben-Hamo R, Louzoun Y, Efroni S. Rep-Seq: uncovering the immunological repertoire through next-generation sequencing. Immunology (2012) 135:183–91. doi:10.1111/j.1365-2567.2011.03527.x
24. Bolotin DA, Mamedov IZ, Britanova OV, Zvyagin IV, Shagin D, Ustyugova SV, et al. Next generation sequencing for TCR repertoire profiling: platform-specific features and correction algorithms. Eur J Immunol (2012) 42:3073–83. doi:10.1002/eji.201242517
25. Robins H. Immunosequencing: applications of immune repertoire deep sequencing. Curr Opin Immunol (2013) 25:646–52. doi:10.1016/j.coi.2013.09.017
26. Alamyar E, Duroux P, Lefranc MP, Giudicelli V. IMGT((R)) tools for the nucleotide analysis of immunoglobulin (IG) and T cell receptor (TR) V-(D)-J repertoires, polymorphisms, and IG mutations: IMGT/V-QUEST and IMGT/HighV-QUEST for NGS. Methods Mol Biol (2012) 882:569–604. doi:10.1007/978-1-61779-842-9_32
27. Rogosch T, Kerzel S, Hoi KH, Zhang Z, Maier RF, Ippolito GC, et al. Immunoglobulin analysis tool: a novel tool for the analysis of human and mouse heavy and light chain transcripts. Front Immunol (2012) 3:176. doi:10.3389/fimmu.2012.00176
28. Hammer Ø, Harper DAT, Ryan PD. PAST: Paleontological statistics software package for education and data analysis. Palaeontol Electronica (2001) 4:1–9. Available from: http://palaeo-electronica.org/2001_1/past/issue1_01.htm
29. Lee YN, Frugoni F, Dobbs K, Walter JE, Giliani S, Gennery AR, et al. A systematic analysis of recombination activity and genotype-phenotype correlation in human recombination-activating gene 1 deficiency. J Allergy Clin Immunol (2013) 133(4):1099–108. doi:10.1016/j.jaci.2013.10.007
30. Ijspeert H, Driessen GJ, Moorhouse MJ, Hartwig NG, Wolska-Kusnierz B, Kalwak K, et al. Similar recombination-activating gene (RAG) mutations result in similar immunobiological effects but in different clinical phenotypes. J Allergy Clin Immunol (2014) 133:1124.e–33.e. doi:10.1016/j.jaci.2013.11.028
31. Yu X, Almeida J, Darko S, Van Der Burg M, Deravin SS, Malech H, et al. Human syndromes of immunodeficiency and dysregulation are characterized by distinct defects in T-cell receptor repertoire development. J Allergy Clin Immunol (2014) 133(4):1109–15. doi:10.1016/j.jaci.2013.11.018
32. Ochs HD, Slichter SJ, Harker LA, Von Behrens WE, Clark RA, Wedgwood RJ. The Wiskott-Aldrich syndrome: studies of lymphocytes, granulocytes, and platelets. Blood (1980) 55:243–52.
33. Wherry EJ, Ha SJ, Kaech SM, Haining WN, Sarkar S, Kalia V, et al. Molecular signature of CD8+ T cell exhaustion during chronic viral infection. Immunity (2007) 27:670–84. doi:10.1016/j.immuni.2007.09.006
34. Venturi V, Quigley MF, Greenaway HY, Ng PC, Ende ZS, McIntosh T, et al. A mechanism for TCR sharing between T cell subsets and individuals revealed by pyrosequencing. J Immunol (2011) 186:4285–94. doi:10.4049/jimmunol.1003898
35. Dziubianau M, Hecht J, Kuchenbecker L, Sattler A, Stervbo U, Rodelsperger C, et al. TCR repertoire analysis by next generation sequencing allows complex differential diagnosis of T cell-related pathology. Am J Transplant (2013) 13:2842–54. doi:10.1111/ajt.12431
36. Jackson KJ, Kidd MJ, Wang Y, Collins AM. The shape of the lymphocyte receptor repertoire: lessons from the B cell receptor. Front Immunol (2013) 4:263. doi:10.3389/fimmu.2013.00263
37. Trifari S, Scaramuzza S, Catucci M, Ponzoni M, Mollica L, Chiesa R, et al. Revertant T lymphocytes in a patient with Wiskott-Aldrich syndrome: analysis of function and distribution in lymphoid organs. J Allergy Clin Immunol (2010) 125:439.e–48.e. doi:10.1016/j.jaci.2009.11.034
38. Park JY, Shcherbina A, Rosen FS, Prodeus AP, Remold-O’Donnell E. Phenotypic perturbation of B cells in the Wiskott-Aldrich syndrome. Clin Exp Immunol (2005) 139:297–305. doi:10.1111/j.1365-2249.2005.02693.x
39. Pascual V, Victor K, Lelsz D, Spellerberg MB, Hamblin TJ, Thompson KM, et al. Nucleotide sequence analysis of the V regions of two IgM cold agglutinins. Evidence that the VH4-21 gene segment is responsible for the major cross-reactive idiotype. J Immunol (1991) 146:4385–91.
40. Silberstein LE, Jefferies LC, Goldman J, Friedman D, Moore JS, Nowell PC, et al. Variable region gene analysis of pathologic human autoantibodies to the related I and I red blood cell antigens. Blood (1991) 78:2372–86.
41. Roben P, Barbas SM, Sandoval L, Lecerf JM, Stollar BD, Solomon A, et al. Repertoire cloning of lupus anti-DNA autoantibodies. J Clin Invest (1996) 98:2827–37. doi:10.1172/JCI119111
42. Roark JH, Bussel JB, Cines DB, Siegel DL. Genetic analysis of autoantibodies in idiopathic thrombocytopenic purpura reveals evidence of clonal expansion and somatic mutation. Blood (2002) 100:1388–98.
43. Massaad MJ, Ramesh N, Geha RS. Wiskott-Aldrich syndrome: a comprehensive review. Ann N Y Acad Sci (2013) 1285:26–43. doi:10.1111/nyas.12049
Keywords: Wiskott–Aldrich syndrome, immune repertoire, next generation sequencing, deep sequencing, B cell receptor, T cell receptor, somatic hypermutation, clonotypic expansion
Citation: O’Connell AE, Volpi S, Dobbs K, Fiorini C, Tsitsikov E, de Boer H, Barlan IB, Despotovic JM, Espinosa-Rosales FJ, Hanson IC, Kanariou MG, Martínez-Beckerat R, Mayorga-Sirera A, Mejia-Carvajal C, Radwan N, Weiss AR, Pai S-Y, Lee YN and Notarangelo LD (2014) Next generation sequencing reveals skewing of the T and B cell receptor repertoires in patients with Wiskott–Aldrich syndrome. Front. Immunol. 5:340. doi: 10.3389/fimmu.2014.00340
Received: 02 May 2014; Accepted: 04 July 2014;
Published online: 18 July 2014.
Edited by:
Mirjam Van Der Burg, Erasmus University Medical Center, NetherlandsReviewed by:
Lisa S. Westerberg, Karolinska Institutet, SwedenEmily Mace, Baylor College of Medicine, USA
Copyright: © 2014 O’Connell, Volpi, Dobbs, Fiorini, Tsitsikov, de Boer, Barlan, Despotovic, Espinosa-Rosales, Hanson, Kanariou, Martínez-Beckerat, Mayorga-Sirera, Mejia-Carvajal, Radwan, Weiss, Pai, Lee and Notarangelo. This is an open-access article distributed under the terms of the Creative Commons Attribution License (CC BY). The use, distribution or reproduction in other forums is permitted, provided the original author(s) or licensor are credited and that the original publication in this journal is cited, in accordance with accepted academic practice. No use, distribution or reproduction is permitted which does not comply with these terms.
*Correspondence: Luigi D. Notarangelo, Department of Immunology, Boston Children’s Hospital, 1 Blackfan Circle, Karp 10, Boston, MA 02115, USA e-mail: luigi.notarangelo@childrens.harvard.edu