Inter-Annual Variability of Organic Carbon Concentration in the Eastern Fram Strait During Summer (2009–2017)
 Anja Engel1*
  Astrid Bracher2,3
  Tilman Dinter2
  Sonja Endres1,4
  Julia Grosse1
  Katja Metfies1,5
  Ilka Peeken2
  Judith Piontek1,6
  Ian Salter2
  Eva-Maria Nöthig2
- 1GEOMAR Helmholtz Centre for Ocean Research Kiel, Kiel, Germany
- 2Alfred Wegener Institute, Helmholtz Centre for Polar and Marine Research (AWI), Bremerhaven, Germany
- 3Institute of Environmental Physics, University Bremen, Bremen, Germany
- 4Max Planck Institute for Chemistry, Mainz, Germany
- 5Helmholtz Institute for Functional Marine Biodiversity, Oldenburg, Germany
- 6Department of Biological Oceanography, Leibniz Institute for Baltic Sea Research Warnemünde, Rostock, Germany
The Arctic Ocean plays a key role in regulating the global climate, while being highly sensitive to climate change. Temperature in the Arctic increases faster than the global average, causing a loss of multiyear sea-ice and affecting marine ecosystem structure and functioning. As a result, Arctic primary production and biogeochemical cycling are changing. Here, we investigated inter-annual changes in the concentrations of particulate and dissolved organic carbon (POC, DOC) together with biological drivers, such as phyto- and bacterioplankton abundance in the Fram Strait, the Atlantic gateway to the Central Arctic Ocean. Data have been collected in summer at the Long-Term Ecological Research observatory HAUSGARTEN during eight cruises from 2009 to 2017. Our results suggest that the dynamic physical system of the Fram Strait induces strong heterogeneity of the ecosystem that displays considerable intra-seasonal as well as inter-annual variability. Over the observational period, DOC concentrations were significantly negatively related to temperature and salinity, suggesting that outflow of Central Arctic waters carrying a high DOC load is the main control of DOC concentration in this region. POC concentration was not linked to temperature or salinity but tightly related to phytoplankton biomass as estimated from chlorophyll-a concentrations (Chl-a). For the years 2009–2017, no temporal trends in the depth-integrated (0–100 m) amounts of DOC and Chl-a were observed. In contrast, depth-integrated (0–100 m) amounts of POC, as well as the ratio [POC]:[TOC], decreased significantly over time. This suggests a higher partitioning of organic carbon into the dissolved phase. Potential causes and consequences of the observed changes in organic carbon stocks for food-web structure and CO2 sequestration are discussed.
Introduction
The Arctic Ocean undergoes fast environmental transformation due to climate change including a strongly declined summer sea ice extent that coincides with an intense loss of multi-year sea ice (Polyakov et al., 2010; Wassmann, 2011; Stroeve et al., 2012). The rate of warming in the Arctic exceeds two times the global average and may result in a temperature increase of up to 6°C by the 21st century (ACIA, 2014), assigning the Arctic as the most rapidly changing region of our planet (Solomon et al., 2013). In recent years, the loss of sea ice cover has increased, with a minimum of 3.41 million square kilometers in the summer of 2012 (National Snow and Ice Data Center, Colorado, United States). Many factors are responsible for Arctic change: the increased atmospheric concentration of greenhouse gases, as well as changes in aerosol abundance and land use, alter the radiative budget of the Earth leading to a net global warming of the atmosphere (Solomon et al., 2013). Besides rising atmospheric temperatures, there is also an increased advection of warm waters into the Arctic region due to changes in global oceanic currents (Comiso et al., 2008; Chylek et al., 2009; Spielhagen et al., 2011). Sea ice loss reduces the surface albedo, and amplifies warming and further sea ice melting processes in spring and summer (Serreze et al., 2007; Screen and Simmonds, 2010). In addition, the sea ice is drifting faster (Kwok et al., 2013) and is more prone to the deformation by storms (Itkin et al., 2017), leaving a changed icescape.
As a consequence of these processes, the marine ecosystem is expected to undergo changes because primary productivity and carbon cycling, including the production, degradation and respiration of organic carbon, are directly responding to altered temperatures and light conditions. Sea-ice melting starting before solar radiation allows for algal productivity and growth, thus the sea ice as algal habitat vanishes. The loss of sea ice will not only affect the timing of ice algal and phytoplankton blooms in the Arctic (Ji et al., 2013), but may lead to a trophic mismatch between primary producers and their grazers, e.g., zooplankton (Søreide et al., 2010). Additionally, this may lead to differences in carbon supply to the deep sea and sequestering of carbon in Arctic sediments (Lalande et al., 2009; Boetius et al., 2013; Harada, 2016). Warming and increased melt water input may also affect water column stratification and vertical supply of nutrients to the euphotic zone. Nutrient limitation of autotrophic growth not only reduces biomass production but also leads to an increasing fraction of organic carbon being partitioned into dissolved organic carbon (DOC) (Myklestad et al., 1972; Biddanda and Benner, 1997; Engel et al., 2002). Warming may amplify this process since increasing temperatures have been shown to favor the partitioning of carbon into the dissolved organic matter (DOM) pool (Wohlers et al., 2009; Engel et al., 2011; Kim et al., 2011). Temperature is a key control of microbial activity. However, in Polar Seas (<4°C) temperature sensitivities of marine bacteria are strongly co-determined by bioavailable DOC (Kirchman et al., 2009b). Because DOC is the main substrate for microbial uptake (Azam and Hodson, 1977), a higher DOC production in the Arctic, due to warming or seawater acidification (Engel et al., 2013), may stimulate the microbial food web, and also therefore the turn-over of organic carbon components (Azam et al., 1983; Thingstad et al., 2008; Kirchman et al., 2009a). Following these arguments, the influence of global change on the microbial utilization of organic carbon, and hence on the Arctic as a net sink for CO2 (Bates and Mathis, 2009), may be coupled to the availability of labile DOC.
On a global scale, DOC comprises more than 90% of total organic carbon (TOC), equivalent to 662 Pg C (Hansell et al., 2009). Thereby, marine DOC represents the largest dynamic organic carbon reservoirs on Earth. Changes in the marine DOC pool may significantly affect atmospheric CO2 concentrations on timescales of 1000–10,000 years (Hedges, 1992). In Arctic seawater, the concentration of DOC is often increased compared to other open ocean sites due to a high input of riverine DOC and slow degradation rates (Anderson et al., 1994; Bussmann and Kattner, 2000; Amon and Benner, 2003; Amon et al., 2003). Amon et al. (2003) reported DOC concentrations in the Nordic Sea basins (>1000 m) of ∼50 μmol L-1 DOC, clearly above deep values of other ocean basins 35–45 μmol L-1 C (Benner, 2002). Terrestrial DOC introduced to the central Arctic through large river systems, such as the Siberian rivers, is mainly of high age, substantially modified and presumably less bio-available (Meon and Amon, 2004). In contrast, DOC released by melting of glaciers in Alaska and Greenland has been show to contain labile components, readily bioavailable to microbiota (Hood et al., 2009; Paulsen et al., 2017). Yet, the contribution of glacier-derived DOC to seawater DOC is largely unknown.
In contrast to DOC, the concentration of particulate organic carbon (POC) in the ocean is often low and can reach values of <1 μmol L-1. POC concentration varies pronouncedly with biological production and drives food web interactions at the higher trophic levels as well as carbon export fluxes. For the Arctic Ocean, it has been suggested that a longer ice-free period and thinner sea-ice, as well as the changing ice cover and the increase in melt ponds, will influence the light field for phytoplankton and may therefore lead to higher annual phytoplankton production (Arrigo et al., 2014; Arrigo and Van Dijken, 2015). This may also be stimulated by increasing amounts of anthropogenic CO2 (Engel et al., 2013). The overall impact of sea-ice retreat on primary production, carbon cycling and partitioning between dissolved and particulate organic matter in the Arctic Ocean is still largely unknown. POC flux to depths in the ice-covered Arctic Ocean is usually extremely low (Cai et al., 2010; Harada, 2016) and is considered to be amongst the lowest in the global ocean (Honjo et al., 2008). However, with the transformation to a thinner cover, recent observations have detected phytoplankton blooms even beneath heavy snow-covered sea ice very early in the season (Assmy et al., 2017). In addition, ballasting of gypsum has recently been reported to increase the POC export flux (Wollenburg et al., 2018). Whether and how further seasonal and spatial shifts in primary production, as well as shifts in phytoplankton compositions, will influence POC standing stocks, transformation of organic matter and export is still an open question (Meier et al., 2014).
The Fram Strait, located in the transition zone between the northern North Atlantic and the central Arctic Ocean, is the only deep gateway to the Arctic Ocean. In the eastern Fram Strait, the West Spitsbergen Current (WSC) carries warm (2.7°C–8°C) Atlantic water into the Arctic Ocean, while the East Greenland Current (EGC) transports cold (∼-1.7°C-0°C) polar water in the upper 150 m toward the south in the western part of the Fram Strait. During the past decades, several studies on plankton dynamics have been carried out, which suggested shifts in phytoplankton community composition and size structure, changing from larger diatoms to smaller flagellates during the summer period in this area. This is co-occurring with higher advection of warmer North Atlantic water and less sea ice (Nöthig et al., 2015). Recent model results predicted a substantial difference in the pathways of carbon flow after warming and a shift in plankton community composition (Vernet et al., 2017), but overall small differences in the carbon export. Long-term monitoring from 1991 to 2012 revealed that chlorophyll-a (Chl-a) concentrations remain relatively constant in the colder western Fram Strait, while they continue to increase in the warmer eastern Fram Strait (Cherkasheva et al., 2014; Nöthig et al., 2015). The Long Term Research (LTER) observatory HAUSGARTEN (more details in Soltwedel et al., 2016) is situated in the eastern Fram Strait (Figure 1) and particles and biomass dynamics, including POC concentration, have been monitored since 1999 and DOC concentration has been monitored since 2009. Here, we analyze variations of surface water (0–100 m) concentrations of DOC and POC during summer for the HAUSGARTEN over the period 2009 to 2017, and investigate how physical controls, such as the origin of water masses, and biological controls, in particular phytoplankton and bacteria, may explain the observed data variability. We also discuss how intra-seasonal variations in bloom dynamics and differences in the time of sampling may affect trends that we see in this long-term time series.
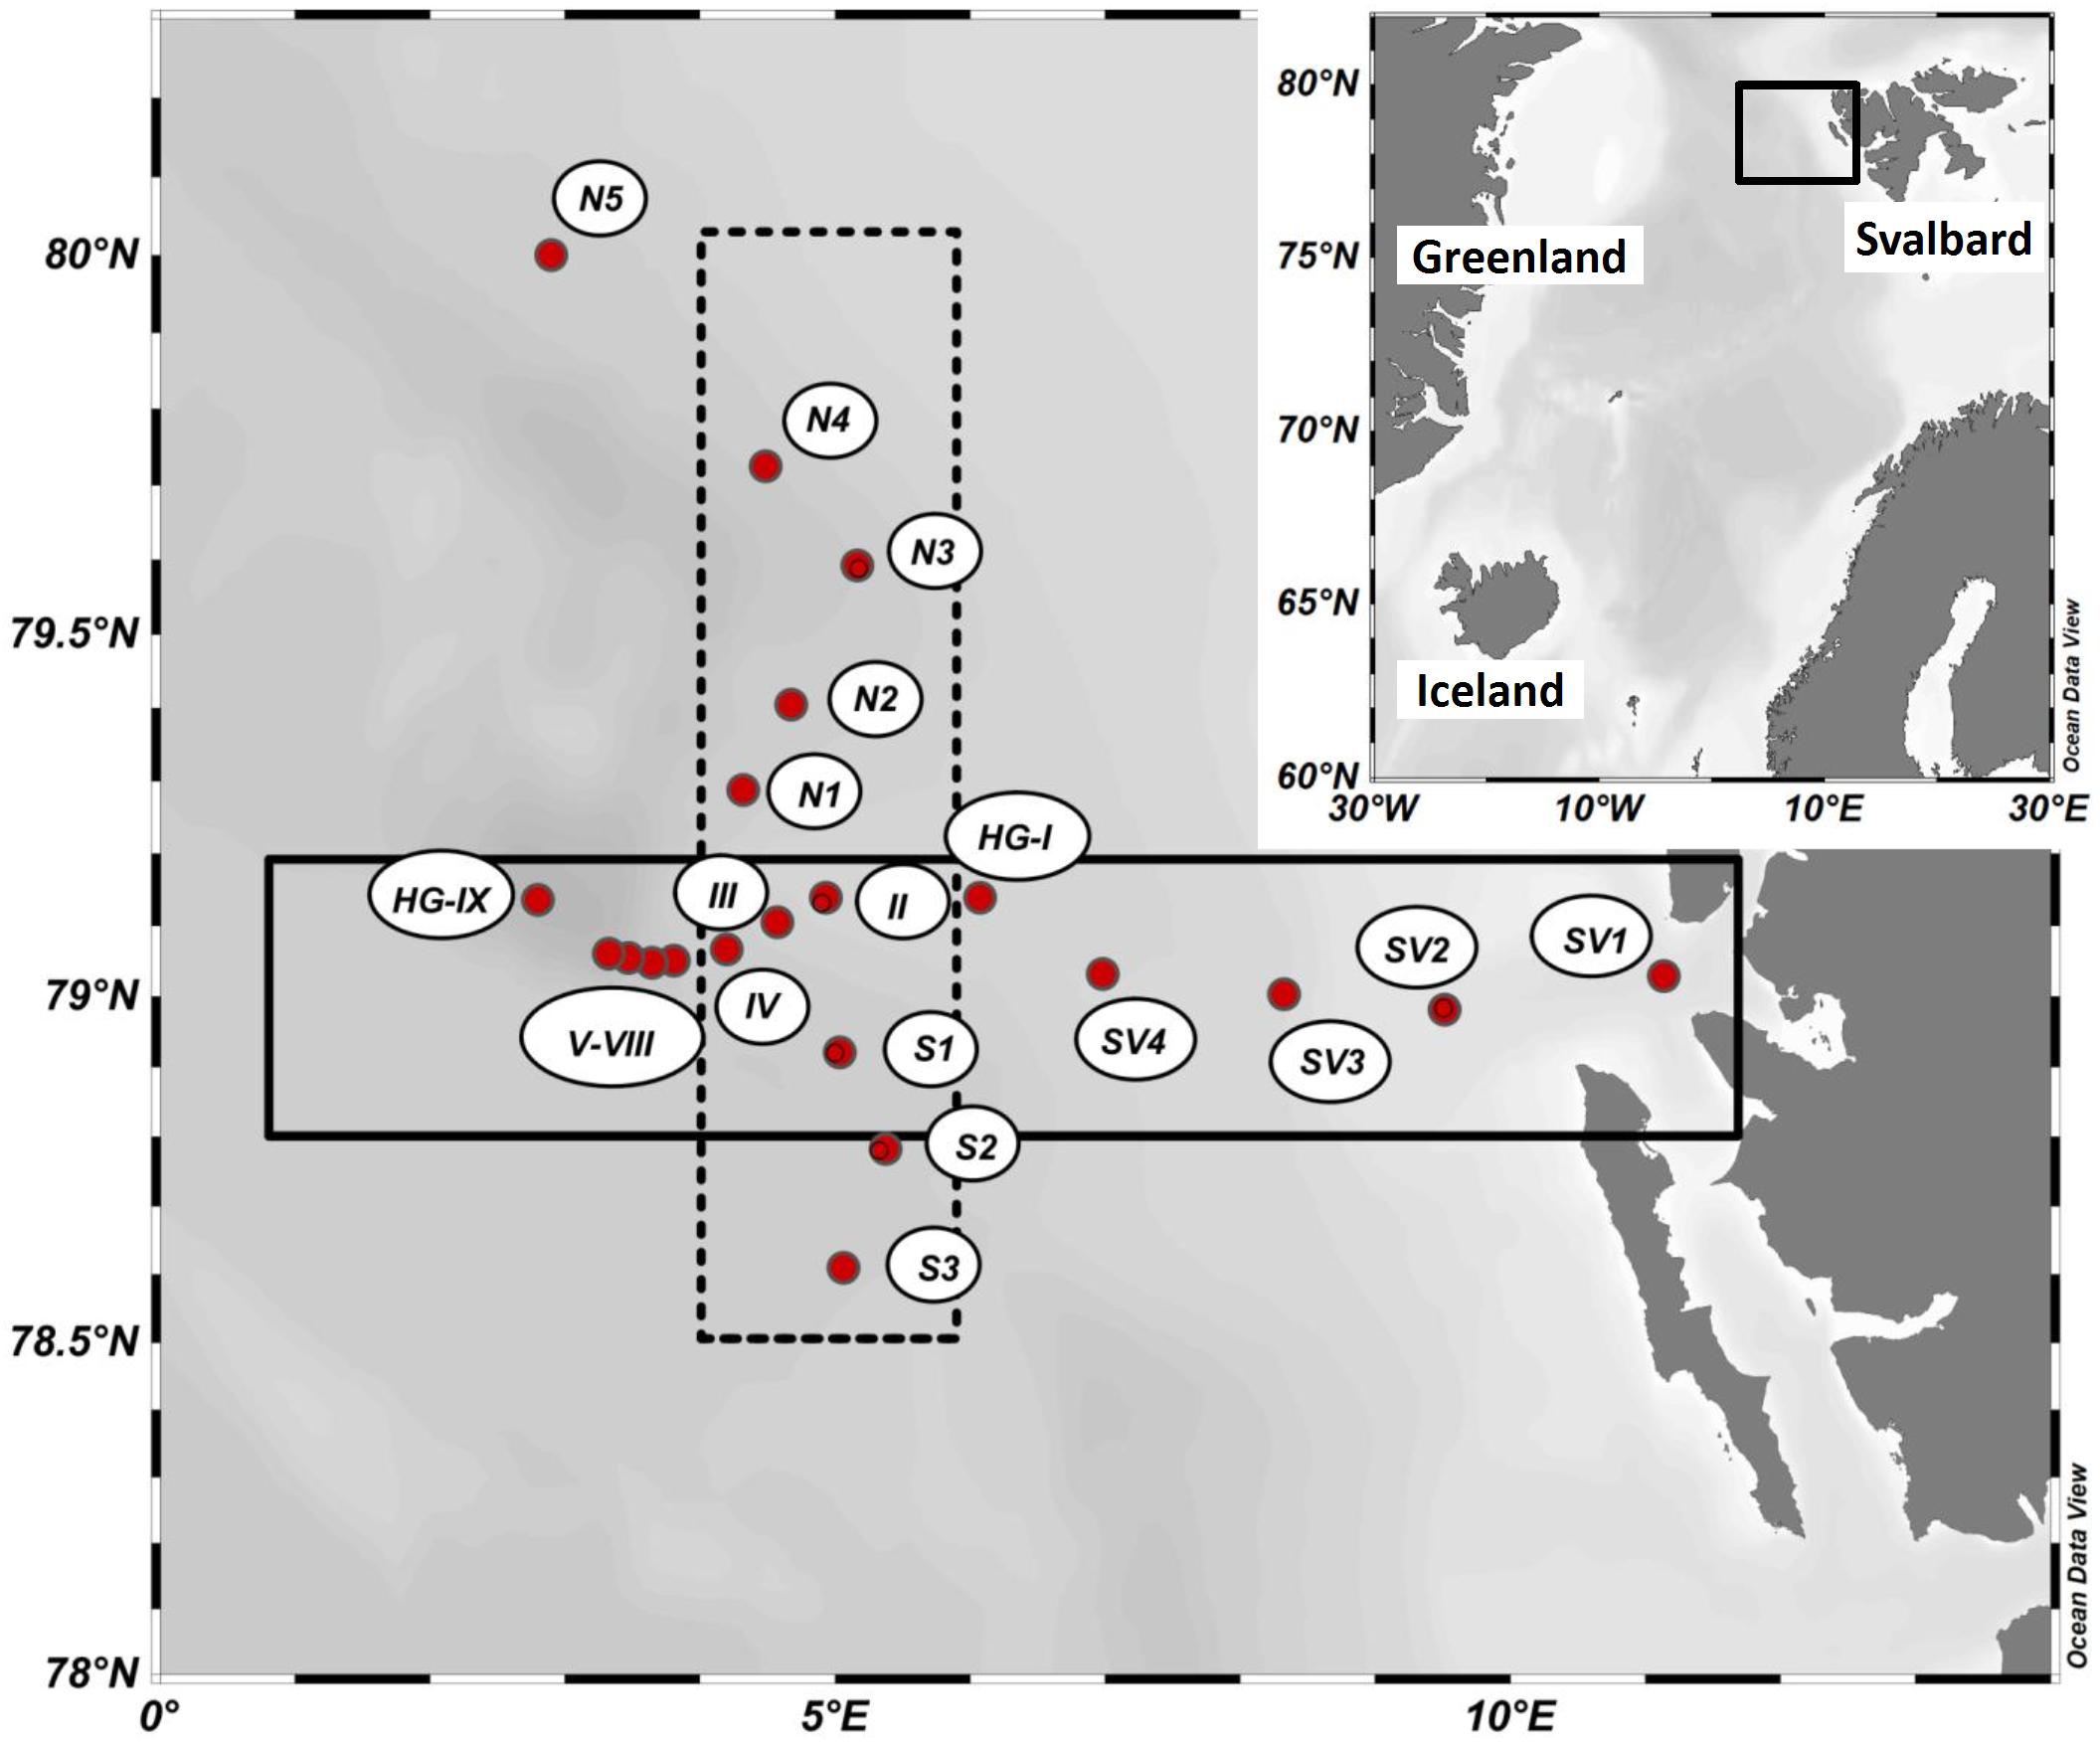
Figure 1. Map of the LTER HAUSGARTEN and typical stations visited during the summer season in 8 years between 2009 and 2017.
Materials and Methods
Field Sampling
Up to 21 monitoring stations were visited every year between 2009 and 2017 (except for 2013) in the area at and around the LTER observatory HAUSGARTEN, i.e., between 78.0°N and 79.9°N, and 2.8°E and 11.1°E, with the research vessel POLARSTERN during eight cruises (Figure 1 and Supplementary Table S1). Field samples were always collected in summer (June–August) between the surface and 100 m depth. At selected stations, deep profiles were recorded and samples collected down to 2500 m depth. A rosette sampler, equipped with a SEA-BIRD CTD system and 24 Niskin bottle (12 L), was used to determine depth profiles of temperature and salinity, and to collect seawater from defined depths. Subsamples were taken in PE bottles and processed on board immediately after sampling as described below. Hydrographic data for this period, including seawater temperature and salinity, were retrieved at PANGAEA. Since not all stations were visited each year, the numbers of samples varied between the years (Supplementary Tables S1).
Chlorophyll a
For Chlorophyll a (Chl-a), 0.5 – 2 L seawater were filtered onto glass fiber filters (Whatman GF/F) under low vacuum (<200 mbar). The filters were stored frozen at -20°C until analysis. Pigments on the filters were extracted with 5–10 ml of 90% acetone. Therefore, filters were sonicated in an ice bath for <1 min, and further extracted for 2 h in the refrigerator. Prior to measurement, they were centrifuged for 10 min at 5000 rpm at 0°C. Chl-a concentration was determined fluorometrically (Turner Designs), together with total phaeophytin concentration after acidification (HCl, 1.0 N) slightly modified to the methods described in Edler (1979) and Evans and O’Reily (1980), respectively. The standard deviation of replicate test samples was <10%.
Satellite-Derived Chlorophyll-a Concentrations
Satellite Chl-a concentrations, for the months April to August 2009 to 2017, were taken from the CMEMS Arctic product version 31. The data product is provided at 0.01 × 0.01 deg (ca. 1 × 1 km) pixel resolution and is based on the ESA Ocean Color Climate Change Initiative Remote Sensing Reflectance [merged, bias-corrected Remote Sensing Reflectance (Rrs); details see Sathyendranath et al., 2012] data, which are used to compute surface Chl-a (mg m-3). The Rrs data are generated by merging the data from SeaWiFS (Sea-viewing Wide Field-of-view Sensor on Orb-View-2), MODIS (Moderate resolution Imaging Spectrometer on Aqua) and MERIS (Medium Resolution Imaging Spectrometer on ENIVSAT) sensors and realigning the spectra to that of the SeaWiFS sensor. Chl-a concentration is estimated from the OC5ci algorithm, a combination of OCI (Hu et al., 2012) and OC5 (Gohin et al., 2008), developed at Plymouth Marine Laboratory (PML). Detailed description of the product and its calibration and validation given in the associated validation reports and quality documentation (see text footnote 1). The 8-days average products within 78.42°N–79.5°N and 2.27°E–6.2°E were analyzed for the mean, median, and standard deviation within the entire region. Following the method described in Nöthig et al. (2015), we determined the start and the end of a bloom for the chl-a satellite data set using a threshold value of 0.85 mg/m3 chl-a.
Particulate Organic Carbon
For particulate organic carbon (POC), aliquots of 1 to 6 L of seawater were filtered at low vacuum (<200 mbar) onto combusted (4 h at 500°C) GF/F filters (pore size: 0.7 μm). Filters were stored frozen (-20°C) until analysis. Prior analysis, filters were soaked in 0.1 N HCl for removal of inorganic carbon and dried at 60°C. POC concentrations were determined with a Carlo Erba CHN elemental analyzer.
Dissolved Organic Carbon
For dissolved organic carbon (DOC) duplicate samples of 20 mL seawater were filtered through combusted GF/F filters and collected in combusted glass ampoules. Samples were acidified with 80 μL of 85% phosphoric acid, flame sealed and stored at 4°C in the dark until analysis. In 2017, samples were filtered through 0.45 μm GMF filters and acidified with 20 μL of 30% hydrochloric acid, flame sealed and stored at 4°C in the dark until analysis. DOC samples were analyzed by high-temperature catalytic oxidation (TOC -VCSH, Shimadzu) (Sugimura and Suzuki, 1988) using the modified protocol of Engel and Galgani (2016). The DOC concentration was determined in each sample out of 5 to 8 replicate injections. Replicate measurements varied with 2% standard deviation.
Bacterial Cell Abundance
Bacteria were counted by flow cytometry (FACS Calibur, Becton Dickinson) according to Gasol and del Giorgio (2000). Briefly, 4.5 mL were fixed with 25% glutaraldehyde (1% final concentration), and stored at -20°C until analysis. Immediately before analysis, samples were sonicated for 5 s, and filtered through a 50 μm mesh. Cells in 400 μL of sample were stained with the DNA-binding dye SybrGreen I (Invitrogen). The flow of the cytometer was calibrated with solutions of fluorescent latex beads [TruCount BeadsTM (BD) and the Flouresbrite® fluorescent beads (Polyscience, Inc., Warrington, PA, United States)]. Fluorescent beads were also added to each sample as an internal standard. The detection limit was 34 cells per 1 mL of sample and measurement error associated to this method was 2%.
Data Analysis
Average values are given by their median value and standard deviation unless otherwise stated. Depth integrated values for the water column (0–100 m) were calculated by linear interpolation of values obtained at 4–6 sampling depths in the range 5–100 m. Concentrations in the water column above the first value and below the last were assumed to be equal to the first and last value, respectively. Kruskal-Wallis One Way Analysis of Variance on Ranks and non-parametric post hoc pairwise multiple comparison (Dunn’s Test) were applied for analysis of inter-annual variability. Statistical tests in data analysis have been accepted as significant for p < 0.05. Calculations, statistical tests and illustration were performed with Microsoft Office Excel 2010, Sigma Plot 12.0 (Systat), Ocean Data View (Schlitzer, 2015).
Results
Physical Conditions at the Study Site
Considering the full period (2009–2017), seawater temperature in the upper 100 m of the water column ranged between -1.726 and 8.622°C, and salinity between 30.149 and 35.533 (data not shown). Adopting water mass classification for the region (Amon et al., 2003), both temperature and salinity in our data set were apparently influenced by the West Spitsbergen Current (WSC), carrying warmer (>3°C) and more saline (>34.90 ppt) North-Atlantic waters poleward, and by the East Greenland Current (EGC), transporting cooler and fresher Polar Waters to the South. Polar Waters is a practical definition and includes all waters with salinity <34.7 and temperature <0°C. Since organic carbon production in the ocean is closely connected to primary production, we analyzed phytoplankton biomass as indicated by Chl-a concentration from April to August, using remote sensing data obtained from SeaWIFS, MODIS, and MERIS (Figure 2). At the beginning of our time series (2009–2011), two blooms per year were regularly appearing, while the second blooms were absent or only there for a week in the more recent years. The duration of the first bloom was between three (minimum: 2011) and eleven (maximum: 2012) weeks with an average of seven weeks. The 2nd bloom’s duration, if appearing, was one (in 2012, 2014, 2016), two (2009), six (2010), and seven (2011) weeks.
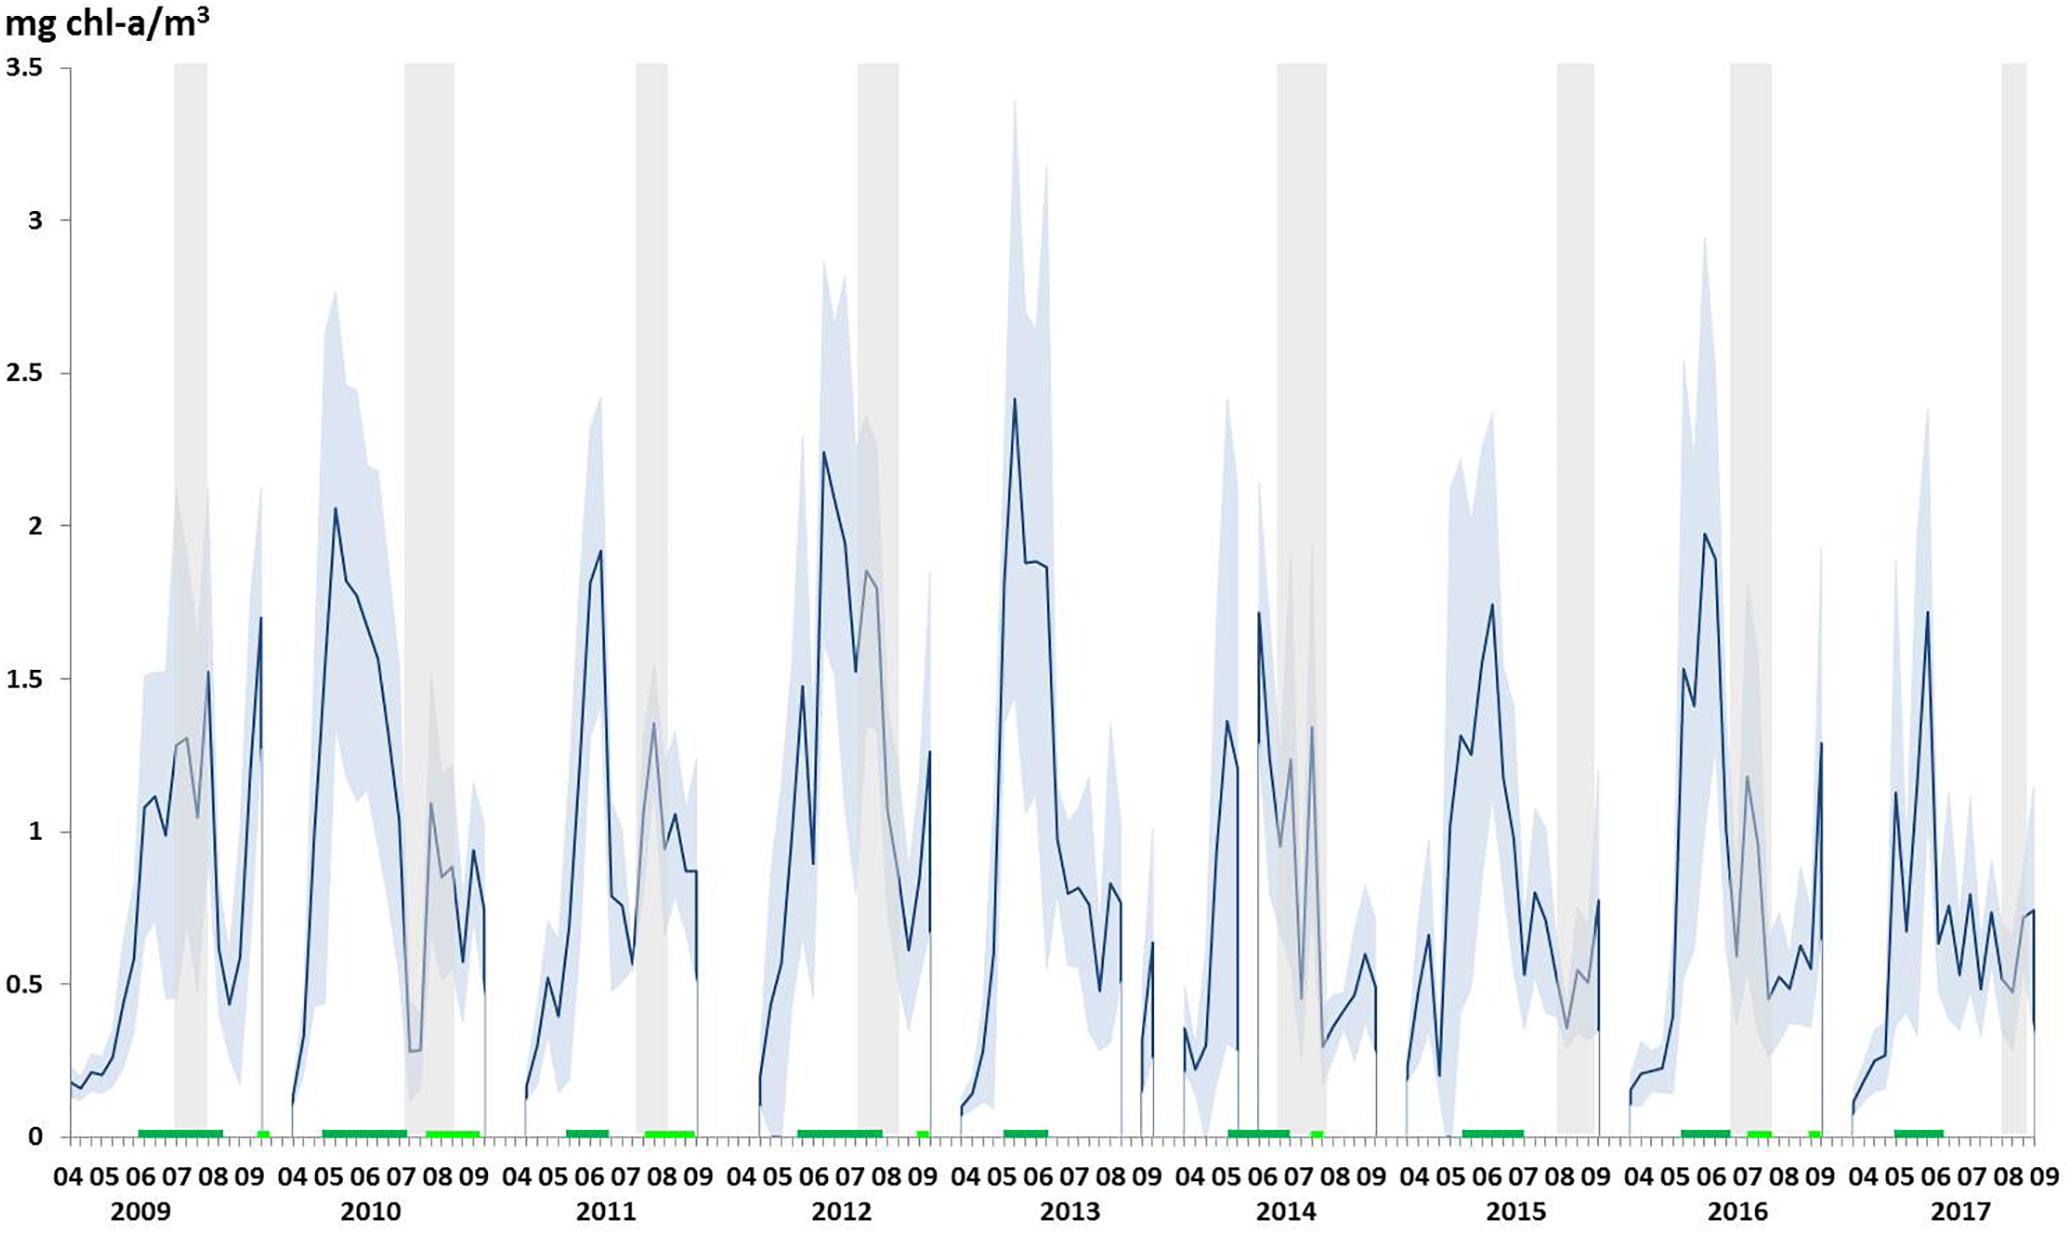
Figure 2. Average (mean) chlorophyll a (Chl-a) concentrations during the period April–August from 2009 to 2017 as derived from satellite data (the standard deviation is indicated by the shaded area). Periods of the 1st bloom and the 2nd blooming time within a year (mean value above 0.85 mg/m3 chl-a concentration) are indicated by dark and light green lines, respectively. Periods of campaigns are indicated by gray bars. Chl-a concentration averages are based on 8-days average products within the HAUSGARTEN area (78.42°N–79.5°N and 2.27°E–6.2°E).
In general, from 2010 to 2017, seawater sampling during the cruises was conducted after occurrence of the phytoplankton biomass peak, as suggested from Chl-a concentration averaged over the HAUSGARTEN sampling-area (Figure 2). In those years, phytoplankton blooms, i.e., >1 μg Chl-a L-1, typically peaked in early June. Only in 2009, the time of sampling coincided with highest area-averaged Chl-a concentration during that year, albeit concentrations in 2009 were lower than maximum concentrations in other years. In general, the spatial coverage of phytoplankton blooms was also larger during the month of June (sometimes also in July; Figure 3), while in 2009 high Chl-a concentrations in the HAUSGARTEN area were observed later in summer (July and August).
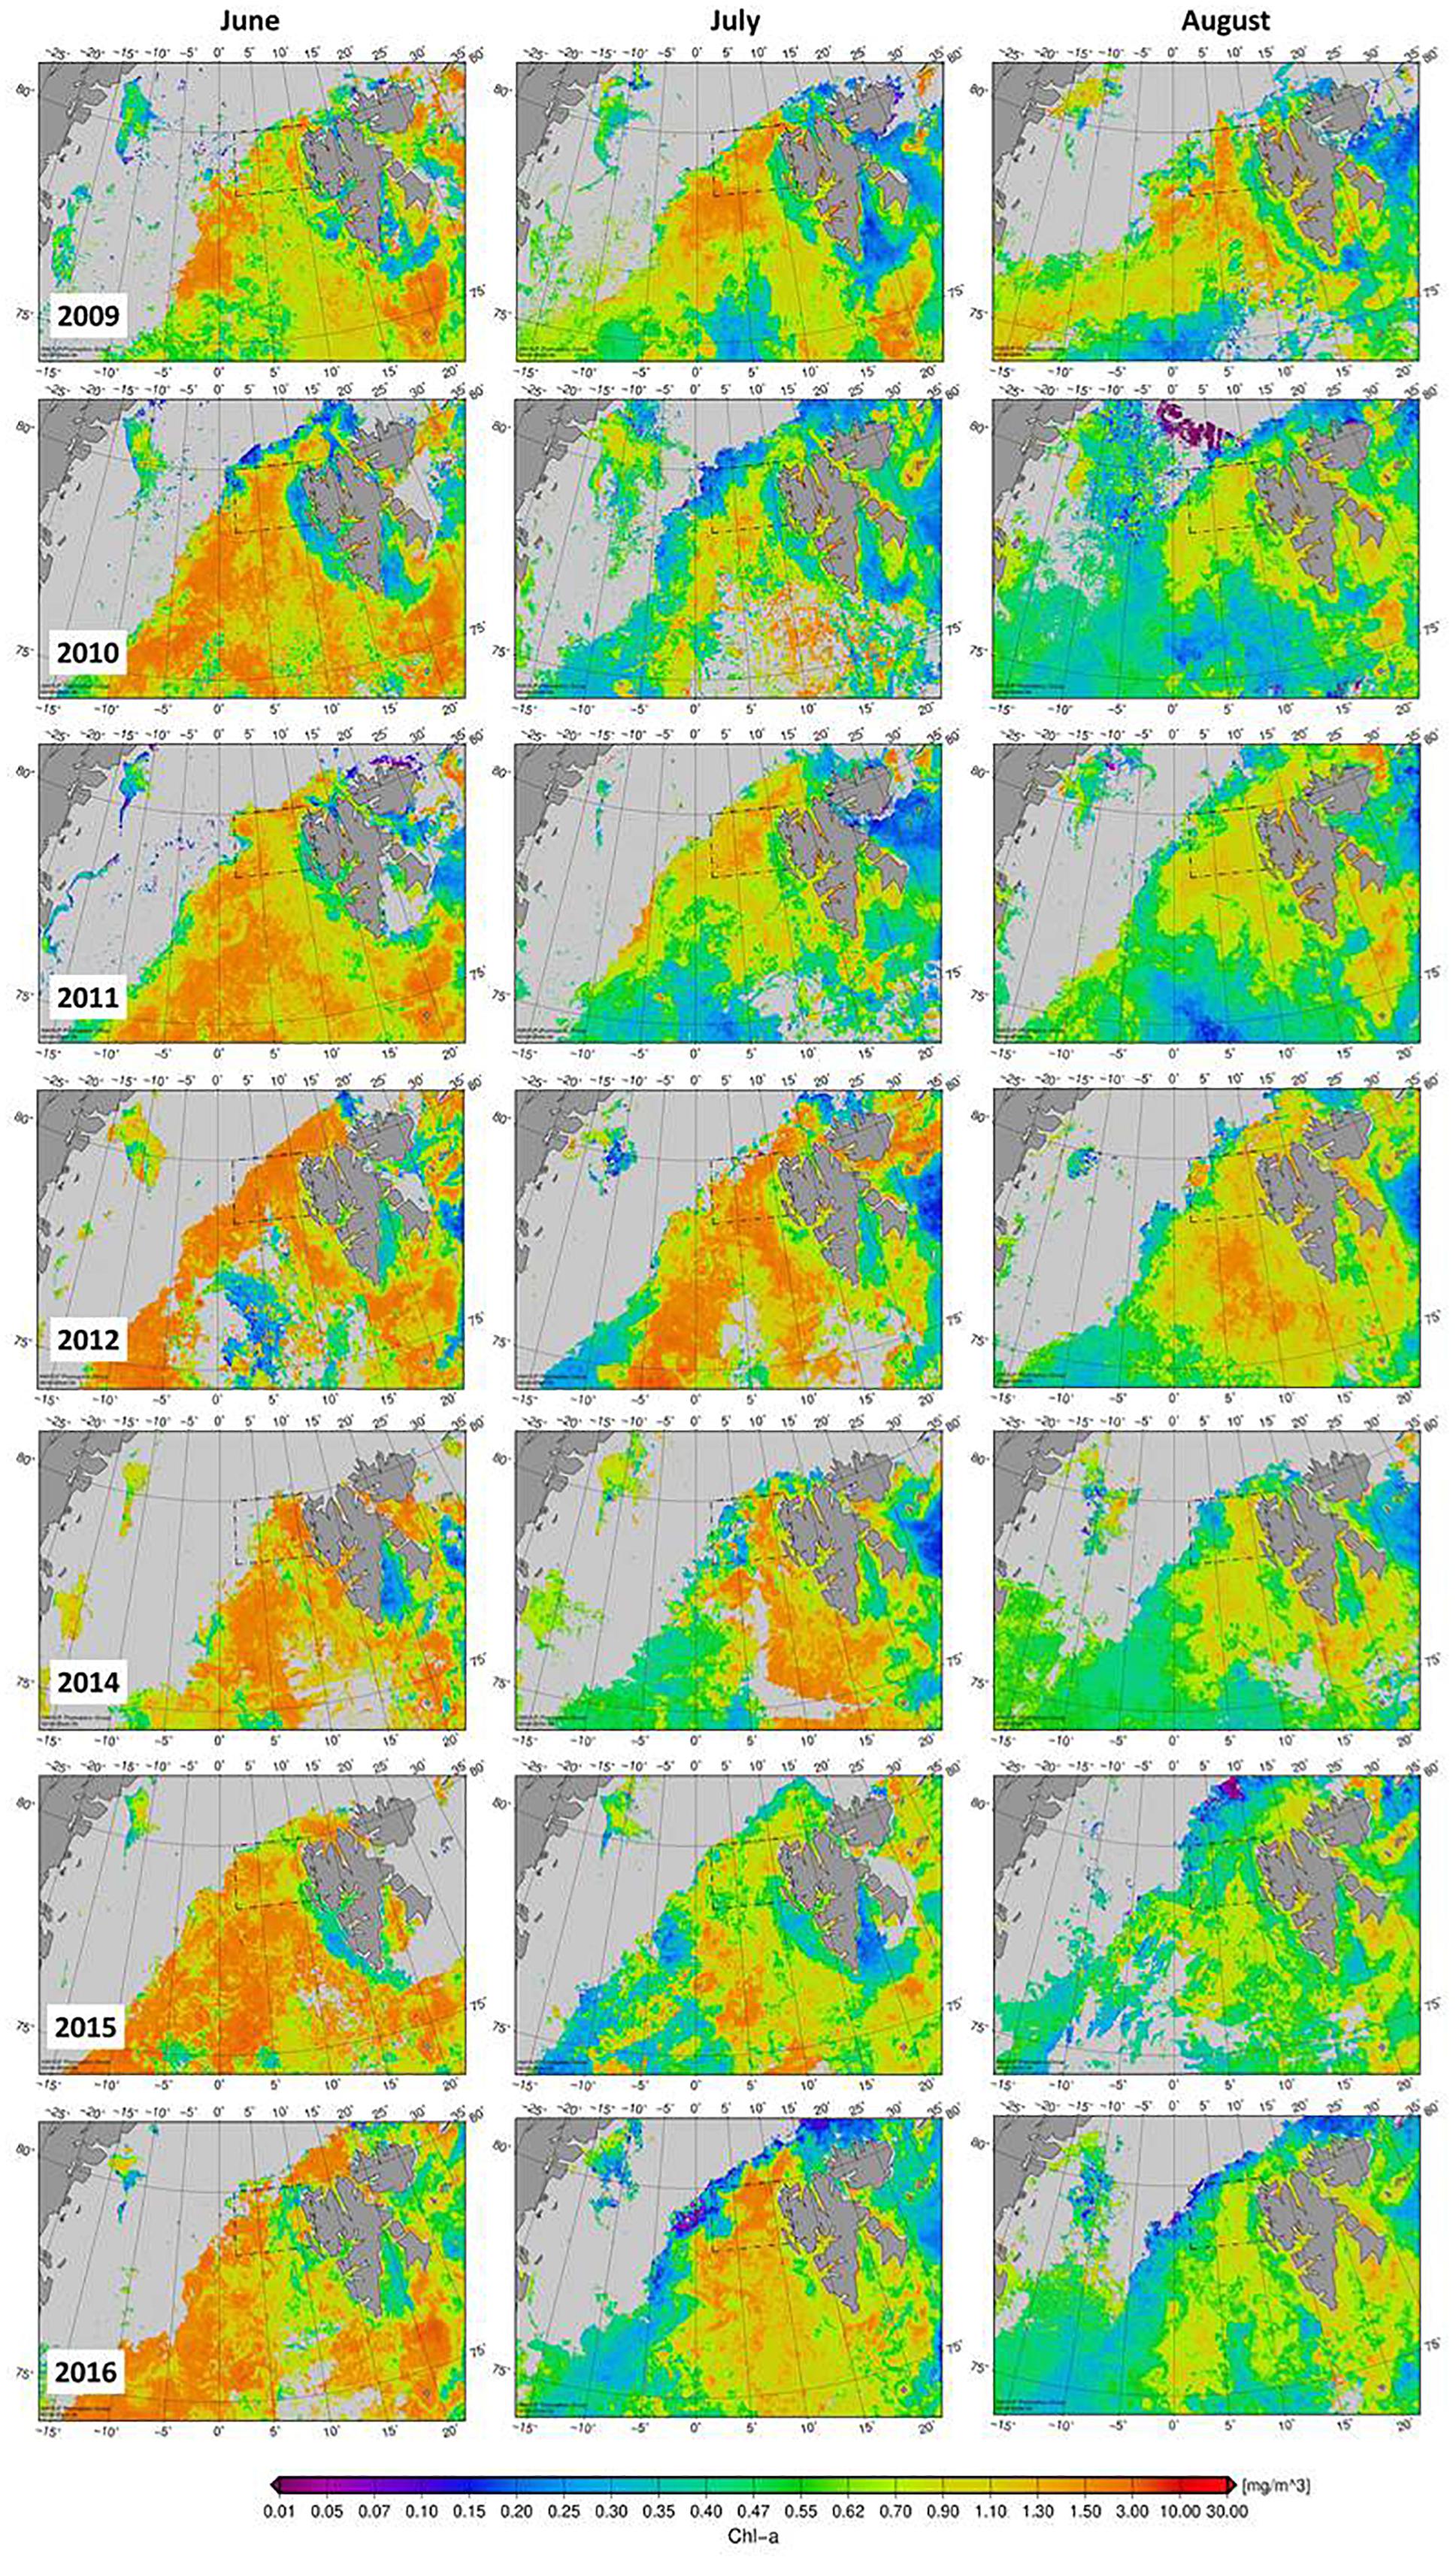
Figure 3. Spatial variability of satellite derived Chl-a concentration (mg m-3) in the Fram Strait during summer months (June–August) when sampling has been conducted. No cruise was conducted in 2013; data not available for 2017. Land area is indicated by dark gray shade, cloud coverage by lighter gray.
Variability of Organic Carbon Concentration
Dissolved Organic Carbon (DOC)
Overall, DOC concentration in the upper 100 m of the water column ranged between ∼40 and 170 μmol L-1 (n = 643) (Figure 4A and Table 1). Highest concentrations were observed within the upper 20 m, declining slightly to 30 m. Considerable variability was still observed at 100 m ranging between 40 and 95 μmol L-1. In general, observed values lie within the range of previously determined DOC concentrations for the Fram Strait (Amon et al., 2003). Variability of DOC concentration clearly decreased below 250 m depth. Two deep profiles recorded in 2016 showed relatively stable DOC concentration between 250 and 2500 m of 52 ± 2 μmol L-1 (n = 10) (Figure 5A). This value is higher than the lowest values recorded for the upper 100 m of the water column in other years (Figure 4A) and may indicate deep export of water with higher DOC concentration, e.g., waters of polar origin, and/or processes leading to lowered DOC concentration in the surface ocean, such as DOC adsorption onto particles. DOC concentrations at the two deep stations in 2016 strongly increased toward the surface with highest values of 82–88 μmol L-1 determined at 5 m depth. This indicates that DOC concentration at the immediate sea surface may clearly exceed DOC values typically recorded at 10 or 20 m depth by CTD sampling.
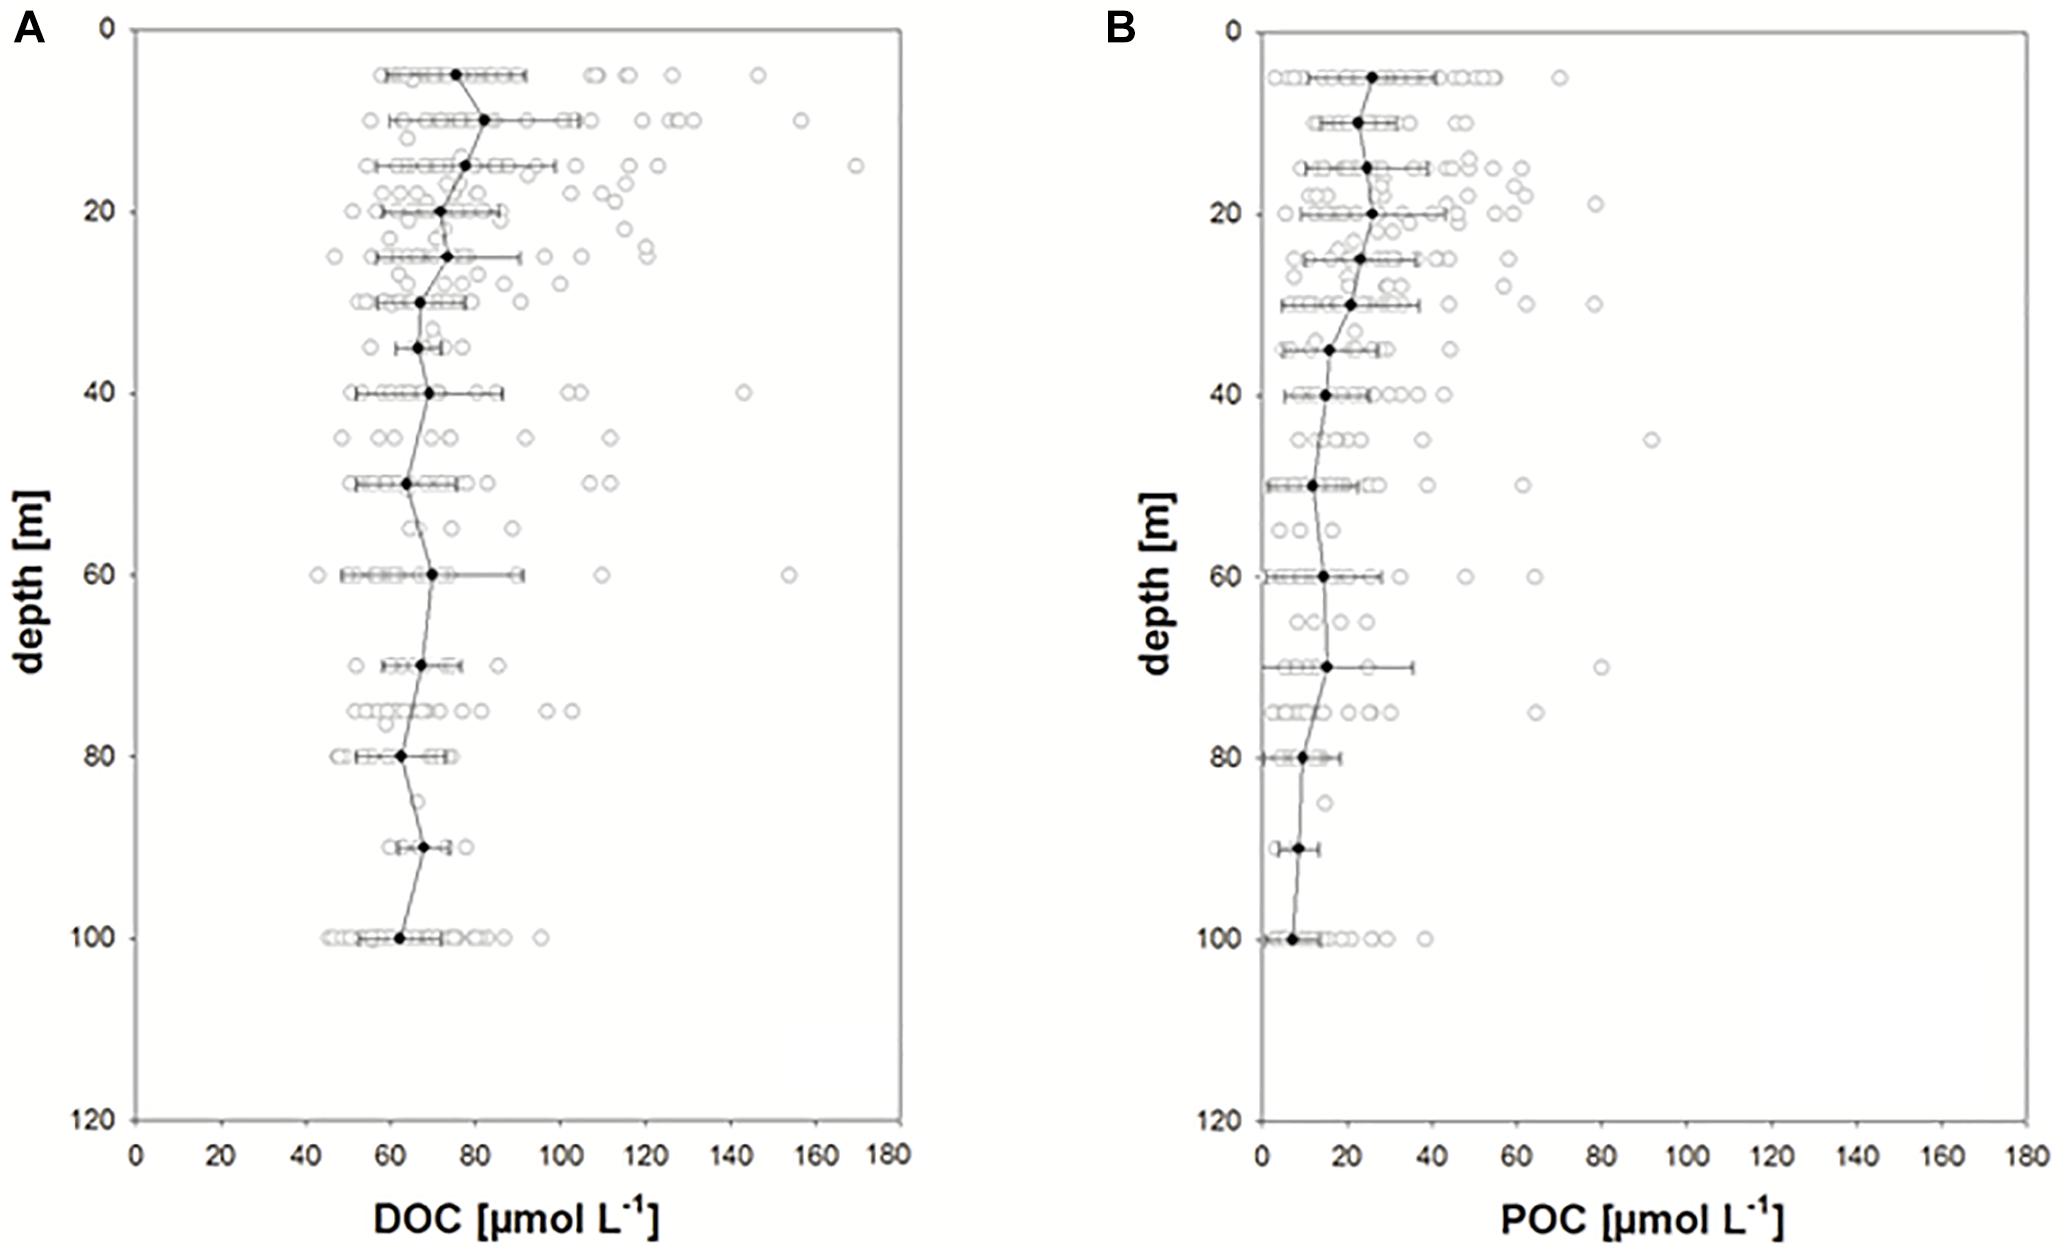
Figure 4. (A,B) Depth distribution of DOC and POC concentrations in the HAUSGARTEN area including all data obtained from 2009 to 2017. Solid symbols: mean values ± 1SD calculated for rounded up depths.
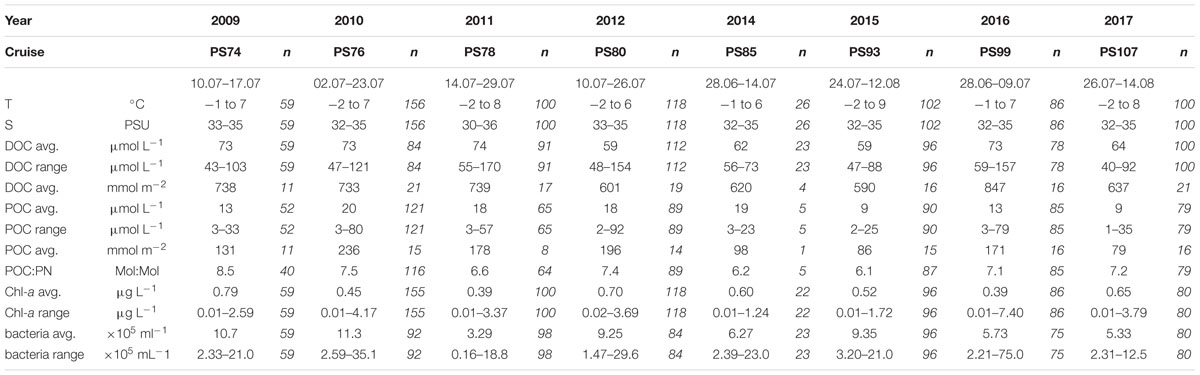
Table 1. Range of variables determined in the upper 100 m of the LTR HAUSGARTEN in summer (June–August) from 2009–2017. Average values are given as median values, numbers of observations = n.
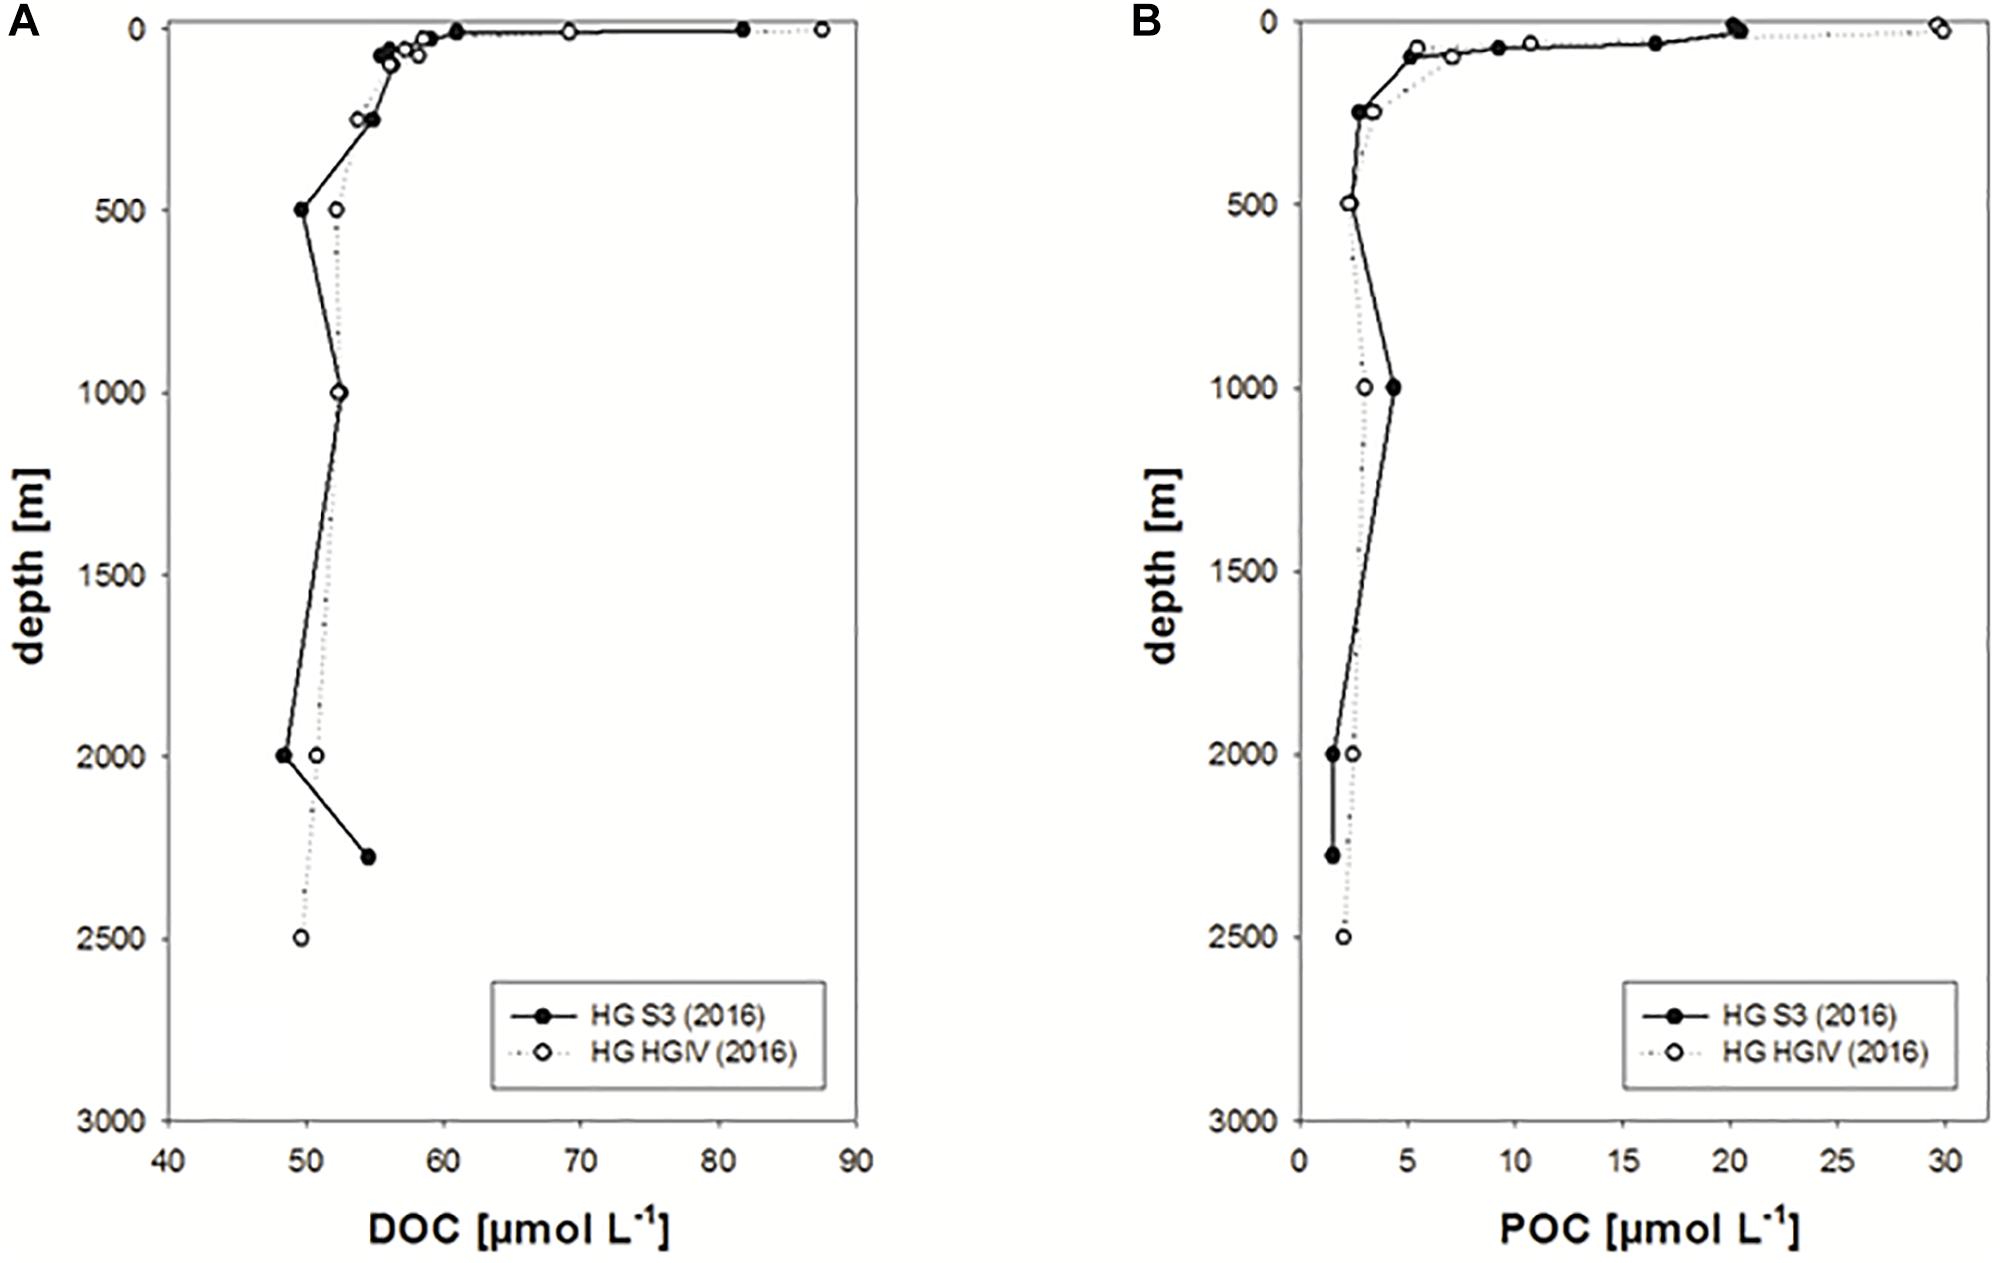
Figure 5. (A,B) Deep profiles of DOC and POC concentrations observed in 2016 at the HAUSGARTEN stations S3 and HGIV.
There was a pronounced inter-annual variability of DOC concentration with annual average values ranging from 59 ± 8 μmol L-1 in 2015 to 73 ± 24 μmol L-1 in 2016 (Figure 6A). No clear trend in DOC concentration was observed over the study period. However, differences in DOC concentration between years were statistically significant (p < 0.001), indicating a major control of DOC concentration by biological and/or physical factors in the surface ocean. The year 2016 stood out as the year of highest median DOC concentration of 73 μmol L-1 and highest data variability (n = 86) with ∼25% of all data >100 μmol L-1. In contrast, only little variability was observed in 2014 with DOC concentrations ranging from 56 to 73 μmol L-1. However, the number of observations in 2014 of n = 27 was also lowest. Some years were not significantly different from each other, as revealed by multiple pairwise comparison of individual years. Specifically, the 2 years with highest DOC concentrations (2010, 2016) were not significantly different from each other as were the years with lowest DOC concentrations (2012, 2014, 2015, 2017). Annual minimum DOC concentration ranged between 40 μmol L-1 in 2017 and 59 μmol L-1 in 2016, not higher than deep DOC concentrations at 2500 m. This indicates a minimum DOC background concentration in order of 40 μmol L-1.
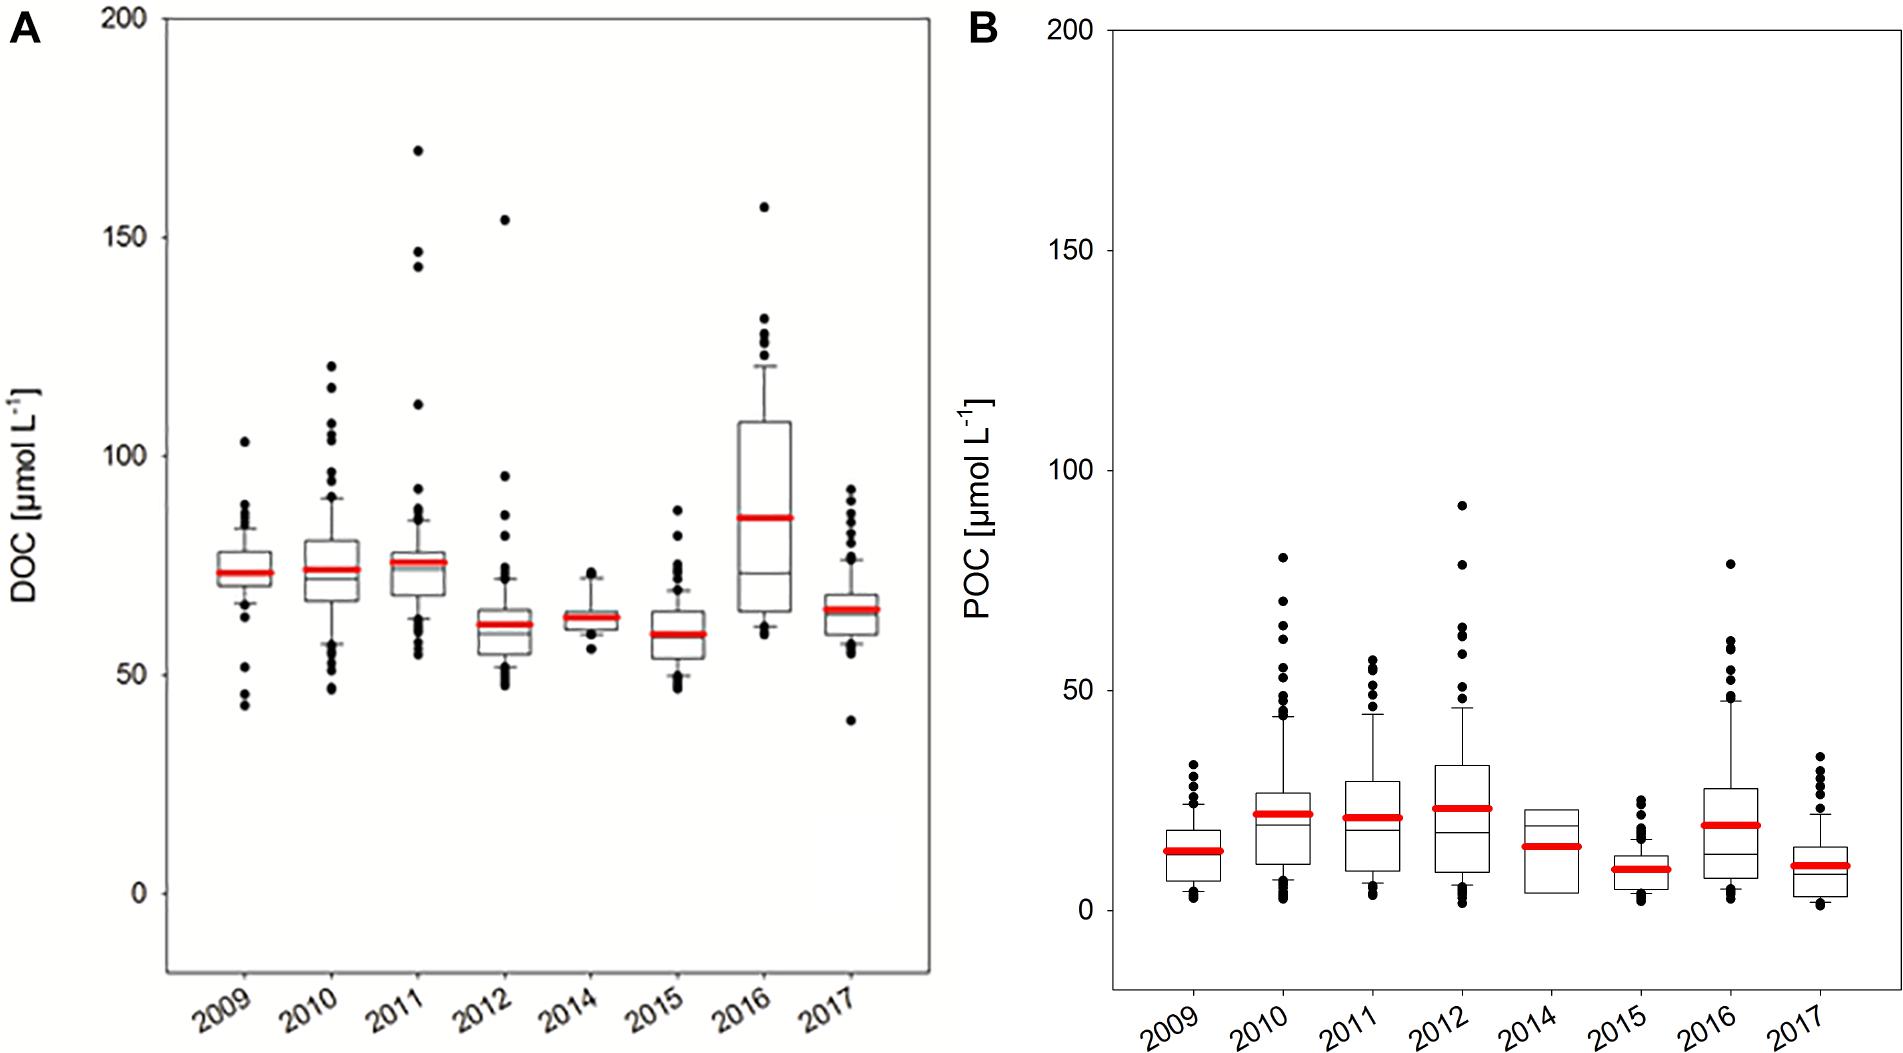
Figure 6. (A,B) Inter-annual variability of DOC and POC concentration in the HAUSGARTEN area. Box plots show 25–75th percentile of data within the box, error bars 10th and 90th percentile, outlying data as well as the mean (red line) and median values.
Particulate Organic Carbon (POC)
POC concentration in the upper 100 m ranged between 1 and 92 μmol L-1 (average: 13 ± 14 μmol L-1, n = 585) (Figure 4B and Table 1) and was on average equivalent to 18 ± 23% of DOC concentration (range 1–190%). Like for DOC, concentration of POC decreased with depth, but showed a more pronounced decrease below 30 m, where average POC concentration decreased from ∼20 μmol L-1 to values <10 μmol L-1. Deep profiles recorded in 2016 also showed little variation for POC concentration below 250 m with an average concentration of 2.59 ± 0.86 μmol L-1 (Figure 5B). POC concentrations were highest in surface waters yielding 20–30 μmol L-1 at 10–20 m depth. Overall, when compared to the Redfield C:N ratio of 6.6, organic particles were only slightly enriched in carbon yielding a mean of 7.94 ± 4.18 (n = 546). This indicates that particles contained relatively fresh organic matter.
Substantial inter-annual variability was observed for POC concentration also, with median values ranging from 9 ± 8 μmol L-1 in 2017 to 20 ± 10 μmol L-1 in 2010 (Figure 6B and Table 1). Thus, highest average concentrations for POC did not coincide with those of DOC, although similar patterns were observed, like higher concentrations in 2016 compared to the previous and following year. Minimum concentration of POC during each sampling campaign ranged between 1 and 3 μmol L-1, indicating a very small pool of refractory POC, if any.
POC includes algal biomass that is often quantified by the concentration of Chl-a. Chl-a concentration in the HAUSGARTEN area ranged between the detection limit and 7.40 μg L-1, with an overall average of 0.51 ± 0.97 μg L-1 (Table 1). High average Chl-a concentration was observed in 2009 and 2012. Absolute highest Chl-a concentrations were recorded at discrete stations in 2016, although average Chl-a concentration in that year was only 0.39 μg L-1, and therefore, below average of the observational period. In general, 2016 was the year of highest variability of Chl-a concentration as also observed for DOC concentration.
Water-Column Integrated Pools of Organic Carbon
Integrated organic carbon concentrations in particulate and dissolved pools (0–100 m) accentuated the strong inter-annual variability of POC and DOC concentrations (Figures 7A,C and Table 1). Variability in water-column integrated data during the sampling campaigns, as indicated by total box height as well as by error bars, reflects the spatial heterogeneity of the systems. Accordingly, highest spatial heterogeneity was observed in the years 2010–2012 for both DOC and POC. In general, POC comprised between 6 and 49% of total organic carbon (TOC) (Figure 7D). While stocks of DOC and Chl-a showed no significant trend over time (Figures 7A,B), the amount of POC in the upper water column significantly decreased over the years (r = -0.41, n = 105, p < 0.0001) (Figure 7C), resulting in a significant decrease of [POC]:[Chl-a] ratios (r = -0.30, n = 102, p < 0.001; data not shown). In particular, depth-integrated POC values were highest during 2010–2012 and lowest in 2015 and in 2017. Along with the decrease in POC, a significant decrease of [POC]:[TOC] over time was observed (r = -0.42, n = 98, p < 0.0001) as well as a lower variability of [POC]:[TOC] in the years 2015–2017 (Figure 7D). This indicates a decreasing contribution of particulate carbon to total carbon over the observational period. Although depth-integrated values of Chl-a did not show a significant trend over time themselves, they were significantly related to POC (r = 0.52, n = 125, p < 0.001), indicating that changes in algal biomass were involved in the decline of POC over time.
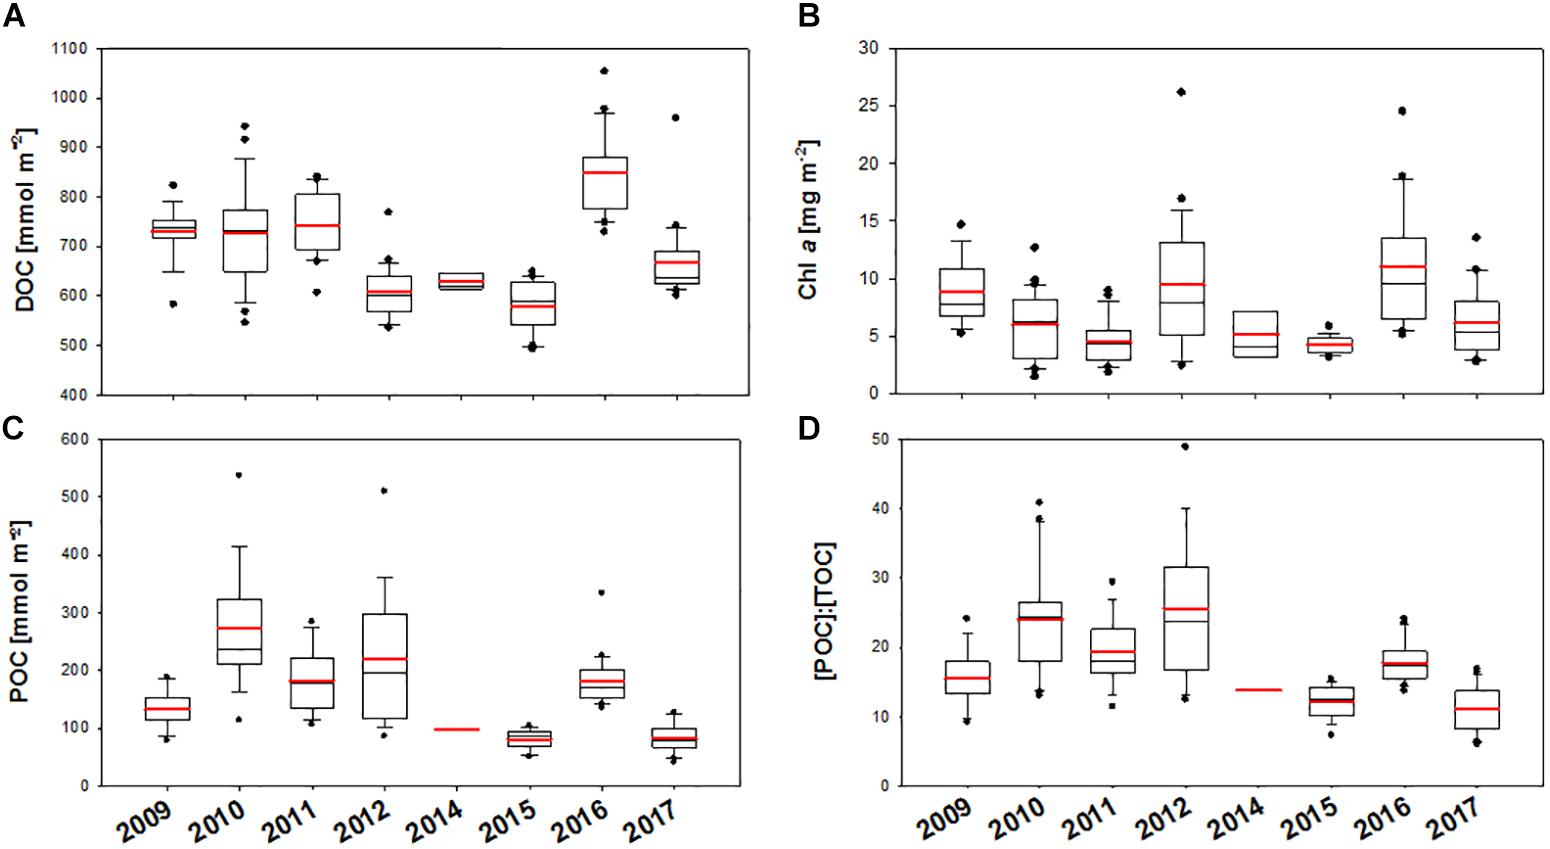
Figure 7. (A–D) Inter-annual variability of integrated (0–100 m) DOC (A), Chl a (B), and POC (C) concentration as well as the percentage of POC in TOC (D) in the HAUSGARTEN area from 2009–2017. Box plots show 25–75th percentile of data within the box, error bars 10th and 90th percentile, outlying data as well as the mean (red line) and median values.
Potential Controls of POC and DOC in the Fram Strait
Although all field campaigns in the eastern Fram Strait were carried out in summer, the timing of sampling varied slightly over the 8 years of observation, namely between the end of June and mid of August (Figure 2, Supplementary Figure S1, and Supplementary Table S1). As seen from satellite data, phytoplankton biomass clearly varies within summer, with phytoplankton blooms being more likely in June (Figures 2, 3). We therefore examined whether intra-seasonal variations in the time of sampling affected the amounts of DOC, POC and Chl-a in the upper water column (Figures 8A–D). Indeed, the day of sampling (Julian Day, JD) significantly correlated with the amount of DOC (r = -0.44, p < 0.001; n = 126) and became even more pronounced with the amount of POC (r = -0.55, n = 105, p < 0.001) in the water column, partly explaining the overall decline in [POC]:[TOC] (r = -0.44, n = 98, p < 0.001). High variability in DOC and POC concentrations, observed in 2010 and in 2012, could not be explained by day of sampling. In contrast to organic carbon, no significant correlation between time of sampling and Chl-a concentration was observed. However, variability in Chl-a concentration was highest between JD 180 and JD 210, reflecting higher spatial heterogeneity in phytoplankton distribution during June and July as also seen in the satellite data (Figure 3).
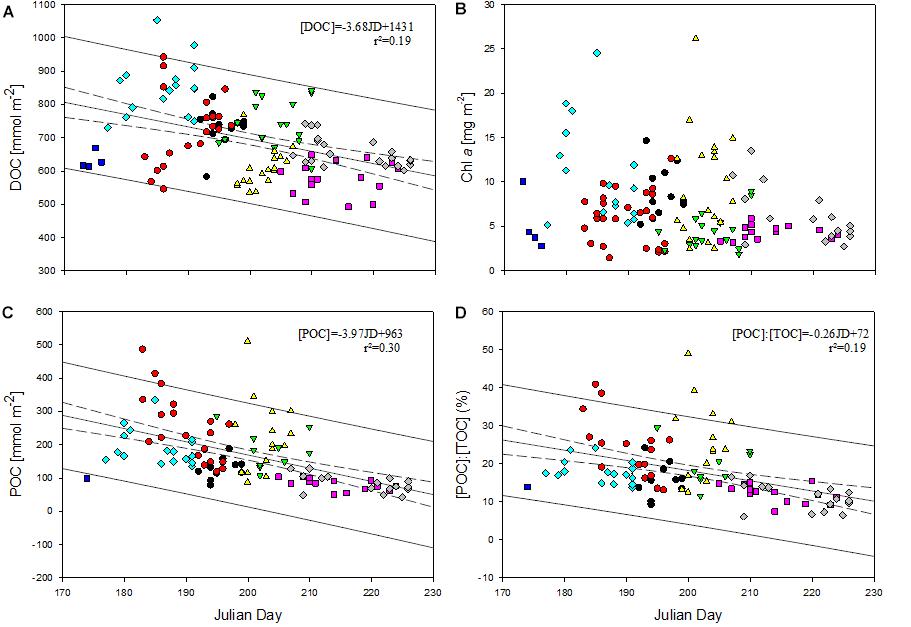
Figure 8. (A–D) Relationship between integrated DOC (A), Chl-a (B), and POC (C) concentration and the Julian day (JD) of sampling as well as the ratio of POC to TOC (D). Color code of years: black (2009), red (2010), green (2011), yellow (2012), blue (2014), pink (2015), turquoise (2016), gray (2017). Dashed lines represent the 95% confidence interval of the regression, solid lines the 95% confidence interval of the data population.
In addition to temporal variability, substantial spatial variability was observed for DOC and POC concentration and illustrated for one latitudinal and one longitudinal section located between 78.5–80°N and 4–6°E and between 78.8–79.2°N and 2–12°E (Figure 1), considering data from all years. In general, spatial patterns of low salinity and low temperature coincided with high DOC concentration, not only in the near surface waters (<20 m) but also at larger depth. Along the latitudinal transect, lower salinity in the near surface waters coincided with colder temperature west of 5°E and with higher DOC concentrations at depth >20 m (Figure 9). Along the longitudinal transect this co-occurrence of low temperature, low salinity and high DOC concentration was most pronounced between 79° and 79.5°N (Figure 10). Overall DOC concentration was significantly negatively related to temperature (r = -0.21, n = 670, p < 0.001) and to salinity (r = -0.27, n = 474, p < 0.001). No correlations with temperature or salinity were observed for POC concentration. In general, POC concentration was highly correlated with Chl-a concentration (r = 0.70, n = 597, p < 0.0001), while correlations between DOC and Chl-a concentrations were less pronounced, albeit still significant (r = 0.23, n = 620, p < 0.001).
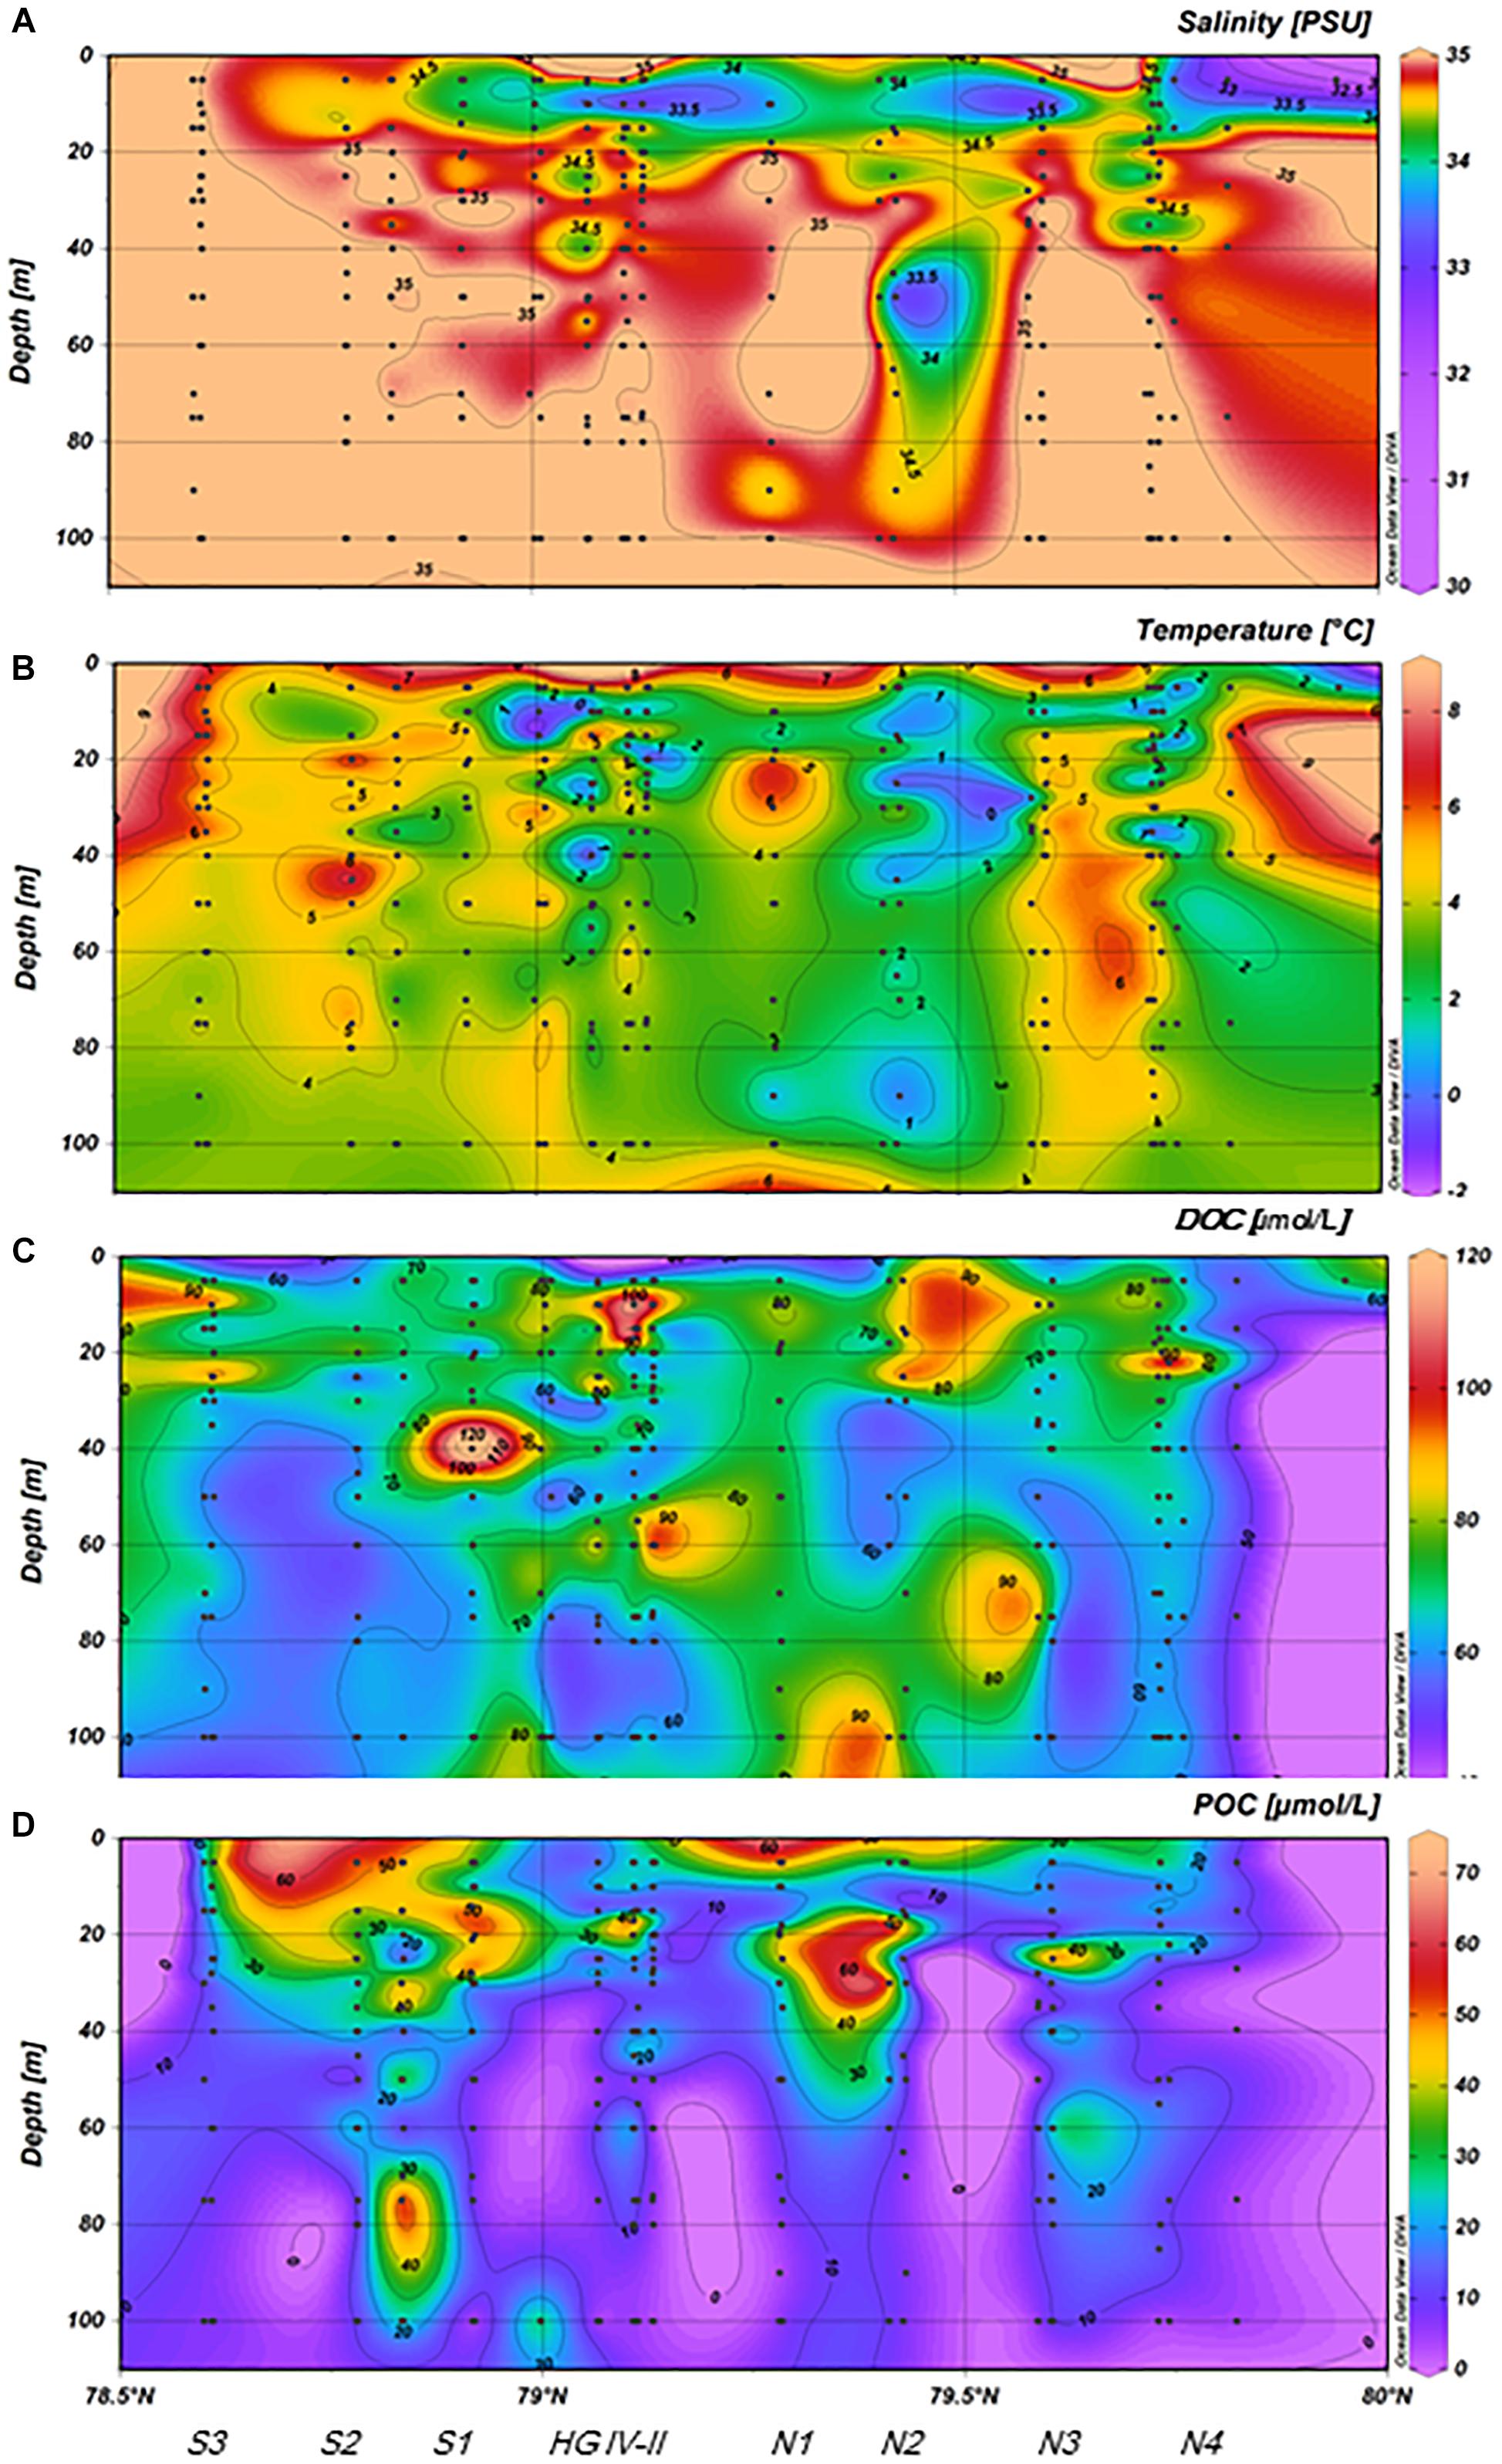
Figure 9. (A–D) Spatial variability of salinity, temperature, DOC, and POC concentration along the ∼79°N latitude during 2009–2017 (merged data).
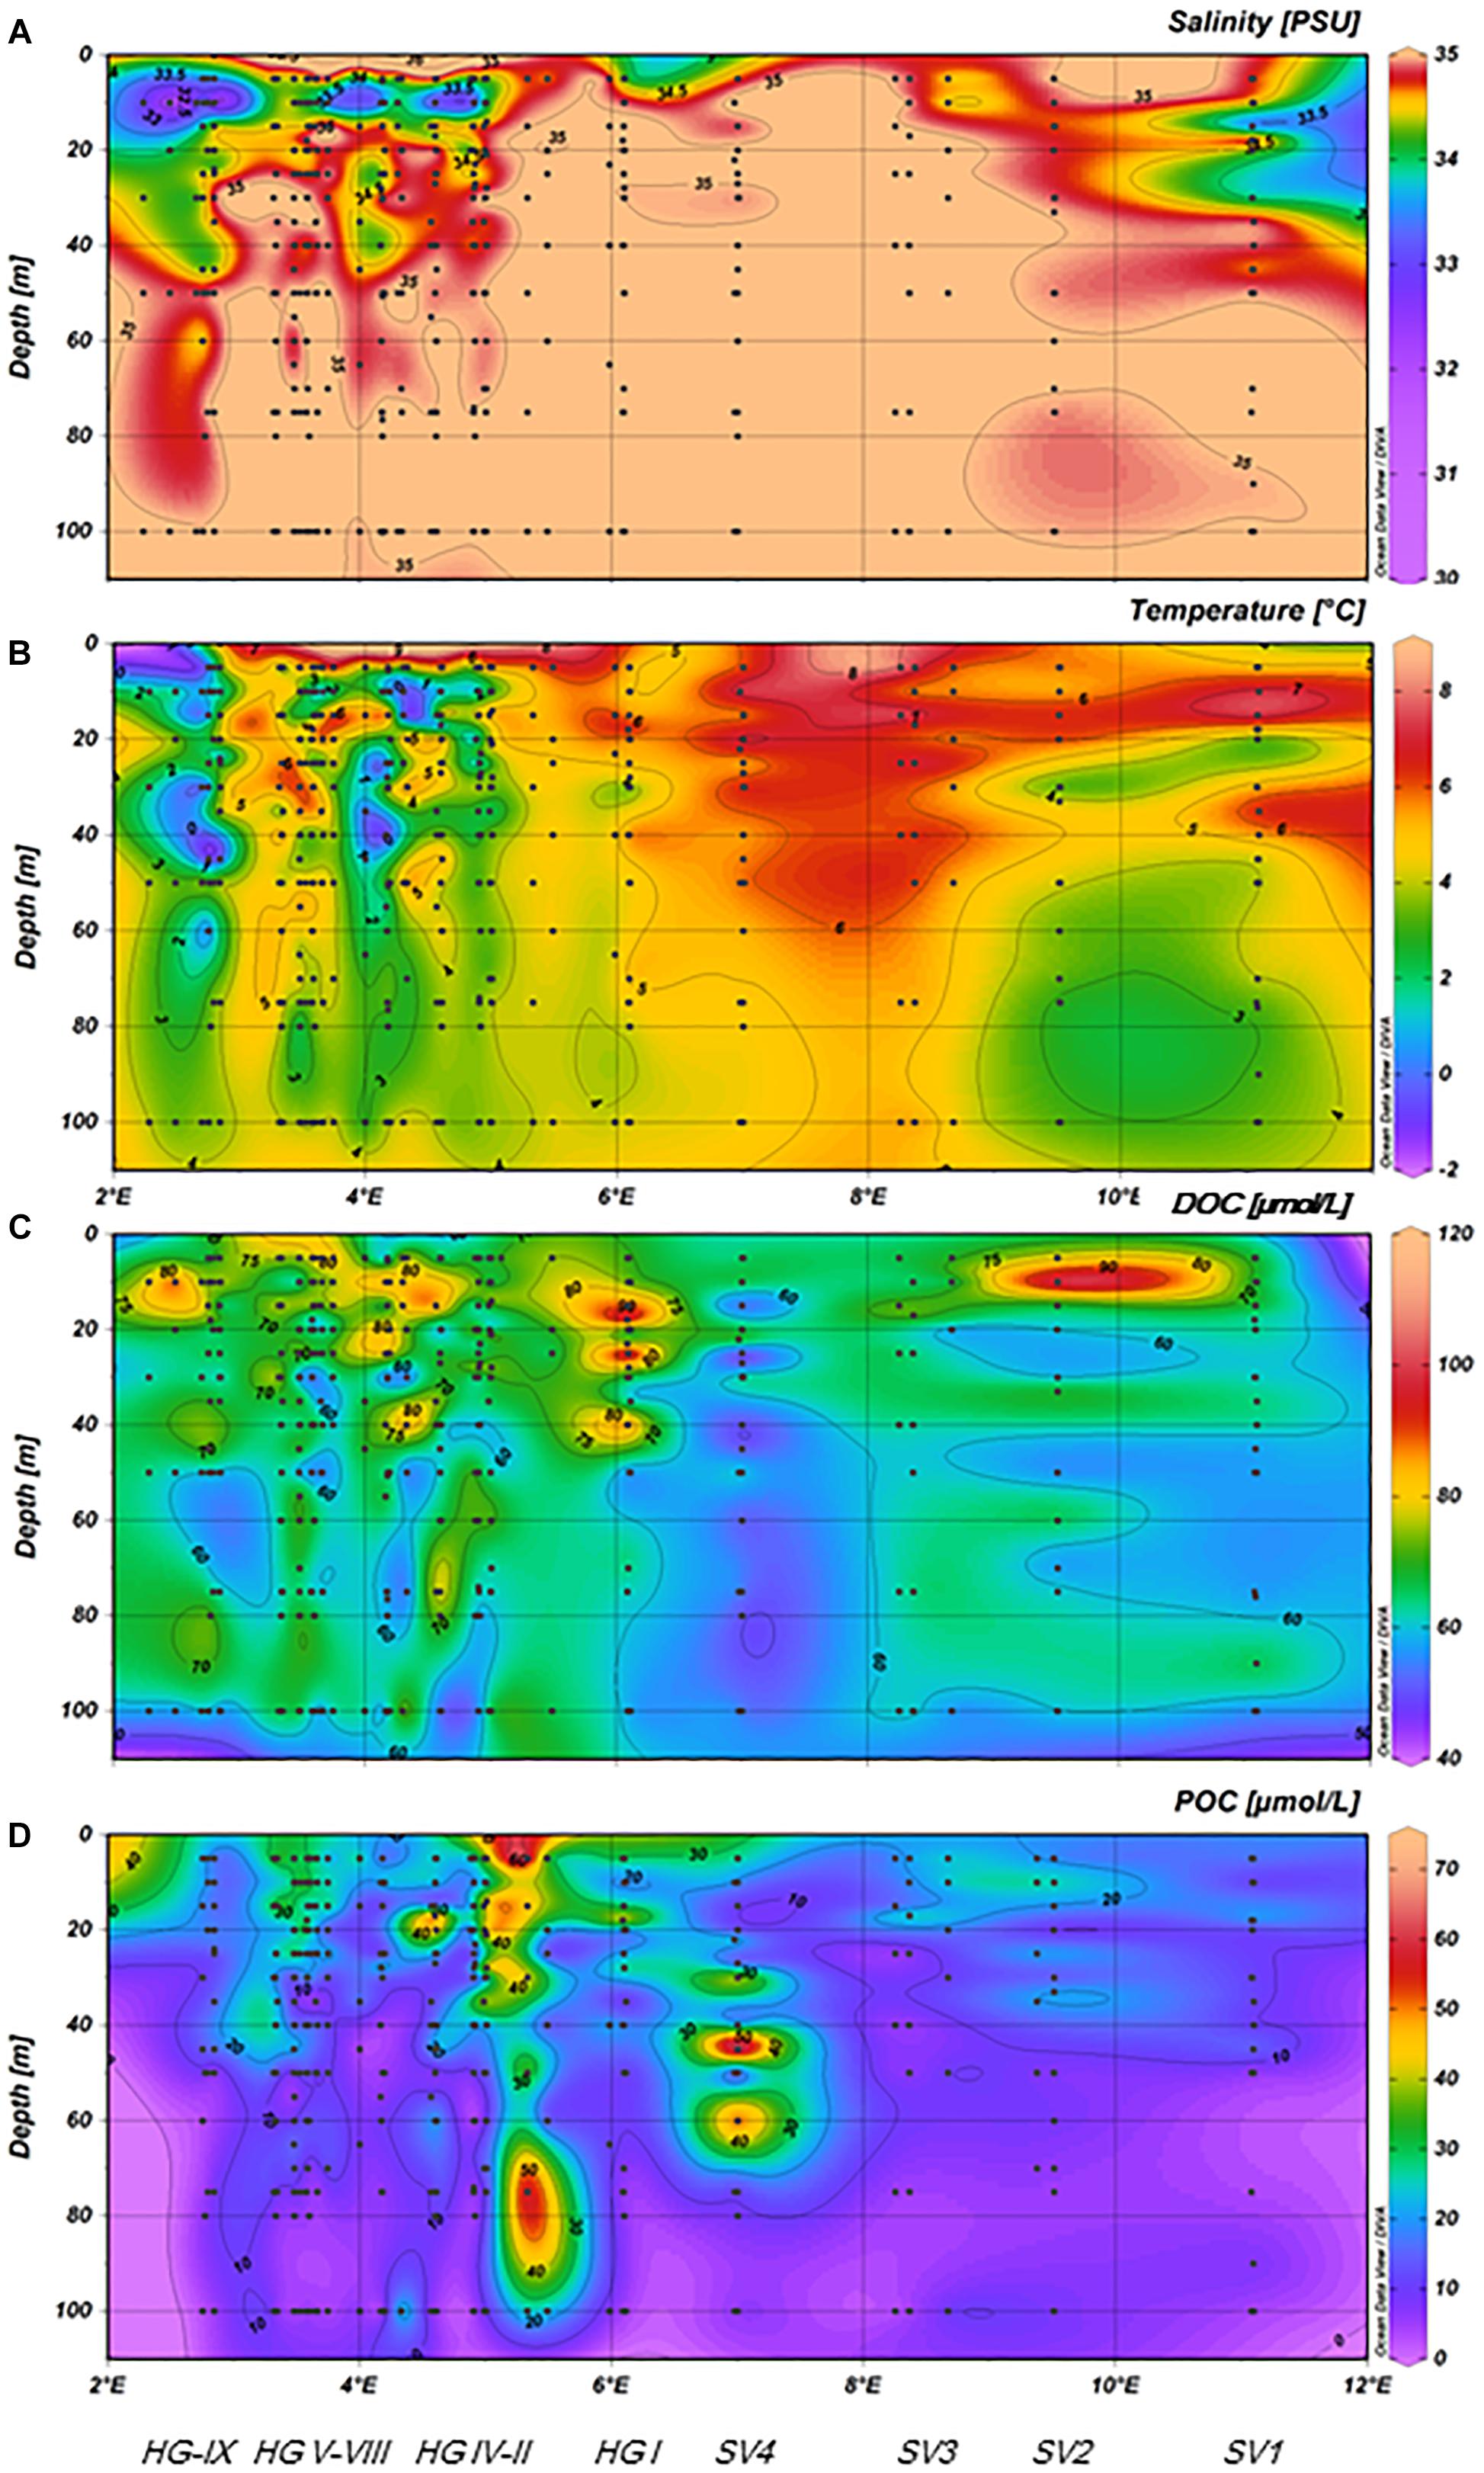
Figure 10. (A–D) Spatial variability of salinity, temperature, DOC, and POC concentration along the ∼5°E longitude during 2009–2017 (merged data).
Although DOC is the main substrate for heterotrophic bacteria, which overall varied between 3.3 × 10⁵ cells mL-1 and 11.3 × 10⁵ cells mL-1 (Table 1), no significant correlation was observed between bacterial abundance and DOC concentration over the total observational period. Instead, high DOC concentrations coincided with low bacterial abundance in waters <4°C, whereas, higher bacterial abundance was observed mainly in seawater >4°C regardless of DOC concentrations, indicating that water mass origin and temperature strongly impacted the coupling between DOC and bacteria in the Fram Strait (Figure 11). Thereby, DOC concentration and bacterial abundance at <4°C and >4°C differed significantly (Mann-Whitney Rank Sum Test, pDOC < 0.001, pbacteria < 0.0001). No significant correlations between DOC and bacterial abundance were observed within water masses of temperatures <4°C or >4°C either. Instead, bacterial abundance was significantly correlated with Chl-a and POC concentration in waters >4°C (r = 0.23, n = 302, p < 0.001).
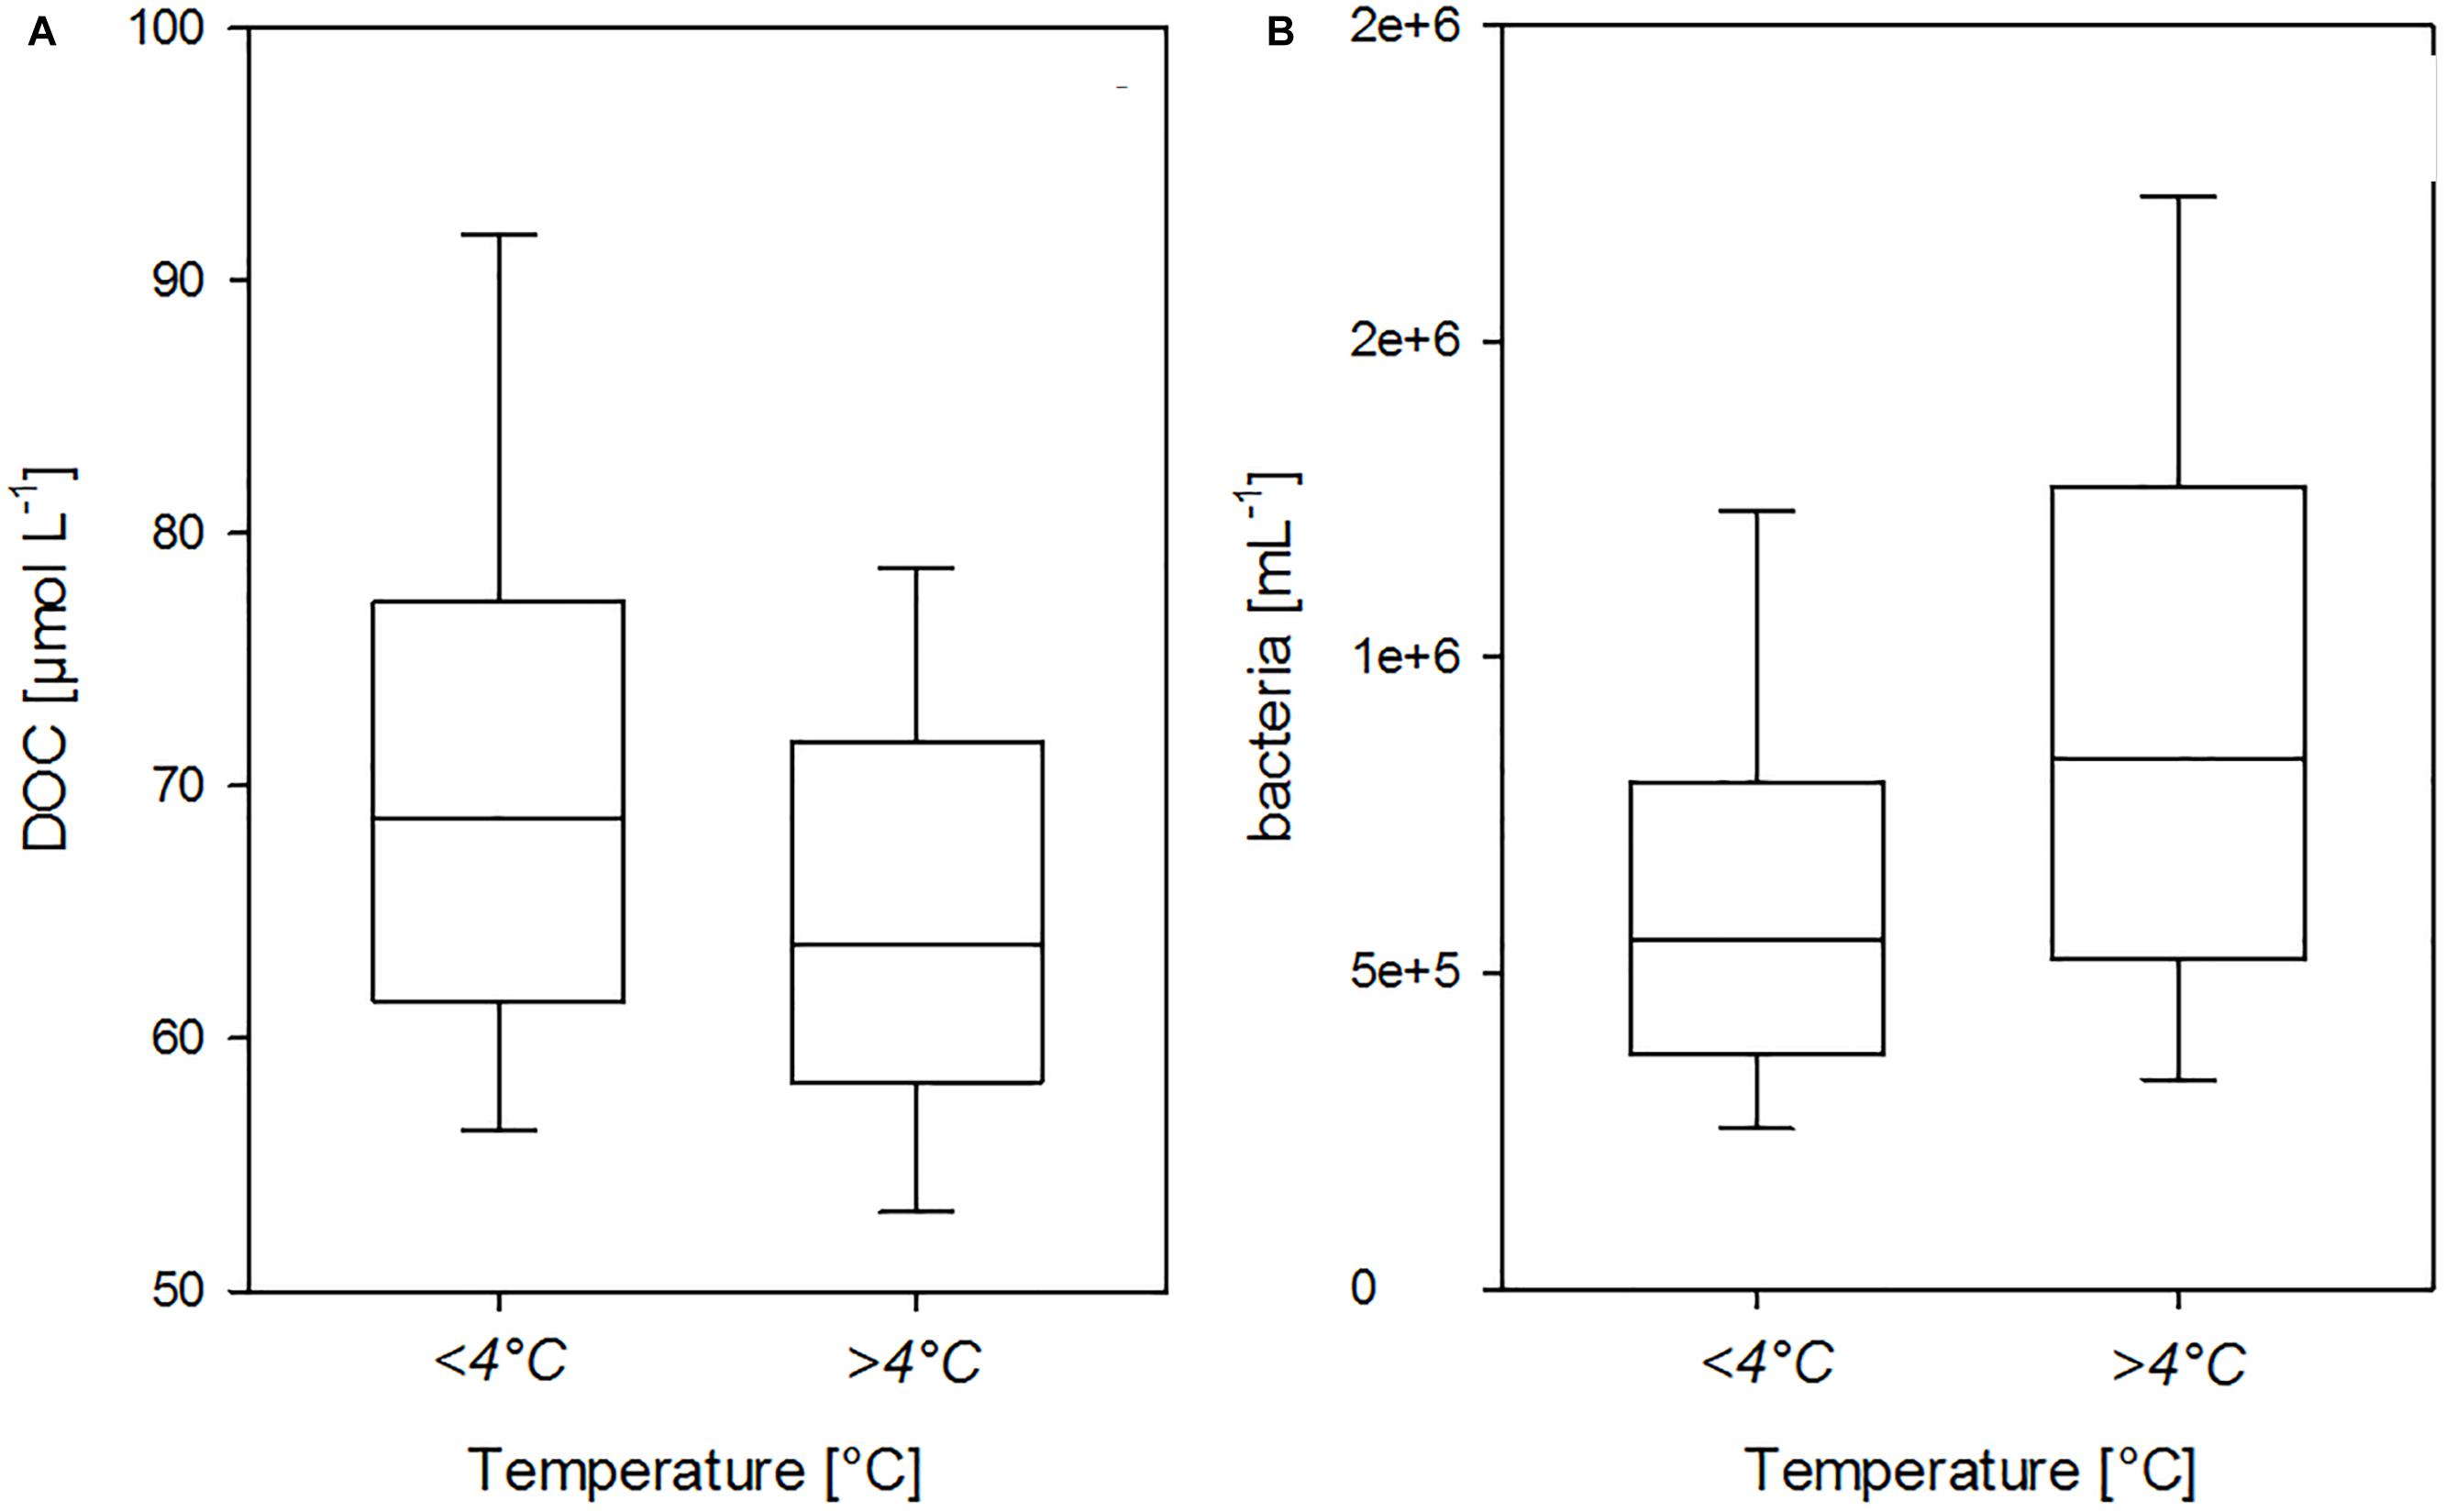
Figure 11. Dependency of DOC concentration (A) and bacterial abundance on (B) seawater temperature in the upper 100 m water column of the HAUSGARTEN area. Box plots show 25–75th percentile of data within the box, error bars 10th and 90th percentile, and median values; DOC: n = 296 for <4°C, n = 322 for >4°C; bacteria: n = 254 for <4°C, n = 272 for >4°C.
Discussion
Biological formation of organic carbon is the initial step in a series of processes that controls CO2 storage in the ocean, herewith the rate of exchange of CO2 between the ocean and the atmosphere and may ultimately affect global climate. The Arctic Ocean has been assessed as a net sink of CO2 at present day (Bates and Mathis, 2009), but predicting future carbon cycling requires a good understanding of the processes involved and their responses to environmental change, as well as profound knowledge of temporal variability in carbon pool size.
Our study focused on surface ocean organic carbon pools, i.e., DOC and POC, during the summer season in the Fram Strait and demonstrated a substantial spatial and temporal variability. Main factors identified to drive variability in the amount of DOC in this study were temperature and salinity, as colder and less saline Polar Waters entering the Fram Strait from the North via the East Greenland Current, have higher DOC concentration than Atlantic water masses carried by the West Spitsbergen Current (Amon et al., 2003). Our findings are thus in good accordance with previous observations in the Fram Strait (OpsahlL and Benner, 1999; Amon et al., 2003). Higher DOC concentrations in Polar Waters are due to an enhanced load of terrigenous compounds, mainly humic substances that enter the central Arctic Ocean through large river systems, e.g., Ob, Lena, Kolyma, Yukon, and Mackenzie (Kattner et al., 1999; Anderson and Amon, 2015). Humic substances are less bioavailable than autochthonous DOC mainly derived from primary production. The contribution of terrigenous substances in the DOC pool of the Fram Strait by Polar Waters may explain why we found no direct relationship between DOC concentration and bacterial abundance in our dataset. Nevertheless, the amount of DOC in the upper 100 m was significantly correlated to the day of sampling and presumably declines over the summer season, with a slope similar to that of POC. This and the observed correlation between DOC and Chl-a concentration indicate that, in addition to the terrigenous input, DOC concentration in the Fram Strait is controlled by the pelagic ecosystem. Experimental studies suggest that bacteria can utilize DOM of Polar Waters, particularly when temperature rises (Bussmann, 1999; Piontek et al., 2015). Thus, mixing of Polar Waters with warmer Atlantic waters in the Fram Strait may enhance bacterial consumption of DOC, further stimulated by the production of fresh DOC over summer. However, a more targeted molecular analysis identifying the autochthonus and labile DOC fraction would be required, in order to understand microbial cycling of the DOC pool.
POC concentration in the upper water column of the Fram Strait was clearly related to plankton, primarily phytoplankton growth, partially explaining spatial and temporal variability. However, in contrast to Chl-a, our data revealed a decline in the amount of POC over the years 2009–2017. Since the amount of POC also declined with the JD of sampling, we cannot separate intra-seasonal from inter-annual variability. The observed decline of POC concentration over the years 2009–2017 may simply reflect changes in the ecosystem over summer, such as enhanced growth limitation of phytoplankton by inorganic nutrients, changes in phytoplankton community composition, or in heterotrophic feeding activity. In contrast to POC and DOC, no clear decline in depth-integrated Chl-a concentration was observed, neither for the summer season nor for the total period. One explanation may be a seasonal shift to species with a lower [POC]:[Chl-a] content, or a physiological acclimation. i.e., photoadaptation, of cells responding to decreasing light intensity, e.g., after solstice on June 21 or inter-annual variability in radiation during summer, with increasing Chl-a production (Morgan and Kalff, 1979). Yet, we cannot rule out that the observed POC decline occurred independently of intra-seasonal variation, and was induced by climate changes. Seasonal progression of the pelagic ecosystem over summer partly resembles effects expected for warming scenarios. A recent model study investigated a warming event in the Fram Strait, with a resulting shift from diatoms to flagellates, and indicated an ecosystem change toward an increase in the microzooplankton abundance, and thus a switching of other zooplankton feeding from herbivory to omnivory, detritivory and coprophagy (Vernet et al., 2017). Rising temperature has been suggested to shift carbon pathways and the partitioning from particulate to dissolved pools (Wohlers et al., 2009; Kim et al., 2011; Vernet et al., 2017). Also, a decrease in cell size of phytoplankton communities has been attributed to warming (Sommer and Lengfellner, 2008) and may affect POC concentration more than Chl-a concentration (Geider, 1987; Wohlers-Zöllner et al., 2012). In addition, an earlier on-set of phytoplankton growth due to the changing ice scape may result in a temporal shift of phytoplankton biomass peaks already under the ice and lead to earlier peaks of the associate POC concentration (Assmy et al., 2017). It is indeed likely that the observed changes in the POC pool reflect climate induced changes in the Fram Strait that have been reported for the phytoplankton community composition during ice-free summer months, i.e., the shift from diatoms to flagellates (Nöthig et al., 2015) and a stronger activation of the microbial loop, leading to higher heterotrophy but surprisingly not to a reduced carbon export flux (Vernet et al., 2017).
Clearly our study underlines the need for a better resolution of seasonal changes in Arctic ecosystems as scientific basis to identify inter-annual or even decadal variability. New observational approaches and instruments are needed to cover the annual cycle with much higher temporal resolution, in order to capture the onset, peak and fate of biological production. A coupling of high frequency biological, chemical and physical observations will help to disentangle controls and consequences of environmental change, especially in remote and rapidly changing areas such as the Arctic, where data coverage has been impaired by accessibility. For organic matter, measurements of the optically absorbing and fluorescing fraction of DOM, i.e., colored and fluorescent dissolved organic matter (CDOM and FDOM), have demonstrated a strong correlation with DOC concentration for the Arctic Ocean (e.g., Stedmon et al., 2011; Goncalves-Araujo et al., 2015), and to give proxies for water masses in the Greenland Sea (Stedmon et al., 2015; Goncalves-Araujo et al., 2016). The further spectral resolution development of FDOM and also backscattering sensors to be mounted to autonomous platforms in the Arctic Ocean can help to resolve the variability of DOC and POC on larger temporal and spatial scale and may give insight into autochthonus sources of DOM (Romera-Castillo et al., 2011; Loginova et al., 2016). However, sensor measurements still need to be evaluated regularly and carefully, with discrete measurements of parameters directly assessing the different components of the carbon pool. This requires discrete ship-based observations, such as those currently undertaken by national and international efforts [e.g., FRAM (Soltwedel et al., 2016), Distributed Biological Observatory (DBO; Moore and Grebmeier, 2018), Changing Arctic Ocean (CAO)2, and the MOSAiC campaign starting in fall 2019]3. In order to understand the impact of a changing physical environment on ecosystem dynamics and carbon cycling, we urgently need to close the knowledge and data gap on seasonal variability in the Arctic.
Author Contributions
All authors listed have made a substantial, direct and intellectual contribution to the work, and approved it for publication.
Funding
This work has been supported by the Helmholtz Association. Results were obtained during PS cruises PS ARK-XXIV/2 (PS74), ARK-XXV/2 (PS76), ARK-XXVI/2 (PS78), ARK-XXVII/2 (PS80), PS85, PS93.2, PS99, and PS107, respectively. AB contribution is partly supported by the Transregional Collaborative Research Center (TR 172) “ArctiC Amplification: Climate Relevant Atmospheric and SurfaCe Processes, and Feedback Mechanisms (AC)3” via the subproject C03. This study is a contribution to the project MicroARC (03F0802A), part of the Changing Arctic Ocean program, jointly funded by the UKRI Natural Environment Research Council (NERC) and the German Federal Ministry of Education and Research (BMBF).
Conflict of Interest Statement
The authors declare that the research was conducted in the absence of any commercial or financial relationships that could be construed as a potential conflict of interest.
Acknowledgments
We thank the captain and crew of the RV Polarstern for help and technical support during the cruises. We are also grateful to the many people helping with sampling on board or with sample analysis in the lab in particular Mascha Wurst, Nicole Händel, Luisa Galgani, Jon Roa, Carolin Mages, Kathrin Busch, Carolina Cisternas-Novoa, Frederic LeMoigne, Ruth Flerus, Tania Klüver, Sandra Golde, Christiane Lorenzen, Sandra Murawski, Nadine Knüppel, Liz Bonk, Maria Winkler, Nadja Sandhop and several student workers.
Supplementary Material
The Supplementary Material for this article can be found online at: https://www.frontiersin.org/articles/10.3389/fmars.2019.00187/full#supplementary-material
Footnotes
- ^ http://marine.copernicus.eu
- ^ www.changing-arctic-ocean.ac.uk
- ^ https://www.awi.de/en/focus/mosaic-expedition.html
References
ACIA (2014). Impacts of a Warming Arctic: Arctic Climate Assessment. Cambridge: Cambridge University Press.
Amon, R. M. W., and Benner, R. (2003). Combined neutral sugars as indicators of the diagenetic state of dissolved organic matter in the Arctic Ocean. Deep Sea Res. Part 1 Oceanogr. Res. Pap. 50, 151–196. doi: 10.1016/S0967-0637(02)00130-9
Amon, R. M. W., Budeus, G., and Meon, B. (2003). Dissolved organic carbon distribution and origin in the Nordic seas: exchanges with the arctic ocean and the north atlantic. J. Geophys. Res. 108:3221. doi: 10.1029/2002JC001594
Anderson, L. G., and Amon, R. M. W. (2015). “DOM in the arctic ocean”, in Biogeochemistry of Marine Dissolved Organic Matter, 2nd edn, eds D. A. Hansell and C. A. Carlson (Amsterdam: Elsevier), 609–633.
Anderson, L. G., Olsson, K., and Skoog, A. (1994). “Distribution of dissolved inorganic and organic carbon in the Eurasian basin of the Arctic Ocean,” in The Polar Oceans and Their Role in Shaping the Global Environment, eds O. Johannessen, R. Muench, and J. Overland (Washington, DC: AGU), 255–262.
Arrigo, K. R., Perovich, D. K., Pickart, R. S., Brown, Z. W., van Dijken, G. L., Lowry, K. E., et al. (2014). Phytoplankton blooms beneath the sea ice in the Chukchi sea. Deep Sea Res. Part 2 Top. Stud. Oceanogr. 105, 1–16. doi: 10.1126/science.1215065
Arrigo, K. R., and Van Dijken, G. L. (2015). Continued increases in Arctic Ocean primary production. Prog. Oceanogr. 136, 60–70. doi: 10.1016/j.pocean.2015.05.002
Assmy, P., Fernández-Méndez, M., Duarte, P., Meyer, A., Randelhoff, A., Mundy, C. J., et al. (2017). Leads in Arctic pack ice enable early phytoplankton blooms below snow-covered sea ice. Sci. Rep. 7:40850. doi: 10.1038/srep40850
Azam, F., Fenchel, T., Field, J. G., Gray, J. S., Meyerreil, L. A., and Thingstad, F. (1983). The ecological role of water-column microbes in the sea. Mar. Ecol. Prog. Ser. 10, 257–263. doi: 10.3354/meps010257
Azam, F., and Hodson, R. E. (1977). Size distribution and activity of marine microheterotrophs. Limnol. Oceanogr. 22, 492–501. doi: 10.4319/lo.1977.22.3.0492
Bates, N. R., and Mathis, J. T. (2009). The Arctic Ocean marine carbon cycle: evaluation of air-sea CO2 exchanges, ocean acidification impacts and potential feedbacks. Biogeosciences 6, 2433–2459. doi: 10.5194/bg-6-2433-2009
Benner, R. (2002). “Chemical composition and reactivity,” in Biogeochemistry of Marine Dissolved Organic Matter, eds D. A. Hansell and C. A. Carlson (San Diego, CA: Academic Press), 59–90. doi: 10.1016/B978-012323841-2/50005-1
Biddanda, B., and Benner, R. (1997). Carbon, nitrogen, and carbohydrate fluxes during the production of particulate and dissolved organic matter by marine phytoplankton. Limnol. Oceanogr. 42, 506–518. doi: 10.4319/lo.1997.42.3.0506
Boetius, A., Albrecht, S., Bakker, K., Bienhold, C., Felden, J., Fernández-Méndez, M., et al. (2013). Export of algal biomass from the melting Arctic sea ice. Science 339, 1430–1432. doi: 10.1126/science.1231346
Bussmann, I. (1999). Bacterial utilization of humic substances from the Arctic Ocean. Aquat. Microb. Ecol. 9, 37–45. doi: 10.3354/ame019037
Bussmann, I., and Kattner, G. (2000). Distribution of dissolved organic carbon in the central Arctic Ocean: the influence of physical and biological properties. J. Mar. Syst. 27, 209–219. doi: 10.1016/S0924-7963(00)00068-3
Cai, P., Rutgers van der Loeff, M., Stimac, I., Nöthig, E. M., Lepore, K., and Moran, S. B. (2010). Low export flux of particulate organic carbon in the central Arctic Ocean as revealed by 234Th:238U disequilibrium. J. Geophys. Res. 115:C10037. doi: 10.1029/2009JC005595
Cherkasheva, A., Bracher, A., Melsheimer, C., Koberle, C., Gerdes, R., Nöthig, E.-M., et al. (2014). Influence of the physical environment on polar phyto- plankton blooms: a case study in the fram strait. J. Mar. Syst. 132, 196–207. doi: 10.1016/j.jmarsys.2013.11.008
Chylek, P., Folland, C. K., Lesins, G., Dubey, M. K., and Wang, M. (2009). Arctic air temperature change amplification and the Atlantic Multidecadal Oscillation. Geophys. Res. Lett. 36, L14801. doi: 10.1029/2009GL038777
Comiso, J. C. P., Parkinson, C. L., Gersten, R., and Stock, L. (2008). Accelerated decline in the arctic sea ice cover. Geophys. Res. Lett. 35:L01703. doi: 10.1029/2007GL031972
Edler, L. (1979). Recommendations on Methods for Marine Biological Studies in the Baltic Sea. Phytoplankton and Chlorophyll. Lund: University of Lund.
Engel, A., Borchard, C., Piontek, J., Schulz, K. G., Riebesell, U., and Bellerby, R. (2013). CO2 increases 14C-primary production in an Arctic plankton community. Biogeosciences 10, 1291–1308. doi: 10.5194/bg-10-1291-2013
Engel, A., and Galgani, L. (2016). The organic sea-surface microlayer in the upwelling region off the coast of Peru and potential implications for air–sea exchange processes. Biogeosciences 13, 989–1007. doi: 10.5194/bg-13-989-2016
Engel, A., Goldthwait, S., Passow, U., and Alldredge, A. (2002). Temporal decoupling of carbon and nitrogen dynamics in a mesocosm diatom bloom. Limnol. Oceanogr. 47, 753–761. doi: 10.4319/lo.2002.47.3.0753
Engel, A., Händel, N., Wohlers, J., Lunau, M., Grossart, H. P., Sommer, U., et al. (2011). Effects of sea surface warming on the production and composition of dissolved organic matter during phytoplankton blooms: results from a mesocosm study. J. Plankt. Res. 33, 357–372. doi: 10.1093/plankt/fbq122
Evans, C. A., O’Reily, J. E., and Thomas, J. P. (1987). A Handbook for Measurement of Chlorophyll a and Primary Production. College Station, TX: Texas A&M University
Gasol, J. M., and del Giorgio, P. A. (2000). Using flow cytometry for counting natural planktonic bacteria and understanding the structure of planktonic bacterial communities. Sci. Mar. 64, 197–224. doi: 10.3989/scimar.2000.64n2197
Geider, R. J. (1987). Light and temperature dependence of the carbon to chlorophyll a ratio in microalgae and cyanobacteria: implications for physiology and growth of phytoplankton. New Phytol. 106, 1–34. doi: 10.1111/j.1469-8137.1987.tb04788.x
Gohin, F., Saulquin, B., Oger-Jeanneret, H., Lozac’h, L., Lampert, L., Lefebvre, A., et al. (2008). Towards a better assessment of the ecological status of coastal waters using satellite-derived chlorophyll-a concentrations. Remote Sens. Environ. 112, 3329–3340. doi: 10.1016/j.rse.2008.02.014
Goncalves-Araujo, R., Granskog, M. A., Bracher, A., Azetsu-Scott, K., Dodd, P. A., and Stedmon, C. A. (2016). Using fluorescent dissolved organic matter to trace and distinguish the origin of Arctic surface waters. Sci. Rep. 6:33978. doi: 10.1038/srep33978
Goncalves-Araujo, R., Stedmon, C. A., Heim, B., Dubinenkov, I., Kraberg, A., Moiseev, D., et al. (2015). From fresh to marine waters: characterization and fate of dissolved organic matter in the lena river delta region, siberia. Front. Mar. Sci. 2:108. doi: 10.3389/fmars.2015.00108
Hansell, D. A., Carlson, C. A., Repeta, D. J., and Schlitzer, R. (2009). Dissolved organic matter in the ocean: a controversy stimulates new insights. Oceanography 22, 202–211. doi: 10.5670/oceanog.2009.109
Harada, N. (2016). Review: potential catastrophic reduction of sea ice in the western Arctic Ocean: its impact on biogeochemical cycles and marine ecosystems. Glob. Planet Change 136, 1–17. doi: 10.1016/j.gloplacha.2015.11.005
Hedges, J. I. (1992). Global biogeochemical cycles: progress and problems. Mar. Chem. 39, 67–93. doi: 10.1016/0304-4203(92)90096-S
Honjo, S., Manganini, S. J., Krishfield, R. A., and Francois, R. (2008). Particulate organic carbon fluxes to the ocean interior and factors controlling the biological pump: a synthesis of global sediment trap programs since 1983. Prog. Oceanogr. 76, 217–285. doi: 10.1016/j.pocean.2007.11.003
Hood, E., Fellman, J., Sencer, R. G. M., Hernes, P. J. H., Edwards, R., D’Amore, D., et al. (2009). Glaciers as a source of ancient and labile organic matter to the marine environment. Nature 462, 1044–1048. doi: 10.1038/nature08580
Hu, C., Lee, Z., and Franz, B. A. (2012). Chlorophyll-a algorithms for oligotrophic oceans: a novel approach based on three-band reflectance difference. J. Geophys. Res. 117:C01011. doi: 10.1029/2011JC007395
Itkin, P., Spreen, G., Cheng, B., Doble, M., Girard-Ardhuin, F., Haapala, J., et al. (2017). Thin ice and storms: sea ice deformation from buoy arrays deployed during N-ICE2015. J. Geophys. Res. Oceans 122, 4661–4674. doi: 10.1002/2016JC012403
Ji, R., Jin, M., and Varpe, O. (2013). Sea ice phenology and timing of primary production pulses in the Arctic Ocean. Glob. Chang. Biol. 19, 734–741. doi: 10.1111/gcb.12074
Kattner, G., Lobbes, J. M., Fitznar, H. P., Engbrodt, R., Noethig, E.-M., and Lara, R. J., (1999). Tracing dissolved organic substances and nutrients from the Lena River through Laptev Sea (Arctic). Mar. Chem. 65, 25–39. doi: 10.1016/S0304-4203(99)00008-0
Kim, J. M., Lee, K., Shin, K., Yang, E. J., Engel, A., Karl, D. M., et al. (2011). Shifts in biogenic carbon flow from particulate to dissolved forms under high carbon dioxide and warm ocean conditions. Geophys. Res. Lett. 38:L08612. doi: 10.1029/2011GL047346
Kirchman, D. L., Hill, V., Cottrell, M. T., Gradinger, R., Malmstrom, R. R., and Parker, A. (2009a). Standing stocks, production, and respiration of phytoplankton and heterotrophic bacteria in the western Arctic Ocean. Deep Sea Res. Part II Top. Stud. Oceanogr. 56, 1237–1248. doi: 10.1016/j.dsr2.2008.10.018
Kirchman, D. L., Morán, X. A., and Ducklow, H. (2009b). Microbial growth in the polar oceans – role of temperature and potential impact of climate change. Nat. Rev. Microbiol. 7, 451–459. doi: 10.1038/nrmicro2115
Kwok, R., Spreen, G., and Pang, S. (2013). Arctic sea ice circulation and drift speed: decadal trends and ocean currents. J. Geophys. Res. Oceans 118, 2408–2425. doi: 10.1002/jgrc.20191
Lalande, C., Beìlanger, S., and Fortier, L. (2009). Impact of a decreasing sea ice cover on the vertical export of particulate organic carbon in the northern Laptev Sea, Siberian Arctic Ocean. Geophys. Res. Lett. 36:L21604. doi: 10.1029/2009GL040570
Loginova, A. N., Thomsen, S., and Engel, A. (2016). Chromophoric and fluorescent dissolved organic matter in and above the oxygen minimum zone off Peru. J. Geophys. Res. Oceans 121, 7973–7990. doi: 10.1002/2016JC011906
Meier, W. N., Hovelsrud, G. K., van Oort, B. E. H., Key, J. R., Kovacs, K. M., Michel, C., et al. (2014). Arctic sea ice in transformation: a review of recent observed changes and impacts on biology and human activity. Rev. Geophys. 51, 185–217. doi: 10.1002/2013RG000431
Meon, B., and Amon, R. M. W. (2004). Heterotrophic bacterial activity and fluxes of dissolved free amino acids and glucose in the Arctic rivers Ob, Yenisei and the adjacent Kara Sea. Aquat. Microb. Ecol. 37, 121–135. doi: 10.3354/ame037121
Moore, S. E., and Grebmeier, J. M. (2018). The distributed biological observatory: linking physics to biology in the pacific arctic region+ supplementary file (See Article Tools). Arctic 71, 1–7. doi: 10.14430/arctic4606
Morgan, K. C., and Kalff, J. (1979) Effect of light and temperature interactions on growth of cryptomonas erosa (cryptophyceae). J. Phycol. 15, 127–134. doi: 10.1111/j.1529-8817.1979.tb02975.x
Myklestad, S., Haug, A., and Larsen, B. (1972). Production of carbohydrates by the marine diatom Chaetoceros affinis var Willei (Gran). In Hustedt II: preliminary investigation of the extracellular polysaccharide. J. Exp. Mar. Biol. Ecol. 9, 137–144. doi: 10.1016/0022-0981(72)90042-1
Nöthig, E. M., Bracher, A., Engel, A., Metfies, K., Niehoff, B., Peeken, I., et al. (2015). Summertime plankton ecology in Fram Strait - a compilation of long- and short-term observations. Polar Res. 34:23349. doi: 10.3402/polar.v34.23349
OpsahlL, S., and Benner, R. (1999). Characterization of carbohydrates during early diagenesis of five vascular plant tissues. Org. Geochem. 30, 83–94. doi: 10.1016/S0146-6380(98)00195-8
Paulsen, M. L., Nielsen, S. E. B., Müller, J.-O., Møller, E. F., Stedmon, C. A., Juul Pedersen, T., et al. (2017). Carbon bioavailability in a high Arctic fjord influenced by glacial meltwater, NE Greenland. Front. Mar. Sci. 4:176. doi: 10.3389/fmars.2017.00176
Piontek, J., Sperling, M., Nöthig, E. M., and Engel, A. (2015). Multiple environmental changes induce interactive effects on bacterial degradation activity in the Arctic Ocean. Limnol. Oceanogr. 60, 1392–1410. doi: 10.1002/lno.10112
Polyakov, I. V., Timokhov, L. A., Alexeev, V. A., Bacon, S., Dmitrenko, I. A., Fortier, L., et al. (2010). Arctic ocean warming contributes to reduced polar ice cap. J. Phys. Oceanogr. 40, 2743–2756. doi: 10.1175/2010JPO4339.1
Romera-Castillo, C., Sarmento, H., Salgado, X. A. A., Gasol, J. M., and Marrasé, C. (2011). Net production/consumption of fluorescent coloured dissolved organic matter by natural bacterial assemblages growing on marine phytoplankton exudates. Appl. Environ. Microbiol. 77, 7490–7498. doi: 10.1128/AEM.00200-11
Sathyendranath, S., Brewin, R. J. W., Müeller, D., Brockmann, C., Deschamps,P.-Y., Doerffer, R., et al. (2012). “Ocean colour climate change initiative: approach and initial results,” in Proceedings of the IEEE International Geoscience and Remote Sensing Symposium (IGARSS), (Piscataway, NJ: IEEE), 2024–2027. doi: 10.1109/IGARSS.2012.6350979
Schlitzer, R. (2015). Data analysis and visualization with ocean data view. CMOS Bulletin SCMO 43, 9–13.
Screen, J. A., and Simmonds, I. (2010). The central role of diminishing sea ice in recent Arctic temperature amplification. Nature 464, 1334–1337. doi: 10.1038/nature09051
Serreze, M. C., Holland, M. M., and Stroeve, J. (2007). Perspectives on the Arctic’s shrinking sea-ice cover. Science 315, 1533–1536. doi: 10.1126/science.1139426
Solomon, S., Qin, D., Manning, M., Averyt, K., and Marquis, M. (2013). “Climate change 2013 - the physical science basis: working group I,” in Proceedings of the Fifth Assessment Report of the Intergovernmental Panel on Climate Change, eds T. F. Stocker, D. Qin, G.-K. Plattner, M. Tignor, S. K. Allen, J. Boschung, et al. (Cambridge: Cambridge University Press), 1535.
Soltwedel, T., Bauerfeind, E., Bergmann, M., Bracher, A., Budaeva, N., Busch, K., et al. (2016). Natural variability or anthropogenically-induced variation? Insights from 15 years of multidisciplinary observations at the arctic open-ocean LTER site HAUSGARTEN. Ecol. Indic. 65, 89–102. doi: 10.1016/j.ecolind.201510.001
Sommer, U., and Lengfellner, K. (2008). Climate change and the timing, magnitude, and composition of the phytoplankton spring bloom. Global Change Biol. 14, 1199–1208. doi: 10.1111/j.1365-2486.2008.01571.x
Søreide, J. E., Leu, E., Berge, J., Graeve, M., and Falk-Petersen, S. (2010). Timing of blooms, algal food quality and Calanus glacialis reproduction and growth in a changing Arctic. Glob. Chang. Biol. 16, 3154–3163. doi: 10.1111/j.1365-2486.2010.02175.x
Spielhagen, R. F., Werner, K., Sørensen, S. A., Zamelczyk, K., Kandiano, E., Budeus, G., et al. (2011). Enhanced modern heat transfer to the Arctic by warm Atlantic water. Science 331, 450–453. doi: 10.1126/science.1197397
Stedmon, C. A., Amon, R. M. W., Rinehart, A. J., and Walker, S. A. (2011). The supply and characteristics of colored dissolved organic matter (CDOM) in the Arctic Ocean: pan Arctic trends and differences. Mar. Chem. 124, 108–118. doi: 10.1016/j.marchem.2010.12.007
Stedmon, C. A., Granskog, M. A., and Dodd, P. A. (2015). An approach to estimate the freshwater contribution from glacial melt and precipitation in East Greenland shelf waters using colored dissolved organic matter (CDOM). J. Geophys. Res. Ocean 120, 1107–1117. doi: 10.1002/2014JC01050131
Stroeve, J. C., Serreze, M. C., Holland, M. M., Kay, J. E., Mallanik, J., and Barrett, A. P. (2012). The Arctic’s rapidly shrinking sea ice cover: a research synthesis. Clim. Chang. 110:1005. doi: 10.1007/s10584-011-0101-1
Sugimura, Y., and Suzuki, Y. (1988). A high-temperature catalytic oxidation method for the determination of non-volatile dissolved organic carbon in seawater by direct injection of a liquid sample. Mar. Chem. 24, 105–131. doi: 10.1016/0304-4203(88)90043-6
Thingstad, T. F., Bellerby, R. G. J., Bratbak, G., Børsheim K. Y., Egge, J. K., Heldal, M., et al. (2008). Counterintuitive carbon-to-nutrient coupling in an Arctic pelagic ecosystem. Nature 455, 387–390. doi: 10.1038/nature07235
Vernet, M., Richardson, T. L., Noethig, E. M., Metfies, K., and Peeken, I. (2017). Models of plankton community changes during a warm water anomaly in Arctic waters: altered trophic pathways without substantial changes in carbon export. Front. Mar. Sci. Res. Top. 4:160. doi: 10.3389/fmars.2017.00160
Wassmann, P. (2011). Arctic marine ecosystems in an era of rapid climate change. Prog. Oceanogr. 90, 1–17. doi: 10.1016/j.pocean.2011.02.002
Wohlers, J., Engel, A., Zöllner, E., Breithaupt, P., Jürgens, K., Hoppe, H. G., et al. (2009). Changes in biogenic carbon flow in response to sea surface warming. Proc. Natl. Acad. Sci. U.S.A. 106, 7067–7072. doi: 10.1073/pnas.0812743106
Wohlers-Zöllner, J., Biermann, A., Engel, A., Dörge, P., Lewandowska, A. M., Scheibner, M., et al. (2012). Effects of rising temperature on pelagic biogeochemistry in mesocosm systems: a comparative analysis of the AQUASHIFT Kiel experiments. Mar. Biol. 159, 2503–2251. doi: 10.1007/s00227-012-1958-x
Keywords: dissolved organic carbon, particulate organic carbon, phytoplankton, bacteria, time series
Citation: Engel A, Bracher A, Dinter T, Endres S, Grosse J, Metfies K, Peeken I, Piontek J, Salter I and Nöthig E-M (2019) Inter-Annual Variability of Organic Carbon Concentration in the Eastern Fram Strait During Summer (2009–2017). Front. Mar. Sci. 6:187. doi: 10.3389/fmars.2019.00187
Received: 30 October 2018; Accepted: 25 March 2019;
Published: 24 April 2019.
Edited by:
Jacob Carstensen, Aarhus University, DenmarkReviewed by:
Colin Andrew Stedmon, Technical University of Denmark, DenmarkHaimanti Biswas, National Institute of Oceanography (CSIR), India
Copyright © 2019 Engel, Bracher, Dinter, Endres, Grosse, Metfies, Peeken, Piontek, Salter and Nöthig. This is an open-access article distributed under the terms of the Creative Commons Attribution License (CC BY). The use, distribution or reproduction in other forums is permitted, provided the original author(s) and the copyright owner(s) are credited and that the original publication in this journal is cited, in accordance with accepted academic practice. No use, distribution or reproduction is permitted which does not comply with these terms.
*Correspondence: Anja Engel, aengel@geomar.de