Globally Consistent Quantitative Observations of Planktonic Ecosystems
 Fabien Lombard1,2*
  Emmanuel Boss3*
  Anya M. Waite4 Meike Vogt5
  Julia Uitz1
  Lars Stemmann1
  Heidi M. Sosik6 Jan Schulz7 Jean-Baptiste Romagnan8
  Marc Picheral1
  Jay Pearlman9
  Mark D. Ohman10 Barbara Niehoff11
  Klas O. Möller12
  Patricia Miloslavich13,14
  Ana Lara-Lpez13
  Raphael Kudela15
  Rubens M. Lopes16
  Rainer Kiko17
  Lee Karp-Boss3 Jules S. Jaffe10
  Morten H. Iversen11,18
  Jean-Olivier Irisson1 Katja Fennel19
  Helena Hauss17
  Lionel Guidi1
  Gaby Gorsky1
  Sarah L. C. Giering20
  Peter Gaube21 Scott Gallager6
  George Dubelaar22
  Robert K. Cowen23 François Carlotti24 Christian Briseño-Avena23 Léo Berline24
  Kelly Benoit-Bird25
  Nicholas Bax13,26
  Sonia Batten27
  Sakina Dorothée Ayata1,28 Luis Felipe Artigas29
  Ward Appeltans30
- 1Sorbonne Université, CNRS, Laboratoire d'Océanographie de Villefranche, Villefranche-sur-Mer, France
- 2Institut Universitaire de France, Paris, France
- 3School of Marine Sciences, University of Maine, Orono, ME, United States
- 4Department of Oceanography, Ocean Frontier Institute, Dalhousie University, Halifax, NS, Canada
- 5Institute for Biogeochemistry and Pollutant Dynamics, ETH Zürich, Zurich, Switzerland
- 6Woods Hole Oceanographic Institution, Woods Hole, MA, United States
- 7Institute for Chemistry and Biology of the Marine Environment, University of Oldenburg, Oldenburg, Germany
- 8Ifremer Centre Atlantique, Unité Écologie et Modéles pour l'Halieutique (EMH), Nantes, France
- 9IEEE, Port Angeles, WA, United States
- 10Scripps Institution of Oceanography, UC San Diego, La Jolla, CA, United States
- 11Alfred-Wegener-Institut, Helmholtz Centre of Polar and Marine Research, Bremerhaven, Germany
- 12Institute of Coastal Research, Helmholtz-Zentrum Geesthacht, Geesthacht, Germany
- 13Institute for Marine and Antarctic Science, University of Tasmania, Hobart, TAS, Australia
- 14Departamento de Estudios Ambientales, Universidad Simon Bolívar, Caracas, Venezuela
- 15Department of Ocean Sciences, UC Santa Cruz, Santa Cruz, CA, United States
- 16Oceanographic Institute, University of São Paulo, São Paulo, Brazil
- 17GEOMAR Helmholtz Centre for Ocean Research Kiel, Kiel, Germany
- 18MARUM and Faculty of Geosciences, University of Bremen, Bremen, Germany
- 19Department of Oceanography, Dalhousie University, Halifax, NS, Canada
- 20Ocean Biogeochemistry and Ecosystems, National Oceanography Centre, Southampton, United Kingdom
- 21Applied Physics Laboratory, University of Washington, Seattle, WA, United States
- 22CytoBuoy b.v., Woerden, Netherlands
- 23Hatfield Marine Science Center, Oregon State University, Newport, OR, United States
- 24CNRS, IRD, MIO UM 110, Aix Marseille Univ., Universite de Toulon, Marseille, France
- 25Monterey Bay Aquarium Research Institute, Moss Landing, CA, United States
- 26CSIRO Oceans and Atmosphere, Hobart, TAS, Australia
- 27The CPR Survey-MBA, Nanaimo, BC, Canada
- 28Institut de Systématique, Evolution, Biodiversité, Muséum National d'Histoire Naturelle, CNRS, Sorbonne Université, EPHE, Université des Antilles, Paris, France
- 29Univ. Littoral Cote d'Opale, Univ. Lille, CNRS, UMR 8187, Laboratoire d'Océanologie et de Géosciences, Wimereux, France
- 30Intergovernmental Oceanographic Commission (IOC) of UNESCO, IOC Project office for IODE, Oostende, Belgium
In this paper we review the technologies available to make globally quantitative observations of particles in general—and plankton in particular—in the world oceans, and for sizes varying from sub-microns to centimeters. Some of these technologies have been available for years while others have only recently emerged. Use of these technologies is critical to improve understanding of the processes that control abundances, distributions and composition of plankton, provide data necessary to constrain and improve ecosystem and biogeochemical models, and forecast changes in marine ecosystems in light of climate change. In this paper we begin by providing the motivation for plankton observations, quantification and diversity qualification on a global scale. We then expand on the state-of-the-art, detailing a variety of relevant and (mostly) mature technologies and measurements, including bulk measurements of plankton, pigment composition, uses of genomic, optical and acoustical methods as well as analysis using particle counters, flow cytometers and quantitative imaging devices. We follow by highlighting the requirements necessary for a plankton observing system, the approach to achieve it and associated challenges. We conclude with ranked action-item recommendations for the next 10 years to move toward our vision of a holistic ocean-wide plankton observing system. Particularly, we suggest to begin with a demonstration project on a GO-SHIP line and/or a long-term observation site and expand from there, ensuring that issues associated with methods, observation tools, data analysis, quality assessment and curation are addressed early in the implementation. Global coordination is key for the success of this vision and will bring new insights on processes associated with nutrient regeneration, ocean production, fisheries and carbon sequestration.
1. Context and Rationale Why Should We Observe Plankton and Particles in the Ocean?
Plankton are organisms that have either null velocities or velocities significantly smaller than oceanic currents and thus are considered to travel with the water parcel they occupy (some can, however, through vertical swimming or change in buoyancy, move between water masses). Plankton are an extremely diverse group, spanning across several orders of magnitude in size (sub-microns to several a meter) and with representatives from all trophic levels (auto-, mixo- and hetero-trophic) and all domains of life, including bacteria, protists and small to large metazoa. Knowledge on distribution patterns and composition of planktonic communities is of great interest for many reasons: (1) Life is thought to have begun in the ocean, and planktonic organisms therefore provide important evolutionary insights on diversity, complex life forms and adaptations to highly variable environments. (2) Plankton form the foundation of most marine food webs, with phytoplankton accounting for approximately 50% of global primary production. The organic material produced by phytoplankton is consumed by herbivorous zooplankton that provide a crucial source of food for higher trophic levels, including important commercial species, marine mammals and sea birds. (3) Many important commercial species have early developmental stages that are planktonic. Time spent in the plankton is often considered a time of greatest vulnerability and hence a bottleneck for recruitment. (4) Planktonic organisms play important roles in global cycles of the majority of oceanic elements. (5) Because of their restricted environmental preferences and relatively short life spans, plankton abundance and composition react tightly to local and global environmental changes (e.g., Mackas and Beaugrand, 2010; Beaugrand et al., 2013, 2015; Edwards et al., 2013), and can serve as sentinel organisms of environment and water quality changes, and (6) some planktonic organisms can be toxic or cause disease and parasitism in animals, including commercial ones (Anderson et al., 2019). Given these important functions, the biomass and diversity of phytoplankton and zooplankton were identified as Essential Ocean Variables (EOVs) by the Global Ocean Observing System (Chiba et al., 2018; Miloslavich et al., 2018; Muller-Karger et al., 2018; Bax et al., 2019) as well as Essential Climate Variables (ECVs) under GCOS (Global Climate Observing System).
In addition, the upper ocean is teeming with organic and inorganic particles which can form larger aggregates (marine snow) very often colonized by micro-organisms. These aggregates can sink rapidly, creating one of the major fluxes of matter to the deep ocean (e.g., Kiko et al., 2017), forming the base of the food web in this dark ocean, and are an important vector in controlling nutrient distribution across the ocean. Recognizing this role, particulate matter was also identified as an EOV and ECV. In particular, the concentration of particulate matter provides quantitative information on spatial gradients and temporal variations in total particulate substrates, which are mostly comprised of organic material in the open ocean.
Understanding how plankton communities change at regional and global scales, which is critical to address ocean health, food security, and biogeochemical cycles, requires a multidisciplinary approach to ecology. While planktonic organisms have been studied in great detail for decades, the relatively inconsistent and diverse use of various methods and techniques (taxonomic, isotopic, genomic, biogeochemical, etc.) makes it difficult to uncover global and/or long-term patterns and trends in abundances, diversity and composition of the plankton. As a result, global analyses are to date restricted to basic descriptors of plankton such as total abundance or biomass. For instance, phytoplankton distributions are most often described through chlorophyll a measurements and the concentrations of other pigments, which provide, through empirical relationships, limited taxonomic and size information on phytoplankton communities (Swan et al., 2016). Knowledge of the distribution of larger organisms often relies on the collation of numerous and heterogeneous observations from several decades and from diverse samplers, providing a crude description of zooplankton total biomass at a global scale (e.g., Moriarty and O'Brien, 2013; Moriarty et al., 2013; O'Brien et al., 2017) or through empirical relationships between several planktonic groups (Buitenhuis et al., 2013), with only little concern about diversity. Hence, our general understanding of plankton abundance and diversity is highly fragmented due to a paucity of data, heterogeneity among collection methods, analysis techniques, technology and scale of measurements. It is also fragmented because there is a lack of standardization of methods, data outputs and data curation.
Recently, new sensors, instruments, platforms (e.g., Argo floats see Roemmich et al., 2019, and gliders see Testor et al., 2019) and methods (imaging, acoustics, omics, etc.) have been developed and deployed to improve the spatiotemporal resolution of planktonic communities and particles (Powell and Ohman, 2015a; Brownlee et al., 2016; Hunter-Cevera et al., 2016; Ohman et al., 2018) even in hostile conditions (Grossmann et al., 2015). Here we suggest that with these technologies (as well as concurrent advances in software), we have the ability to collect and analyze significantly more global information on plankton distributions and diversity and at a finer scale (taxonomic, spatial, and temporal) than is currently done. Such a global plankton observation effort is not intended to replace fine, high-quality and highly precise local sampling and observations, usually done during specific oceanographic cruises focused on process studies or long-term observation sampling. Rather, the goal is to expand and upscale our observational capabilities at larger scales and with consistent data to provide a sustained observing system. To do so, we propose leveraging on existing international coordinated sampling programs and infrastructures (e.g., GO-SHIP Sloyan et al., 2019, OCEAN-SITES, Argo) by adding supplemental measurements that could be carried out without major changes to current sampling. In addition, integrating those supplementary measurements into existing long-term surveys would allow the description of key elements of the plankton system at both local and global scales.
This article is organized as follows; we first review the state of the art for plankton sampling in general and imaging in particular, focusing on commercially available instruments for operational reasons. We then detail what could be expected from a global plankton sampling program. We identify challenges associated with such a program and finally make recommendations on how to proceed over the next decade.
2. State of the Art
There are no global standard methodologies for the quantification of plankton across the different plankton groups (e.g., phyto-, zooplankton) or within each group. Few exceptions are analytical chemical methods, such as phytoplankton pigment analysis using HPLC and the use of WP2 nets from 0 to 200 m for zooplankton field sampling (UNESCO, 1968). This partly explains why existing plankton time series observations are difficult to compare except in their trends (O'Brien et al., 2017), since they are based on different methodologies and taxonomic resolution. Physical and biogeochemical marine research have systematic and sustained sampling programs that, at times, measure plankton-related variables, albeit at a low taxonomic and functional resolution (e.g., diel vertical migration pattern from acoustic Doppler current profilers, total in vivo fluorescence allowing the estimation of chlorophyll a concentrations). For decades physical and biogeochemical marine research has been tightly coordinated at the international level (e.g., GO-SHIP, GEOTRACES, OCEAN-SITES), which has not been the case for biological and ecological marine research.
One exception is the plankton-relevant data available from ocean color passive remote sensing, which provides global information on the distribution and concentration of chlorophyll a, organic carbon and phytoplankton carbon distributions in the surface ocean on a near-daily time scale (Siegel et al., 2013). Unfortunately, data are limited to the upper ocean and are only continuously available since 1996 (for a future perspective see Groom et al., 2019). Methods to obtain taxonomic and size information from remote sensing have been proposed (e.g., Alvain et al., 2008); however, these methods in general lack validation, and it is unclear if it is possible to use remote sensing to gain information about phytoplankton size and taxonomy beyond that which is globally correlated to chlorophyll (Chase et al., 2017). Recently, it has been shown that active remote sensing with atmospheric LIDAR (Light Detection and Ranging), not specifically tuned for ocean observations, can provide a proxy of concentration of upper ocean particles, even during the polar night and through thin cloud covering (Hostetler et al., 2018).
Another exception is the Continuous Plankton Recorder (CPR) surveys (Batten et al., 2003, 2019). CPR has the most extensive spatial coverage of any plankton sampling program and provides taxonomically resolved abundance data. Commercial ships or other ships-of-opportunity tow the CPR along their regular routes in near-surface waters (Batten et al., 2003). Lengthy and consistent time series exist for several locations such as the North Atlantic and North Sea (> 60 years), the Southern Ocean (> 25 years) and the North Pacific (19 years) as well as more recent regional surveys in the Mediterranean and around Australia, for example (Batten et al., 2019). It is, to date, the most cost-effective way to sample ocean basins over large distances. However, CPR sampling occurs at relatively low resolution (each sample represents 18.5 km of ocean), is confined to the surface ocean, and currently poorly covers the tropics and the sub-tropics (i.e, no global coverage). While the CPR is an internally consistent sampler, not all planktonic groups are well sampled or well resolved (very small, very large and/or fragile plankton especially), so abundance estimates are best considered as semi-quantitative, and integration with other data sources requires careful treatment (Richardson et al., 2006). Nevertheless, the existing lengthy CPR time series is invaluable and should be incorporated into continuing assessments of changing ecosystems.
3. Measurements With Increasing Capabilities
While discrete water samples, net tows, CPR and ocean color provide important data for the study of oceanic plankton on basin scales, they are far from sufficient in their taxonomic, spatial and temporal resolution. There is a clear need for a systematic and sustained global sampling program that will take advantage of technological advances that provide significantly more taxonomic information. Such a program will likely build on the current standard measurements, expanding them to a wider range of pelagic systems, to a finer spatial, temporal and also functional/taxonomic resolution by incorporating the growing field of -omics and the expanding suite of autonomous sensors and quantitative imaging technologies.
In this section, we provide a list of existing sampling technologies for plankton. While all have achieved a technology readiness level (TRL) beyond the prototype stage, some of these technologies are more mature than others. Assessment of TRL depends, among other things, on method of deployment (e.g., AUV vs. R/V), but we avoid getting into these details here. Much about the TRL of a specific technology for a specific application can be assessed from the literature provided. Literature emanating from groups who have not developed the technology is particularly useful to assess the operational status of a given technology.
3.1. Analysis of Water Samples
Discrete sample analysis is performed on water samples taken from CTD-rosettes, surface buckets, water pumped from the surface into vessels (flow-through systems) and plankton nets. Such analyses often target the bulk properties of the underlying particle/plankton population, including chemical analysis of mass and elemental content, pigment content, size distribution and genetics.
3.1.1. Bulk Mass and Elemental Composition
Total suspended mass in the upper open ocean is dominated by plankton-derived particles. The analysis of organic carbon, phosphorous, nitrogen and micro elements associated with bulk particulate samples retained on a filter provides essential descriptors of the dynamics of such particles. The associated methods have been determined and refined for decades (e.g., Hurd and Spencer, 1991; Cutter et al., 2017).
3.1.2. Diagnostic Pigments
Information on phytoplankton diversity can be gained from High Performance Liquid Chromatograhy (HPLC) analysis of pigments present in bulk samples. Whereas, chlorophyll a is present in all phytoplankton (although in its divinyl form in prochlorophytes) and typically used as a proxy of phytoplankton biomass, accessory pigments vary with phytoplankton community composition, and some pigments can be used as biomarkers of specific taxa (Gieskes and Kraay, 1983; Jeffrey et al., 1997; Roy et al., 2011). Several pigment-based approaches have been proposed that allow estimating the relative contribution to chlorophyll a of different phytoplankton taxa (CHEMTAX algorithm Mackey et al., 1996) or taxonomic groupings or size classes (Claustre, 1994; Vidussi et al., 2001; Uitz et al., 2006; Aiken et al., 2008). Pigment-based methods have the advantage that they cover the whole phytoplankton assemblage in a single analysis and provide a quantitative assessment of phytoplankton community composition at the level of class or higher (Bax et al., 2001). However, lacking flow cytometry and microscopy validation, these methods can have large uncertainties linked to variability in accessory pigmentation within a given taxon or induced by environmental factors (Henriksen et al., 2002; Laviale and Neveux, 2011). It is also recognized that some biomarker pigments are not restricted to one single taxon, leading to ambiguity in the discrimination of some phytoplankton groups. Chlorophyll a can also be estimated from fluorometric and spectrophotometric analysis; however, such data can be significantly different from determination obtained with HPLC and are not recommended as a standard. However, they have significant value in conjunction with long-term time-series, where they have been used for years.
3.1.3. Genomic and Next Generation Sequencing
Next generation sequencing (NGS, also called high throughput sequencing, HTS) provides relatively cost-effective and fast sequencing of DNA and RNA. Initially developed for microbial ecology, and now applied to any drop of water, it has been progressively applied to the whole marine ecosystem (e.g., metabarcoding, metagenomics, metatranscriptomics), encompassing plankton, nekton and even benthic organisms. Barcoding targets and amplifies a specific sequence that is highly conserved yet variable across taxa, such as the 18S ribosomal DNA or cytochrome oxidase (COI) genes for eukaryotes, in order to identify a specific organism. Metabarcoding (MetaB) is the application of barcoding at the scale of a whole water sample and allows the classification of organisms either expressed as in Operational Taxonomic Units (OTU) whose DNA is present in a given sample (Bucklin et al., 2016) or assigned to different taxa through the comparison with databases of named reference sequences. They represent the principal way of addressing biodiversity for prokaryotes and, to some extent, for pico- and nanoeukaryotes as well. Similarly, metagenomics (MetaG) allows the study of all genes present in a given water sample, giving access to the reconstruction of full genomes (Metagenome-assembled genomes or MAGs) for non-model and uncultivated organisms (e.g., Delmont et al., 2018; Tully et al., 2018). RNA sequencing through transcriptomic and metatranscriptomic (MetaT) methods provides new insights into gene expression, and DNA or RNA sequences converted to amino acid sequences (e.g., proteins) allow the characterization of protein structures and phenotypic variations across planktonic communities (e.g., Carradec et al., 2018). These techniques can also be applied at the individual level of a single cell, giving new insight on the genomes and their expressions of uncultured species.
MetaB requires gene amplification using primers that attempt to be as universal as possible, but may still lead to differential amplification of some organisms, whereas MetaG could exhibit biases associated with the length of reads obtained through HTS (although long-read sequencing is currently being developed, it currently has a relatively high level of sequencing error). Due to these different steps, -omics methods provide results that, at present, should only be considered as relative, or semi-quantitative at best (e.g., Bucklin et al., 2016). Another limitation of these methods is the lack of reference sequences in databases, although the reconstruction of MAGs from MetaG data could partly overcome this issue.
MetaB and "environmental" DNA (eDNA) analyses, since they allow estimation of the diversity of samples with unprecedented taxonomic resolution and have become relatively affordable and automated (Ji et al., 2013), have the potential to be used in global surveys to address the diversity of organisms. However, they may not yet be ready nor affordable for large-scale ecosystem surveys (Deiner et al., 2017), while the complexity of analyzing the resulting data remains a challenge. In fact, 10 years ago (Bowler et al., 2009) predicted that miniaturized ecogenomic sensors able to monitor almost all planktonic DNA and RNA would allow near real-time measurements of microbial activity in the ocean and associated biogeochemical processes such as carbon flux. However, such an achievement has not yet been reached, but the recent development of Oxford Nanopore MinION sequencing (Jain et al., 2016; Lu et al., 2016) and its first applications in the marine environment (Warwick-Dugdale et al., 2018) indicate that this possibility may become available soon.
3.2. Sensors
Sensors measuring bio-acoustical and bio-optical properties (see below) have been mounted on CTD-rosette frames, undulating vehicles, autonomous vehicles and floats, ship hulls (for bio-acoustics) and in-line flow-through systems (bio-optics). All sensors require calibrations to obtain absolute physical values comparable across instruments and proxy-calibrations to convert signals to biogeochemical parameters, as these measurements provide a proxy—not a direct—estimate of variables of interest. This is because while the forward problem is well defined (e.g., predict the acoustical or optical signal measured given a field of known organisms with specific optical or acoustical characteristics), the inverse problem is not (i.e., there are many possible configurations of organisms that could result in the observed signal; some, however, are more likely than others if we have additional knowledge). Hence, these methods are more useful when deployed in conjunction with other measurements.
3.2.1. Bio-Acoustics
Acoustic methods can reveal much about the spatial distribution and temporal dynamics of zooplankton. For example, echosounders led to the discoveries of the diel vertical migration of plankton and micronekton (Johnson, 1948) and their ubiquitous and dense but previously hidden aggregations (Cheriton et al., 2007). The ability of acoustic tools to simultaneously assess animals ranging in size from sub-mm to m allows ecological processes in the plankton to be examined (Kaartvedt, 2000; Ballón et al., 2011; Benoit-Bird and McManus, 2014; Powell and Ohman, 2015b) when appropriate frequencies are chosen. However, this ability also highlights a key challenge—separating animal types and accurately assessing the biomass of each. While these approaches have long been used for fish stock assessment and management of a number of species (MacLennan and Simmonds, 1992), in plankton, dramatic differences in body size, species composition, elastic properties of the animals and orientation markedly influence the acoustic reflectivity or target strength (Roberts and Jaffe, 2008; Briseño-Avena et al., 2018), coupled with the complexity of the community, making separation of taxa and assessment of biomass difficult. To address these challenges, research efforts have recently shifted from adding additional narrow-band signals (e.g., Holliday et al., 2009) to utilizing a continuum of frequencies to increase the amount of information available from acoustic returns (e.g., Jech et al., 2017). Acoustic measurements, however, will always have uncertainties; many of the greatest insights on zooplankton resulted from creative integration of multiple, complementary sampling devices including acoustics with nets, optics, imaging and animal tagging to take advantage of the different strengths and fill in the gaps of each approach (reviewed in Benoit-Bird and Lawson, 2016). Multi-sensor fusion efforts have the potential for wider application through the use of autonomous platforms, which resolves the limited range issue of high frequency acoustics. While bio-acoustic instruments have only begun to be deployed over long periods of time on autonomous platforms (Powell and Ohman, 2015a,b), we expect that strong development and wide use of these instruments will be seen in the next decade (Benoit-Bird et al., 2018).
3.2.2. Bio-Optics
Like acoustic, optical measurements are best used with complementary sampling approaches. Measurements of the optical characteristics of water (e.g., absorption, scattering, attenuation and fluorescence) in situ have been used for decades (e.g., Gardner et al., 2018) to characterize bulk properties associated with micrometer-size particles in general and phytoplankton in particular (near-forward scattering extends this range to a few 100 μm). Deployed on profiling floats, gliders, moorings, CTD rosette frames and in-line systems they are capable of providing high-resolution information on the spatial distribution of phytoplankton but with little specificity in terms of composition. They can also provide information on a few pigments beyond chlorophyll a (Chekalyuk and Hafez, 2008; Proctor and Roesler, 2010; Chase et al., 2013) which have been used to provide estimates of phytoplankton functional groups (e.g., MacIntyre et al., 2010; Houliez et al., 2012). Data on basin scales from in-line systems and BGC-Argo floats have become available (Boss et al., 2013; Rembauville et al., 2017), which is useful, for example, to validate satellite-based algorithms (Werdell et al., 2013; Haëntjens et al., 2017). These techniques are also useful as proxies of particulate organic carbon in general and phytoplankton carbon in particular (Cetinić et al., 2012; Graff et al., 2015). Bio-optical sensors are more sensitive to fouling and require periodic cleaning or bio-shutters. Simple measurements, such as the Secchi disk, have been very useful to characterize the optical status of the upper ocean including long-term changes of plankton (Boyce et al., 2010).
3.3. Particle Size Distribution
Particle counters are designed to count particles and obtain information on their size. There are two main types of particle counters: (1) Electronic particle counters measure the change in impedance as an estimate of the physical volume occupied by a particle while it passes through a small aperture (Coulter et al., 1966; Graham, 2003). (2) Optical counters are based on shadow (HIAC counters and the LOPC, the latter no longer commercially available) or near-forward scattering of a laser beam as it encounters particles (Sequoia's LISST). While many of these technologies have been around for decades, in recent years the LISST has been successfully deployed in open ocean environments on CTD rosette frames (Reynolds et al., 2010; Barone et al., 2015; Leroux et al., 2018) and in flow-through systems (Boss et al., 2018). Note that optical counters are primarily sensitive to the cross-sectional area of particles while the resistance-based particle counter size is based on particle volume, hence the specific size associated with the particles, based on an equivalent sphere, is different in both cases. Additionally, handling and hydrodynamics associated with delivering the sample to the sizing instrument can affect the size determined, due to aggregation/disaggregation processes in the sample prior to sampling. Hence, some researchers intentionally disaggregate the sample prior to measurement (Milligan and Kranck, 1991).
3.4. Analysis of Individual Organisms and Particles
Imaging of individual organisms and particles, as long as the volume analyzed is well quantified, makes it possible to obtain simultaneously: (1) abundance of the different groups of plankton and their relative contribution to total abundance and biomass, (2) morphological or optical measurements on the organisms that can be used to obtain their biovolume as a proxy of their biomass, but also to derive size spectra of the imaged objects and (3) production of a digital archive of images and optical properties that can be shared or reprocessed if more information is needed. In addition, imaging systems can be operated on fresh samples on research vessels or in situ, as well as on concentrated or fixed samples. In some cases, images may reveal behavioral information (e.g., predator-prey interactions, parasitism, diurnal vertical migration) as well as physiological state and population conditions, from which rates may be inferred (e.g., lipid content and egg-production rates of ovigerous copepod species, Möller et al., 2015; growth rate of phytoplankton species, Dugenne et al., 2014).
Since the 1980s, a considerable amount of energy has been directed to produce prototypes of automated quantitative imaging devices [see reviews in Foote (2000), Wiebe and Benfield (2003), Benfield et al. (2007), Sieracki et al. (2010), Stemmann and Boss (2011)], among which some are now commercially available (Table 1). Some global patterns in large plankton communities and/or particle fluxes have emerged from intense use of these devices during ship surveys (Stemmann et al., 2008b; Bonato et al., 2015; Guidi et al., 2015; Thyssen et al., 2015; Biard et al., 2016; Waite et al., 2016) or on high frequency platforms (Thyssen et al., 2008, 2014). These instruments can be used in situ, in the laboratory and/or on a research vessel depending on their design, but they all share some common principles. Marine particles and plankton either pass by or are placed in a known volume illuminated by a specific light source. For optical devices, various optical measurements are made (e. g., fluorescence), while for imaging devices a picture is taken and measurements inferred from the picture (both could happen for the same object in the case of imaging flow cytometers). Images can be classified according to taxonomic or functional groups and living cells can be separated from aggregates and other non-living particles.
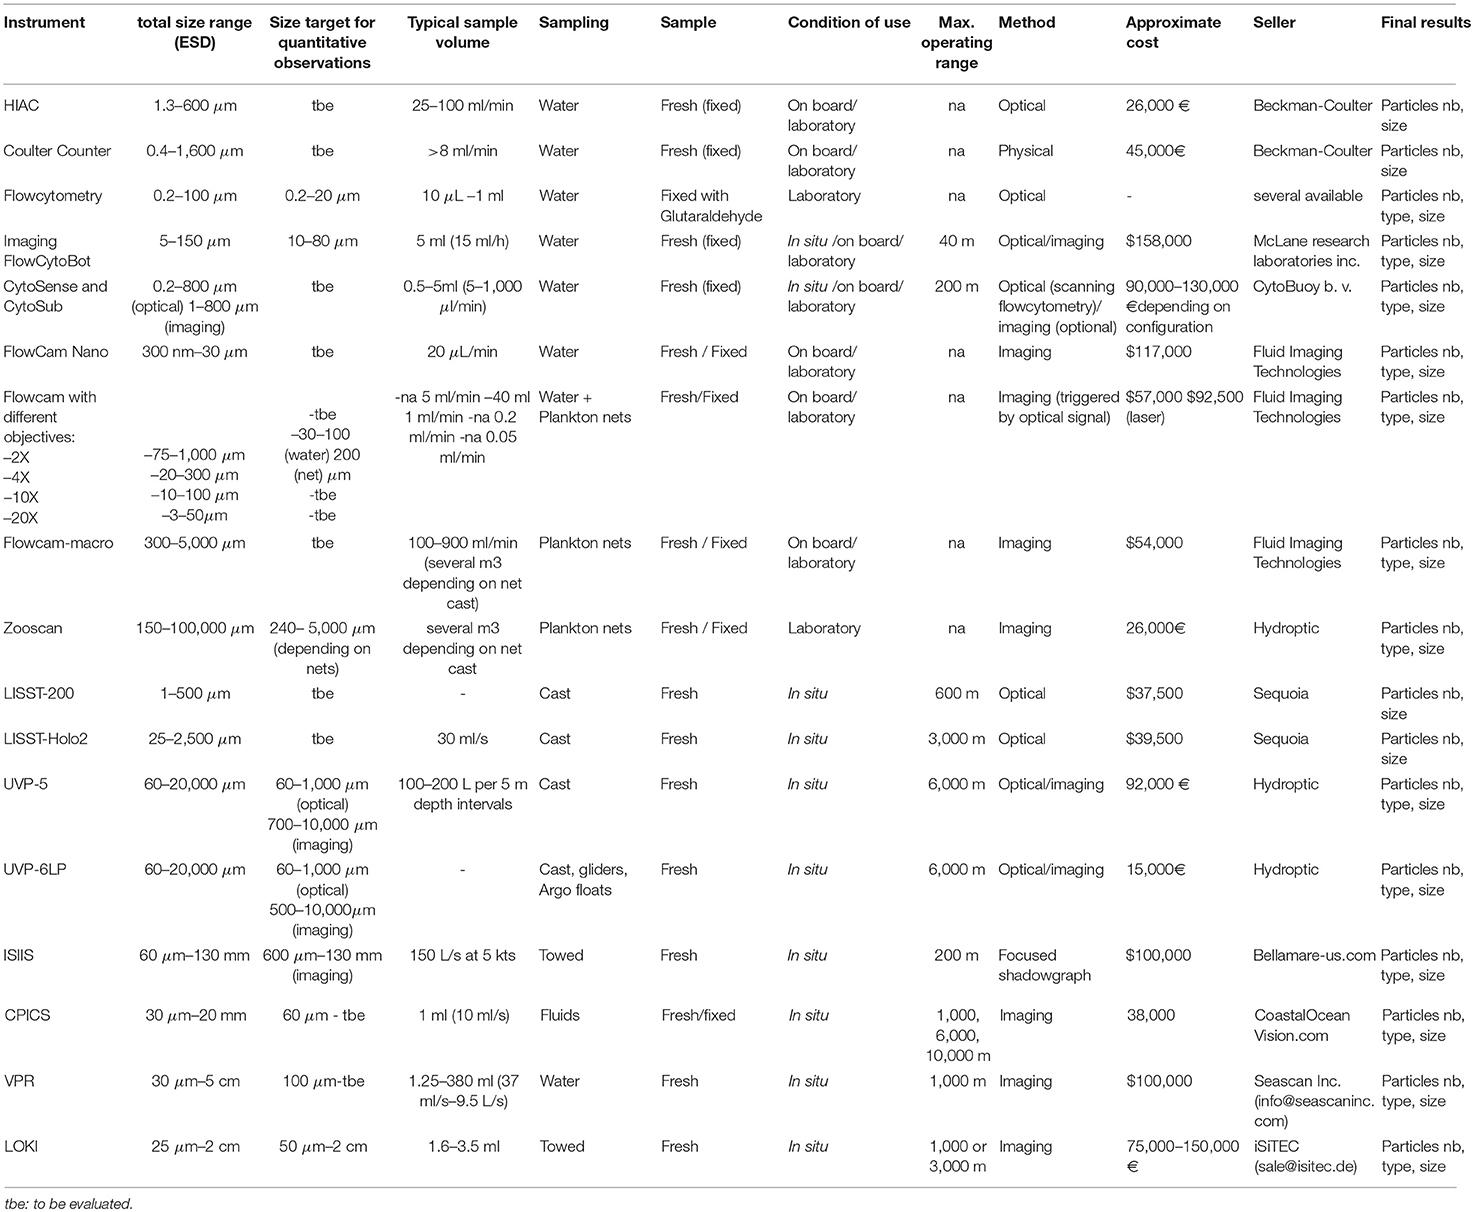
Table 1. Comparison of the different optical and imaging methods commercially available with a focus on their different size targets (expressed as equivalent spherical diameter; ESD, both commercially available and determined as efficient for quantitative measurements, see Figures 1, 2), and operating capabilities.
Imaging devices also provide common particle characteristics: each object's size, shape and cross-sectional area can be determined as well as the intensity of light coming from each pixel of the particle, identified thanks to its optical or image characteristics, producing a large amount of raw data. Sometimes, these data are used to provide statistics for a given group (e.g., flow cytometry) or for given sizes. Each optical/imaging technique also comes with its own size range limitation (Table 1 and Figure 1). Small particles are often too small to be imaged efficiently (too few pixels, signal below threshold or near noise level), while larger organisms are too scarce to be sampled quantitatively (volume analyzed is too small), or too large to pass by the tubing of some devices, resulting in a narrow size range compared with the theoretical one (Figure 2). This “effective” range is often missing from technical documentation and needs to be determined experimentally. Additionally, to obtain taxonomic information from optical or imaging methods, there is a need for a computer-assisted human expert to classify organisms based on their optical properties (e.g., “gating” in flow cytometry) or on their image. While machine-learning methods are getting progressively more efficient (Luo et al., 2017), the final taxonomic resolution is often limited, and may include substantial errors (Culverhouse et al., 2003, 2006). The increased capabilities in automated recognition of images still needs to be complemented with taxonomic expertise. Training libraries associated with specific technologies are expanding and could be refined to be applied to new datasets as well as to revisit old datasets. This ensures that the taxonomic knowledge is preserved in the form of image libraries, in a fashion similar to plankton identification field guides (but not quite as rigorous as taxonomic keys). Finally, strong analytical and programming skills as well as computer resources are needed to sort and analyze these often very complex data, which combine organisms' taxonomic, morphological and optical properties together with their concentration.
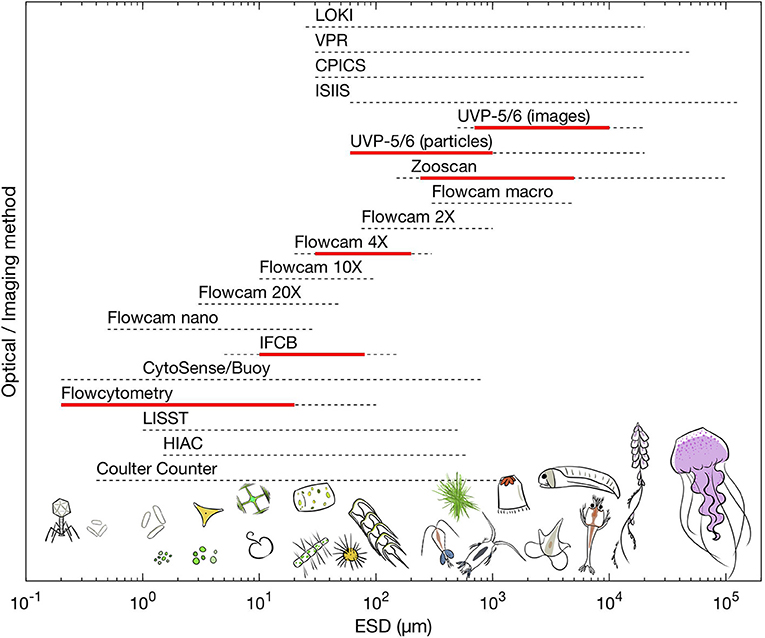
Figure 1. Comparison of the total size range of plankton (in equivalent spherical diameter; ESD) that available optical and imaging methods can sample. Dashed lines represent the total operational size range from commercial information while the red line represent the practical size range which is efficient to obtain quantitative information, for an example see Figure 2. Drawings by Justine Courboules.
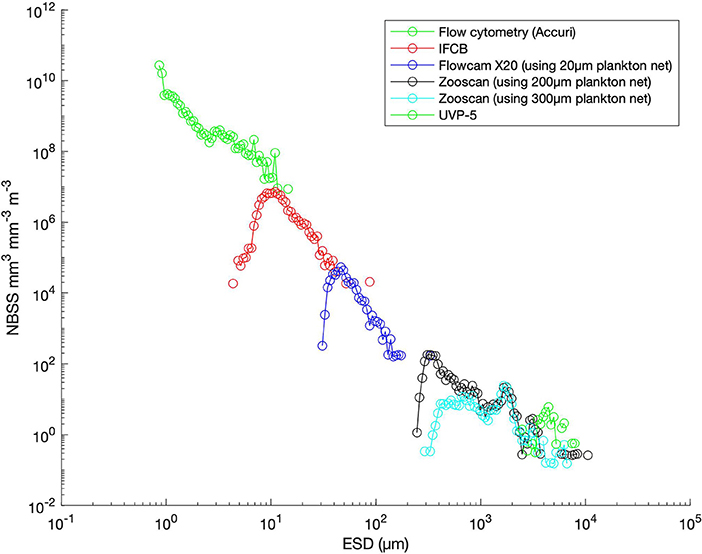
Figure 2. Comparison of total planktonic organisms sampled with different collection methods and analyzed with different optical/imaging methods as a function of the size of organisms (expressed as equivalent spherical diameter; ESD). All sampling was done at the same station during Tara-Ocean Cruise at station 210 (Labrador Sea). Total organism biovolume per size classes were expressed as normalized biovolume size spectra (NBSS) by dividing the total biovolume within a size class by the biovolume interval of the considered size class. NBSS is representative of the number of organisms within a size class. Results were obtained by analyzing whole water with optical method (using an Accuri Flowcytometer) and imaging methods (Imaging FlowCyto Bot-IFCB and Underwater Vision Profiler UVP-5) and plankton net samples of various mesh sizes using imaging methods (Flowcam with a 20X lens and Zooscan). All data are raw counts (removing only objects determined to be not living) and converted to biovolume using elipsoidal calculations. The low count at the smaller size range of each observation corresponds to an underestimation of an object's number due to both limited capabilities of each imaging device for small objects and net undersampling for small objects.
3.4.1. Flow Cytometers
Flow cytometry measures fluorescence and scattering signals from single virus, bacterial or protistan cells contained in a seawater sample. Flow cytometry fluidics are designed to orient individual particles through a capillary where they are illuminated sequentially by one or several laser beams. The scattering signals (forward and side scattering, FSC and SSC) accompanied with different fluorescence signal intensities are recorded for each individual object. Fluorescence is either natural to the cell (e.g., photosynthetic pigments) or originating from a specific stain (e.g., SYBR green stains, which bind to DNA). Therefore, flow cytometry can record simultaneously on the same particle several features representative of its size (FSC), granularity (SSC) or pigment quantity and composition (fluorescence). Note, however, that SSC depends on size, but also shape and refractive index of the analyzed cell (Green et al., 2003; Agagliate et al., 2018), and without a proper calibration against cells similar to the ones present in a sample (e.g., Laney and Sosik, 2014), the size of particles inferred from FSC could be significantly biased. Different populations of particles sharing similar characteristics are often lumped (a human-based “gating” step) to represent sub-populations of the underlying assembly.
3.4.2. Imaging Systems
3.4.2.1. Imaging flow cytometry
Imaging flow cytometry (IFC) combines single-particle fluidics, optical characterization and the imaging of cells/colonies. The triggering of an image can be initiated based on different properties of the cell probed ahead of the camera (see Barteneva and Vorobjev, 2015 for a review). Four IFCs have been used routinely within aquatic research, the Imaging FlowCytobot® (Olson and Sosik, 2007; Sosik and Olson, 2007), the Cytosense/Cytobuoy® (Dubelaar et al., 1999), the FlowCam®(Flow Cytometer And Microscope; Sieracki et al., 1998 and the ZooCAM Colas et al., 2018, which differ in their approaches, outputs and size range (Table 1).
• The Imaging FlowCytobot records images for all particles above laser scattering and/or Chl a fluorescence trigger levels, with consistent image focus enabled by the hydrodynamic focusing principle of the conventional flow cytometric approach of sample injection into a sheath flow (the scattering and fluorescence data are preserved for further analysis). IFCB is a fully automated, submersible instrument with built-in design features (e.g., self-cleaning, onboard analysis of standard beads) that enable long (> 6 months) unattended deployments in the ocean. It is also routinely operated in flow-through systems during ship surveys.
• The CytoSense (and CytoSub which is a submersible version) measures FSC, SSC and multiple fluorescence signals. The scatter/fluorescence scans (pulse shape) show one-dimensional morphology and optical features of big cells, colonies, chains and filaments, converging to “normal” flow cytometry data (totals) for picoplankton. The optional camera makes bright field images of individual particles, hydrodynamically focused along their long axis by low shear acceleration in sheath fluid of particles. At high concentrations of particles which are detected at a fast rate (up to 10 k/s), all particles cannot be imaged and specific values of the optical scans are preselected to act as a trigger. Optical scattering and fluorescence output as well as imaging data are considered as the output of this instrument, while the combination of both properties will increase the classification efficiency.
• The FlowCam uses a similar imaging principle as the Imaging FlowCytoBot (but lacks the hydrodynamic focusing provided by the sheath flow). Images are acquired either continuously (autotrigger mode) or after the detection of a fluorescent (Chl a) particle. FlowCam-nano and FlowCam-macro use only the autotrigger mode, respectively, to take pictures of smaller and larger objects and organisms.
• The ZooCAM uses an imaging principle similar to that of FlowCam-Macro.
Notably, depending on the trigger mode of these different IFC instruments, only some of the plankton may be characterized. When fluorescence triggering is used, organisms and particles with undetectable fluorescence will be missed (Reynolds et al., 2010). This does not apply if all organisms and particles are imaged by using scattering signals as an image trigger (e.g., “auto-trigger mode” for FlowCam, “unsupervised mode” for CytoSense).
3.4.2.2. Laboratory and in situ imaging systems
In order to obtain quantitative information on plankton > 100 μm, larger volumes of water need to be examined than is possible with IFCs. In situ imaging is non-destructive and can be combined with net sampling. However, there are numerous challenges. The most important criterion is the optimization of the trade-off between sensitivity, resolution, contrast and depth of field so that image quality allows taxonomic identification while the imaged volume is large enough for statistically relevant estimations of concentrations.
High magnification imaging at short distances results in a depth of field (DOF) of only a few millimeters and thus, in a high proportion of out-of-focus images not limited to the DOF (e.g., Schulz, 2013). To avoid motion blurring, short shutter speeds of a few microseconds are required (e.g., Davis et al., 1992; Schulz, 2013). Illumination adapted to the in situ and towing conditions should guarantee the image quality and high signal-to-noise ratio of the camera. Imaging systems can be adapted to illuminate a calibrated volume of water for more precise quantification of plankton and particles (Picheral et al., 2010). Due to the above-described trade-offs, in situ systems have a relatively restricted size range of operation and focus either on small size classes with a small volume imaged (e.g., CPICS, LOKI), where imaging of sizes less than a few millimeters with a high depth of field is close to the feasible border of the physical laws of optics (Schulz, 2013), or target larger fields of views with less details on organism morphology.
Another method to overcome the in situ constrains is to use imaging methods on net-collected plankton samples. In this case the conditions required for an optimal field of view and DOF may be met. However, net tows integrate the plankton over towing distances and can be intrusive, damaging some of the collected organisms. Plankton samples from nets may be imaged either by flow-through chambers (e.g., FlowCam-Macro, LOKI) or plankton scanners such as the ZooScan (Gorsky et al., 2010). Flow-through techniques limit the maximal size of organisms observable to the minimal diameter of its tubing. To avoid clogging, larger individuals are removed prior to analysis. Scanner-based approaches cannot be used in situ and are difficult to use at sea. Samples therefore have to be treated with fixatives that can modify the chemical composition of organisms, their color and, in some cases, their morphology. in situ imaging provides an alternative to study fragile taxa, such as gelatinous organisms, which may be damaged or destroyed by net tows (Remsen et al., 2004; Stemmann et al., 2008a).
In the following section, a selection of plankton imaging devices (other than the IFCs discussed above) that are commercially available, along with their imaging approach, are briefly introduced (more details are available in Table 1). As a general rule, information content on plankton increases with increasing volume and imaging frequency and with decreasing pixel-size. Additional desirable features are that the object be in focus with enhanced contrast and in color. Devices with a pixel size of > 50 μm are designed to study macro-plankton and large aggregates, while those with a pixel size of 5 μm can also resolve micro-plankton.
• The in situ Ichthyoplankton Imaging System (ISIIS; Cowen and Guigand, 2008) uses line scan cameras to produce shadowgraph images of plankton. The camera has a field of view of 13 × 13 cm with a depth-of-field of 50 cm and uses a 2,048 × 2,048 pixel sensor, resulting in a 63.5 μm pixel resolution. The system is equipped with environmental sensors, including CTD, fluorometer, dissolved oxygen, and PAR sensors. The volume resolution of the image captures a wide taxonomic range of mesozooplankton and with lower resolution, large protists and cyanobacteria (Luo et al., 2017). The data are transferred to an onboard computer via fiber optic in real time while the platform is being towed at 2.5 m s −1, either undulating or at fixed-depth mode to a maximum depth of 150 m.
• The CPICS (Continuous Plankton Imaging and Classification Sensor, Grossmann et al., 2015) is based on a 6 Mpixel color camera and precisely aligned structured illumination to produce a darkfield image with high magnification (between 20X and 0.16X) that images respectively a small volume of seawater (between 2.6 10−5 μl and 34 ml depending on magnification) at high frequency [10 frames per second (fps)]. This instrument is deployed in situ (on rosette, ROV, AUV, glider or other autonomous vehicle, or buoy) with the possibility for real-time data link to vessel or shore.
• The Video Plankton Recorder II (VPR) is based on dark-field-illumination, operates a 1MPix (10 Bit b/w or color) camera (Davis et al., 2005) and images objects with 25 fps non-invasively and undisturbed in the water column. It images a small volume of seawater (app. 1 ml to 350 ml depending on calibration), and images are sent in real time onboard or shore via a fiber optic tow cable while the Digital Autonomous Video Plankton Recorder (DAVPR) is fully self contained.
• The Underwater Vision Profiler 5 HD (UVP, Picheral et al., 2010) operates a 4 MPix camera imaging a field of view of approximately 180 × 180 mm2 about 200 mm in front of the camera. The UVP sizes marine snow, aggregates > 100μm and images plankton > 500 μm. It can be integrated on a CTD-Rosette system as a standard sensor delivering images indexed to the different environmental data collected at a rate of 20 images s−1. Its depth range is 6,000 m. The UVP6-LP (low power) is a miniaturized and low power version which is designed to be deployed on ARGO float moorings, AUVs or gliders.
• The Lightframe On-sight Keyspecies Investigation (LOKI) system (Schulz et al., 2010) uses a flow-through chamber with an upstream plankton net. LOKI operates an industrial camera with up to 6 Mpixels at 15 μs shutter time, combined with a tailored high power LED flash unit to image a volume of approximately 20 × 20 × 5 mm3 in a flow-through chamber. Images of the LOKI system often allow the identification of fine morphological features as well as discrimination of developmental stages, sex and, in some cases, investigation of internal body structures (e.g., Schmid et al., 2018).
• In recent years two commercial systems have emerged which image particles using holography, which allows for 3-D reconstruction (see Sun et al., 2008) that can image micro-plankton. They take images at very short shutter times, scanning for a relatively large volume. The systems are the LISST-HOLO (now in its 2nd version, Sequoia Sci., 4.4 μm pixel size, 1,600 × 1,200 pixel frames, 20 fps) and the HoloSea (4Deep, 1.5 μm pixel size, 2,048 × 2,048 pixel frames, 22 fps). Given their novelty, only a small number of publications have been produced using them or their prototype systems (Bochdansky et al., 2017; Davies and Nepstad, 2017). Automated image reconstruction and recognition requires significant computational power, an issue that is likely to be alleviated in the near future.
• The ZooScan (Gorsky et al., 2010) is a plankton scanner which takes a high-resolution image of net- or bottle-collected plankton samples with a pixel size of 10.6 μm. It has built-in features making it possible to standardize the images of different ZooScans to remote control the image generation and to build a common image databases.
4. Requirements For Plankton Observing Systems
4.1. A Holistic View of Planktonic Communities
Our current vision of planktonic ecosystems is fragmented largely because of observational constraints. The concentration of organisms decreases with size, and therefore it is practically impossible to sample the full ecosystem, from sub-micrometer to meter-sized colonies of organisms, within a single sampling strategy or with a single methodology (the larger the organism, the larger the volume that needs to be sampled). Second, scientists often focus on a preferred taxonomic or functional range, leading to a kind of taxonomical blindness, with many details for some organisms and very few details for the ones not present in the taxonomical expertise of the specialist. The same is true for models (deYoung et al., 2004). We therefore recommend the adoption of a sustained sampling and analysis plan designed to cover the whole planktonic community, along with characterizing their environment, and incorporate ecosystem modeling in the design (e.g., Karsenti et al., 2011). Few examples of such holistic studies exist (e.g., Waite et al., 2007; D'Alelio et al., 2015; Romagnan et al., 2015). Without such complete sampling of the planktonic community, the quantification of phytoplankton and zooplankton abundance or diversity, which are GOOS EOVs and GCOS ECV, could be biased.
4.2. Interfacing With Modeling Efforts
Marine plankton models are used to address a broad set of issues, ranging from basic science questions including those related to the dynamics of plankton blooms, plankton phenology and species succession (Bopp et al., 2005; Follows et al., 2007; Hashioka et al., 2013; Briseño-Avena et al., 2015; Kuhn et al., 2015), global nitrogen cycling (Jickells et al., 2017; Bianchi et al., 2018), zooplankton vertical migration (Bianchi et al., 2013), the generation of hypoxia (Fennel and Testa, 2019), the quantification of the biological carbon pump (DeVries et al., 2014; Laufkötter et al., 2016), climate change projections (Bopp et al., 2013) and effects of plankton dynamics on ecosystem services related to fisheries (Megrey et al., 2007; Rose et al., 2007; Lefort et al., 2015) to very applied purposes such as the provision of forecasts and reanalyses of oceanic physico-chemical and biogeochemical-relevant variables (see Fennel et al., 2019). However, most current global models represent only limited aspects of the functional diversity of plankton via so-called plankton functional types (Le Quéré et al., 2005) to simulate primary production within the euphotic zone, the transfer of biomass to higher trophic levels, and the pathways of biological carbon sequestration in the deep ocean.
Biogeochemical models typically lack detailed descriptions of zooplankton because of the lack of relevant observations (Buitenhuis et al., 2006), and also because the prevailing paradigm within the modeling community is that global biogeochemical cycles are primarily driven by bottom-up rather than top-down controls. This paradigm is increasingly being refuted by experimental evidence (Lima-Mendez et al., 2015; Guidi et al., 2016) and model studies, which emphasize the important role of zooplankton grazing on nutrient cycling and the biological carbon pump (e.g., Le Quéré et al., 2016), phytoplankton phenology (Hashioka et al., 2013; Ward et al., 2013a) and phytoplankton diversity (Prowe et al., 2012; Vallina et al., 2014). Complex population-structured zooplankton models exist (Hofmann and Ambler, 1988; Carlotti and Wolf, 1998), and models with multiple zooplankton functional groups are increasingly being developed (e.g., Ward, 2018). However, these models have not been widely applied because of the large number of poorly constrained parameters required to describe multiple functional groups and their life stages, physiological traits and ecological interactions (Anderson, 2005; Barton et al., 2013), and because modeling numerous species/stages is computationally expensive. Trait-based modeling frameworks that can simulate an unlimited number of plankton functional types by using allometric relationships between physiological and/or morphological traits (Ward et al., 2012; Ward, 2018) are promising in this regard, but zooplankton functional groups are still underrepresented because of the complexity and heterogeneity of this group, and because the small number of observational data sets available for model development and calibration remains problematic (Carlotti and Poggiale, 2010; Barton et al., 2013; Benedetti et al., 2015; Brun et al., 2016). Most global models now represent up to three size classes of zooplankton, albeit with fixed metabolic rates (e.g., Kishi et al., 2007; Sailley et al., 2013). A further increase in model complexity may be warranted (Benedetti et al., 2018) since taxon- or functional group-specific trophic interactions with phytoplankton and diel vertical migration patterns (Bianchi et al., 2013) may be important to understanding ecosystem dynamics and global biogeochemical cycling (Guidi et al., 2016).
Furthermore, global models generally treat the mesopelagic and deep ocean as a black box because of a lack of ecological understanding of its microbial ecosystems and limited observations (Arístegui et al., 2009). In plankton models, organic matter is routed from phyto- and zooplankton to a few explicit particulate and dissolved detrital pools (Bopp et al., 2013; DeVries et al., 2014; Laufkötter et al., 2016), sometimes accounting for their variable reactivity (Aumont et al., 2017; Bianchi et al., 2018), which then transport particulate organic matter from the surface to the deep ocean via sinking. However, an accurate simulation of nutrient and plankton dynamics in the euphotic zone does not necessarily imply an accurate representation of observed export fluxes (Bagniewski et al., 2011) or consensus on its major pathways within the marine ecosystem (Laufkötter et al., 2016). Marine particle fluxes are known to display strong regional and temporal variability in response to different production regimes and their seasonality, or to the presence of OMZ (Haake et al., 1992; Van Mooy et al., 2002; Guidi et al., 2015), but this variability is not yet well represented in models. Better representations of particle dynamics (Aumont et al., 2017) and particle-plankton interactions may improve simulation of the important mechanisms governing global biogeochemical cycles of carbon and other essential elements, and may thus lead to improved model projections of ocean carbon cycling (Kriest and Evans, 2000; Gehlen et al., 2006), but carbon pathways in models still depend strongly on the data sets used for optimization (Bisson et al., 2018) and the parameterization of their ecosystem modules (Laufkötter et al., 2016).
Robust marine ecosystem/ocean biogeochemistry models that relate climate change to fish production or relating changes in the strength of the biological pump to changes in plankton community structure require an adequate description of phytoplankton, zooplankton and particle compartments in the upper kilometers of the ocean and the mesopelagic, as well as consensus on the major pathways of organic matter transport and transformation, i.e., the fluxes between them. The optimal level of complexity of global models for each biogeochemical or ecological application remains to be determined, and may vary according to the specific target application (Ward et al., 2013b). Therefore, the acquisition of quality-controlled, standardized, global in situ data is essential for the development and validation of mechanistic end-to-end models that optimize the balance between fidelity and simplicity for the continuum of the plankton food web, and within the entire water column.
In order to be useful for marine plankton models targeted for biogeochemical and fisheries applications, observation development should provide robust, global information on major taxa (concentration as well as relevant rates), the size distribution of the major plankton groups, as well as the particle size distribution at a biologically relevant spatiotemporal resolution (Capotondi et al., 2019; Fennel et al., 2019). Imaging and other techniques detailed above provide such information even for the deep ocean based on data from in situ devices. Yet many observational data sets still lack robust quantification of their uncertainty range, which is essential for model calibration, and some observations are still of limited use for model applications due to the lack of a common set of comparable standard products. A close collaboration between modelers and experimentalists can guarantee the usefulness of data products for this important user group, and thus a better quantification of the present and future biogeochemical functioning of the ocean and health of its ecosystem (Siegel et al., 2014).
4.3. Achieving a Globally Consistent and Holistic Plankton Observing System:
Given the TRL of the technologies for the observation of plankton biomass and diversity reviewed above, these types of technologies are ready to be included in a global observation network (Miloslavich et al., 2018).
As a first step, integration of plankton measurements into existing global observing systems (e.g., GO-SHIP Sloyan et al., 2019, OCEAN-SITES, BGC-ARGO Roemmich et al., 2019) could serve as the vehicle to ensure wider integration in the future. Observing systems are international and distributed (i.e., do not depend on a single nation), therefore requiring a high level of international coordination and standardization. Such efforts could have a direct benefit for smaller scale observing systems if the lessons learned and data infrastructure were shared with them.
Ocean sites where time series observations are conducted (Benway et al., 2019) provide natural foci for experimental process studies. If possible, observational technologies should be augmented with measurements of functional interactions and rate processes (e.g., primary and net community production, growth and grazing rates, predator-prey interactions, export fluxes) since understanding such processes is critical to linking ocean observations with functional models of biogeochemistry and ocean food webs.
The observations should follow basic procedures in order to guarantee the best comparable outputs for present and future studies:
1. Methods should be standardized across the whole observing system and should be validated outside of the lab which developed them. Where necessary, protocols of best practice should be produced and made widely available (e.g., OceanBestPractices, 2018). Standards for each measurement should be defined so that all related measurements can be quantitatively compared with respect to the standard. Standardization of methods should include standardizing the methodology for quality control and of data curation.
2. Plankton samples should be associated with environmental variables acquired simultaneously (e.g., from remote and local sensors). More information about the environment as well as the plankton (e.g., using different sensing and sampling methodologies) will lead to deeper understanding of the plankton and their relation to the environment.
3. Sampling should include as complete a spectrum of plankton as possible, spanning size and function, across a variety of places, depths and times. De-correlation scales in time and space should be taken into consideration to maximize the use of resources. Sustainable observations at specific locations and along transects enable the quantification of temporal trends.
4. Methods should be cross-compared (e.g., nets, CPR, imaging systems) and inter-calibrated to ensure that uncertainties and potential bias are known. When using proxies for particles and plankton properties (e.g., bio-optics and bio-acoustics), periodic ground-truth ensures biases are constrained. Measurements of related/complementary variables (e.g., pigment concentration, POC and phytoplankton volume from FCMs and IFCs of surface samples, bio-acoustic and quantitative imaging) can be used to point out anomalous data for flagging if the different measurements are not consistent with established relationships.
5. Protocols for adopting new technology should be in place (e.g., how long should there be side-by-side deployment and inter-comparison before replacement of old with new). These documents should identify the advantages and limitations of the measurements to provide realistic quantified uncertainties. There are a few existing inter-comparisons between existing sampling devices (notably between nets, e.g., Stehle et al., 2007 and references therein) which have been conducted, with few exceptions, years after the introduction of the new technology. Similarly, imaging techniques have seldom been inter-compared and calibrated with field-specific standards (e.g., Colas et al., 2018), and the inter-comparison has often taken place long after the introduction of a new device (e.g., Schultes and Lopes, 2009; Reynolds et al., 2010; García-Comas et al., 2011; Forest et al., 2012; Thyssen et al., 2014; Le Bourg et al., 2015).
6. Because of the potential improvement of techniques and changes in scientific interests, it is very important that physical plankton samples obtained with nets or water samples be properly archived for future reanalysis. Similarly, as image analysis methods improve, images (or optical properties) could be reanalyzed at later dates.
5. Challenges
5.1. Deciding on What to Measure With a Finite Budget
There is a need to develop a strategy regarding the methods and measurements to be done. Prioritization should be based on: (1) cost (e.g., human capital needed, cost of analysis and/or instrument, ability to take advantage of existing already-funded efforts), (2) central variables in the context of global ecosystems (EOVs) and biogeochemical processes and (3) associated ecological information content. Emphasis should be placed on a holistic sampling program with sufficient redundancy to ensure success and reduce uncertainties. It follows that scientists versed in modeling, observations, data mining and marine resource management should be consulted to optimize this strategy, which will likely involve both in situ observations as well as samples for laboratory analysis.
5.2. Sampling Design and Constraints
Counting statistics indicate that, to treat a population as continuous, about 400 individual particles need to be enumerated in the volume analyzed (Siegel, 1998). This requirement means that while the distribution of bacteria can be assessed with samples as small as a milliliter, to sample macro-zooplankton, hundreds of liters may be necessary. Spatial heterogeneity further increases the number of required samples. This constraint also means that the sampling volume will increase dramatically with the desire to obtain more resolved taxonomic information, particularly for larger organisms. Plankton nets provide means to sample large volumes (and hence large number of individuals) while selecting for specific groups that are well sampled within nets and integrating vertical and horizontal gradients. Imaging systems, while better suited for targeted spatial sampling and fragile organisms, need to be deployed in such a way as to obtain sufficient numbers of individuals and to minimize avoidance of in situ instruments by the targeted organisms (e.g., minimal physical perturbation to the environment, appropriate lighting to avoid biasing observations especially at night or at deep depth).
5.3. Managing and Integrating the Massive Data Flow Originating From a Network of Different Instruments
An integrated observation system will be useful and relevant only if the data collected are available and meet user needs. Data dissemination platforms should comply with common standards of Findability, Accessibility, Interoperability, and Reusability (FAIR; Wilkinson et al., 2016). At the moment plankton-relevant oceanographic data are scattered within different databases (e.g., OBIS, COPEPOD, PANGAEA, IGMETS, SeaBASS, BCO-DMO, EMODNET), which are data repositories of variable ease of use. Each of these data portals offers only a partial view of the ecosystem, focusing on very specific features (e.g., species presence for OBIS, zoo- and phyto-plankton biomass for COPEPOD, pigments and optical parameters in SeaBASS) and often lacking links to contextual data originating from the same sampling event or cruise. For a modeler interested in constructing a holistic view of the ecosystem during a particular field effort, they have to invest significant effort to find and access to relevant data in all the different repositories. Linking between them could significantly facilitate more complete exploitation of the data (Benway et al., 2019; Tanhua et al., 2019b). Indeed, OBIS has recently adopted the Event Core format of Darwin Core and developed the Extended Measurement or Fact Extension, enabling linking sampling facts including environmental measurements to an event hierarchy and biotic measurements (e.g., biomass, absence/presence, fatty acids, pigments) to the occurrence records (De Pooter et al., 2017). Another important limitation is the lack of uncertainties associated with the data in most data repositories as well as the lack of defined quality control annotations. Hence, the users are often left with the need to develop their own uncertainty estimates, for example to propagate in their calculations or to test model sensitivity. Beyond the necessity to integrate the data sets, users of such databases should be regularly consulted to ensure they are fit for purpose.
5.4. Curating, Validating and Distributing Imaging Data
Imaging systems deployed for oceanographic research worldwide already collect millions of images a year. Large-scale infrastructure is therefore needed to host and distribute this wealth of data. Such infrastructure should provide a collaborative way to visualize and classify images, perform quality control on these identifications, and share the resulting data in an open-access manner.
A prototype infrastructure for quantitative imaging datasets (EcoTaxa) has been developed. EcoTaxa is a web application (http://ecotaxa.obs-vlfr.fr) that allows users to store images of individual organisms and associated metadata in its database, efficiently classify these objects within a universal taxonomic reference, and export the resulting data for further analyses. It uses machine learning, combining classical approaches and Convolutional Neural Networks in a user-friendly way, to help ecologists, even those with no computer-science background, classify large numbers of images (typically >10,000/operator/day). It is meant to be collaborative, allowing an unlimited number of users to interact on the same dataset (all using the same taxonomic tree). Their work can be iterative (by correcting each other's mistakes) while always retaining the full history of identification for each object, and machine learning models can be built based on all classified images in the database.
Currently (as of Jan 25th 2019), EcoTaxa hosts >72 million images of plankton (42% of which have had their identification validated by a human operator), collected with more than seven different instruments, over the world's oceans. In 3 years, it attracted ~550 registered users from ~160 institutions. While functional, this prototype needs to be deployed more widely, on servers backed by academic institutions, and improved in various ways. For example, the database may not perform as well with billions rather than the current millions of images. The taxonomic back-end will benefit from the unification of phylogenies allowed by nucleic acid sequencing (e.g., https://unieuk.org). Finally, the machine learning back-end should benefit from various ongoing efforts to infuse more computer science knowledge into ocean sciences. The available database of images has already proved to be a good tool to foster such initiatives by providing a wealth of classified data (Elineau et al., 2018). Efforts are partly funded and underway to address the limitations outlined above.
EcoTaxa also includes a 'Particle module' (http://ecotaxa.obs-vlfr.fr/part/) intended to store, visualize, and export data originating from in situ instruments that quantify marine snow (UVP, LISST, LOPC). In this application, all data originating from the same sampling event (CTD data, marine snow abundance, and plankton identified from images) are gathered in the same dataset and can be downloaded by visitors. Data from any device counting and measuring particles can be easily integrated into this module.
5.5. Near Real-Time Data Processing
For certain applications (e.g., adaptive sampling of deployed assets), near-real-time data processing and quality control is critical. Much effort has been invested in BGC-Argo to process the biogeochemical data in near-real-time (including flagging data that are likely problematic, Roemmich et al., 2019). Similar efforts have also been invested on developing such strategies for fixed infrastructures (e.g., IOOS, 2018). Global coordination of such efforts and the addition into them of more plankton-relevant parameters will ensure optimal use of these data (e.g., Tanhua et al., 2019a). In addition, delayed-mode processing is often needed for plankton variables (e.g., once water samples needed to calibrate proxies are available).
5.6. Enhancing Capacity and Knowledge
The community with the knowledge necessary to collect, quality control, analyze and interpret plankton data is small, and the current assets to sample the world's oceans are extremely limited given the task at hand (to monitor the distribution of plankton-relevant variables in time and space throughout the world's oceans). In addition, taxonomic expertise has declined, which severely limits many types of investigations. Significant efforts in education, collaboration (sharing of expertise, computer codes, instruments, annotated image databases, etc.) and invention of sensors to be deployed for longer periods of time on autonomous platforms can help mitigate this limitation. In addition, the creation and adoption of best practices can be an important element in training to increase the uniformity and interoperability of measurements (Pearlman et al., 2018). Finally, plankton ecology needs to develop further to take full advantage of the measurements collected.
5.7. Maximizing Return on Investment
To ensure sustained and continuing investment in plankton monitoring, it is critical to enlarge the community of active users of such data. An approach could include the generation of simple indicators summarizing the complex ecological data (simple and user friendly but not simplistic) and will require the education of users through virtual tools, workshops, summer schools, and capacity building to include potential user communities and stakeholders (e.g., from modeling, resource management, environmental agencies and private companies).
6. Recommendations on How to Proceed During the Next Ten Years
Building a global observation system to describe planktonic key variables and predict the functioning of the pelagic ecosystems requires a stepwise approach with regional-scale experiments as pilot projects while engaging with existing global programs and infrastructures to increase their sampling capacity. Such pilot studies, combining in situ sensors deployed on long-endurance platforms with satellite sensors, ship cruises and in conjunction with data-assimilating biogeochemical-ecological models, will provide a scalable template from which to grow and improve upon. Acquisition of biological variables should be performed in a consistent framework to facilitate inter-comparison between methods and projects. To ensure quality of data, adherence to agreed upon best practice protocols, including specific actions such as inter-calibration, is necessary. We suggest that the following itemized strategies should be used to prioritize investments and provide below each some example activities (some may contribute to more than one priority):
6.1. Priority I: Make the Best of Existing Data, Share Publicly, Inter-calibrate/inter-compare Existing Observations and Technologies, Work on Common Protocols, Improve Accessibility of Existing Databases and Searchability of Data at Multiple Levels of Organization
Promote free data and information sharing by using open access publication strategies of both articles and source data and following a "FAIR" principle (Wilkinson et al., 2016). Build robust distributed networks for collection, distribution and curation of data (like Argo and EcoTaxa) that do not depend on one country's funding and that serve the full scientific community worldwide (see Tanhua et al., 2019b). Channel the data to global and consistent public databases such as OBIS or other existing platforms in consultation with modelers. Make sure funding agencies that require data curation from funded PIs are consulted and in agreement with adopted approach.
Ensure there are experts available to assist the larger community with quality assessment and control (QA/QC) of plankton-relevant data collected by non-specialists. For imaging in particular, ensure there is ready access to taxonomic information/expertise, and find ways to reward people who serve the community (e.g., encourage data publication with citable DOI for databases). Make lists and databases of taxa at different organization levels (for example, one with 5 taxa that are well identified and one with few tens of taxa when automatic sorting is followed by detailed human annotation).
Work on best practice documents to ensure worldwide methodology is consistent (Pearlman et al., 2018) and inter-comparable. Encourage the contributions of documented best practices to a global scale repository to facilitate consensus and adaption of common methodologies.
6.2. Priority II: Generate Novel Data in a Reasonable Way, i.e., Using Common Global Standards for Data Generation, Taxonomic Identification, Quantification of Uncertainty, Comparing Against Standards
Invest in efforts to homogenize plankton-relevant variables between national and international programs, and to inter-compare and inter-calibrate methods to ensure measurements can be integrated into a global observing system and modeling framework.
Invest in the integration of tried-and-true technologies for plankton measurements on globally coordinated programs collecting time-series and transects which currently do not measure these systematically (Weller et al., 2019). Proceed with this integration incrementally - e.g., start with one GO-SHIP line that is occupied annually and use it as an example, and as the basis for writing the appropriate protocols and the expansion to other transects and cruises. Invest in the integration of mature and calibrated sensors to AUVs to expand coverage in space and time. Take into account in planning that the synergistic value of collocated measurements, providing significantly more information than the sum of the individual measurements.
6.3. Priority III: Think About Collaboration, Co-funding and Joint Projects Between Different User Groups
Closely interact with modelers to derive and produce outputs/indices relevant to the models. Organize workshops with modelers to explain the added value of the new measurements, and interact closely with modelers to identify their needs (e.g., to ensure measurements target what models are sensitive to) and make them aware of observation efforts. Apply for co-funding for experimental and modeling studies to encourage co-involvement of both fields in the initial planning and final use of the results (e.g., Tara expeditions).
Organize summer schools and workshops, dedicated to students, early career scientists, senior scientists, but also stakeholders and policy makers, to ensure transfer of theoretical (plankton ecology, diversity and taxonomy) and technical knowledge, consistency in processing (e.g., image annotation), dissemination, and increased use of data collected. Document the material provided through the summer school in a repository (e.g., videos of classes, PDFs of materials, etc.) to support long-term opportunities for training.
Promote the exchange of expertise between northern and southern hemisphere countries by disseminating the existing expertise on plankton imaging/optical measurements to scientists and students from less-developed countries, particularly in the southern hemisphere, where the largest gaps in our knowledge still persist, but where sometimes taxonomic expertise is still strong when it has been progressively lost in northern countries.
6.4. Priority IV: Innovate and Develop New and Better Technologies for the Development of Augmented Observations
Keep innovating! Keep investing in the development of new sensor/sensing, of new analytic tools and pipelines on the use of automated optical/imaging techniques for building new biodiversity indicators.
Take advantage of developments from other fields (e.g., computer science, optical engineering, etc.) to improve our current sensing systems. Look for opportunities to reduce the costs of measurements without decreasing their quality (e.g., Wang et al., 2019), in such a way that future equipment could be embarked with as standard tools on cruises and/or autonomous platforms (floats, gliders).
Author Contributions
FL and EB coordinated and contributed equally to the writing of the manuscript. AMW, MV, JU, LS, HMS, JS, J-BR, MP, JP, MDO, BN, KOM, PM, AL-L, RKi, RML, RKu, LK-B, JSJ, MHI, J-OI, HH, LG, GG, SLG, PG, SG, KF, GD, RKC, FC, CB-A, LB, KB-B, NB, SB, SDA, LFA, and WA provided input on the full manuscript.
Conflict of Interest Statement
The authors declare that the research was conducted in the absence of any commercial or financial relationships that could be construed as a potential conflict of interest.
Acknowledgments
Much of this manuscript flows from discussions of the authors with the members of SCOR working groups 150 (TOMCAT) and 154 (P-OBS) as well as discussions with the greater community in various GOOS workshops. We also thank Mike Sieracki, Cabell Davis, Daniele Iudicone, Eric Karsenti, Sebastien Colin, Colomban de Vargas, Ulf Riebesell, Fabrice Not, David Checkley, George Jackson, Cédric Guigand, Ed Urban, Frank Muller-Karger, Sanae Chiba and Daniel Dunn, who contributed to the initial abstracts to OceanObs'19. FL is supported by the Institut Universitaire de France. EB is supported by the NASA biology and biogeochemistry program. RKi and HH were supported by the German Science Foundation through the Collaborative Research Center 754 ‘Climate-Biogeochemistry Interactions in the Tropical Ocean’. SDA acknowledges the CNRS for her sabbatical year as visiting researcher at ISYEB on the use of genomics and next generation sequencing for plankton studies. HS acknowledges support from the Simons Foundation, the U.S. National Science Foundation, and the U.S. National Oceanic and Atmospheric Administration through the Cooperative Institute for the North Atlantic Region. FL and EB contribution was also inspired by their years of work within the Tara Expeditions initiative.
References
Agagliate, J., Röttgers, R., Twardowski, M. S., and McKee, D. (2018). Evaluation of a flow cytometry method to determine size and real refractive index distributions in natural marine particle populations. Appl. Opt. 57, 1705–1716. doi: 10.1364/AO.57.001705
Aiken, J., Hardman-Mountford, N. J., Barlow, R., Fishwick, J., Hirata, T., and Smyth, T. (2008). Functional links between bioenergetics and bio-optical traits of phytoplankton taxonomic groups: an overarching hypothesis with applications for ocean colour remote sensing. J. Plankton Res. 30, 165–181. doi: 10.1093/plankt/fbm098
Alvain, S., Moulin, C., Dandonneau, Y., and Loisel, H. (2008). Seasonal distribution and succession of dominant phytoplankton groups in the global ocean: a satellite view. Glob. Biogeochem. Cycles 22. doi: 10.1029/2007GB003154
Anderson, C., Berdalet, E., Kudela, R., Cusak, C., Silke, J., O'Rourke, E., et al. (2019). Scaling up from regional case studies to a global harmful algal bloom observing system. Front. Mar. Sci.
Anderson, T. R. (2005). Plankton functional type modelling: running before we can walk? J. Plankton Res. 27, 1073–1081. doi: 10.1093/plankt/fbi076
Arístegui, J., Gasol, J. M., Duarte, C. M., and Herndld, G. J. (2009). Microbial oceanography of the dark ocean's pelagic realm. Limnol. Oceanogr. 54, 1501–1529. doi: 10.4319/lo.2009.54.5.1501
Aumont, O., van Hulten, M., Roy-Barman, M., Dutay, J.-C., Éthé, C., and Gehlen, M. (2017). Variable reactivity of particulate organic matter in a global ocean biogeochemical model. Biogeosciences 14, 2321–2341. doi: 10.5194/bg-14-2321-2017
Bagniewski, W., Fennel, K., Perry, M. J., and D'asaro, E. (2011). Optimizing models of the north atlantic spring bloom using physical, chemical and bio-optical observations from a lagrangian float. Biogeosciences 8, 1291. doi: 10.5194/bg-8-1291-2011
Ballón, M., Bertrand, A., Lebourges-Dhaussy, A., Gutiérrez, M., Ayón, P., Grados, D., et al. (2011). Is there enough zooplankton to feed forage fish populations off peru? an acoustic (positive) answer. Progr. Oceanogr. 91, 360–381. doi: 10.1016/j.pocean.2011.03.001
Barone, B., Bidigare, R. R., Church, M. J., Karl, D. M., Letelier, R. M., and White, A. E. (2015). Particle distributions and dynamics in the euphotic zone of the north pacific subtropical gyre. J. Geophys. Res. Oceans 120, 3229–3247. doi: 10.1002/2015JC010774
Barton, A. D., Pershing, A. J., Litchman, E., Record, N. R., Edwards, K. F., Finkel, Z. V., et al. (2013). The biogeography of marine plankton traits. Ecol. Lett. 16, 522–534. doi: 10.1111/ele.12063
Batten, S., Abu-Alhaija, R., Chiba, S., Edwards, M., Graham, G., Jyothibabu, R., et al. (2019). A global plankton diversity monitoring program. Front. Mar. Sci.
Batten, S., Clarke, R. A., Flinkman, J., Hays, G., John, E. H., John, A. W. G., et al. (2003). CPR sampling-the technical background, materials and methods, consistency and comparability. Progr. Oceanogr. 58, 193–215. doi: 10.1016/j.pocean.2003.08.004
Bax, N., Miloslavich, P., Muller-Karger, F., Allain, V., Appeltans, W., and Batten, S. (2019). A response to scientific and societal capacity needs for marine biological observations. Front. Mar. Sci.
Bax, N. J., Burford, M., Clementson, L., and Davenport, S. (2001). Phytoplankton blooms and production sources on the south-east australian continental shelf. Mar. Freshwater Res. 52, 451–462. doi: 10.1071/MF00001
Beaugrand, G., Conversi, A., Chiba, S., Edwards, M., Fonda-Umani, S., Greene, C., et al. (2015). Synchronous marine pelagic regime shifts in the northern hemisphere. Phil. Trans. R. Soc. B 370, 20130272. doi: 10.1098/rstb.2013.0272
Beaugrand, G., McQuatters-Gollop, A., Edwards, M., and Goberville, E. (2013). Long-term responses of north atlantic calcifying plankton to climate change. Nat. Clim. Change 3, 263. doi: 10.1038/nclimate1753
Benedetti, F., Gasparini, S., and Ayata, S. D. (2015). Identifying copepod functional groups from species functional traits. J. Plankton Res. 38, 159–166. doi: 10.1093/plankt/fbv096
Benedetti, F., Vogt, M., Righetti, D., Guilhaumon, F., and Ayata, S.-D. (2018). Do functional groups of planktonic copepods differ in their ecological niches? J. Biogeogr. 45, 604–616. doi: 10.1111/jbi.13166
Benfield, M. C., Grosjean, P., Culverhouse, P. F., Irigoien, X., Sieracki, M. E., Lopez-Urrutia, A., et al. (2007). Rapid: research on automated plankton identification. Oceanography 20, 172–187. doi: 10.5670/oceanog.2007.63
Benoit-Bird, K. J., and Lawson, G. L. (2016). Ecological insights from pelagic habitats acquired using active acoustic techniques. Ann. Rev. Mar. Sci. 8, 463–490. doi: 10.1146/annurev-marine-122414-034001
Benoit-Bird, K. J., and McManus, M. A. (2014). A critical time window for organismal interactions in a pelagic ecosystem. PLoS ONE 9:e97763. doi: 10.1371/journal.pone.0097763
Benoit-Bird, K. J., Patrick Welch, T., Waluk, C. M., Barth, J. A., Wangen, I., McGill, P., et al. (2018). Equipping an underwater glider with a new echosounder to explore ocean ecosystems. Limnol. Oceanogr. Methods 16, 734–749. doi: 10.1002/lom3.10278
Benway, H., Lorenzoni, L., White, A., Fiedler, B., Levine, N., Nicholson, D., et al. (2019). Ocean time series observations of changing 1 marine ecosystems: An era of integration, synthesis, and societal applications. Front. Mar. Sci.
Bianchi, D., Galbraith, E. D., Carozza, D. A., Mislan, K., and Stock, C. A. (2013). Intensification of open-ocean oxygen depletion by vertically migrating animals. Nat. Geosci. 6, 545. doi: 10.1038/ngeo1837
Bianchi, D., Weber, T. S., Kiko, R., and Deutsch, C. (2018). Global niche of marine anaerobic metabolisms expanded by particle microenvironments. Nat. Geosci. 11, 263. doi: 10.1038/s41561-018-0081-0
Biard, T., Stemmann, L., Picheral, M., Mayot, N., Vandromme, P., Hauss, H., et al. (2016). In situ imaging reveals the biomass of giant protists in the global ocean. Nature 532, 504. doi: 10.1038/nature17652
Bisson, K., Siegel, D. A., DeVries, T., Cael, B. B., and Buesseler, K. O. (2018). How data set characteristics influence ocean carbon export models. Glob. Biogeochem. Cycles 32, 1312–1328. doi: 10.1029/2018GB005934
Bochdansky, A. B., Clouse, M. A., and Hansell, D. A. (2017). Mesoscale and high-frequency variability of macroscopic particles (>100μm) in the ross sea and its relevance for late-season particulate carbon export. J. Mar. Syst. 166, 120–131. doi: 10.1016/j.jmarsys.2016.08.010
Bonato, S., Christaki, U., Lefebvre, A., Lizon, F., Thyssen, M., and Artigas, L. F. (2015). High spatial variability of phytoplankton assessed by flow cytometry, in a dynamic productive coastal area, in spring: the eastern english channel. Estuarine Coast. Shelf Sci. 154, 214–223. doi: 10.1016/j.ecss.2014.12.037
Bopp, L., Aumont, O., Cadule, P., Alvain, S., and Gehlen, M. (2005). Response of diatoms distribution to global warming and potential implications: a global model study. Geophys. Res. Lett. 32:L19606. doi: 10.1029/2005GL023653
Bopp, L., Resplandy, L., Orr, J. C., Doney, S. C., Dunne, J. P., Gehlen, M., et al. (2013). Multiple stressors of ocean ecosystems in the 21st century: projections with cmip5 models. Biogeosciences 10, 6225–6245. doi: 10.5194/bg-10-6225-2013
Boss, E., Haëntjens, N., Westberry, T. K., Karp-Boss, L., and Slade, W. H. (2018). Validation of the particle size distribution obtained with the laser in-situ scattering and transmission (lisst) meter in flow-through mode. Opt. Express 26, 11125–11136. doi: 10.1364/OE.26.011125
Boss, E., Picheral, M., Leeuw, T., Chase, A., Karsenti, E., Gorsky, G., et al. (2013). The characteristics of particulate absorption, scattering and attenuation coefficients in the surface ocean; contribution of the tara oceans expedition. Methods Oceanogr. 7, 52–62. doi: 10.1016/j.mio.2013.11.002
Bowler, C., Karl, D. M., and Colwell, R. R. (2009). Microbial oceanography in a sea of opportunity. Nature 459, 180. doi: 10.1038/nature08056
Boyce, D. G., Lewis, M. R., and Worm, B. (2010). Global phytoplankton decline over the past century. Nature 466:591. doi: 10.1038/nature09268
Briseño-Avena, C., Franks, P. J., Roberts, P. L., and Jaffe, J. S. (2018). A diverse group of echogenic particles observed with a broadband, high frequency echosounder. ICES J. Mar. Sci. 75, 471–482. doi: 10.1093/icesjms/fsx171
Briseño-Avena, C., Roberts, P. L., Franks, P. J., and Jaffe, J. S. (2015). Zoops-o2: a broadband echosounder with coordinated stereo optical imaging for observing plankton in situ. Methods Oceanogr. 12, 36–54. doi: 10.1016/j.mio.2015.07.001
Brownlee, E. F., Olson, R. J., and Sosik, H. M. (2016). Microzooplankton community structure investigated with imaging flow cytometry and automated live-cell staining. Mar. Ecol. Progress Ser. 550, 65–81. doi: 10.3354/meps11687
Brun, P. G., Payne, M. R., and Kiørboe, T. (2016). A trait database for marine copepods. Earth Syst. Sci. Data Discuss. 9, 99–113. doi: 10.5194/essd-9-99-2017
Bucklin, A., Lindeque, P. K., Rodriguez-Ezpeleta, N., Albaina, A., and Lehtiniemi, M. (2016). Metabarcoding of marine zooplankton: prospects, progress and pitfalls. J. Plankton Res. 38, 393–400. doi: 10.1093/plankt/fbw023
Buitenhuis, E., Le Quéré, C., Aumont, O., Beaugrand, G., Bunker, A., Hirst, A., et al. (2006). Biogeochemical fluxes through mesozooplankton. Glob. Biogeochem. Cycles 20:GB2003. doi: 10.1029/2005GB002511
Buitenhuis, E., Vogt, M., Moriarty, R., Bednarsek, N., Doney, S. C., Leblanc, K., et al. (2013). Maredat: towards a world atlas of marine ecosystem data. Earth Syst. Sci. Data 5, 227–239. doi: 10.5194/essd-5-227-2013
Capotondi, A., Jacox, M., Bowler, C., Kavanaugh, M., Lehodey, P., and Barrie, D. (2019). Observational needs supporting marine ecosystems modeling and forecasting. Front. Mar. Sci.
Carlotti, F., and Poggiale, J.-C. (2010). Towards methodological approaches to implement the zooplankton component in “end to end” food-web models. Progr. Oceanogr. 84, 20–38. doi: 10.1016/j.pocean.2009.09.003
Carlotti, F., and Wolf, K.-U. (1998). A lagrangian ensemble model of calanus finmarchicus coupled with a 1d ecosystem model. Fish. Oceanogr. 7, 191–204. doi: 10.1046/j.1365-2419.1998.00085.x
Carradec, Q., Pelletier, E., Da Silva, C., Alberti, A., Seeleuthner, Y., Blanc-Mathieu, R., et al. (2018). A global ocean atlas of eukaryotic genes. Nat. Commun. 9, 373. doi: 10.1038/s41467-017-02342-1
Cetinić, I., Perry, M. J., Briggs, N. T., Kallin, E., D'Asaro, E. A., and Lee, C. M. (2012). Particulate organic carbon and inherent optical properties during 2008 north atlantic bloom experiment. J. Geophys. Res. Oceans 117. doi: 10.1029/2011JC007771
Chase, A., Boss, E., Zaneveld, R., Bricaud, A., Claustre, H., Ras, J., et al. (2013). Decomposition of in situ particulate absorption spectra. Methods Oceanogr. 7, 110–124. doi: 10.1016/j.mio.2014.02.002
Chase, A. P., Boss, E., Cetinić, I., and Slade, W. (2017). Estimation of phytoplankton accessory pigments from hyperspectral reflectance spectra: toward a global algorithm. J. Geophys. Res. Oceans 122, 9725–9743. doi: 10.1002/2017JC012859
Chekalyuk, A., and Hafez, M. (2008). Advanced laser fluorometry of natural aquatic environments. Limnol. Oceanogr. Methods 6, 591–609. doi: 10.4319/lom.2008.6.591
Cheriton, O. M., McManus, M. A., Holliday, D. V., Greenlaw, C. F., Donaghay, P. L., and Cowles, T. J. (2007). Effects of mesoscale physical processes on thin zooplankton layers at four sites along the west coast of the u.s. Estuaries Coasts 30, 575–590. doi: 10.1007/BF02841955
Chiba, S., Batten, S., Martin, C. S., Ivory, S., Miloslavich, P., and Weatherdon, L. V. (2018). Zooplankton monitoring to contribute towards addressing global biodiversity conservation challenges. J. Plankton Res. 40, 509–518. doi: 10.1093/plankt/fby030
Claustre, H. (1994). The trophic status of various oceanic provinces as revealed by phytoplankton pigment signatures. Limnol. Oceanogr. 39, 1206–1210. doi: 10.4319/lo.1994.39.5.1206
Colas, F., Tardivel, M., Perchoc, J., Lunven, M., Forest, B., Guyader, G., et al. (2018). The zoocam, a new in-flow imaging system for fast onboard counting, sizing and classification of fish eggs and metazooplankton. Progr. Oceanogr. 166, 54–65. doi: 10.1016/j.pocean.2017.10.014
Coulter, W. H., Hogg, W. R., Moran, J. P., and Claps, W. A. (1966). Particle Analyzing Device. US Patent 3,259,842.
Cowen, R. K., and Guigand, C. M. (2008). In situ ichthyoplankton imaging system (isiis): system design and preliminary results. Limnol. Oceanogr. Methods 6, 126–132. doi: 10.4319/lom.2008.6.126
Culverhouse, P. F., Williams, R., Benfield, M., Flood, P. R., Sell, A. F., Mazzocchi, M. G., et al. (2006). Automatic image analysis of plankton: future perspectives. Mar. Ecol. Progr. Ser. 312, 297–309. doi: 10.3354/meps312297
Culverhouse, P. F., Williams, R., Reguera, B., Herry, V., and González-Gil, S. (2003). Do experts make mistakes? a comparison of human and machine indentification of dinoflagellates. Mar. Ecol. Progr. Ser. 247, 17–25. doi: 10.3354/meps247017
Cutter, G., Casciotti, K., Croot, P., Geibert, W., Heimbürger, L.-E., Lohan, M., et al. (2017) Sampling Sample-Handling Protocols for GEOTRACES Cruises. Version 3, August 2017. Toulouse: GEOTRACES International Project Office, 139 Appendices. doi: 10.25607/OBP-2.
D'Alelio, D., Mazzocchi, M. G., Montresor, M., Sarno, D., Zingone, A., Di Capua, I., et al. (2015). The green-blue swing: plasticity of plankton food-webs in response to coastal oceanographic dynamics. Mar. Ecol. 36, 1155–1170. doi: 10.1111/maec.12211
Davies, E. J., and Nepstad, R. (2017). In situ characterisation of complex suspended particulates surrounding an active submarine tailings placement site in a norwegian fjord. Reg. Stud. Mar. Sci. 16, 198–207. doi: 10.1016/j.rsma.2017.09.008
Davis, C. S., Gallager, S. M., and Solow, A. R. (1992). Microaggregations of oceanic plankton observed by towed video microscopy. Science 257, 230–232. doi: 10.1126/science.257.5067.230
Davis, C. S., Thwaites, F. T., Gallager, S. M., and Hu, Q. (2005). A three-axis fast-tow digital video plankton recorder for rapid surveys of plankton taxa and hydrography. Limnol. Oceanogr. Methods 3, 59–74. doi: 10.4319/lom.2005.3.59
De Pooter, D., Appeltans, W., Bailly, N., Bristol, S., Deneudt, K., Eliezer, M., et al. (2017). Toward a new data standard for combined marine biological and environmental datasets-expanding obis beyond species occurrences. Biodivers. Data J. 5:e10989. doi: 10.3897/BDJ.5.e10989
Deiner, K., Bik, H. M., Mächler, E., Seymour, M., Lacoursière-Roussel, A., Altermatt, F., et al. (2017). Environmental dna metabarcoding: transforming how we survey animal and plant communities. Mol. Ecol. 26, 5872–5895. doi: 10.1111/mec.14350
Delmont, T. O., Quince, C., Shaiber, A., Esen, Ö. C., Lee, S. T., Rappé, M. S., et al. (2018). Nitrogen-fixing populations of planctomycetes and proteobacteria are abundant in surface ocean metagenomes. Nat. Microbiol. 3, 804–813. doi: 10.1038/s41564-018-0176-9
DeVries, T., Liang, J.-H., and Deutsch, C. (2014). A mechanistic particle flux model applied to the oceanic phosphorus cycle. Biogeosciences 11, 5381–5398. doi: 10.5194/bg-11-5381-2014
deYoung, B., Heath, M., Werner, F., Chai, F., Megrey, B., and Monfray, P. (2004). Challenges of modeling ocean basin ecosystems. Science 304, 1463–1466. doi: 10.1126/science.1094858
Don, M. (2003). The Coulter principle: foundation of an industry. J. Assoc. Lab. Automat. 8, 72–81. doi: 10.1016/s1535-5535(03)00023-6
Dubelaar, G. B., Gerritzen, P. L., Beeker, A. E., Jonker, R. R., and Tangen, K. (1999). Design and first results of cytobuoy: a wireless flow cytometer for in situ analysis of marine and fresh waters. Cytometry 37, 247–254. doi: 10.1002/(SICI)1097-0320(19991201)37:4<247::AID-CYTO1>3.0.CO;2-9
Dugenne, M., Thyssen, M., Nerini, D., Mante, C., Poggiale, J. C., Garcia, N., et al. (2014). Consequence of a sudden wind event on the dynamics of a coastal phytoplankton community: an insight into specific population growth rates using a single cell high frequency approach. Front. Microbiol. 5:485. doi: 10.3389/fmicb.2014.00485
Edwards, M., Beaugrand, G., Helaouët, P., Alheit, J., and Coombs, S. (2013). Marine ecosystem response to the atlantic multidecadal oscillation. PLoS ONE 8:e57212. doi: 10.1371/journal.pone.0057212
Elineau, A., Desnos, C., Jalabert, L., Olivier, M., Romagnan, J.-B., Brandao, M., et al. (2018). Zooscannet: plankton images captured with the zooscan. SEANOE. doi: 10.17882/55741
Fennel, K., Gehlen, M., Brasseur, P., Brown, C., Ciavatta, S., Cossarini, G., et al. (2019). Advancing marine biogeochemical and ecosystem reanalyses and forecasts as tools for monitoring and managing ecosystem health. Front. Mar. Sci. 6:89. doi: 10.3389/fmars.2019.00089
Fennel, K., and Testa, J. M. (2019). Biogeochemical controls on coastal hypoxia. Ann. Rev. Mar. Sci. 11:105–130. doi: 10.1146/annurev-marine-010318-095138
Follows, M. J., Dutkiewicz, S., Grant, S., and Chisholm, S. W. (2007). Emergent biogeography of microbial communities in a model ocean. science 315, 1843–1846. doi: 10.1126/science.1138544
Foote, K. G. (2000). “7-Optical methods,” in ICES Zooplankton Methodology Manual, eds R. Harris, P. Wiebe, J. Lenz, H. R. Skjoldal and M. Huntley (London: Academic Press), 259–295. doi: 10.1016/B978-012327645-2/50008-6
Forest, A., Stemmann, L., Picheral, M., Burdorf, L., Robert, D., Fortier, L., et al. (2012). Size distribution of particles and zooplankton across the shelf-basin system in southeast beaufort sea: combined results from an underwater vision profiler and vertical net tows. Biogeosciences 9, 1301–1320. doi: 10.5194/bg-9-1301-2012
García-Comas, C., Stemmann, L., Ibanez, F., Berline, L., Mazzocchi, M. G., Gasparini, S., et al. (2011). Zooplankton long-term changes in the nw mediterranean sea: decadal periodicity forced by winter hydrographic conditions related to large-scale atmospheric changes? J. Mar. Syst. 87, 216–226. doi: 10.1016/j.jmarsys.2011.04.003
Gardner, W. D., Richardson, M. J., Mishonov, A. V., and Biscaye, P. E. (2018). Global comparison of benthic nepheloid layers based on 52 years of nephelometer and transmissometer measurements. Progr. Oceanogr. 168, 100–111. doi: 10.1016/j.pocean.2018.09.008
Gehlen, M., Bopp, L., Emprin, N., Aumont, O., Heinze, C., and Ragueneau, O. (2006). Reconciling surface ocean productivity, export fluxes and sediment composition in a global biogeochemical ocean model. Biogeosciences 3, 521–537. doi: 10.5194/bg-3-521-2006
Gieskes, W. W. C., and Kraay, G. W. (1983). Dominance of cryptophyceae during phytoplankton spring bloom in the central north sea detected by hplc analysis of pigments. Mar. Biol. 75, 179–185. doi: 10.1007/BF00406000
Gorsky, G., Ohman, M. D., Picheral, M., Gasparini, S., Stemmann, L., Romagnan, J.-B., et al. (2010). Digital zooplankton image analysis using the zooscan integrated system. J. Plankton Res. 32, 285–303. doi: 10.1093/plankt/fbp124
Graff, J. R., Westberry, T. K., Milligan, A. J., Brown, M. B., Dall'Olmo, G., vanDongen-Vogels, V., et al. (2015). Analytical phytoplankton carbon measurements spanning diverse ecosystems. Deep Sea Res. I Oceanogr. Res. Pap. 102, 16–25. doi: 10.1016/j.dsr.2015.04.006
Green, R. E., Sosik, H. M., Olson, R. J., and DuRand, M. D. (2003). Flow cytometric determination of size and complex refractive index for marine particles: comparison with independent and bulk estimates. Appl. Opt. 42, 526–541. doi: 10.1364/AO.42.000526
Groom, S., Sathyendranath, S., Ban, Y., Bernard, S., Brewin, R., and Brotas, V. (2019). Ocean colour: current status and future perspective. Front. Mar. Sci.
Grossmann, M. M., Gallager, S. M., and Mitarai, S. (2015). Continuous monitoring of near-bottom mesoplankton communities in the east china sea during a series of typhoons. J. oceanogr. 71, 115–124. doi: 10.1007/s10872-014-0268-y
Guidi, L., Chaffron, S., Bittner, L., Eveillard, D., Larhlimi, A., Roux, S., et al. (2016). Plankton networks driving carbon export in the oligotrophic ocean. Nature 532, 465. doi: 10.1038/nature16942
Guidi, L., Legendre, L., Reygondeau, G., Uitz, J., Stemmann, L., and Henson, S. A. (2015). A new look at ocean carbon remineralization for estimating deepwater sequestration. Glob. Biogeochem. Cycles 29, 1044–1059. doi: 10.1002/2014GB005063
Haake, B., Ittekkot, V., Ramaswamy, V., Nair, R., and Honjo, S. (1992). Fluxes of amino acids and hexosamines to the deep arabian sea. Mar. Chem. 40, 291–314. doi: 10.1016/0304-4203(92)90028-9
Haëntjens, N., Boss, E., and Talley, L. D. (2017). Revisiting ocean color algorithms for chlorophyll a and particulate organic carbon in the southern ocean using biogeochemical floats. J. Geophys. Res. Oceans 122, 6583–6593. doi: 10.1002/2017JC012844
Hashioka, T., Vogt, M., Yamanaka, Y., Le Quere, C., Buitenhuis, E. T., Aita, M., et al. (2013). Phytoplankton competition during the spring bloom in four plankton functional type models. Biogeosciences 10, 6833–6850. doi: 10.5194/bg-10-6833-2013
Henriksen, P., Riemann, B., Kaas, H., Sørensen, H. M., and Sørensen, H. L. (2002). Effects of nutrient-limitation and irradiance on marine phytoplankton pigments. J. Plankton Res. 24, 835–858. doi: 10.1093/plankt/24.9.835
Hofmann, E. E., and Ambler, J. W. (1988). Plankton dynamics on the outer southeastern us continental shelf. part ii: a time-dependent biological model. J. Mar. Res. 46, 883–917. doi: 10.1357/002224088785113351
Holliday, D. V., Donaghay, P. L., Greenlaw, C. F., Napp, J. M., and Sullivan, J. M. (2009). High-frequency acoustics and bio-optics in ecosystems research. ICES J. Mar. Sci. 66, 974–980. doi: 10.1093/icesjms/fsp127
Hostetler, C. A., Behrenfeld, M. J., Hu, Y., Hair, J. W., and Schulien, J. A. (2018). Spaceborne lidar in the study of marine systems. Ann. Rev. Mar. Sci. 10, 121–147. doi: 10.1146/annurev-marine-121916-063335
Houliez, E., Lizon, F., Thyssen, M., Artigas, L., and Schmitt, S. (2012). Spectral fluorometric characterization of haptophyte dynamics using the fluoroprobe: an application in the eastern english channel for monitoring phaeocystis globosa. J. Plankton Res. 34, 136–151. doi: 10.1093/plankt/fbr091
Hunter-Cevera, K. R., Neubert, M. G., Olson, R. J., Solow, A. R., Shalapyonok, A., and Sosik, H. M. (2016). Physiological and ecological drivers of early spring blooms of a coastal phytoplankter. Science 354, 326–329. doi: 10.1126/science.aaf8536
Hurd, D. C., and Spencer, D. W. editors (1991). Marine Particles: Analysis and Characterization, Vol. 63. Washington DC: American Geophysical Union.
IOOS (2018). Quality Assurance/Quality Control of Real Time Oceanographic Data. Available online at: https://ioos.noaa.gov/project/qartod/ (accessed October 30, 2018).
Jain, M., Olsen, H. E., Paten, B., and Akeson, M. (2016). The oxford nanopore minion: delivery of nanopore sequencing to the genomics community. Genome Biol. 17, 239. doi: 10.1186/s13059-016-1103-0
Jech, J. M., Lawson, G. L., Lavery, A. C., and editor: David Demer, H. (2017). Wideband (15-260 khz) acoustic volume backscattering spectra of northern krill (meganyctiphanes norvegica) and butterfish (peprilus triacanthus). ICES J. Mar. Sci. 74, 2249–2261. doi: 10.1093/icesjms/fsx050
Jeffrey, S. W., Mantoura, R. F. C., and Wright, S. W. (eds.). (1997). Phytoplankton Pigments in Oceanography: Guidelines to Modern methods. Paris: UNESCO.
Ji, Y., Ashton, L., Pedley, S. M., Edwards, D. P., Tang, Y., Nakamura, A., et al. (2013). Reliable, verifiable and efficient monitoring of biodiversity via metabarcoding. Ecol. Lett. 16, 1245–1257. doi: 10.1111/ele.12162
Jickells, T., Buitenhuis, E., Altieri, K., Baker, A., Capone, D., Duce, R., et al. (2017). A reevaluation of the magnitude and impacts of anthropogenic atmospheric nitrogen inputs on the ocean. Glob. Biogeochem. Cycles 31, 289–305. doi: 10.1002/2016GB005586
Johnson, M. H. (1948). Sound as a tool in marine ecology, from data on biological noises and the deep scattering layer. J. Mar. Rese. 7, 443–458.
Kaartvedt, S. (2000). Life history of calanus finmarchicus in the norwegian sea in relation to planktivorous fish. ICES J. Mar. Sci. 57, 1819–1824. doi: 10.1006/jmsc.2000.0964
Karsenti, E., Acinas, S. G., Bork, P., Bowler, C., De Vargas, C., Raes, J., et al. (2011). A holistic approach to marine eco-systems biology. PLoS Biol. 9:e1001177. doi: 10.1371/journal.pbio.1001177
Kiko, R., Biastoch, A., Brandt, P., Cravatte, S., Hauss, H., Hummels, R., et al. (2017). Biological and physical influences on marine snowfall at the equator. Nat. Geosci. 10, 852. doi: 10.1038/ngeo3042
Kishi, M. J., Kashiwai, M., Ware, D. M., Megrey, B. A., Eslinger, D. L., Werner, F. E., et al. (2007). Nemuro-a lower trophic level model for the north pacific marine ecosystem. Ecol. Model. 202, 12–25. doi: 10.1016/j.ecolmodel.2006.08.021
Kriest, I., and Evans, G. T. (2000). A vertically resolved model for phytoplankton aggregation. J. Earth Syst. Sci. 109, 453–469. doi: 10.1007/BF02708333
Kuhn, A. M., Fennel, K., and Mattern, J. P. (2015). Model investigations of the north atlantic spring bloom initiation. Progr. Oceanogr. 138, 176–193. doi: 10.1016/j.pocean.2015.07.004
Laney, S. R., and Sosik, H. M. (2014). Phytoplankton assemblage structure in and around a massive under-ice bloom in the chukchi sea. Deep Sea Res. II Top. Stud. Oceanogr. 105, 30–41. doi: 10.1016/j.dsr2.2014.03.012
Laufkötter, C., Vogt, M., Gruber, N., Aumont, O., Bopp, L., Doney, S. C., et al. (2016). Projected decreases in future marine export production: the role of the carbon flux through the upper ocean ecosystem. Biogeosciences 13, 4023–4047. doi: 10.5194/bg-13-4023-2016
Laviale, M., and Neveux, J. (2011). Relationships between pigment ratios and growth irradiance in 11 marine phytoplankton species. Mar. Ecol. Progr. Ser. 425, 63–77. doi: 10.3354/meps09013
Le Bourg, B., Cornet-Barthaux, V., Pagano, M., and Blanchot, J. (2015). Flowcam as a tool for studying small (80–1000 μm) metazooplankton communities. J. Plankton Res. 37, 666–670. doi: 10.1093/plankt/fbv025
Le Quéré, C., Buitenhuis, E. T., Moriarty, R., Alvain, S., Aumont, O., Bopp, L., et al. (2016). Role of zooplankton dynamics for southern ocean phytoplankton biomass and global biogeochemical cycles. Biogeosciences 13, 4111–4133. doi: 10.5194/bg-13-4111-2016
Le Quéré, C., Harrison, S. P., Colin Prentice, I., Buitenhuis, E. T., Aumont, O., Bopp, L., et al. (2005). Ecosystem dynamics based on plankton functional types for global ocean biogeochemistry models. Glob. Change Biol. 11, 2016–2040. doi: 10.1111/j.1365-2486.2005.1004.x
Lefort, S., Aumont, O., Bopp, L., Arsouze, T., Gehlen, M., and Maury, O. (2015). Spatial and body-size dependent response of marine pelagic communities to projected global climate change. Glob. Change Biol. 21, 154–164. doi: 10.1111/gcb.12679
Leroux, R., Gregori, G., Leblanc, K., Carlotti, F., Thyssen, M., Dugenne, M., et al. (2018). Combining laser diffraction, flow cytometry and optical microscopy to characterize a nanophytoplankton bloom in the northwestern mediterranean. Progr. Oceanogr. 163, 248–259. doi: 10.1016/j.pocean.2017.10.010
Lima-Mendez, G., Faust, K., Henry, N., Decelle, J., Colin, S., Carcillo, F., et al. (2015). Determinants of community structure in the global plankton interactome. Science 348, 1262073. doi: 10.1126/science.1262073
Lu, H., Giordano, F., and Ning, Z. (2016). Oxford nanopore minion sequencing and genome assembly. Genomics Proteomics Bioinform. 14, 265–279. doi: 10.1016/j.gpb.2016.05.004
Luo, J. Y., Irisson, J.-O., Graham, B., Guigand, C., Sarafraz, A., Mader, C., et al. (2017). Automated plankton image analysis using convolutional neural networks. Limnol. Oceanogr. Methods 16, 814–827. doi: 10.1002/lom3.10285
MacIntyre, H. L., Lawrenz, E., and Richardson, T. L. (2010). “Taxonomic discrimination of phytoplankton by spectral fluorescence,” in Chlorophyll a Fluorescence in Aquatic Sciences: Methods and Applications, eds D. J. Suggett, O. Prášil, and M. A. Borowitzka (Dordrecht: Springer Netherlands), 129–169.
Mackas, D. L., and Beaugrand, G. (2010). Comparisons of zooplankton time series. J. Mar. Syst. 79, 286–304. doi: 10.1016/j.jmarsys.2008.11.030
Mackey, M., Mackey, D., Higgins, H., and Wright, S. (1996). Chemtax-a program for estimating class abundances from chemical markers: application to hplc measurements of phytoplankton. Mar. Ecol. Progr. Ser. 144, 265–283. doi: 10.3354/meps144265
Megrey, B. A., Rose, K. A., Klumb, R. A., Hay, D. E., Werner, F. E., Eslinger, D. L., et al. (2007). A bioenergetics-based population dynamics model of pacific herring (clupea harengus pallasi) coupled to a lower trophic level nutrient-phytoplankton-zooplankton model: Description, calibration, and sensitivity analysis. Ecol. Model. 202, 144–164. doi: 10.1016/j.ecolmodel.2006.08.020
Milligan, T., and Kranck, K. (1991). “Electro-resistance particle size analysers,” in Theory, Methods and Applications of Particle Size Analysis, ed J. P. Syvitski (Cambridge: Cambridge University Press), 109–118.
Miloslavich, P., Bax, N. J., Simmons, S. E., Klein, E., Appeltans, W., Aburto-Oropeza, O., et al. (2018). Essential ocean variables for global sustained observations of biodiversity and ecosystem changes. Glob. Change Biol. 24, 2416–2433. doi: 10.1111/gcb.14108
Möller, K. O., Schmidt, J. O., St.John, M., Temming, A., Diekmann, R., Peters, J., et al. (2015). Effects of climate-induced habitat changes on a key zooplankton species. J. Plankton Res. 37, 530–541. doi: 10.1093/plankt/fbv033
Moriarty, R., Buitenhuis, E., Quéré, C. L., and Gosselin, M.-P. (2013). Distribution of known macrozooplankton abundance and biomass in the global ocean. Earth Syst. Sci. Data 5, 241–257. doi: 10.5194/essd-5-241-2013
Moriarty, R., and O'Brien, T. (2013). Distribution of mesozooplankton biomass in the global ocean. Earth Syst. Sci. Data 5, 45. doi: 10.5194/essd-5-45-2013
Muller-Karger, F. E., Miloslavich, P., Bax, N. J., Simmons, S., Costello, M. J., Sousa Pinto, I., et al. (2018). Advancing marine biological observations and data requirements of the complementary essential ocean variables (eovs) and essential biodiversity variables (ebvs) frameworks. Front. Mar. Sci. 5:211. doi: 10.3389/fmars.2018.00211
O'Brien, T. D., Lorenzoni, L., Isensee, K., and Valdes, L. (2017). “chapter 6 southern ocean,” in What are Marine Ecological Time Series Telling us About the Ocean? A Status Report, eds T. D. O'Brien, L. Lorenzoni, K. Isensee, and L. Valdés (IOC-UNESCO, IOC Technical Series), Vol. 129, 1-297. (Available online at: https://unesdoc.unesco.org/ark:/48223/pf0000247014)
OceanBestPractices (2018). Ocean Best Practices. Available online at: https://oceanbestpractices.org/ (accessed October 30, 2018).
Ohman, M. D., Davis, R. E., Sherman, J. T., Grindley, K. R., Whitmore, B. M., Nickels, C. F., et al. (2018). Zooglider: an autonomous vehicle for optical and acoustic sensing of zooplankton. Limnol. Oceanogr. Methods 17, 69–86. doi: 10.1002/lom3.10301
Olson, R. J., and Sosik, H. M. (2007). A submersible imaging-in-flow instrument to analyze nano-and microplankton: imaging flowcytobot. Limnol. Oceanogr. Methods 5, 195–203. doi: 10.4319/lom.2007.5.195
Pearlman, J., Bushnell, M., Coppola, L., Buttigieg, P. L., Pearlman, F., Simpson, P., et al. (2018). Evolving and sustaining ocean best practices and standards for the next decade. Frontiers this issue.
Picheral, M., Guidi, L., Stemmann, L., Karl, D. M., Iddaoud, G., and Gorsky, G. (2010). The underwater vision profiler 5: an advanced instrument for high spatial resolution studies of particle size spectra and zooplankton. Limnol. Oceanogr. Methods 8, 462–473. doi: 10.4319/lom.2010.8.462
Powell, J. R., and Ohman, M. D. (2015a). Changes in zooplankton habitat, behavior, and acoustic scattering characteristics across glider-resolved fronts in the southern california current system. Progr. Oceanogr. 134, 77–92. doi: 10.1016/j.pocean.2014.12.011
Powell, J. R., and Ohman, M. D. (2015b). Covariability of zooplankton gradients with glider-detected density fronts in the southern california current system. Deep Sea Res. II Top. Stud. Oceanogr. 112, 79–90. doi: 10.1016/j.dsr2.2014.04.002
Proctor, C. W., and Roesler, C. S. (2010). New insights on obtaining phytoplankton concentration and composition from in situ multispectral chlorophyll fluorescence. Limnol. Oceanogr. Methods 8, 695–708. doi: 10.4319/lom.2010.8.0695
Prowe, A. F., Pahlow, M., Dutkiewicz, S., Follows, M., and Oschlies, A. (2012). Top-down control of marine phytoplankton diversity in a global ecosystem model. Progr. Oceanogr. 101, 1–13. doi: 10.1016/j.pocean.2011.11.016
Rembauville, M., Briggs, N., Ardyna, M., Uitz, J., Catala, P., Penkerc'h, C., et al. (2017). Plankton assemblage estimated with bgc-argo floats in the southern ocean: Implications for seasonal successions and particle export. J. Geophys. Res. Oceans 122, 8278–8292. doi: 10.1002/2017JC013067
Remsen, A., Hopkins, T. L., and Samson, S. (2004). What you see is not what you catch: a comparison of concurrently collected net, optical plankton counter, and shadowed image particle profiling evaluation recorder data from the northeast gulf of mexico. Deep Sea Res. I Oceanogr. Res. Pap. 51, 129–151. doi: 10.1016/j.dsr.2003.09.008
Reynolds, R., Stramski, D., Wright, V., and Woźniak, S. (2010). Measurements and characterization of particle size distributions in coastal waters. J. Geophys. Res. Oceans 115:C08024. doi: 10.1029/2009JC005930
Richardson, A. J., Walne, A. W., John, A., Jonas, T. D., Lindley, J. A., Sims, D. W., et al. (2006). Using continuous plankton recorder data. Progr. Oceanogr. 68, 27–74. doi: 10.1016/j.pocean.2005.09.011
Roberts, P. L.D., and Jaffe, J. S. (2008). Classification of live, untethered zooplankton from observations of multiple-angle acoustic scatter. J. Acoust. Soc. Am. 124, 796–802. doi: 10.1121/1.2945114
Roemmich, D., Alford, M., Claustre, H., Johnson, K., King, B., Moum, J., et al. (2019). On the future of argo: an enhanced global array of physical and biogeochemical sensing floats): a platform for integrated multidisciplinary ocean science. Front. Mar. Sci.
Romagnan, J. B., Legendre, L., Guidi, L., Jamet, J. L., Jamet, D., Mousseau, L., et al. (2015). Comprehensive model of annual plankton succession based on the whole-plankton time series approach. PLos ONE 10:e0119219. doi: 10.1371/journal.pone.0119219
Rose, K. A., Werner, F. E., Megrey, B. A., Aita, M. N., Yamanaka, Y., Hay, D. E., et al. (2007). Simulated herring growth responses in the northeastern pacific to historic temperature and zooplankton conditions generated by the 3-dimensional nemuro nutrient-phytoplankton-zooplankton model. Ecol. Model. 202, 184–195. doi: 10.1016/j.ecolmodel.2006.06.020
Roy, S., Llewellyn, C., Egeland, E. S., and Johnsen, G. (eds.). (2011). Phytoplankton Pigments: Characterization, Chemo- Taxonomy and Applications in Oceanography. Cambridge: Cambridge University Press.
Sailley, S. F., Vogt, M., Doney, S. C., Aita, M., Bopp, L., Buitenhuis, E. T., et al. (2013). Comparing food web structures and dynamics across a suite of global marine ecosystem models. Ecol. Model. 261, 43–57. doi: 10.1016/j.ecolmodel.2013.04.006
Schmid, M. S., Maps, F., and Fortier, L. (2018). Lipid load triggers migration to diapause in arctic calanus copepods-insights from underwater imaging. J. Plankton Res. 40, 311–325. doi: 10.1093/plankt/fby012
Schultes, S., and Lopes, R. M. (2009). Laser optical plankton counter and zooscan intercomparison in tropical and subtropical marine ecosystems. Limnol. Oceanogr. Methods 7, 771–784. doi: 10.4319/lom.2009.7.771
Schulz, J. (2013). “10-Geometric optics and strategies for subsea imaging,” in Subsea Optics and Imaging, Woodhead Publishing Series in Electronic and Optical Materials, eds J. Watson and O. Zielinski (Oxford; Cambridge; Philadelphia, PA; New Delhi: Woodhead Publishing), 243e-276e. doi: 10.1533/9780857093523.3.243
Schulz, J., Barz, K., Ayon, P., Luedtke, A., Zielinski, O., Mengedoht, D., et al. (2010). Imaging of plankton specimens with the lightframe on-sight keyspecies investigation (loki) system. J. Eur. Opt. Soc. Rapid Publ. 5:10017s. doi: 10.2971/jeos.2010.10017s
Siegel, D., Behrenfeld, M., Maritorena, S., McClain, C., Antoine, D., Bailey, S., et al. (2013). Regional to global assessments of phytoplankton dynamics from the seawifs mission. Remote Sens. Environ. 135, 77–91. doi: 10.1016/j.rse.2013.03.025
Siegel, D. A. (1998). Resource competition in a discrete environment: why are plankton distributions paradoxical? Limnol. Oceanogr. 43, 1133–1146. doi: 10.4319/lo.1998.43.6.1133
Siegel, D. A., Buesseler, K. O., Doney, S. C., Sailley, S. F., Behrenfeld, M. J., and Boyd, P. W. (2014). Global assessment of ocean carbon export by combining satellite observations and food-web models. Glob. Biogeochem. Cycles 28, 181–196. doi: 10.1002/2013GB004743
Sieracki, C. K., Sieracki, M. E., and Yentsch, C. S. (1998). An imaging-in-flow system for automated analysis of marine microplankton. Mar. Ecol. Progr. Ser. 168, 285–296. doi: 10.3354/meps168285
Sieracki, M. E., Benfield, M., Hanson, A., Davis, C., Pilskaln, C. H., Checkley, D., et al. (2010). Optical plankton imaging and analysis systems for ocean observation. Proc. Ocean Obs 9, 21–25. doi: 10.5270/OceanObs09.cwp.81
Sloyan, B., Wanninkhof, R., Kramp, M., Johnson, J., Talley, L., Tanhua, T., et al. (2019). The global ocean ship-based hydrographic investigations program (go-ship): a platform for integrated multidisciplinary ocean science. Front. Mar. Sci.
Sosik, H. M., and Olson, R. J. (2007). Automated taxonomic classification of phytoplankton sampled with imaging-in-flow cytometry. Limnol. Oceanogr. Methods 5, 204–216. doi: 10.4319/lom.2007.5.204
Stehle, M., Dos Santos, A., and Queiroga, H. (2007). Comparison of zooplankton sampling performance of longhurst–hardy plankton recorder and bongo nets. J. Plankton Res. 29, 169–177. doi: 10.1093/plankt/fbm004
Stemmann, L., and Boss, E. (2011). Plankton and particle size and packaging: from determining optical properties to driving the biological pump. Ann. Rev. Mar. Sci 4, 263–290. doi: 10.1146/annurev-marine-120710-100853
Stemmann, L., Hosia, A., Youngbluth, M., Søiland, H., Picheral, M., and Gorsky, G. (2008a). Vertical distribution (0–1000 m) of macrozooplankton, estimated using the underwater video profiler, in different hydrographic regimes along the northern portion of the mid-atlantic ridge. Deep Sea Res. II Top. Stud. Oceanogr. 55, 94–105. doi: 10.1016/j.dsr2.2007.09.019
Stemmann, L., Youngbluth, M., Robert, K., Hosia, A., Picheral, M., Paterson, H., et al. (2008b). Global zoogeography of fragile macrozooplankton in the upper 100–1000 m inferred from the underwater video profiler. ICES J. Mar. Sci. 65, 433–442. doi: 10.1093/icesjms/fsn010
Sun, H., Benzie, P. W., Burns, N., Hendry, D. C., Player, M. A., and Watson, J. (2008). Underwater digital holography for studies of marine plankton. Philos. Trans. R. Soc. Lond A Math. Phys. Eng. Sci. 366, 1789–1806. doi: 10.1098/rsta.2007.2187
Swan, C. M., Vogt, M., Gruber, N., and Laufkoetter, C. (2016). A global seasonal surface ocean climatology of phytoplankton types based on chemtax analysis of hplc pigments. Deep Sea Res. I Oceanogr. Res. Pap. 109, 137–156. doi: 10.1016/j.dsr.2015.12.002
Tanhua, T., Appeltans, W., Bax, N., Currie, K., DeYoung, B., and Dunn, D. C. (2019a). Goos, foo and governance-assessments and strategies. Front. Mar. Sci.
Tanhua, T., Pouliquen, S., Hausman, J., O'Brien, K., Bricher, P., and de Bruin, T. (2019b). Ocean fair data services. Front. Mar. Sci.
Testor, P., de Young, B., Hill, K., Rudnick, D., Glenn, S., and Hayes, D. (2019). Oceangliders: the glider component of the integrated global ocean observing system. Front. Mar. Sci.
Thyssen, M., Alvain, S., Lefèbvre, A., Dessailly, D., Rijkeboer, M., Guiselin, N., et al. (2015). High-resolution analysis of a north sea phytoplankton community structure based on in situ flow cytometry observations and potential implication for remote sensing. Biogeosciences 12, 4051–4066. doi: 10.5194/bg-12-4051-2015
Thyssen, M., Grégori, G. J., Grisoni, J. M., Pedrotti, M. L., Mousseau, L., Artigas, L. F., et al. (2014). Onset of the spring bloom in the northwestern mediterranean sea: influence of environmental pulse events on the in situ hourly-scale dynamics of the phytoplankton community structure. Front. Microbiol. 5:387.
Thyssen, M., Tarran, G. A., Zubkov, M. V., Holland, R. J., Grégori, G., Burkill, P. H., et al. (2008). The emergence of automated high-frequency flow cytometry: revealing temporal and spatial phytoplankton variability. J. Plankton Res. 30, 333–343. doi: 10.1093/plankt/fbn005
Tully, B. J., Graham, E. D., and Heidelberg, J. F. (2018). The reconstruction of 2,631 draft metagenome-assembled genomes from the global oceans. Sci. Data 5:170203. doi: 10.1038/sdata.2017.203
Uitz, J., Claustre, H., Morel, A., and Hooker, S. B. (2006). Vertical distribution of phytoplankton communities in open ocean: an assessment based on surface chlorophyll. J. Geophys. Res. Oceans 111, C08005. doi: 10.1029/2005JC003207
UNESCO (1968). Zooplankton Sampling: Review Papers of the Proceedings of the Symposium on the Hydrodynamics of Zooplankton Sampling. Monographs on Oceanographic methodology, 2. ISSN 0077-104X. Paris: UNESCO.
Vallina, S. M., Ward, B., Dutkiewicz, S., and Follows, M. (2014). Maximal feeding with active prey-switching: a kill-the-winner functional response and its effect on global diversity and biogeography. Progr. Oceanogr. 120, 93–109. doi: 10.1016/j.pocean.2013.08.001
Van Mooy, B. A., Keil, R. G., and Devol, A. H. (2002). Impact of suboxia on sinking particulate organic carbon: enhanced carbon flux and preferential degradation of amino acids via denitrification. Geochim. Cosmochim. Acta 66, 457–465. doi: 10.1016/S0016-7037(01)00787-6
Vidussi, F., Claustre, H., Manca, B. B., Luchetta, A., and Marty, J.-C. (2001). Phytoplankton pigment distribution in relation to upper thermocline circulation in the eastern mediterranean sea during winter. J. Geophys. Res. Oceans 106, 19939–19956. doi: 10.1029/1999JC000308
Waite, A., Muhling, B., Holl, C., Beckley, L., Montoya, J., Strzelecki, J., et al. (2007). Food web structure in two counter-rotating eddies based on δ15n and δ13c isotopic analyses. Deep Sea Res. II Top. Stud. Oceanogr. 54, 1055–1075. doi: 10.1016/j.dsr2.2006.12.010
Waite, A. M., Stemmann, L., Guidi, L., Calil, P. H., Hogg, A. M. C., Feng, M., et al. (2016). The wineglass effect shapes particle export to the deep ocean in mesoscale eddies. Geophys. Res. Lett. 43, 9791–9800. doi: 10.1002/2015GL066463
Wang, Z., Moustahfid, H., Mueller, A., Mowlem, M., Michel, A., and Glazer, B. T. (2019). Advancing observation of ocean biogeochemistry, biology, and ecosystems with cost-effective in situ sensing technologies. Front. Mar. Sci.
Ward, B. (2018). Ecogenie 1.0: plankton ecology in the cgenie earth system model. Geosci. Model Dev. 11, 4241–4267. doi: 10.5194/gmd-11-4241-2018
Ward, B. A., Dutkiewicz, S., and Follows, M. J. (2013a). Modelling spatial and temporal patterns in size-structured marine plankton communities: top–down and bottom–up controls. J. Plankton Res. 36, 31–47. doi: 10.1093/plankt/fbt097
Ward, B. A., Dutkiewicz, S., Jahn, O., and Follows, M. J. (2012). A size-structured food-web model for the global ocean. Limnol. Oceanogr. 57, 1877–1891. doi: 10.4319/lo.2012.57.6.1877
Ward, B. A., Schartau, M., Oschlies, A., Martin, A. P., Follows, M. J., and Anderson, T. R. (2013b). When is a biogeochemical model too complex? objective model reduction and selection for north atlantic time-series sites. Progr. Oceanogr. 116, 49–65. doi: 10.1016/j.pocean.2013.06.002
Warwick-Dugdale, J., Solonenko, N., Moore, K., Chittick, L., Gregory, A. C., Allen, M. J., et al. (2018). Long-read metagenomics reveals cryptic and abundant marine viruses. bioRxiv 345041. doi: 10.1101/345041
Weller, R., Baker, D., Glackin, M., Roberts, S., Schmitt, R., and Twigg, E. (2019). The challenge of sustaining 1 ocean observations. Front. Mar. Sci. 6:105. doi: 10.3389/fmars.2019.00105
Werdell, P. J., Proctor, C. W., Boss, E., Leeuw, T., and Ouhssain, M. (2013). Underway sampling of marine inherent optical properties on the tara oceans expedition as a novel resource for ocean color satellite data product validation. Methods Oceanogr. 7, 40–51. doi: 10.1016/j.mio.2013.09.001
Wiebe, P. H., and Benfield, M. C. (2003). From the hensen net toward four-dimensional biological oceanography. Progr. Oceanogr. 56, 7–136. doi: 10.1016/S0079-6611(02)00140-4
Keywords: plankton, imaging, OceanObs, autonomous platforms, global observing, EOVs, ECVs
Citation: Lombard F, Boss E, Waite AM, Vogt M, Uitz J, Stemmann L, Sosik HM, Schulz J, Romagnan J-B, Picheral M, Pearlman J, Ohman MD, Niehoff B, Möller KO, Miloslavich P, Lara-Lpez A, Kudela R, Lopes RM, Kiko R, Karp-Boss L, Jaffe JS, Iversen MH, Irisson J-O, Fennel K, Hauss H, Guidi L, Gorsky G, Giering SLC, Gaube P, Gallager S, Dubelaar G, Cowen RK, Carlotti F, Briseño-Avena C, Berline L, Benoit-Bird K, Bax N, Batten S, Ayata SD, Artigas LF and Appeltans W (2019) Globally Consistent Quantitative Observations of Planktonic Ecosystems. Front. Mar. Sci. 6:196. doi: 10.3389/fmars.2019.00196
Received: 08 November 2018; Accepted: 28 March 2019;
Published: 25 April 2019.
Edited by:
Laura Lorenzoni, University of South Florida, United StatesReviewed by:
Adriana Zingone, Stazione Zoologica Anton Dohrn, ItalyMichael William Lomas, Bigelow Laboratory For Ocean Sciences, United States
Copyright © 2019 Lombard, Boss, Waite, Vogt, Uitz, Stemmann, Sosik, Schulz, Romagnan, Picheral, Pearlman, Ohman, Niehoff, Möller, Miloslavich, Lara-Lpez, Kudela, Lopes, Kiko, Karp-Boss, Jaffe, Iversen, Irisson, Fennel, Hauss, Guidi, Gorsky, Giering, Gaube, Gallager, Dubelaar, Cowen, Carlotti, Briseño-Avena, Berline, Benoit-Bird, Bax, Batten, Ayata, Artigas and Appeltans. This is an open-access article distributed under the terms of the Creative Commons Attribution License (CC BY). The use, distribution or reproduction in other forums is permitted, provided the original author(s) and the copyright owner(s) are credited and that the original publication in this journal is cited, in accordance with accepted academic practice. No use, distribution or reproduction is permitted which does not comply with these terms.
*Correspondence: Fabien Lombard, lombard@obs-vlfr.fr
Emmanuel Boss, emmanuel.boss@umaine.edu