The Age-Related Perfusion Pattern Measured With Arterial Spin Labeling MRI in Healthy Subjects
 Nan Zhang1,2
  Marc L. Gordon1,3*
  Yilong Ma4
  Bradley Chi3
  Jesus J. Gomar1 Shichun Peng4
  Peter B. Kingsley3,5
  David Eidelberg3,4 Terry E. Goldberg1,3†
- 1The Litwin-Zucker Research Center, The Feinstein Institute for Medical Research, Northwell Health, Manhasset, NY, United States
- 2Department of Neurology, Tianjin Neurological Institute, Tianjin Medical University General Hospital, Tianjin, China
- 3Donald and Barbara Zucker School of Medicine at Hofstra-Northwell, Hofstra University, Hepstead, NY, United States
- 4Center for Neurosciences, The Feinstein Institute for Medical Research, Northwell Health, Manhasset, NY, United States
- 5Department of Radiology, North Shore University Hospital, Northwell Health, Manhasset, NY, United States
Aim: To analyze age-related cerebral blood flow (CBF) using arterial spin labeling (ASL) MRI in healthy subjects with multivariate principal component analysis (PCA).
Methods: 50 healthy subjects (mean age 45.8 ± 18.5 years, range 21–85) had 3D structural MRI and pseudo-continuous ASL MRI at resting state. The relationship between CBF and age was examined with voxel-based univariate analysis using multiple regression and two-sample t-test (median age 41.8 years as a cut-off). An age-related CBF pattern was identified using multivariate PCA.
Results: Age correlated negatively with CBF especially anteriorly and in the cerebellum. After adjusting by global value, CBF was relatively decreased with aging in certain regions and relatively increased in others. The age-related CBF pattern showed relative reductions in frontal and parietal areas and cerebellum, and covarying increases in temporal and occipital areas. Subject scores of this pattern correlated negatively with age (R2 = 0.588; P < 0.001) and discriminated between the older and younger subgroups (P < 0.001).
Conclusion: A distinct age-related CBF pattern can be identified with multivariate PCA using ASL MRI.
Introduction
Cerebral blood flow (CBF) refers to the rate of delivery of arterial blood to the capillary bed in brain tissue and is tightly correlated with neuronal activity and metabolism in healthy subjects. Resting state CBF is less susceptible to intra- or inter-individual differences in behavioral performance compared with task-related measures. In addition, due to the simplicity of resting state CBF, it has superior feasibility in investigating older subjects and patients with cognitive impairment. Arterial spin labeling (ASL) is a novel magnetic resonance imaging (MRI) technique to quantitatively measure CBF using arterial blood water as an endogenous tracer (Alsop et al., 2015). In contrast with other perfusion measurements, such as H215O positron emission tomography (PET), 99mTc-ethylcysteinate dimer single photon emission computed tomography (SPECT) and dynamic contrast-enhanced MRI, ASL has several advantages including (1) no expensive or potentially harmful tracers; (2) non-invasive procedure; (3) stability for tracking CBF changes over time; and (4) short scan times for repeat imaging studies (Wintermark et al., 2005).
Aging is an important risk factor for cerebrovascular disease and neurodegenerative diseases. In order to properly interpret CBF changes in these disease conditions, it is important to understand normal age-related changes in CBF (Zhang et al., 2017). Age-associated CBF reduction in the whole brain and in frontal, temporal and parietal regions has been observed in previous studies using PET, SPECT, 133Xe contrast computed tomography and ASL MRI (Pantano et al., 1984; Shaw et al., 1984; Takahashi et al., 2005; Chen et al., 2011). Of note, relatively increased regional CBF, especially in temporal lobes, has also been detected with ASL in elderly compared to younger subjects after accounting for the effect of global CBF (Preibisch et al., 2011). The effect of aging on CBF alteration measured with ASL MRI was previously investigated using univariate analysis; however, aging affects brain systems or networks rather than individual regions. The particular network of age-related CBF changes is still not well established with this imaging modality.
Univariate analysis can detect regionally specific changes in brain function but usually ignores the functional correlations between anatomical structures of interest. Scaled subprofile model (SSM) is a multivariate method based on principal component analysis (PCA) to identify significant spatial covariance patterns in functional brain images. Compared to univariate analysis, this multivariate statistical model is based on the notion that small but biologically relevant signals can be detected in functional brain images after minimizing the large variability that exists across subjects and regions (Eidelberg, 2009). It has been reported with SSM analysis that the reduced regional metabolism measured with fluorodeoxyglucose (FDG) PET showed a gradient from frontal to parieto-occipital areas in healthy aging (Moeller et al., 1996). In the current study, we assessed CBF changes with pseudo-continuous ASL (pCASL) at resting state in healthy subjects across a relatively large age span, and sought to identify the age-related CBF pattern for the first time using SSM/PCA of ASL MRI data.
Materials and Methods
Participants
Fifty healthy individuals (mean age = 45.76 ± 18.45 years, age range: 21–85, 28 females) were recruited from the Feinstein Institute for Medical Research. All participants were cognitively normal, with Mini-mental State Examination scores ≥ 24 or Mattis Dementia Rating Scale score ≥ 130. All subjects had no history of neurological diseases, mental disorders or brain injury, and refrained from alcohol, caffeine and nicotine for at least 6 h prior to MRI measurement. No infarctions or significant ischemic changes were observed on brain MRI images for any participants. For group comparisons, the subjects were divided into younger and older groups according to a median age of 41.8 years. The mean age of the younger group was 30.46 ± 5.87 years. The mean age of the older group was 61.05 ± 13.17 years. There were no significant differences in sex or educational level between these two groups (Table 1). The study was approved by the Northwell Health IRB. Informed consent was obtained from all participants.
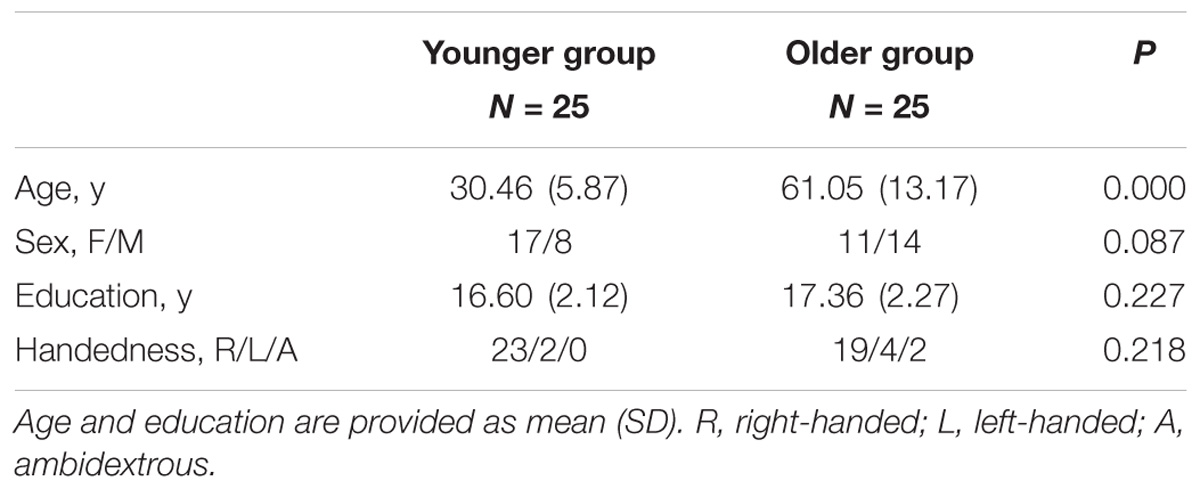
TABLE 1. Demographics of all healthy participants.
MRI Acquisition
All imaging studies were performed on a GE Twinspeed 3-T MRI scanner with HDx technology, using an 8-channel phased array head coil (GE Healthcare, Milwaukee, WI, United States). A T1-weighted 3D inversion recovery spoiled gradient recalled (IR-SPGR) series was first acquired (echo time/repetition time [TE/TR]: 2.996 ms /7.788 ms, inversion time: 450 ms, flip angle: 20°, field of view: 240 mm, voxel size: 0.9375 mm × 0.9375 mm, matrix size: 256 × 256, slice thickness: 1.5 mm, number of slices: 136) to serve as a template for co-registration with ASL imaging data. A stack of spiral, fast spin-echo images were prepared with pCASL and background suppression to measure whole brain perfusion (TE/TR: 9.804 ms/4580 ms, labeling duration: 1525 ms, post labeling delay: 1525 ms, flip angle: 155°, acquisition matrix: 128 × 128, field of view: 240 mm, voxel size: 1.875 mm × 1.875 mm, slice thickness: 4 mm, number of slices: 34, total number of CBF image volume: 1). During the resting state scan of ASL, participants had their ears plugged, and were instructed to keep their eyes closed, not to think of anything in particular, not to fall asleep, and to remain still during each series.
ASL Data Preprocessing
All images were preprocessed with statistical parametric mapping (SPM12, Institute of Neurology, London, United Kingdom) software running on a Linux computer in MATLAB (Version R2016a; MathWorks, Natick, MA, United States). ASL MRI images were converted into maps of CBF to identify changes in regional CBF. Image preprocessing was conducted as follows: (1) Co-registration: CBF images were registered to structural MRI images; (2) Normalization and Segmentation: the structural images were normalized to the standard Montreal Neurological Institute (MNI) brain template and then segmented into probability maps of gray matter, white matter and cerebrospinal fluid; (3) Normalization and Masking: the CBF images were normalized using the parameters determined from the structural images and multiplied by a binary brain tissue mask only consisting of gray matter and white matter; (4) Smoothing: the normalized CBF images were then smoothed with a 10 mm Gaussian kernel to reduce inter-individual anatomical differences and increase the signal-to-noise ratio.
Statistical Analysis
Univariate Analysis
All data analysis was performed within a gray matter mask (threshold ≥ 0.3) using SPM12 software. The relationship between CBF and age was examined using a multiple regression model with sex as a covariate. We also performed a group comparison to determine the CBF differences between older and younger groups with a two-sample t-test model, using sex as a covariate. Coordinates were reported in the standard MNI anatomical space. With a voxel-level peak threshold of P < 0.001 (uncorrected) over whole brain regions, we primarily identified clusters > 200 voxels (voxel size = 1.5 mm × 1.5 mm × 1.5 mm) for the analysis of absolute CBF and clusters > 100 voxels after adjusting for global values with ANCOVA. For a stricter criterion, we also highlighted clusters that survived a family wise error correction at P < 0.05. Significant regions were localized by Talairach–Daemon software (Research Imaging Center, University of Texas Health Science Center, San Antonio, TX, United States). The SPM maps for CBF with age were overlaid on a standard T1-weighted MRI brain template in stereotaxic space.
To quantify CBF changes in specific regions, we used a 4 mm radius spherical volume of interest centered at the peak voxel of clusters that were significant in the SPM analyses. We then calculated the relative (i.e., globally adjusted) CBF values in all participants with SPM12. The relationship between relative CBF value and age was analyzed with linear regression.
Multivariate Analysis
Scaled subprofile model, which is one of the multivariate spatial covariance techniques based on PCA, was applied to assess subject-by-voxel effects on CBF maps in all participants with Scaled Subprofile Model Principal Component Analysis (SSMPCA) toolbox1. These procedures produced a set of brain network covariance patterns and corresponding subject scores that reflect the degree to which each subject expresses these network patterns individually. Multiple regression analysis was used to identify the best set of SSM component patterns predicting age. We first tested the significance of the regression model predicting age using subject scores of the first 6 patterns that accounted for >60% of subject × voxel variance in the SSMPCA operation, and subsequently identified a subset of these 6 patterns whose linear combination provided the best correlation between the pattern score and subject age in this sample. These component patterns and their subject scores were linearly combined using the regression parameters to define an age-related pattern and corresponding subject scores. Subject scores were then z-transformed using mean and standard deviation of the whole group. The reliability of the resulting topography was evaluated by using a bootstrapping resample scheme described previously (Habeck et al., 2008). Anatomical localization and display of the age-related pattern were performed using the same procedures as for the SPM maps described above.
To clarify sex effects on CBF and PCA pattern, we also compared the differences in global CBF value and relative CBF values in specific regions, and PCA network score between female subjects and male subjects, using a general linear model with age as a covariate. The relationship between global CBF value, relative CBF values in specific regions, network score and age was further analyzed with linear regression in female subjects and male subjects, respectively.
Results
Voxel Based Changes From Univariate Analysis
Without adjusting for the global value, a negative correlation between absolute CBF and age was observed in the right middle frontal gyrus extending to middle cingulate, left inferior parietal lobule, right middle temporal gyrus, and bilateral thalamus, caudate body, and cerebellum in regression analysis (Table 2). Compared to the younger group, absolute regional CBF in bilateral superior frontal gyrus, right middle frontal gyrus, right superior temporal gyrus, and bilateral caudate body and cerebellum was decreased in the older group (Supplementary Table 1). No significant increases in absolute regional CBF with aging were observed in either regression model or group comparison.
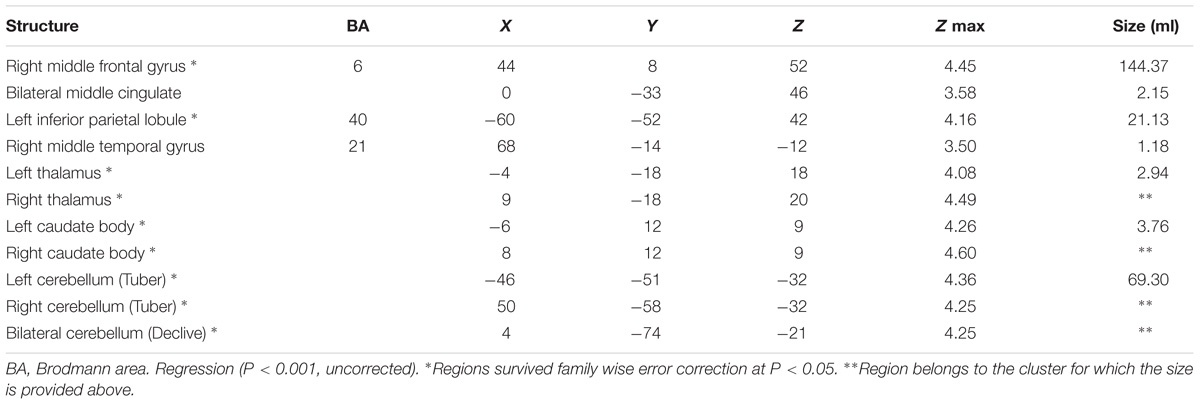
TABLE 2. Regions showing a negative correlation between absolute CBF and age.
After ANCOVA normalization for the global value, both negative and positive correlations were observed between regional CBF and age (Table 3 and Figure 1). Relative CBF in bilateral superior frontal gyrus, right middle frontal gyrus, left superior parietal lobule, bilateral inferior parietal lobules, right superior temporal gyrus, right caudate body, and bilateral cerebellum was negatively correlated with age. Regions with relatively increased CBF in aging included left anterior cingulate, bilateral middle cingulate gyrus, left insula, left superior temporal gyrus, bilateral fusiform gyrus, bilateral putamen and left middle orbital frontal region. Global value measured from the CBF map negatively correlated with age and gave rise to a rate of decrease at 0.39% per year (Figure 2A). Sample plots for the three major regions from the regression analysis, including right middle frontal gyrus, left inferior parietal lobule and right middle cingulate gyrus, are shown in Figures 2B–D. In the group comparison, there was a non-significant decline in global CBF values (51.9 ± 7.6 vs. 48.1 ± 11.8 ml/100 g/min; P = 0.17) for the younger and older groups. Relative to the younger group, older subjects showed relatively decreased CBF in the left superior frontal gyrus, right middle frontal gyrus, right superior temporal gyrus, right caudate body, and bilateral cerebellum, and relatively increased CBF in the right medial frontal gyrus, left middle temporal gyrus, left middle orbital frontal region, and left putamen (Supplementary Table 2).
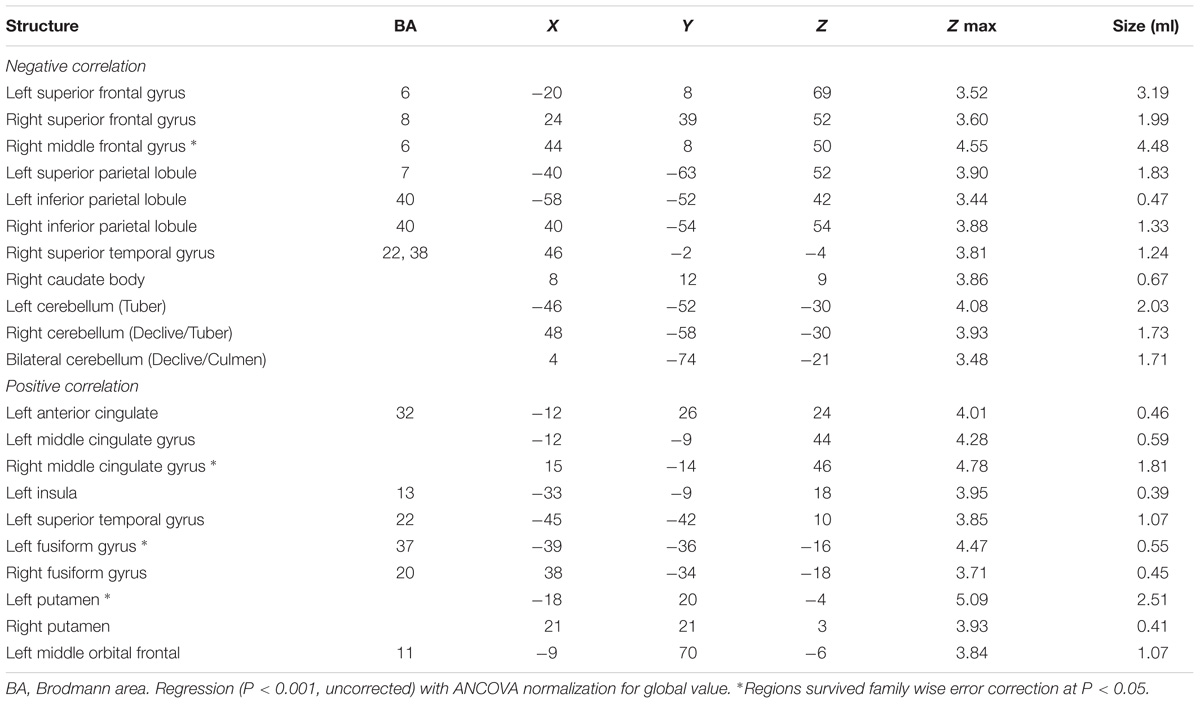
TABLE 3. Regions with age-related relative changes in globally adjusted CBF.
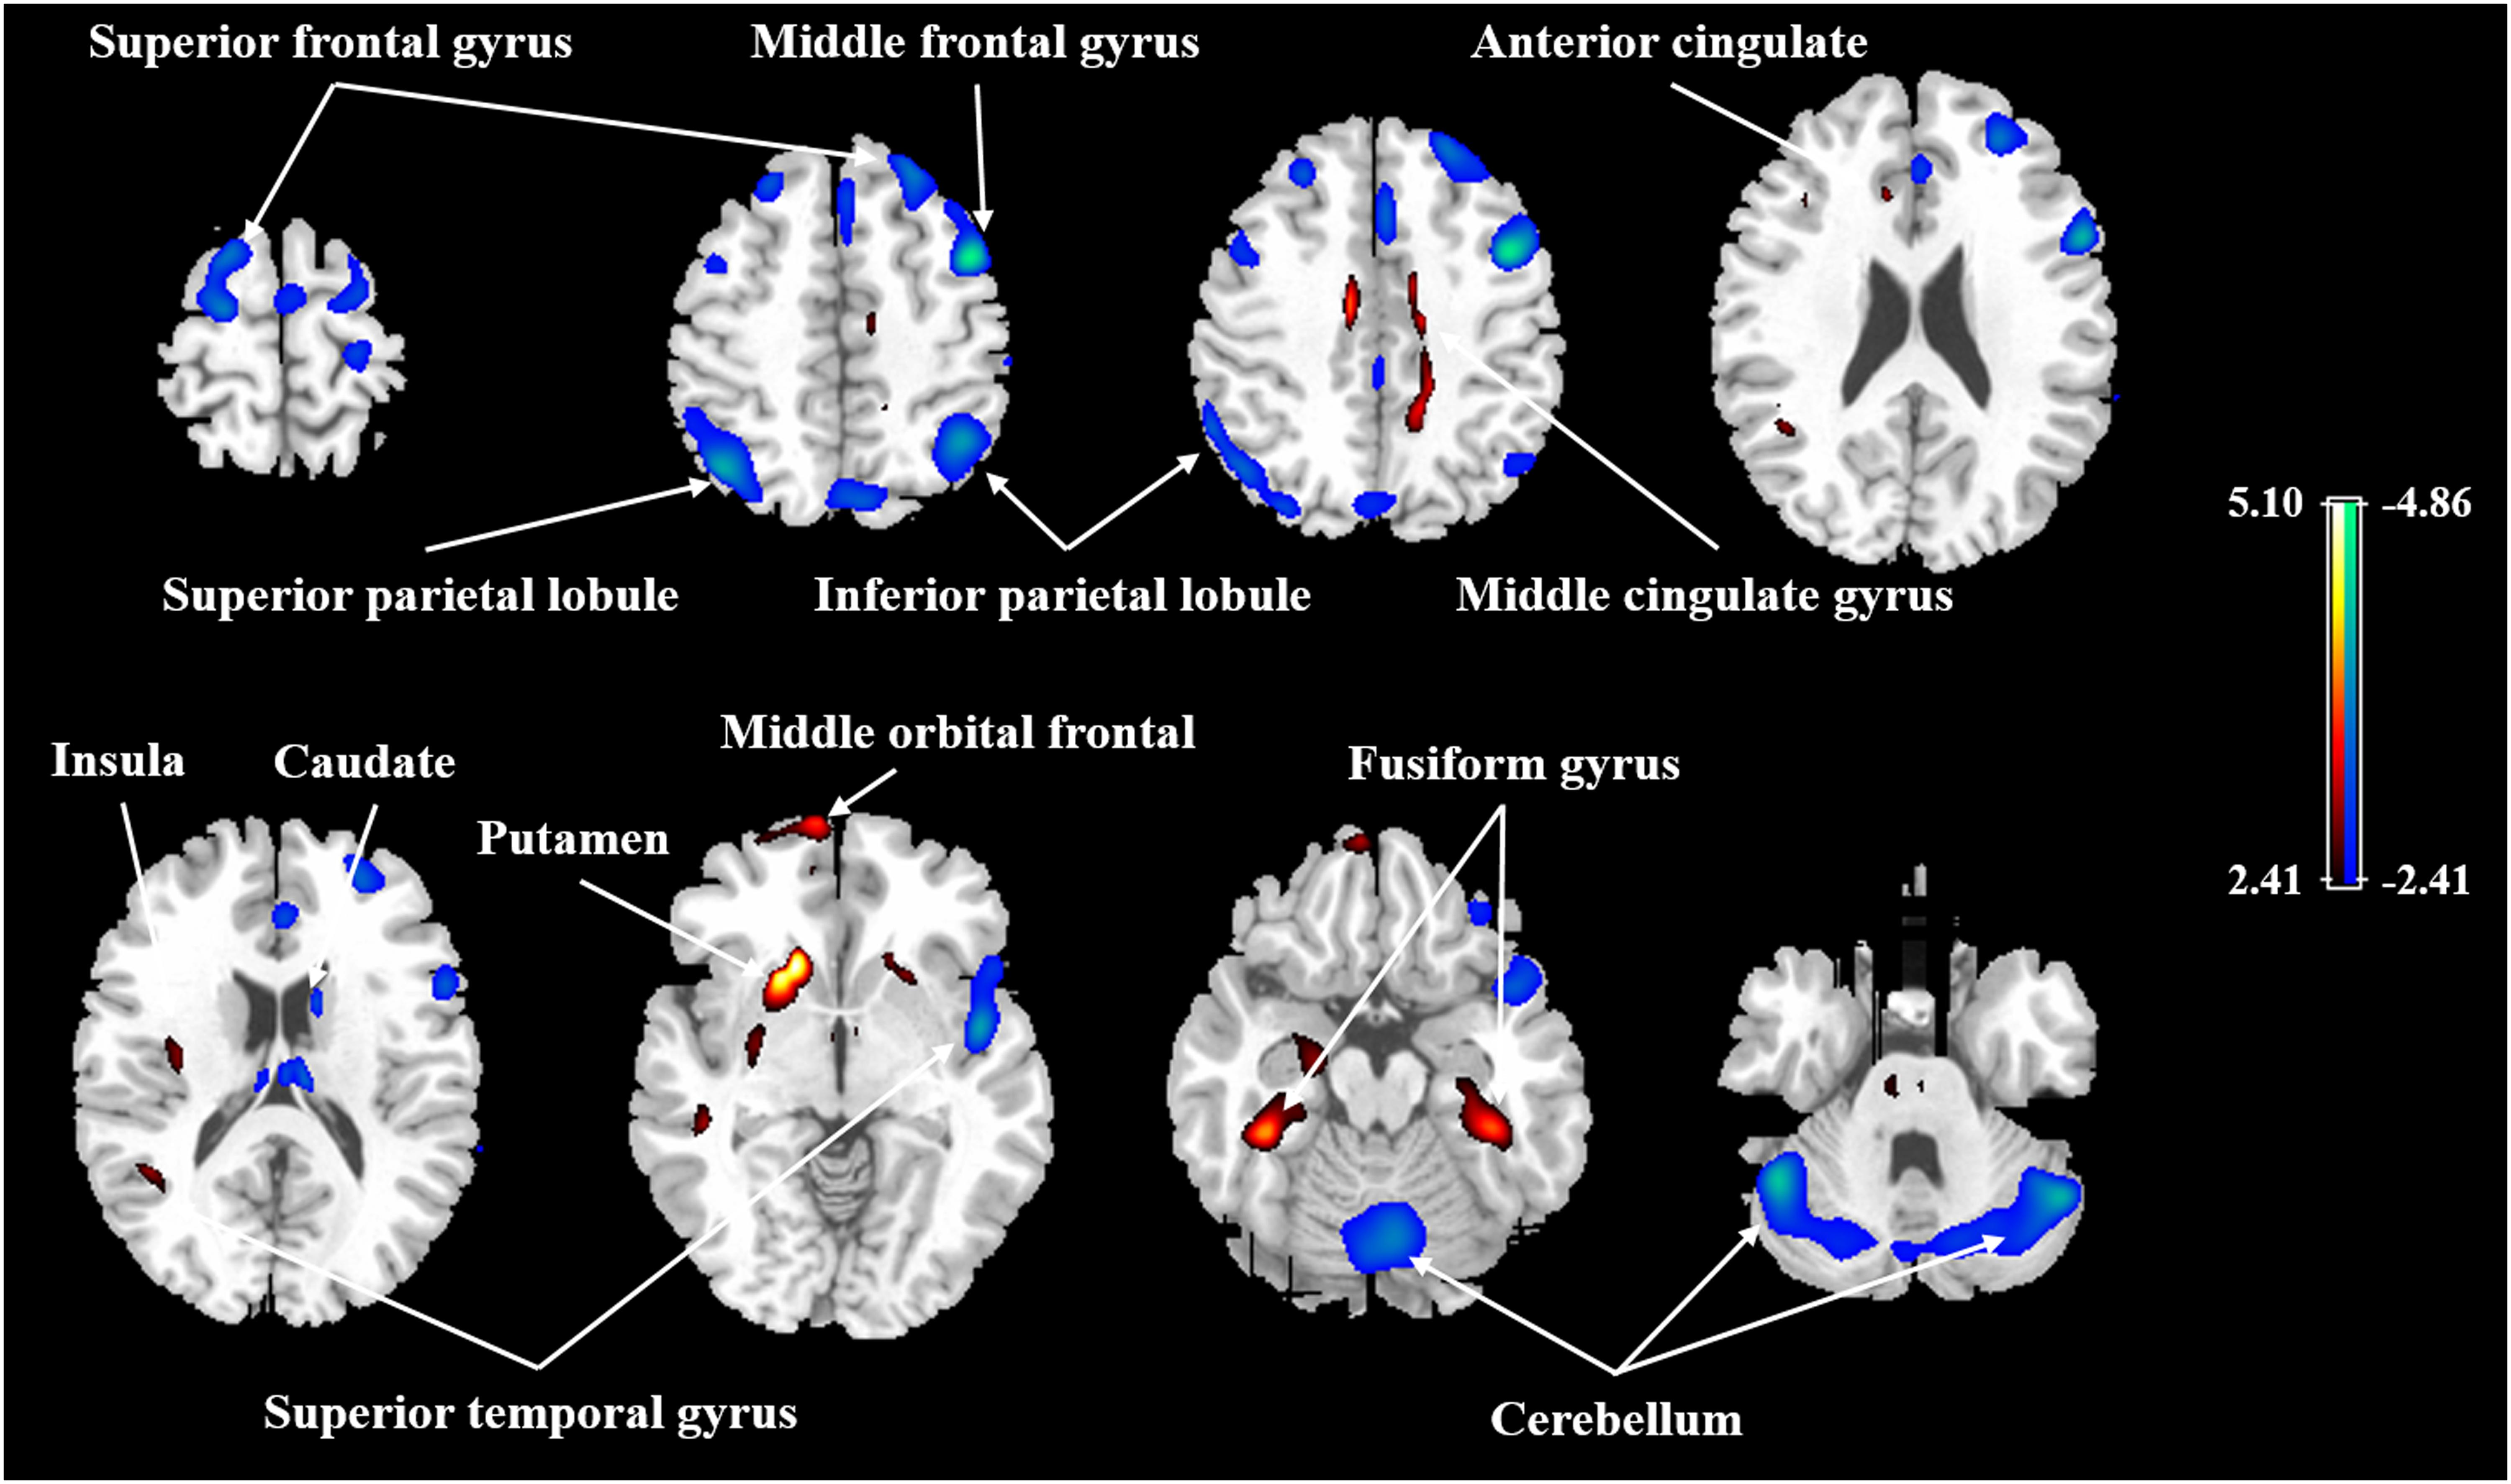
FIGURE 1. Age-related changes in relative CBF in all participants from regression analysis. Cold color indicates regions in which CBF negatively correlated with age, and warm color indicates regions in which CBF positively correlated with age. A threshold of 2.41 (P < 0.01) was used to overlay SPM maps onto a standard MRI brain template.
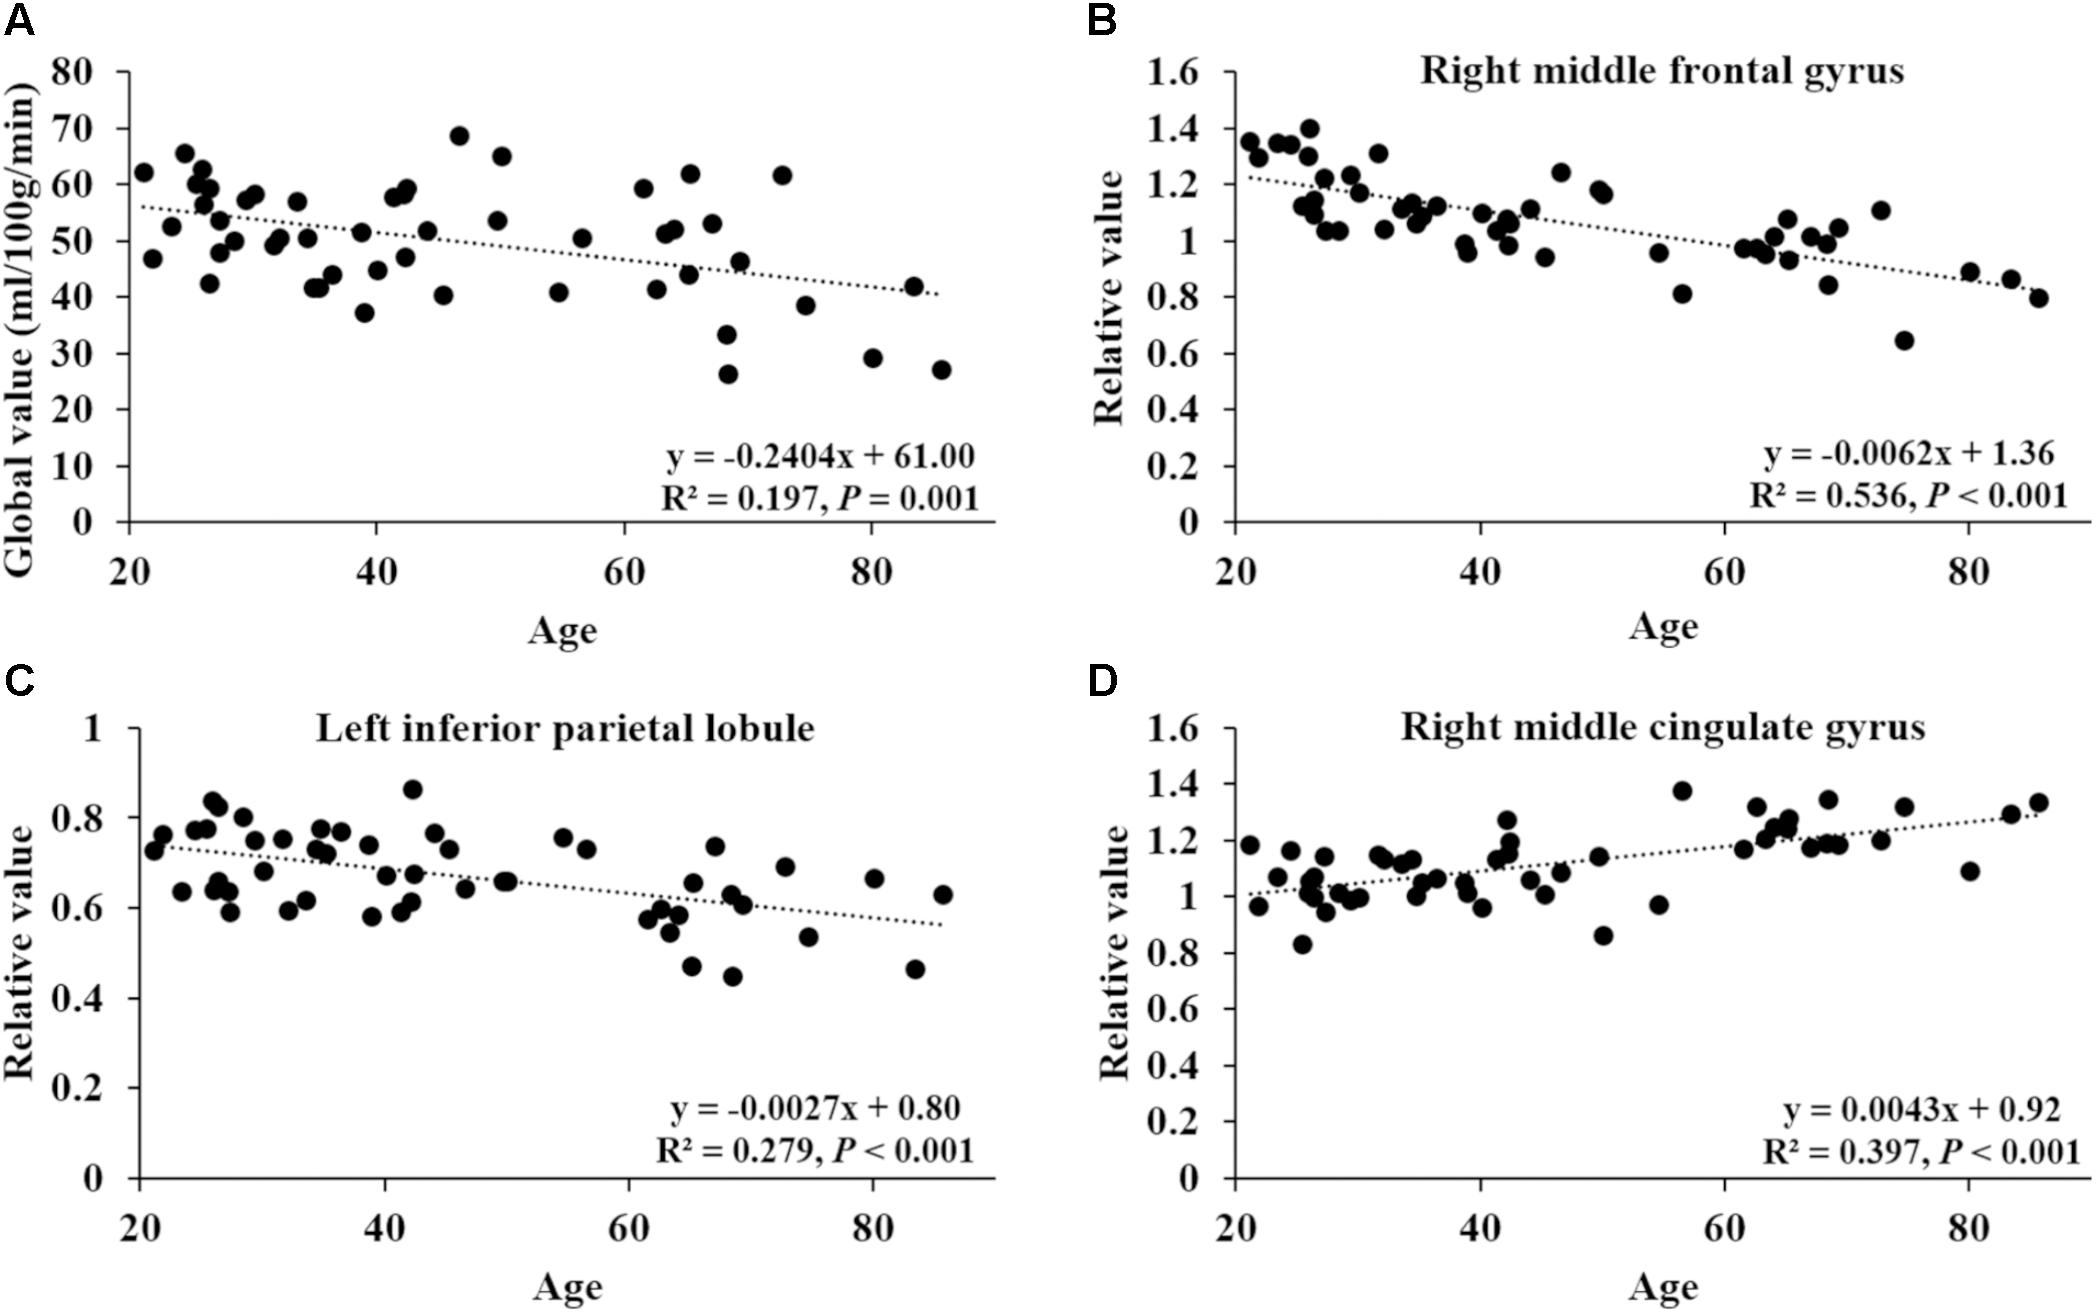
FIGURE 2. Correlation of age with global CBF value and relative CBF values in three sample regions. (A) The correlation between age and global value from the CBF map. (B–D) The correlations between age and relative values of right middle frontal gyrus (44, 8, 50), left inferior parietal lobule (–58, –52, 42) and right middle cingulate gyrus (15, –14, 46), obtained post hoc within a spherical volume of interest (4 mm radius).
In our participants, women were on average younger than men (40.8 vs. 52.1 years), and women had 18.3% greater global CBF. This difference in global CBF was significant (P = 0.02) after adjusting for age. However, no sex differences were seen in relative CBF values of three sample regions after normalizing for global value (Supplementary Table 3). Apart from the global CBF value in women, the correlations between regional relative CBF values and age were still preserved in women and men (Supplementary Figures 1, 2).
Age-Related CBF Pattern From Multivariate Analysis
To identify the CBF pattern associated with healthy aging, we applied SSM/PCA analysis to the MRI CBF maps from the 50 healthy adult subjects. Focusing on the major source of variance in the CBF maps, we initially restricted the multiple regression model to include the subject scores from the first 6 SSM component patterns. The model that included PC1, PC5, and PC6 (variance accounted for = 26.68, 5.38, and 3.68% and regression coefficient β = −0.494, −0.549, and −0.208, respectively) was the best in predicting the effect of age (F = 21.927, P < 0.001). (The patterns for PC1 alone or PC1 plus PC5 predicting the effect of age were also identified and are presented in Supplementary Figures 3, 4, respectively.) Figure 3 shows the age-related CBF pattern (total variance accounted for 35.74%) that was reliable at P < 0.05 based on the bootstrapping algorithm (1000 iterations). This covariance pattern was characterized by relatively decreased CBF in frontal and parietal areas and cerebellum, along with relatively increased CBF in temporal and occipital areas. The locations of all brain regions and coordinates for voxels with local minima and maxima pattern weights for this age-related pattern are shown in Table 4.
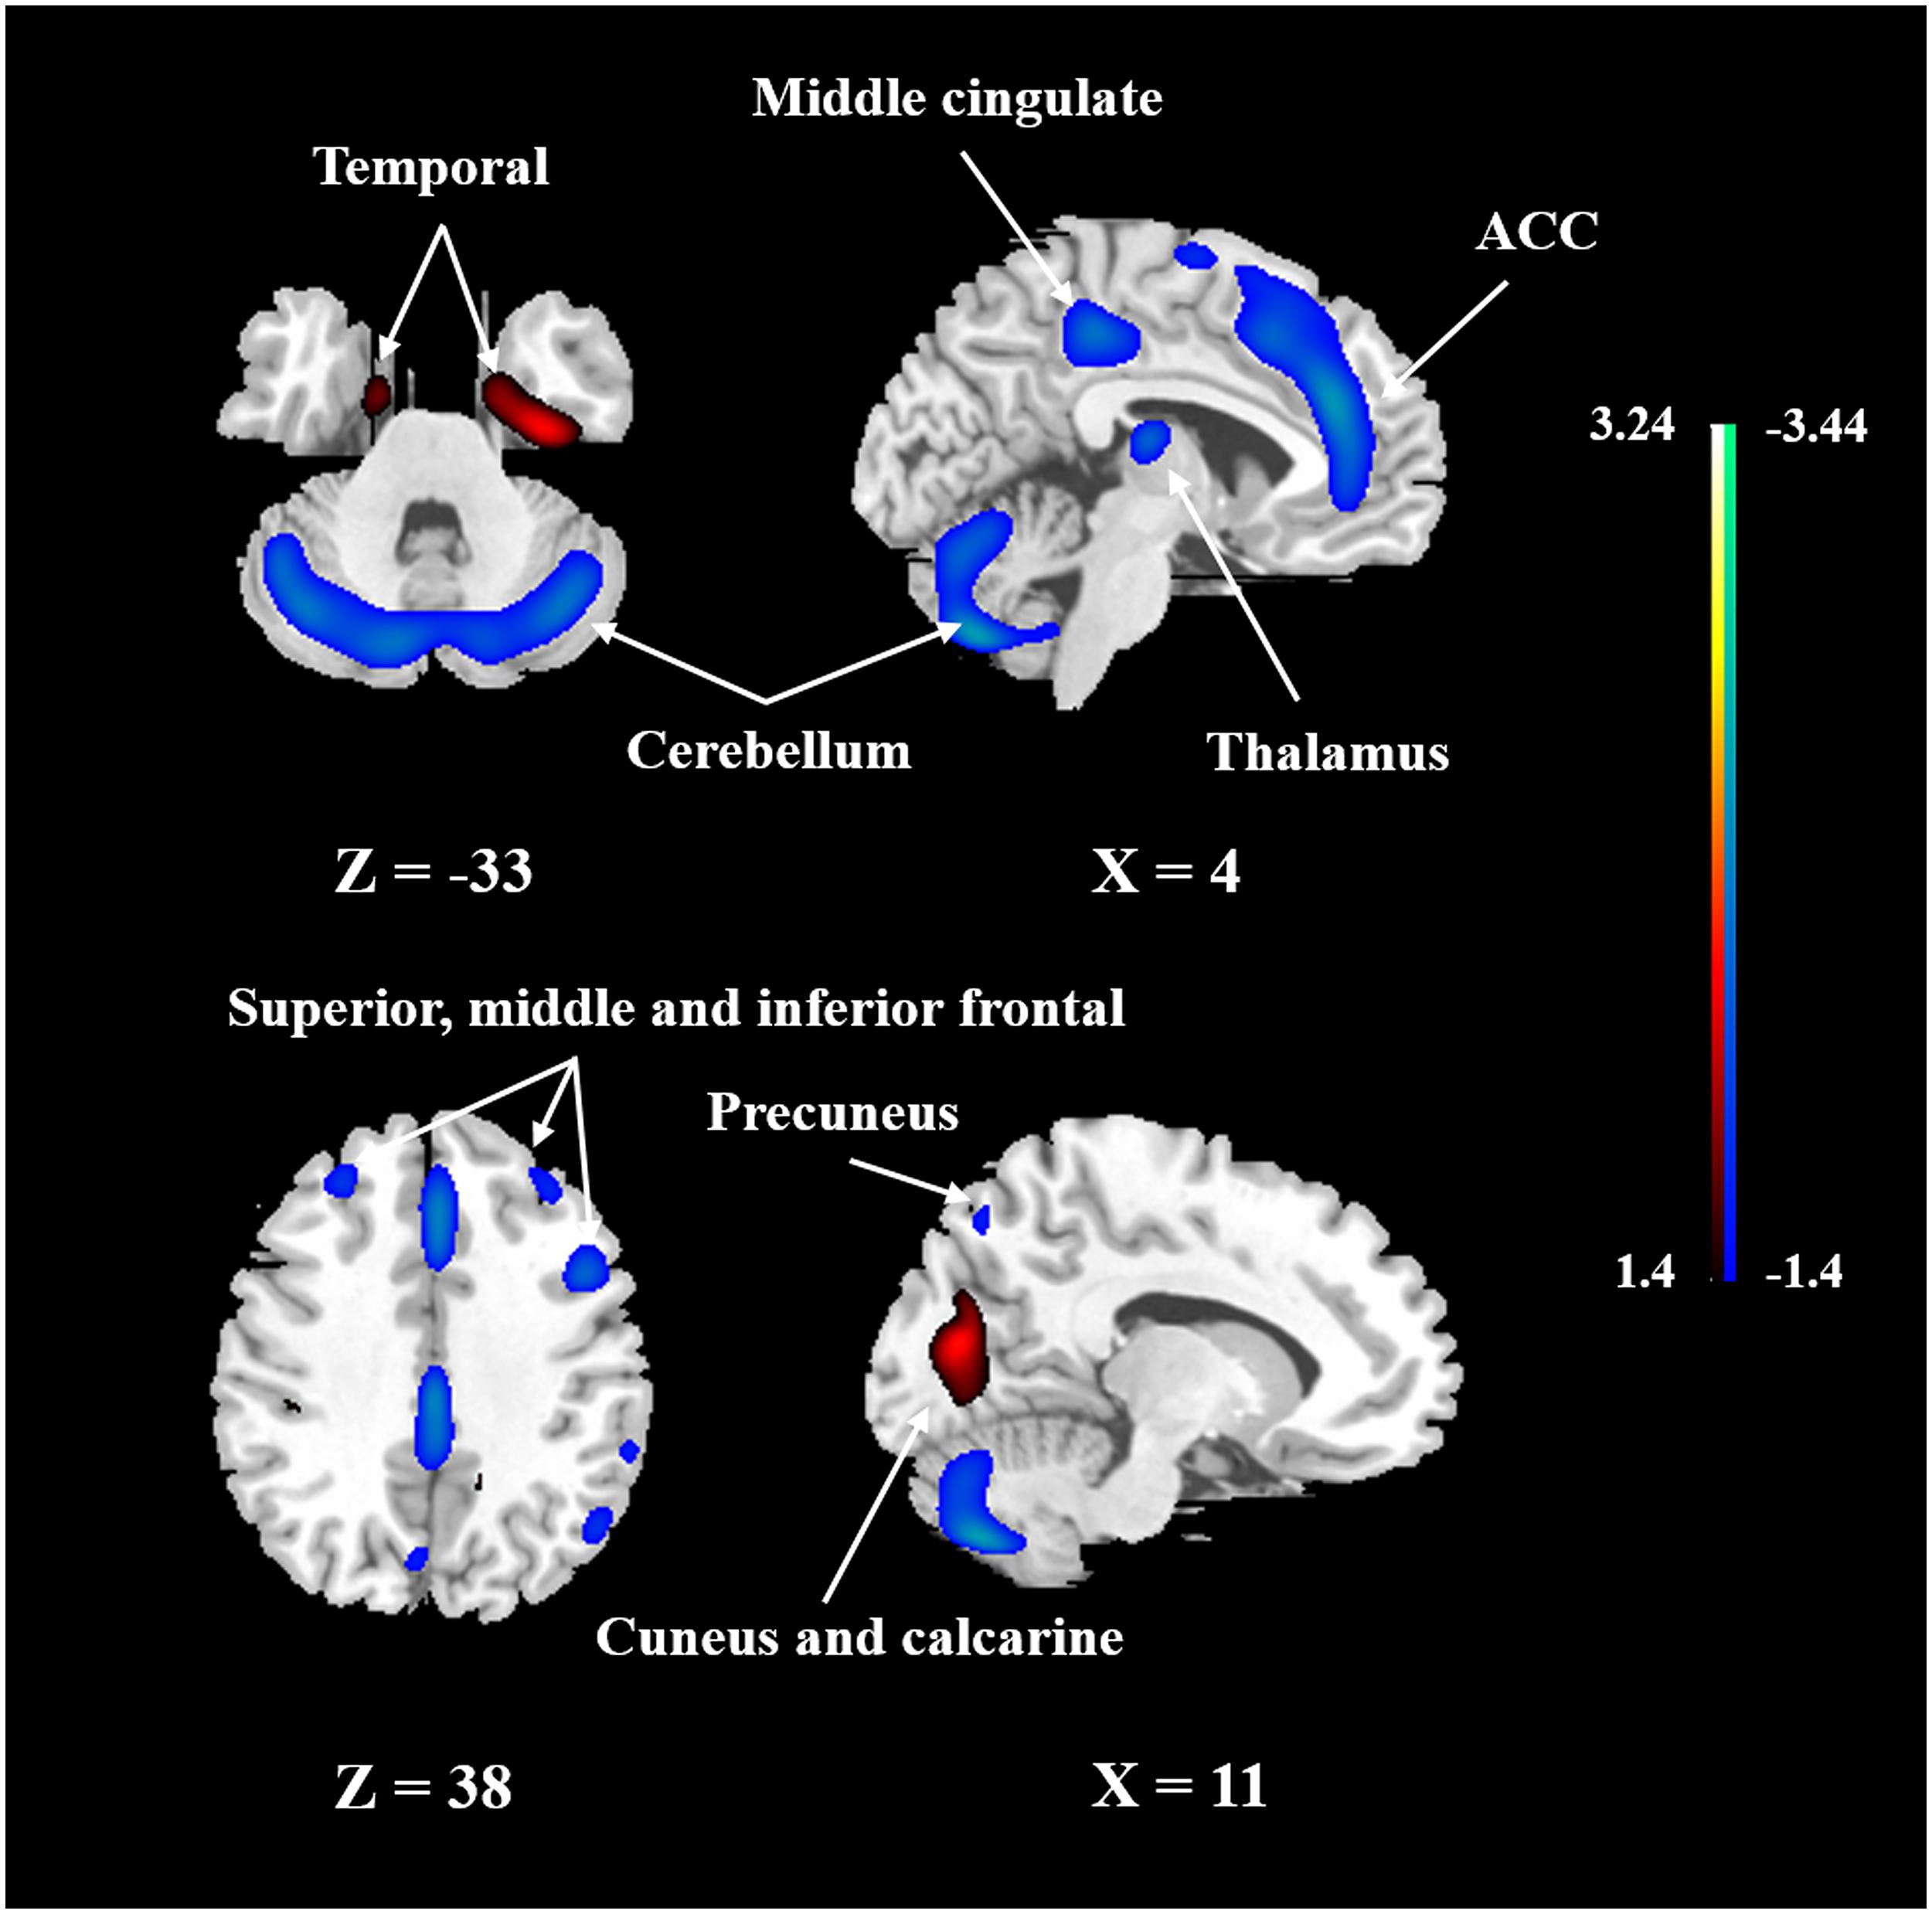
FIGURE 3. The network of CBF changes with aging identified by SSM/PCA from 50 healthy subjects. Cold color indicates regions loading negatively correlated with age, and warm color indicates regions loading positively correlated with age. The pattern was overlaid onto a standard MRI brain template to display voxels that were reliable at P < 0.05 based on the bootstrapping algorithm. ACC, anterior cingulate gyrus.
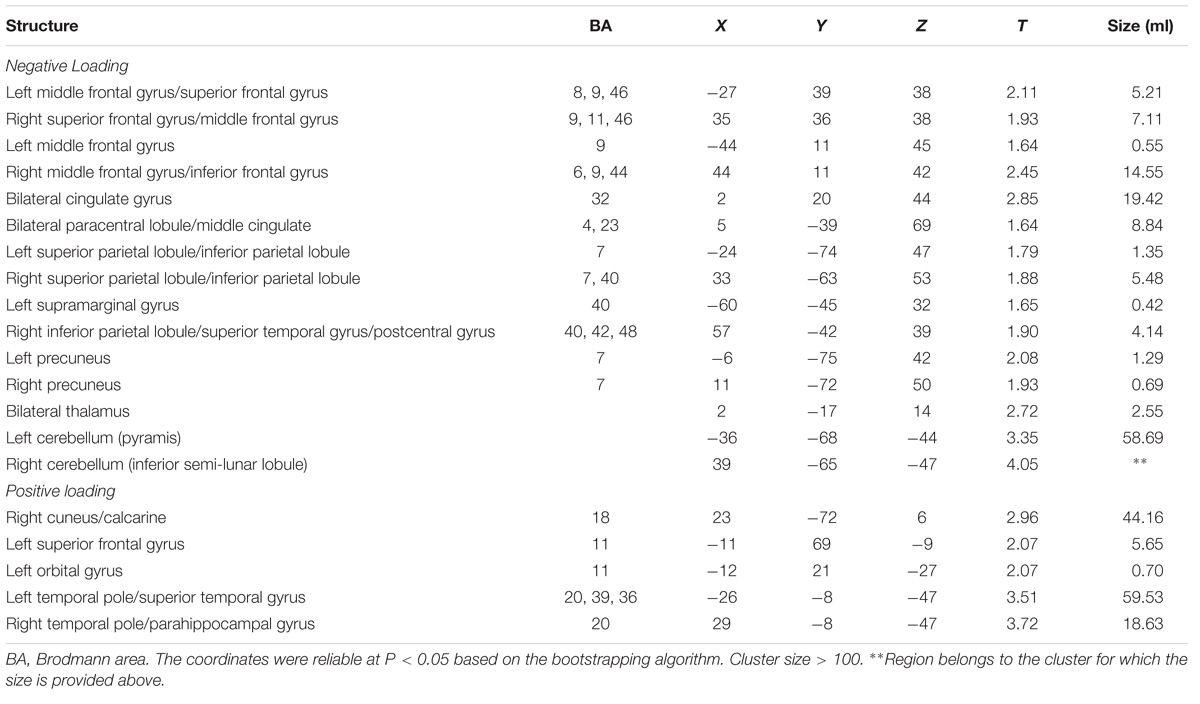
TABLE 4. Regions of the age-related CBF pattern.
Network score of this pattern correlated positively and strongly with age (R2 = 0.59, P < 0.001; Figure 4A) and was elevated (P < 0.001) in the older group compared with the younger group (Figure 4B); these relationships were preserved in women (Figures 4C,D) and men (Figures 4E,F) separately. The network score was also related negatively to global value from the CBF map in all subjects (R2 = 0.37, P < 0.001; Figure 5A), in women (P = 0.012; Figure 5B) and men (P = 0.002; Figure 5C) separately.
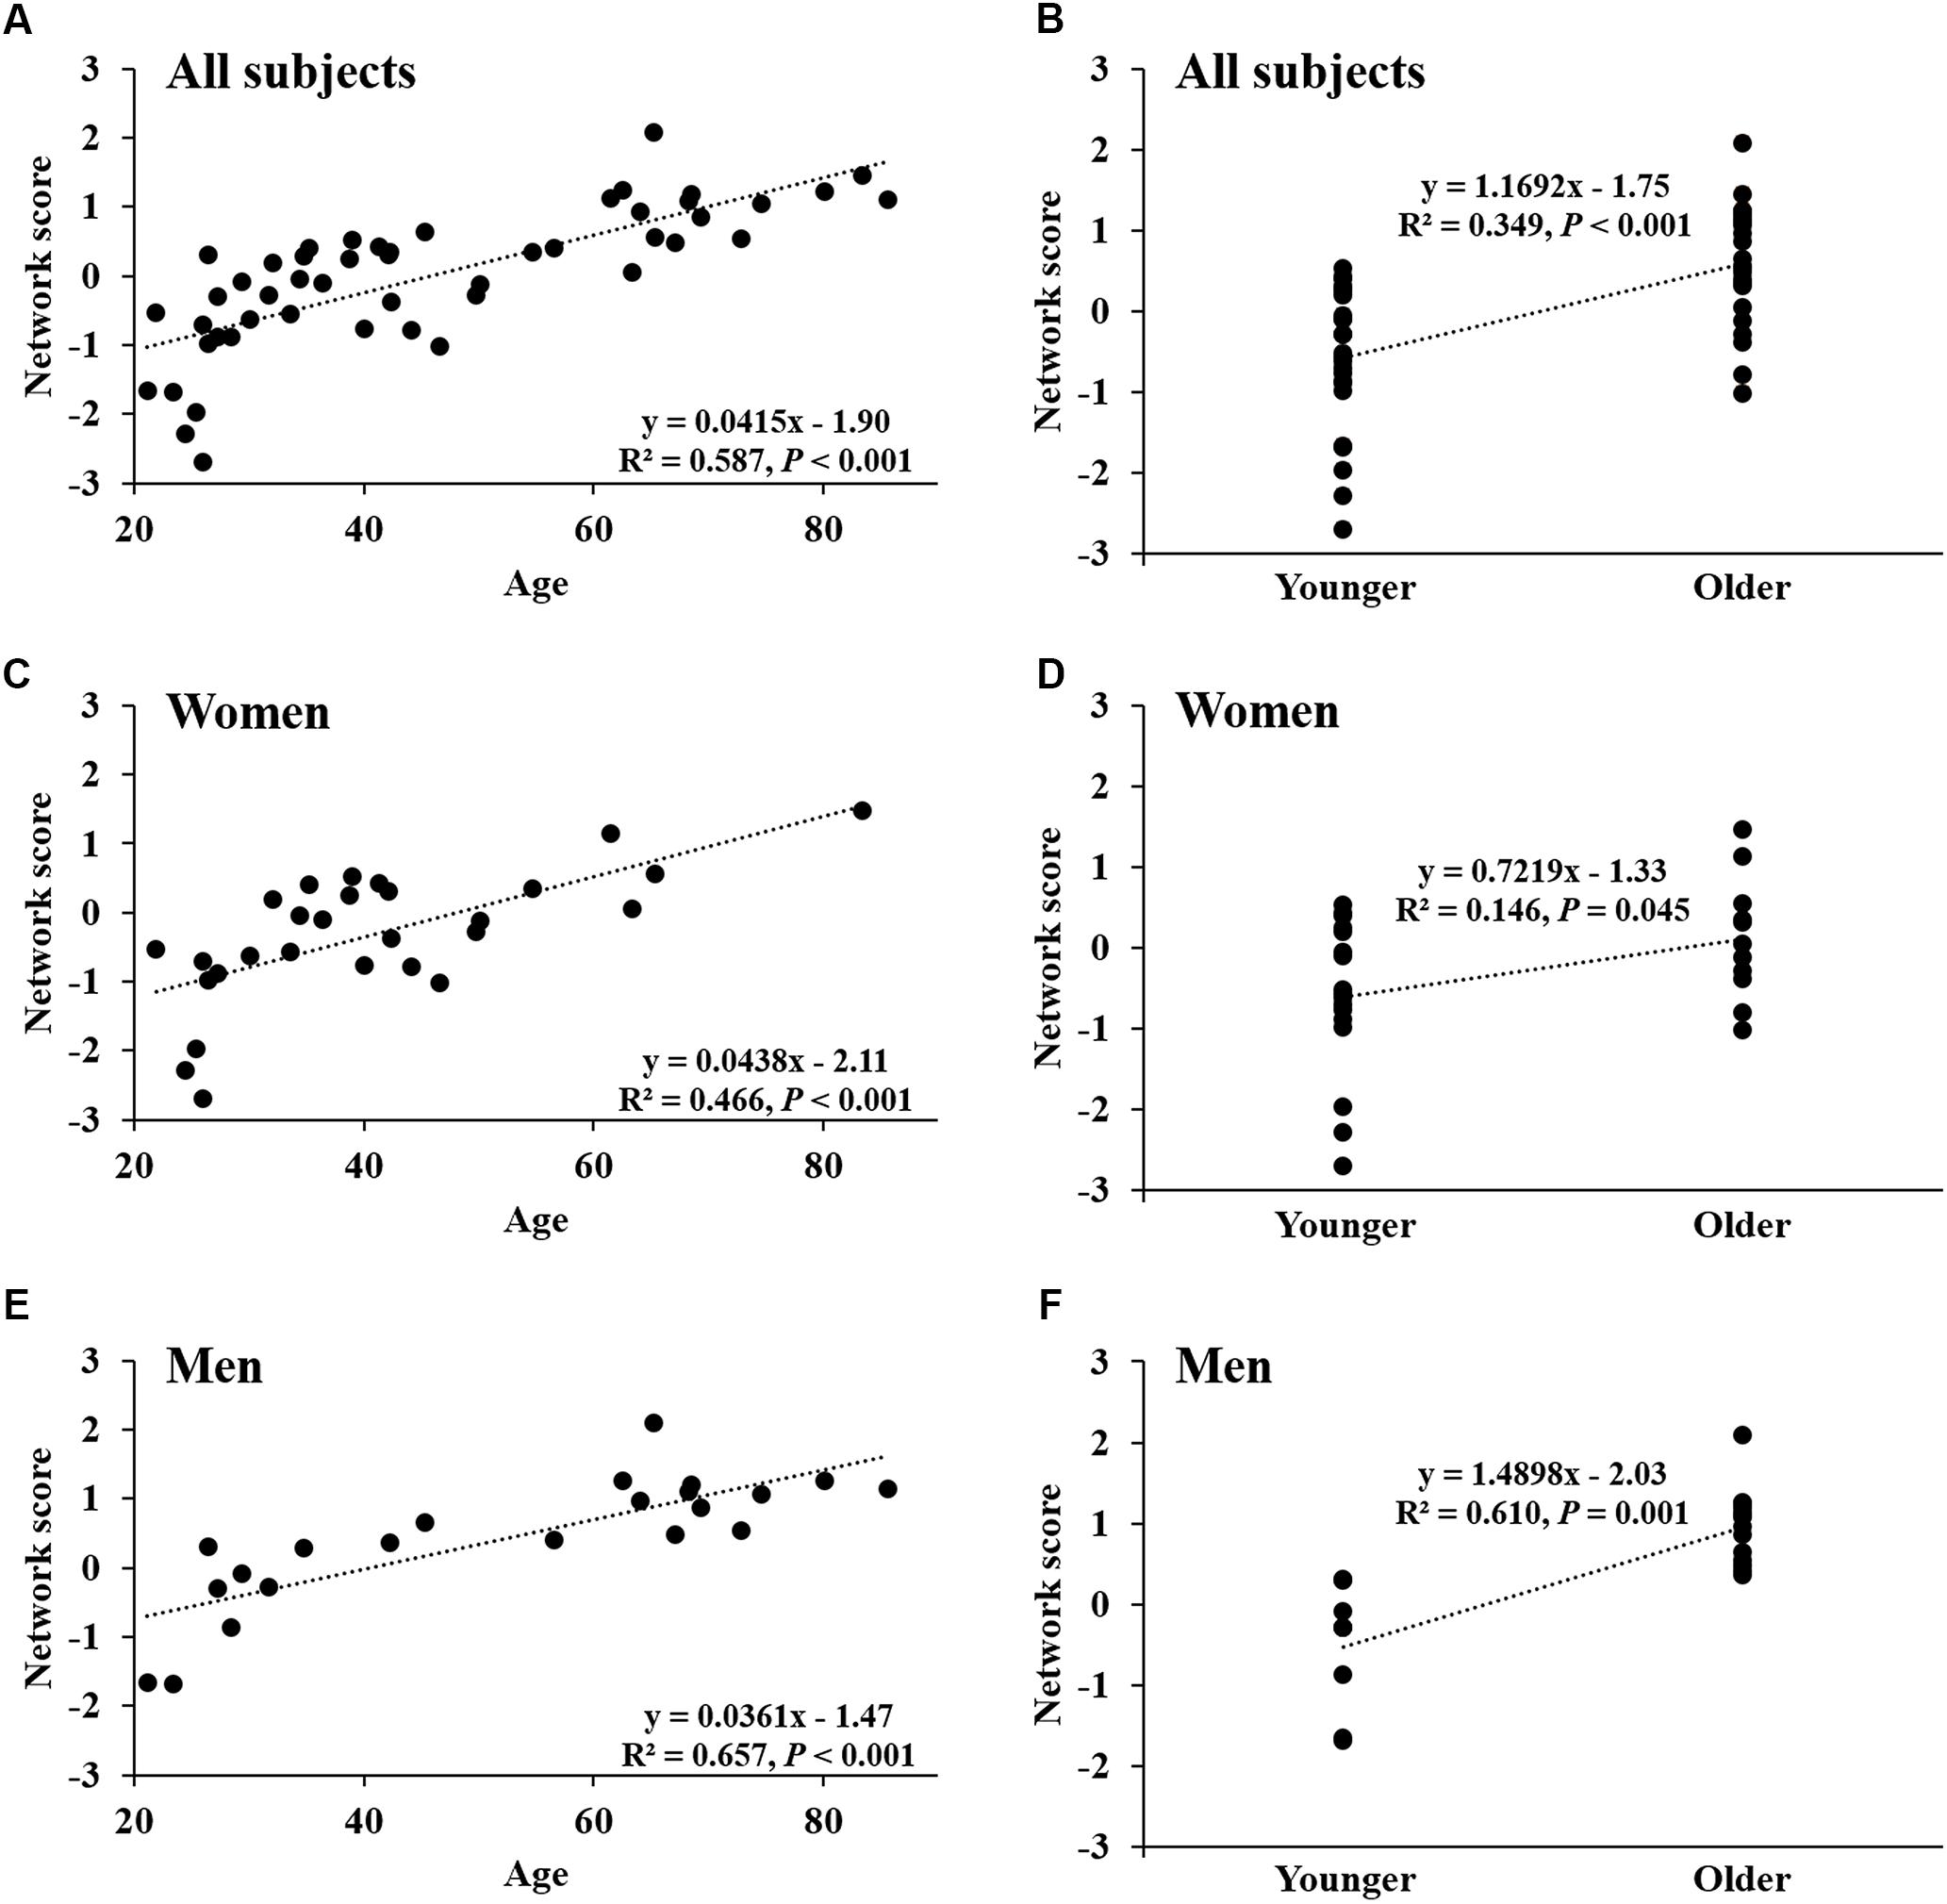
FIGURE 4. Network score of age-related CBF pattern. (A) Network score in relation to age in all healthy participants. (B) Differences in network score between older subjects and younger subjects in all healthy participants. (C,D) Network score in relation to age, and differences in network score between older subjects and younger subjects in women. (E,F) Network score in relation to age, and differences in network score between older subjects and younger subjects in men.
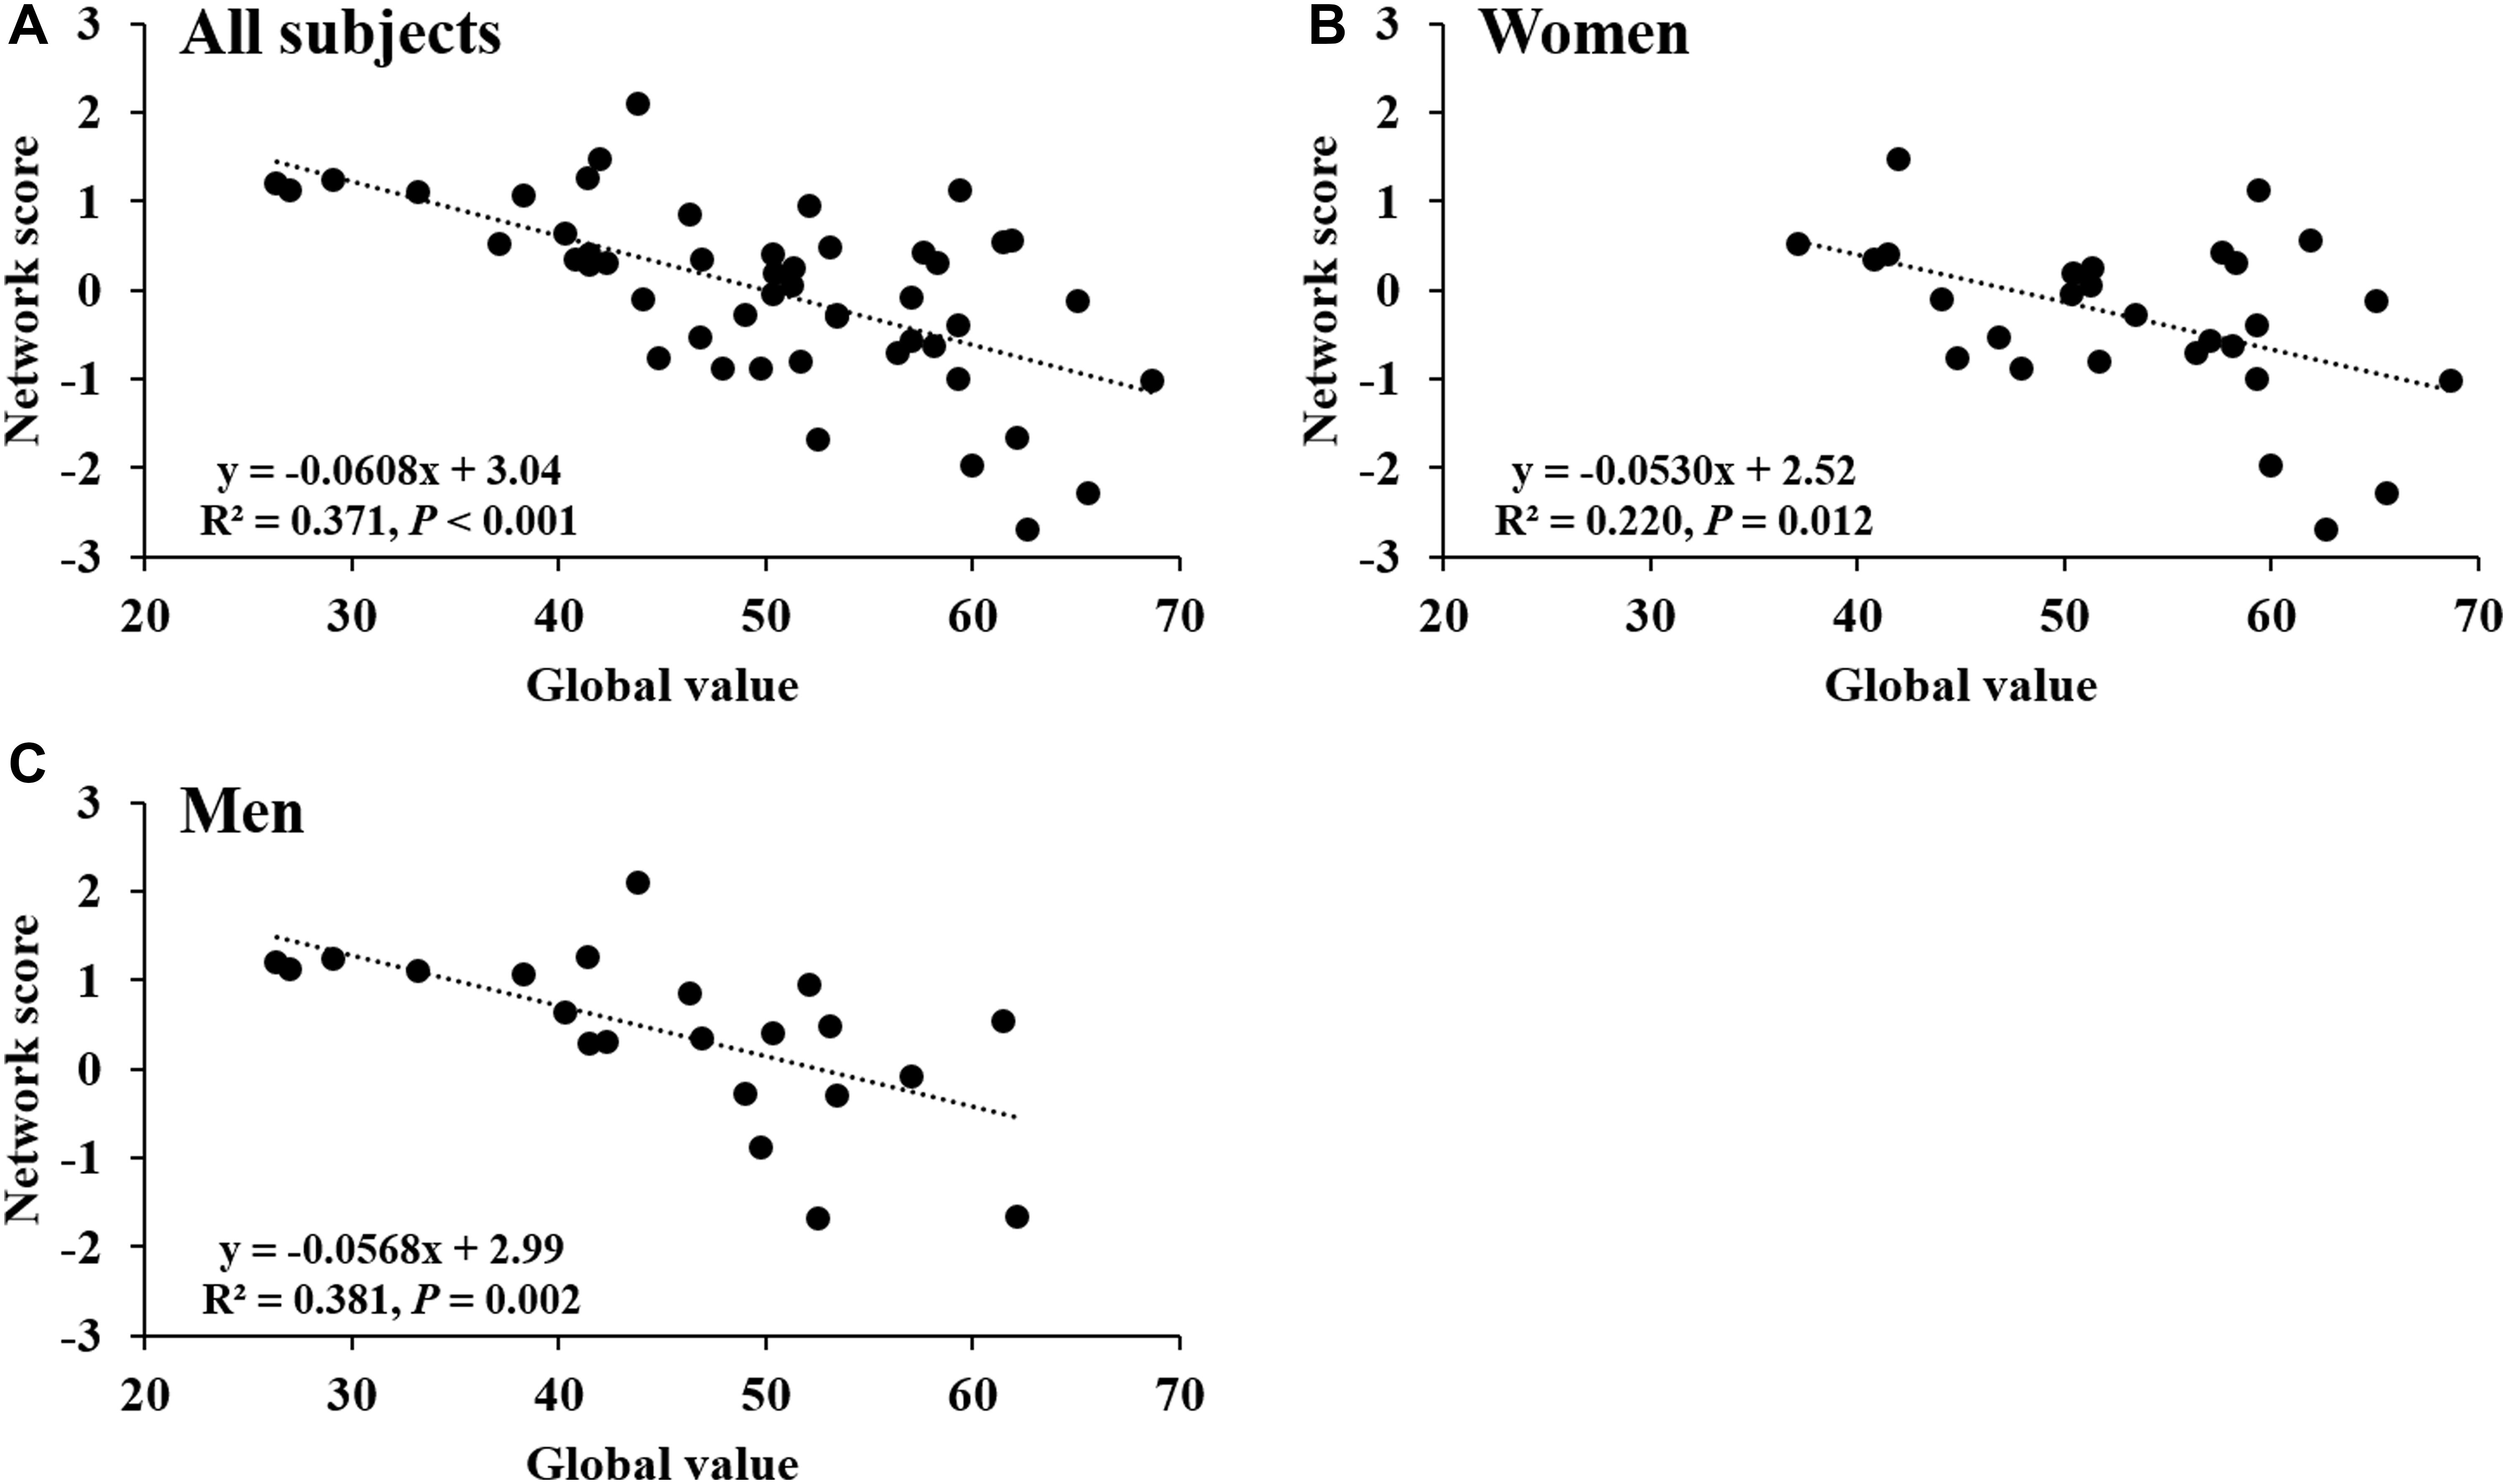
FIGURE 5. Network score related to global value from CBF map. (A) This network score of combined PC1, PC5, and PC6 from PCA/SSM analysis correlated with the global value of CBF map in all healthy participants. (B) The network score correlated with the global value of CBF map in female subjects. (C) The network score correlated with the global value of CBF map in male subjects.
Discussion
This study demonstrates the full extent of age-related CBF changes measured with pCASL over the full spectrum of healthy aging. Similar to an FDG-PET study analyzed with SPM (Petit-Taboue et al., 1998), absolute CBF value showed significant decline across most parts of the brain, but both relative decreases and increases in regional CBF were observed after adjusting for global value. In our present study, relative CBF in bilateral superior frontal gyrus, right middle frontal gyrus, left superior parietal lobule, bilateral inferior parietal lobules, right superior temporal gyrus, right caudate body and bilateral cerebellum were negatively correlated with age; regions in temporal and orbital frontal lobes, anterior and middle cingulate, and putamen showed relatively increased CBF during aging. We further identified an age-related CBF pattern using SSM/PCA that accounted for more than 35% of the variance, including both negative and positive region weights in CBF.
Aging causes a wide array of anatomical and functional changes to the brain. Age-related CBF decrease has been observed in H215O PET studies (Pantano et al., 1984; Leenders et al., 1990), although it could not be always reproduced after partial volume correction (Meltzer et al., 2000). The observation of global CBF reduction with age at about 0.39% per year in this study is consistent with previous ASL studies, which reported CBF decline at about 0.38 ∼ 0.45% per year (Parkes et al., 2004; Biagi et al., 2007; Wagner et al., 2012; Ambarki et al., 2015; De Vis et al., 2015), even after adjusting for brain atrophy in aging (Asllani et al., 2009; Chen et al., 2011). The strength of the correlation between age and global CBF (R2 = 0.1965) in our study is also very similar to that in a previous H215O PET study (R2 = 0.1936) (Pantano et al., 1984). The global CBF values measured for the younger and older subjects in this study are highly comparable to those reported in an H215O PET study with similar age range (Aanerud et al., 2012). While the global CBF of our younger group is more consistent with most previous ASL studies (Chen et al., 2011; De Vis et al., 2015) and H215O PET studies (49 ∼ 53 ml/100 g/min) (Pantano et al., 1984), the global CBF of our older group is somewhat higher because of the lower cut-off for group classification by median age (41.8 vs. 55 years). CBF decline may be associated with reduction in neuronal and synaptic number and activity (Parkes et al., 2004), and degeneration in the cerebral microvasculature (Farkas and Luiten, 2001) during aging.
As the current gold standard measurement of CBF, H215O PET studies have highlighted decreased CBF in frontal and temporal regions with aging (Pantano et al., 1984; Meltzer et al., 2000). Studies that compared ASL and H215O PET have demonstrated the utility of ASL for accurate and reproducible CBF measurements (Fan et al., 2016). In our present study, we observed that age-related CBF decreases in the middle frontal gyrus, inferior parietal lobule, thalamus, caudate and cerebellum, which have been reported in previous ASL studies (Parkes et al., 2004; Lu et al., 2011; Preibisch et al., 2011; Wierenga et al., 2013). Consistent with a previous study (Preibisch et al., 2011), some regions exhibited relatively increased perfusion in aging after correcting for global value, such as middle cingulate gyrus, fusiform gyrus and putamen. These regional relative increases in CBF, which were speculated to be a compensatory response to aging (Preibisch et al., 2011), may be attributed to selective regional vulnerabilities to brain degeneration, with some areas relatively preserved compared to other regions in normal aging. Aside from small sample sizes and different analytic methods, differences in findings of age-related CBF change might also be attributable to vascular risk factors (Birdsill et al., 2013; Bangen et al., 2014), sub-clinical cerebrovascular disease (Crane et al., 2015; Gregg et al., 2015), sedentary behavior (Zlatar et al., 2014), APOE genotype (Rane et al., 2013; Wierenga et al., 2013), and AD family history (Fleisher et al., 2009; Okonkwo et al., 2014).
Our characteristic CBF network derived with SSM/PCA is similar to a metabolic network that also showed decreased frontal and parietal association cortical metabolism in aging, previously derived with FDG-PET based on either region of interest (Moeller et al., 1996) or voxelwise (Zuendorf et al., 2003) analysis. However, the cerebellum showed negative weights in our CBF pattern, but was relatively preserved in those other metabolic patterns. The discrepancy in regional measures of perfusion and metabolism could be attributed to the utilization of different analytical methods. It has also been suggested that residual differences between perfusion and metabolism during healthy aging might be attributable to the use of global values for parameters such as partition coefficient, dispersion and time delay for regional CBF and the lumped constant for regional metabolic rate (Bentourkia et al., 2000).
Sex could be an important confounder in the CBF comparison and derivation of the age-related CBF pattern, although we controlled for it as a covariate in the analysis. As has been previously reported (Liu et al., 2012), we found overall global CBF was increased in women after adjusting for age. Other investigators have reported that premenopausal women exhibited higher CBF than young men, while there was no difference in CBF between older postmenopausal women and older men (Liu et al., 2016). Those findings could be related to differential effects of sex hormones between women and men with aging, for example the effects of estrogen on vascular endothelial growth factor (VEGF). Nonetheless, apart from global CBF in women, we found that the correlations between regional relative CBF values and PCA network score with age were maintained in either women or men separately, indicating that the age-related CBF pattern was relatively independent of sex in our present study.
Our age-related CBF pattern, which mainly features decreases in the anterior part of the brain and cerebellum, is quite different from previously reported Alzheimer’s disease (AD-related) or Parkinson’s disease (PD-related) CBF patterns measured with ASL. In those disease-related patterns, CBF was mainly decreased in the posterior areas of the brain, e.g., posterior cingulate and inferior occipital gyrus in AD (Asllani et al., 2008), and parietal and occipital cortex in PD (Ma et al., 2010; Melzer et al., 2011; Teune et al., 2014). Interestingly, we observed some areas with opposite region weights from disease-related patterns. For instance, cerebellum showed decreased loading in our age-related pattern but increased loading in the PD-related pattern (Teune et al., 2014). Furthermore, taking into account that regional CBF correlated with cognitive function and was sensitive to aerobic exercise or cognitive training in the elderly (Chapman et al., 2013, 2015), this age-related CBF pattern is a promising method for monitoring the aging process and distinguishing neurodegenerative diseases from normal aging. A recent study observed that CBF, especially in the frontal lobe and anterior cingulate cortex, which belongs to the default mode network, predicts cognitive ability in healthy individuals in a 4-year follow-up (De Vis et al., 2018). However, the overlap and distinction between age-related CBF pattern and cognitive predicting CBF pattern should be further explored, since we did not have comprehensive longitudinal cognitive testing for the cohort in this study.
Several regions in the frontal lobes and cerebellum are involved in CBF reduction in our age-related pattern. Some other studies have suggested that the frontal region may be more vulnerable to aging compared to other parts of the brain. An age-related volumetric pattern identified by SSM shared some areas represented in our CBF pattern, such as frontal and parietal regions (Brickman et al., 2007; Bergfield et al., 2010). Microvascular pathology as indicated by white matter hyperintensity predominates in the frontal lobes and preferentially affects glucose metabolism in prefrontal cortex in normal aging (Jagust, 2013). In addition, the cerebellum shows significant loss of neurons and a deficit in synaptic plasticity with age, even earlier than the hippocampus (Woodruff-Pak et al., 2010). However, temporal regions, which are especially involved in AD, showed positive weights (e.g., parahippocampal gyrus) in our age-related CBF pattern. Since potential AD pathology may have been present in some cognitively normal elderly subjects, it may suggest a compensatory effect on CBF regulation in temporal regions before the onset of AD. Although our age-related CBF pattern supports structural and functional changes in aging from previous studies, the mechanism and progression of aging in the brain need further investigation.
Limitations
Apart from physiological changes, CBF reduction might also be confounded by factors such as increases in partial volume effects caused by brain atrophy and cortical thinning, and increases in arterial transit time in aging. In addition, although we tried to exclude individuals with cerebrovascular disease and neurodegenerative diseases by thorough medical history and structural MRI, underlying risk factors and neuropathology were not assessed in this study, such as APOE genotype and amyloid-β, which have been observed to be related to CBF changes in normal aging (Wierenga et al., 2013; Michels et al., 2016). For instance, a substantial proportion of healthy elderly subjects have brain amyloid deposition, as demonstrated using PET with11C Pittsburgh Compound B, especially in APOE ε4 carriers and the oldest old (Rowe et al., 2010). Moreover, this is a cross-sectional study. Since brain reserve and environmental factors may differ between individual subjects, longitudinal studies using data from the same individual may yield more reliable findings in age-related CBF changes. Clinical conversion also occurs in a sufficiently long study, allowing for identification of underlying neuropathology in putatively healthy elderly subjects. Furthermore, although the age range of our participants was from 21 to 85 years, the sample size is still relatively small.
Conclusion
This is the first study to derive an age-related CBF pattern using ASL MRI with SSM/PCA multivariate analysis. This network, which is distinct from disease-related CBF patterns in AD and PD, is characterized by decreased CBF in frontal and parietal areas and cerebellum, and relatively preserved CBF in temporal, occipital and orbital frontal areas. A larger longitudinal study is needed to validate the characteristic age-related perfusion network as a suitable marker of aging.
Data Availability Statements
The raw data supporting the conclusions of this manuscript will be made available by the authors, without undue reservation, to any qualified researcher.
Ethics Statement
This study was carried out in accordance with all applicable Department of Health and Human Services regulations 45 CFR 46, Food and Drug Administration regulations 21 CFR 50, 21 CFR 56, 21 CFR 812, and the Health Insurance Portability and Accountability Act (HIPAA) with the recommendations of the Northwell Health IRB, with written informed consent from all subjects. All subjects gave written informed consent in accordance with the Declaration of Helsinki. The protocol was approved by the Northwell Health IRB.
Author Contributions
NZ processed and analyzed the imaging data and wrote the manuscript. MG and TG designed the study. MG and DE recruited and assessed the participants. MG, TG, and YM reviewed the manuscript. BC preprocessed some of the imaging data. JG, SP, and YM gave the technical direction for data analysis. PK conducted the MRI procedure and acquired the imaging data. DE gave crucial comments for the manuscript.
Funding
This work was supported in part by the National Natural Science Foundation of China (Grant No. 81500926) and the National Key Clinical Specialty Construction Project of China (NZ). This work was also supported in part by the Litwin-Zucker Research Center and by grant R01 AG038734 (TG) from the National Institutes of Health. The work of YM and SP in this study was supported in part by grant R01 NS 083490 from the National Institutes of Health. JG is supported by a fellowship grant from the Alzheimer’s Association (AACFD-16-438886).
Conflict of Interest Statement
The authors declare that the research was conducted in the absence of any commercial or financial relationships that could be construed as a potential conflict of interest.
Supplementary Material
The Supplementary Material for this article can be found online at: https://www.frontiersin.org/articles/10.3389/fnagi.2018.00214/full#supplementary-material
Footnotes
References
Aanerud, J., Borghammer, P., Chakravarty, M. M., Vang, K., Rodell, A. B., Jonsdottir, K. Y., et al. (2012). Brain energy metabolism and blood flow differences in healthy aging. J. Cereb. Blood Flow Metab. 32, 1177–1187. doi: 10.1038/jcbfm.2012.18jcbfm201218
Alsop, D. C., Detre, J. A., Golay, X., Gunther, M., Hendrikse, J., Hernandez-Garcia, L., et al. (2015). Recommended implementation of arterial spin-labeled perfusion MRI for clinical applications: a consensus of the ISMRM perfusion study group and the European consortium for ASL in dementia. Magn. Reson. Med. 73, 102–116. doi: 10.1002/mrm.25197
Ambarki, K., Wahlin, A., Zarrinkoob, L., Wirestam, R., Petr, J., Malm, J., et al. (2015). Accuracy of parenchymal cerebral blood flow measurements using pseudocontinuous arterial spin-labeling in healthy volunteers. AJNR Am. J. Neuroradiol. 36, 1816–1821. doi: 10.3174/ajnr.A4367ajnr.A4367
Asllani, I., Habeck, C., Borogovac, A., Brown, T. R., Brickman, A. M., and Stern, Y. (2009). Separating function from structure in perfusion imaging of the aging brain. Hum. Brain Mapp. 30, 2927–2935. doi: 10.1002/hbm.20719
Asllani, I., Habeck, C., Scarmeas, N., Borogovac, A., Brown, T. R., and Stern, Y. (2008). Multivariate and univariate analysis of continuous arterial spin labeling perfusion MRI in Alzheimer’s disease. J. Cereb. Blood Flow Metab. 28, 725–736. doi: 10.1038/sj.jcbfm.9600570
Bangen, K. J., Nation, D. A., Clark, L. R., Harmell, A. L., Wierenga, C. E., Dev, S. I., et al. (2014). Interactive effects of vascular risk burden and advanced age on cerebral blood flow. Front. Aging Neurosci. 6:159. doi: 10.3389/fnagi.2014.00159
Bentourkia, M., Bol, A., Ivanoiu, A., Labar, D., Sibomana, M., Coppens, A., et al. (2000). Comparison of regional cerebral blood flow and glucose metabolism in the normal brain: effect of aging. J. Neurol. Sci. 181, 19–28. doi: 10.1016/S0022-510X(00)00396-8
Bergfield, K. L., Hanson, K. D., Chen, K., Teipel, S. J., Hampel, H., Rapoport, S. I., et al. (2010). Age-related networks of regional covariance in MRI gray matter: reproducible multivariate patterns in healthy aging. Neuroimage 49, 1750–1759. doi: 10.1016/j.neuroimage.2009.09.051
Biagi, L., Abbruzzese, A., Bianchi, M. C., Alsop, D. C., Del Guerra, A., and Tosetti, M. (2007). Age dependence of cerebral perfusion assessed by magnetic resonance continuous arterial spin labeling. J. Magn. Reson. Imaging 25, 696–702. doi: 10.1002/jmri.20839
Birdsill, A. C., Carlsson, C. M., Willette, A. A., Okonkwo, O. C., Johnson, S. C., Xu, G., et al. (2013). Low cerebral blood flow is associated with lower memory function in metabolic syndrome. Obesity 21, 1313–1320. doi: 10.1002/oby.20170
Brickman, A. M., Habeck, C., Zarahn, E., Flynn, J., and Stern, Y. (2007). Structural MRI covariance patterns associated with normal aging and neuropsychological functioning. Neurobiol. Aging 28, 284–295. doi: 10.1016/j.neurobiolaging.2005.12.016
Chapman, S. B., Aslan, S., Spence, J. S., Defina, L. F., Keebler, M. W., Didehbani, N., et al. (2013). Shorter term aerobic exercise improves brain, cognition, and cardiovascular fitness in aging. Front. Aging Neurosci. 5:75. doi: 10.3389/fnagi.2013.00075
Chapman, S. B., Aslan, S., Spence, J. S., Hart, JJ Jr, Bartz, E. K., Didehbani, N., et al. (2015). Neural mechanisms of brain plasticity with complex cognitive training in healthy seniors. Cereb. Cortex 25, 396–405. doi: 10.1093/cercor/bht234bht234
Chen, J. J., Rosas, H. D., and Salat, D. H. (2011). Age-associated reductions in cerebral blood flow are independent from regional atrophy. Neuroimage 55, 468–478. doi: 10.1016/j.neuroimage.2010.12.032S1053-8119(10)01616-2
Crane, D. E., Black, S. E., Ganda, A., Mikulis, D. J., Nestor, S. M., Donahue, M. J., et al. (2015). Gray matter blood flow and volume are reduced in association with white matter hyperintensity lesion burden: a cross-sectional MRI study. Front. Aging Neurosci. 7:131. doi: 10.3389/fnagi.2015.00131
De Vis, J. B., Hendrikse, J., Bhogal, A., Adams, A., Kappelle, L. J., and Petersen, E. T. (2015). Age-related changes in brain hemodynamics; a calibrated MRI study. Hum. Brain Mapp. 36, 3973–3987. doi: 10.1002/hbm.22891
De Vis, J. B., Peng, S. L., Chen, X., Li, Y., Liu, P., Sur, S., et al. (2018). Arterial-spin-labeling (ASL) perfusion MRI predicts cognitive function in elderly individuals: A 4-year longitudinal study. J. Magn. Reson. Imaging. doi: 10.1002/jmri.25938 [Epub ahead of print].
Eidelberg, D. (2009). Metabolic brain networks in neurodegenerative disorders: a functional imaging approach. Trends Neurosci. 32, 548–557. doi: 10.1016/j.tins.2009.06.003
Fan, A. P., Jahanian, H., Holdsworth, S. J., and Zaharchuk, G. (2016). Comparison of cerebral blood flow measurement with [15O]-water positron emission tomography and arterial spin labeling magnetic resonance imaging: a systematic review. J. Cereb. Blood Flow Metab. 36, 842–861. doi: 10.1177/0271678X166363930271678X16636393
Farkas, E., and Luiten, P. G. (2001). Cerebral microvascular pathology in aging and Alzheimer’s disease. Prog. Neurobiol. 64, 575–611. doi: 10.1016/S0301-0082(00)00068-X
Fleisher, A. S., Podraza, K. M., Bangen, K. J., Taylor, C., Sherzai, A., Sidhar, K., et al. (2009). Cerebral perfusion and oxygenation differences in Alzheimer’s disease risk. Neurobiol. Aging 30, 1737–1748. doi: 10.1016/j.neurobiolaging.2008.01.012
Gregg, N. M., Kim, A. E., Gurol, M. E., Lopez, O. L., Aizenstein, H. J., Price, J. C., et al. (2015). Incidental cerebral microbleeds and cerebral blood flow in elderly individuals. JAMA Neurol. 72, 1021–1028. doi: 10.1001/jamaneurol.2015.13592388928
Habeck, C., Foster, N. L., Perneczky, R., Kurz, A., Alexopoulos, P., Koeppe, R. A., et al. (2008). Multivariate and univariate neuroimaging biomarkers of Alzheimer’s disease. Neuroimage 40, 1503–1515. doi: 10.1016/j.neuroimage.2008.01.056S1053-8119(08)00102-X
Jagust, W. (2013). Vulnerable neural systems and the borderland of brain aging and neurodegeneration. Neuron 77, 219–234. doi: 10.1016/j.neuron.2013.01.002
Leenders, K. L., Perani, D., Lammertsma, A. A., Heather, J. D., Buckingham, P., Healy, M. J., et al. (1990). Cerebral blood flow, blood volume and oxygen utilization: normal values and effect of age. Brain 113(Pt 1), 27–47. doi: 10.1093/brain/113.1.27
Liu, W., Lou, X., and Ma, L. (2016). Use of 3D pseudo-continuous arterial spin labeling to characterize sex and age differences in cerebral blood flow. Neuroradiology 58, 943–948. doi: 10.1007/s00234-016-1713-y
Liu, Y., Zhu, X., Feinberg, D., Guenther, M., Gregori, J., Weiner, M. W., et al. (2012). Arterial spin labeling MRI study of age and gender effects on brain perfusion hemodynamics. Magn. Reson. Med. 68, 912–922. doi: 10.1002/mrm.23286
Lu, H., Xu, F., Rodrigue, K. M., Kennedy, K. M., Cheng, Y., Flicker, B., et al. (2011). Alterations in cerebral metabolic rate and blood supply across the adult lifespan. Cereb. Cortex 21, 1426–1434. doi: 10.1093/cercor/bhq224bhq224
Ma, Y., Huang, C., Dyke, J. P., Pan, H., Alsop, D., Feigin, A., et al. (2010). Parkinson’s disease spatial covariance pattern: noninvasive quantification with perfusion MRI. J. Cereb. Blood Flow Metab. 30, 505–509. doi: 10.1038/jcbfm.2009.256
Meltzer, C. C., Cantwell, M. N., Greer, P. J., Ben-Eliezer, D., Smith, G., Frank, G., et al. (2000). Does cerebral blood flow decline in healthy aging? A PET study with partial-volume correction. J. Nucl. Med. 41, 1842–1848.
Melzer, T. R., Watts, R., MacAskill, M. R., Pearson, J. F., Rueger, S., Pitcher, T. L., et al. (2011). Arterial spin labelling reveals an abnormal cerebral perfusion pattern in Parkinson’s disease. Brain 134(Pt 3), 845–855. doi: 10.1093/brain/awq377awq377
Michels, L., Warnock, G., Buck, A., Macauda, G., Leh, S. E., Kaelin, A. M., et al. (2016). Arterial spin labeling imaging reveals widespread and Abeta-independent reductions in cerebral blood flow in elderly apolipoprotein epsilon-4 carriers. J. Cereb. Blood Flow Metab. 36, 581–595. doi: 10.1177/0271678X15605847
Moeller, J. R., Ishikawa, T., Dhawan, V., Spetsieris, P., Mandel, F., Alexander, G. E., et al. (1996). The metabolic topography of normal aging. J. Cereb. Blood Flow Metab. 16, 385–398. doi: 10.1097/00004647-199605000-00005
Okonkwo, O. C., Xu, G., Oh, J. M., Dowling, N. M., Carlsson, C. M., Gallagher, C. L., et al. (2014). Cerebral blood flow is diminished in asymptomatic middle-aged adults with maternal history of Alzheimer’s disease. Cereb. Cortex 24, 978–988. doi: 10.1093/cercor/bhs381bhs381
Pantano, P., Baron, J. C., Lebrun-Grandie, P., Duquesnoy, N., Bousser, M. G., and Comar, D. (1984). Regional cerebral blood flow and oxygen consumption in human aging. Stroke 15, 635–641. doi: 10.1161/01.STR.15.4.635
Parkes, L. M., Rashid, W., Chard, D. T., and Tofts, P. S. (2004). Normal cerebral perfusion measurements using arterial spin labeling: reproducibility, stability, and age and gender effects. Magn. Reson. Med. 51, 736–743. doi: 10.1002/mrm.20023
Petit-Taboue, M. C., Landeau, B., Desson, J. F., Desgranges, B., and Baron, J. C. (1998). Effects of healthy aging on the regional cerebral metabolic rate of glucose assessed with statistical parametric mapping. Neuroimage 7, 176–184. doi: 10.1006/nimg.1997.0318
Preibisch, C., Sorg, C., Forschler, A., Grimmer, T., Sax, I., Wohlschlager, A. M., et al. (2011). Age-related cerebral perfusion changes in the parietal and temporal lobes measured by pulsed arterial spin labeling. J. Magn. Reson. Imaging 34, 1295–1302. doi: 10.1002/jmri.22788
Rane, S., Ally, B. A., Hussey, E., Wilson, T., Thornton-Wells, T., Gore, J. C., et al. (2013). Inverse correspondence between hippocampal perfusion and verbal memory performance in older adults. Hippocampus 23, 213–220. doi: 10.1002/hipo.22080
Rowe, C. C., Ellis, K. A., Rimajova, M., Bourgeat, P., Pike, K. E., Jones, G., et al. (2010). Amyloid imaging results from the Australian Imaging, Biomarkers and Lifestyle (AIBL) study of aging. Neurobiol. Aging 31, 1275–1283. doi: 10.1016/j.neurobiolaging.2010.04.007
Shaw, T. G., Mortel, K. F., Meyer, J. S., Rogers, R. L., Hardenberg, J., and Cutaia, M. M. (1984). Cerebral blood flow changes in benign aging and cerebrovascular disease. Neurology 34, 855–862. doi: 10.1212/WNL.34.7.855
Takahashi, K., Yamaguchi, S., Kobayashi, S., and Yamamoto, Y. (2005). Effects of aging on regional cerebral blood flow assessed by using technetium Tc 99m hexamethylpropyleneamine oxime single-photon emission tomography with 3D stereotactic surface projection analysis. AJNR Am. J. Neuroradiol. 26, 2005–2009.
Teune, L. K., Renken, R. J., de Jong, B. M., Willemsen, A. T., van Osch, M. J., Roerdink, J. B., et al. (2014). Parkinson’s disease-related perfusion and glucose metabolic brain patterns identified with PCASL-MRI and FDG-PET imaging. Neuroimage Clin. 5, 240–244. doi: 10.1016/j.nicl.2014.06.007
Wagner, M., Jurcoane, A., Volz, S., Magerkurth, J., Zanella, F. E., Neumann-Haefelin, T., et al. (2012). Age-related changes of cerebral autoregulation: new insights with quantitative T2′-mapping and pulsed arterial spin-labeling MR imaging. AJNR Am. J. Neuroradiol. 33, 2081–2087. doi: 10.3174/ajnr.A3138ajnr.A3138
Wierenga, C. E., Clark, L. R., Dev, S. I., Shin, D. D., Jurick, S. M., Rissman, R. A., et al. (2013). Interaction of age and APOE genotype on cerebral blood flow at rest. J. Alzheimers Dis. 34, 921–935. doi: 10.3233/JAD-121897WV08W26393U62134
Wintermark, M., Sesay, M., Barbier, E., Borbely, K., Dillon, W. P., Eastwood, J. D., et al. (2005). Comparative overview of brain perfusion imaging techniques. Stroke 36, e83–e99. doi: 10.1161/01.STR.0000177839.03321.25
Woodruff-Pak, D. S., Foy, M. R., Akopian, G. G., Lee, K. H., Zach, J., Nguyen, K. P., et al. (2010). Differential effects and rates of normal aging in cerebellum and hippocampus. Proc. Natl. Acad. Sci. U.S.A. 107, 1624–1629. doi: 10.1073/pnas.09142071070914207107
Zhang, N., Gordon, M. L., and Goldberg, T. E. (2017). Cerebral blood flow measured by arterial spin labeling MRI at resting state in normal aging and Alzheimer’s disease. Neurosci. Biobehav. Rev. 72, 168–175. doi: 10.1016/j.neubiorev.2016.11.023
Zlatar, Z. Z., Wierenga, C. E., Bangen, K. J., Liu, T. T., and Jak, A. J. (2014). Increased hippocampal blood flow in sedentary older adults at genetic risk for Alzheimer’s disease. J. Alzheimers Dis. 41, 809–817. doi: 10.3233/JAD-1322529311J2657G6WHR74
Keywords: arterial spin labeling, cerebral blood flow, aging, principal component analysis, scaled subprofile model
Citation: Zhang N, Gordon ML, Ma Y, Chi B, Gomar JJ, Peng S, Kingsley PB, Eidelberg D and Goldberg TE (2018) The Age-Related Perfusion Pattern Measured With Arterial Spin Labeling MRI in Healthy Subjects. Front. Aging Neurosci. 10:214. doi: 10.3389/fnagi.2018.00214
Received: 06 January 2018; Accepted: 25 June 2018;
Published: 17 July 2018.
Edited by:
Pedro Rosa-Neto, McGill University, CanadaReviewed by:
Francesca Trojsi, Università degli Studi della Campania ‘Luigi Vanvitelli’ Naples, ItalyWen Wang, Fourth Military Medical University, China
Copyright © 2018 Zhang, Gordon, Ma, Chi, Gomar, Peng, Kingsley, Eidelberg and Goldberg. This is an open-access article distributed under the terms of the Creative Commons Attribution License (CC BY). The use, distribution or reproduction in other forums is permitted, provided the original author(s) and the copyright owner(s) are credited and that the original publication in this journal is cited, in accordance with accepted academic practice. No use, distribution or reproduction is permitted which does not comply with these terms.
*Correspondence: Marc L. Gordon, mlgordon@northwell.edu
†Present address: Terry E. Goldberg, Division of Geriatric Psychiatry, Columbia University Medical Center, New York, NY, United States