Whose cortical column would that be?
- Institute of Neuroinformatics, University of Zurich and Swiss Federal Institute of Technology Zurich, Zurich, Switzerland
The cortical column has been an invaluable concept to explain the functional organization of the neocortex. While this idea was born out of experiments that cleverly combined electrophysiological recordings with anatomy, no one has ‘seen’ the anatomy of a column. All we know is that when we record through the cortex of primates, ungulates, and carnivores in a trajectory perpendicular to its surface there is a remarkable constancy in the receptive field properties of the neurons regarding one set of stimulus features. There is no obvious morphological analog for this functional architecture, in fact much of the anatomical data seems to challenge it. Here we describe historically the origins of the concept of the cortical column and the struggles of the pioneers to define the columnar architecture. We suggest that in the concept of a ‘canonical circuit’ we may find the means to reconcile the structure of neocortex with its functional architecture. The canonical microcircuit respects the known connectivity of the neocortex, and it is flexible enough to change transiently the architecture of its network in order to perform the required computations.
Origins
Columns are fatally attractive. To Western eyes reared on classical and neoclassical forms, they seem an existential necessity of the built world. For the youthful reader of any neuroscience textbook, they are one of the few memorable facts about the architecture of the neocortex. So convincing are they, and so central to our present day concepts, that vast resources in human and machine time and are being devoted to defining every element and every connection in the cortical column so that a facsimile can be recreated ‘in silico’ (Markram, 2006 ; Helmstaedter et al., 2007 ). Peering down a microscope, squinting at a computer monitor, or listening to the activity at the tip of a microelectrode, one no longer needs the eye or ear of faith to see columns almost everywhere. But it was not always thus: Mountcastle (2003) , reminiscing about his work in the 1950s, wrote, ‘When in 1955–1959 I described the columnar organization of the somatic sensory cortex on the basis of observations made in single neuron recording experiments in cats and monkeys (Mountcastle et al., 1955 ; Mountcastle, 1957 ; Powell and Mountcastle, 1959a ), the report was met with disbelief by many neuroanatomists.’ The reason was simple. The horizontally layered iso-cortex of Oskar Vogt and its cytoarchitectonic divisions into ‘cortical organs’ made vertical subdivisions a non sequitur.
Discovery of Cortical ‘Columns’
Mountcastle claimed that he was not the first to discover columns in the cortex (Mountcastle, 1997 ). He generously gave Lorente de Nó (1949) credit for having imaginatively conjured vertical chains of neurons from his Golgi studies of what Lorente de Nó then thought was the mouse’s ‘acoustic’ cortex [misidentified by Rose (1912) , actually the somatosensory cortex]. However, Lorente de Nó’s data were far from convincing and hardly pointed to the receptive field properties that were mapped by Mountcastle’s electrophysiology. The crucial observation of Mountcastle and colleagues was that although successive cells in a penetration originated from the same receptive field location, the two modalities of light touch and light skin pressure were represented independently within ‘narrow vertical columns or cylinders extending from layer II through layer VI’ (Mountcastle, 1957 ).
Mountcastle (1957) thought that his cortical ‘minicolumns’ had dimensions 30–50 μ in diameter and extended throughout the full thickness of the cortex. The dimensions of the functional columns in the cat were guessed at between one cell and 0.5 mm in diameter, because Mountcastle and his colleagues had great difficulty in finding their electrode tracks in histological sections. When he extended his studies in the monkey with the help of the Oxford anatomist Tom Powell (Mountcastle and Powell, 1959a ,b ; Powell and Mountcastle, 1959a ,b ), their Methods section revealed an extraordinary concern about the accuracy and detail of identifying the electrode tracks. From these analyses, however, they made the far-reaching observation that neurons recorded from penetrations made perpendicular to the surface of the cortex are ‘modality pure’, while penetrations made at an angle showed higher modality change.
Perhaps the most important feature of Mountcastle’s concept of functional columns was its ease of generalization. Thus not only did he demonstrate columns in both cat and monkey, he also initiated a paradigm for probing the functional architecture of any area of the neocortex. A key element was the stability of recordings from single units, which allowed the receptive fields of a sequence of neurons to be mapped in detail. His new neighbors, David Hubel and Torsten Wiesel, who had been hired by Steven Kuffler in 1958, rapidly adopted his paradigm and began to map receptive fields in the cat’s visual cortex in their basement laboratory in the Wilmer Institute of Ophthalmology. Because of Mountcastle’s proximity, columns were in their thinking, but even after their early breakthrough in discovering that the receptive fields of cortical neurons were orientation selective and binocular, they struggled to make sense of how different orientations were represented in the visual cortex (Hubel and Wiesel, 1962 , 1963 ). Following Mountcastle’s experience, their one certainty was that the cells of like orientation selectivity were found a single radial penetration from surface to white matter. By the simple expedient of making multiple electrolytic lesions along an electrode track, they avoided the struggles that Mountcastle and colleagues had had in finding the electrode tracks in histological sections. This ability to have accurate histology of the electrode tracks was an essential component of their entire oeuvre. Their most valuable data was gained from experiments in which they combined anatomy and physiology (Hubel and Wiesel, 2005 , pp. 244–245). The contribution of a long list of anatomists to their work was absolutely key, for these data could not have been obtained had they been using chronic recording techniques and it is unlikely that the ice-cube model would have come into existence at all.
Ocular Dominance and Orientation Sequences
The notion of ocular dominance columns remained a glint in the eyes of Hubel and Wiesel until, by accident, they discovered firmer evidence for them after inducing an artificial divergent squint in young kittens (Hubel and Wiesel, 1965 ). When they recorded from area 17, they found that virtually all cells were monocular, with left or right eye dominated cells being found in equal proportions. In normal controls cats 85% of the cells were binocular. Many years later they recollected that they almost did not begin this recording experiment, because when they tested the kittens’ visual behavior it seemed so normal (Hubel and Wiesel, 2005 ). And as if this were not enough for a single experiment, they made another key discovery: ‘The grouping of the cells into separate eye domains was almost as surprising as the fact they were monocular, for until then we had only been vaguely aware of the division of the cortex into left-eye and right-eye domains – the ocular dominance columns’ (Hubel and Wiesel, 1998 ). With new eyes they returned to the normal adult cat and found sequences of cells strongly dominated by one eye, although at this early stage they described these as a ‘system of parcellation by ocular dominance’, rather than ocular dominance columns (Hubel and Wiesel, 1965 ).
A further crucial observation followed: that the ocular dominance of a neuron was not correlated with its orientation preference. In this respect the columnar systems they described in the visual cortex were quite unlike the somatosensory cortex, in that every neuron in the visual cortex was a member of both columnar systems, whereas neurons in the somatosensory cortex responded to light or deep touch, but not both. Their struggles to understand the representation of orientation were not unexpected, given that their attempts to understand the map of retinotopy were also proving difficult. In their epic 1962 paper on the cat they noted that even within a column defined by common orientation preference, the retinotopic positions of the of successive units showed ‘apparently random staggering of receptive field positions’, and also could change eye dominance. This last observation was puzzling if one imagined the column to be a radial string of cells.
Given the difference in the estimated dimensions of an ocular dominance column (0.5 mm) and an orientation column in the cat (0.1 mm) (Hubel and Wiesel, 1963 ), the ocular dominance should be more stable in a radial penetration than iso-orientation. In both cat and monkey they observed large variations in the size of the receptive field even in radial penetrations (Hubel and Wiesel, 1962 , 1968 , 1974a ). Except in the special case of the whisker representation, they did not regard the topographic representation by itself as a columnar system (Hubel and Wiesel, 1968 , 1974a ), because it is continuous. They interpreted Mountcastle’s concept of the column as a ‘discrete aggregation of cells, each aggregation being separated from its neighbors by vertical walls that intersect the surface (or a given layer) in a mosaic’ (Hubel and Wiesel, 1968 ). On this interpretation, the representation of the whiskers in the somatosensory cortex of the rodent, would qualify as a columnar system, because each whisker is discretely represented. However, in most other respects the columns of the topographic representation of the whiskers are different from the functional columns seen in cat and monkey sensory cortex, which are not created by the topographic map, but emerge from it.
Columns in the Roller
Even in the monkey’s area 17, which Hubel and Wiesel described as a Rolls Royce compared to the Model T Ford of the cat’s (Hubel and Wiesel, 2005 ), the issue of the organization of the orientation columns was puzzling. Their legendary 5-hour-long penetration in area 17 of a squirrel monkey named ‘George’, where they found an exquisitely ordered sequence of clockwise and counter-clockwise changes in orientation through a continuous penetration of 53 recording sites, was also not without mystery, not least because the sequence of orientation was uninterrupted by the non-oriented cells that they had shown in the same paper to be a feature of layer 4 of rhesus monkey cortex (Hubel and Wiesel, 1968 ). In their discussion of these results they expressed their bafflement that the striate cortex seemed to contain regions where orientation columns were orderly, and regions where they were not. Their bafflement was compounded by their observation that there was no hint of such differences structurally. When they looked at their Nissl-stained sections they saw radial fascicles everywhere. Did columns look like cylindrical pillars, or slabs? Did they alternate like a checkerboard, or were the pillars embedded in a matrix of parallel, swirling slabs? These were questions that preoccupied them to such a degree that they employed every old and new technique they could to satisfy their curiosity. The result was the most comprehensive description of the structural and functional architecture of any area of neocortex (Hubel and Wiesel, 1977 ).
What Hubel and Wiesel could show in the visual cortex, but Mountcastle for the somatosensory cortex could not, was that their description of ‘column’ was a misnomer. What the anatomical and physiological methods showed was that the columns were not Greek pillars, but swirling slabs. But by the time their revisionist discovery hit the presses, the term ‘column’ was indelible and the belief in the existence of such a mythical beast clearly remains. The revisionist view of the two systems of ocular dominance and orientation was captured in the ‘ice-cube’ model of the visual cortex, which was first unveiled by Hubel and Wiesel in their Journal of Comparative Neurology paper of 1972 (Hubel and Wiesel, 1972 ). In that paper they had made electrolytic lesions in single laminae of the dorsal lateral geniculate nucleus and induced terminal degeneration in layer 4. This study was one of the rare examples of work that they first reported in a letter to Nature (Hubel and Wiesel, 1969 ). Although their summary diagram had an accelerated entry to the textbooks and remains a perennial favorite, their path to the first ice-cube model was far from fast or easy, as we have seen.
Obituary: Columns?
The simplest conclusion from this brief history is that there is no cortical column, or at least, if there is, it is a structure without a function, as Horton and Adams (2005) poignantly concluded. But although such reports of the death of the column have proved premature, it is clear that there is no single anatomical entity about which there is general agreement. Here we continue to use the term, but only in its historical or metaphorical sense.
A more nuanced view, however, is that in addition to its layered structure, the cortex also organizes its functionality in the vertical dimension, but, as with the layers, the size and shape of these vertical organizations varies greatly. At the most basic level, a cortical area is often defined as the region containing a single topographic representation of a sensory surface, like the retina, skin, and cochlear. These topographic maps are represented vertically in all layers, but not with the same degree of fidelity in each layer. In the unusual case of the discrete sensory representation of the whisker array in rodents, the patch representing a single whisker in layer 4 is elongated – this anisotropy in ‘magnification factor’ presumably reflects the receptor density at the periphery. The closest equivalent to the whisker representation in the visual system is the segregation of the left and right eye inputs to layer 4 – the ocular dominance system of cat and monkey. However, the ocular dominance stripes are highly variable structures and not present in all species (LeVay et al., 1980 , 1985 ; see critique by Horton and Adams, 2005 ). In the rhesus striate cortex (LeVay et al., 1985 ), and in enucleate humans (Adams et al., 2007 ), they are heterogenous in their spacing and vary over a factor of two in their dimensions even in a single hemisphere, whereas the Nissl-stained densities of the cortical cells appear uniform throughout. However there is a larger problem to worry about.
The Harsh Reality of Biology
‘There is one puzzling discrepancy between these physiological results and the morphology. The orientation column thickness is at most the order of 25–30 μm, yet from sections of Golgi material most cells are known to have dendritic and axonal arborizations that extend, apparently in all directions, for distances of up to several millimetres’ (Hubel and Wiesel, 1974a ).
How do cortical neurons organize themselves into the networks that express not only individual properties like orientation selectivity or ocular dominance, but arrange these circuits to express a precise 3-D map of these properties? This central question has never been better posed than in the passage above from Hubel and Wiesel. The second of the two papers that Hubel and Wiesel published in the journal of Comparative Neurology in 1974, is arguably their masterpiece (Hubel and Wiesel, 1974b ). In its palpably deep thought, it synthesized 15 years of intensive description of what they called the ‘machinery’ of striate cortex. In the monkey they had seen the left and right eye ocular dominance columns as having some degree of exchange, so that the monocular layer 4 neurons became progressively more binocular in superficial and deep layers. ‘This is in sharp contrast to the orientation columns, since for these there is no evidence to suggest any cross-talk between one column and its immediately adjoining neighbors’ (Hubel and Wiesel, 1968 ). One of their major interpretations for the existence of columns rested on the concept of economy of connections (Hubel and Wiesel, 1963 ). Their model of serial processing required interconnections between neurons with the same orientation and receptive field position. Hence locating them all in the same column would provide the most economical means of connecting neighbors that needed the same set of thalamic inputs.
Finding Form
Here we highlight some of the problems in achieving this specificity, using some of our own data from the cat. In in vivo experiments we recorded from single cells in cat area 17, classified them physiologically, filled them with horseradish peroxidase, and reconstructed them in 3-D (Martin and Whitteridge, 1984a ). In separate experiments we used optical imaging of the intrinsic signal to obtain 2-D orientation maps (for methodology see Bonhoeffer and Grinvald, 1996 ). Figure 1 shows the boutons of four different neurons from four different cortical layers of area 17. In all these neurons the bouton distribution is not homogenous through space, but instead the axons form clusters of boutons. Binzegger et al. (2007) developed a method to identify these clusters objectively. The results of their algorithm applied to the neurons of Figures 1 A,B are shown in Figure 1 C. The cluster of boutons surrounding the cell body is of particular interest since it forms synapses in the neuron’s ‘own’ minicolumn (we call this cluster ‘proximal’). The proximal clusters not only extend beyond several minicolumns, but are not spatially restricted to the diameter of the dendritic arbor of the minicolumn. This implies that not even specificity of connections could restrict the connections to neurons within a minicolumn. Moreover, if the proximal cluster was the anatomical correlate of columnar organization, the proximal clusters of different neurons would be of similar sizes. Instead, we find that the size of the ‘proximal’ clusters vary greatly between different neurons (Figures 1 D and 2 ).
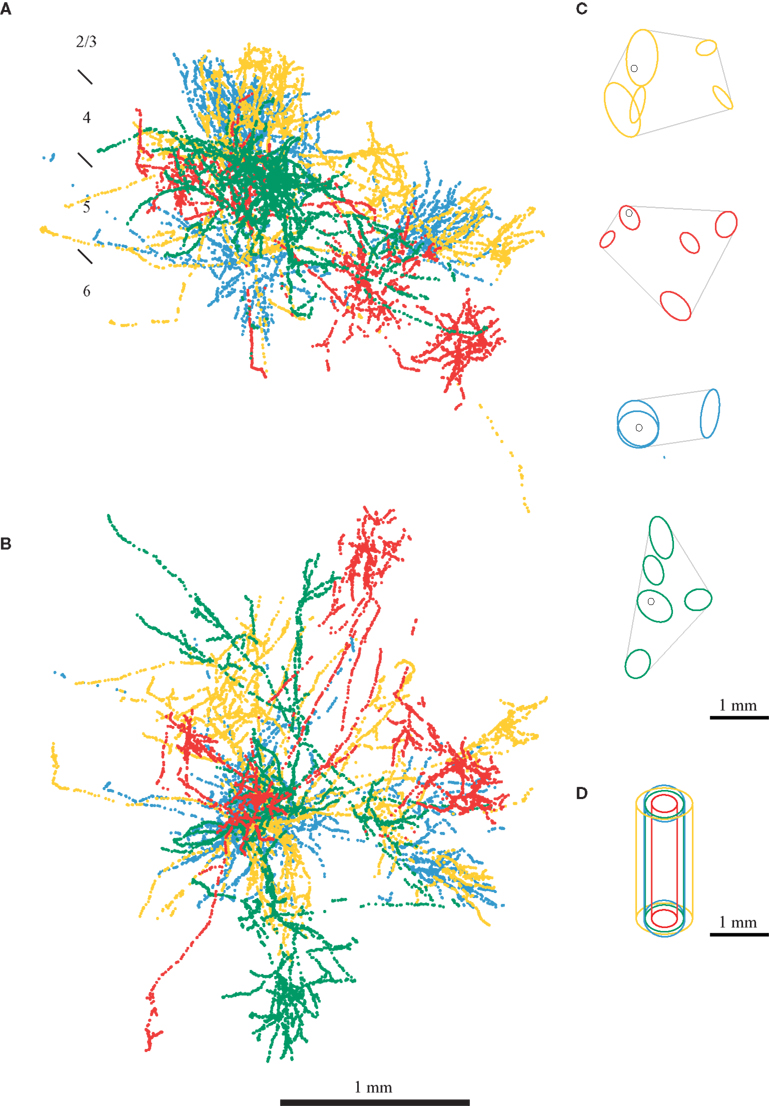
Figure 1. Bouton distribution of four neurons from the primary visual cortex of cat. Axons of neurons from all layers spread over a distance covering the dimensions of many minicolumns. The boutons from a layer 2/3 pyramidal neurons are shown in yellow, from a layer 4 spiny stellate in red, from a layer 5 pyramidal neurons in blue and from a layer 6 pyramidal neuron in green. (A) Coronal view. (B) Top view. (C) Bouton clusters of the axons shown in (A) (adapted from Binzegger et al., 2007 ). (D) Comparison of the size of a cortical column cover by the proximal cluster of boutons of each neuron (Binzegger et al., 2007 ). A cluster is considered proximal if it intersects with the vertical axis running through the soma.

Figure 2. Comparison of the size of the proximal cluster of boutons and functional domains for a single orientation recorded with optical imaging. Proximal clusters formed by neurons of layer 2, 3 and 6 are often larger than the orientation domains. Also apparent is the fact that the size of the proximal clusters varies between different neuronal types. (A–F) Show proximal clusters of different neurons (the cell bodies are shown as white dots) from a single cell type. The clusters are color-coded according to the layer in which they are located. In (C) one of the spiny stellates does not have any proximal cluster, and we show the closest cluster to the cell body. The optical imaging map was obtained by dividing the response to the preferred orientation by the sum response of all orientations (cocktail blank). The neurons had receptive fields that lay within 14° of the fovea. Clusters taken from Binzegger et al. (2007) .
We pursued this comparison between the anatomy of visual cortex and its functional vertical organization by comparing the bouton cluster size with the width of the active patches seen with the optical imaging when a single orientation is displayed. Neurons in the visual cortex are not selective to just a single orientation as implied by the ice-cube model, but have tuning curves that extend over thirty or more degrees of visual angle. Consequentially the region of the cortex that generates a response to any given orientation is necessarily larger than a single minicolumn. The change in preferred orientation over cortical space in the cat and monkey is about 10° every 50 μm, with a complete orientation cycle taking 500–1200 μm (Hubel and Wiesel, 1974a ; Albus, 1975 ). As described by Binzegger et al. (2007) , the proximal cluster of layer 2/3 pyramidal neurons have a lateral extent of about 600 μm, which is sufficient to cover a complete ‘hypercolumn’ – the set of a dozen or more columns representing a full 180° cycle of orientation (Hubel and Wiesel, 1974b ). Here we superimpose the proximal clusters of the excitatory neurons in the database of Binzegger et al. (2007) on a map of a single orientation in area 17 obtained using optical imaging of intrinsic signal (Figure 2 ). The proximal clusters of layer 4 neurons, which project within layer 4 and to the superficial layers, are similar in size to the functional orientation domains (Figures 2 B–D). This correspondence between the size of a single orientation patch and the proximal cluster seen for layer 4 neurons is not apparent for neurons of other layers, especially in the pyramidal neurons of layer 2/3 and 6 (Figures 2 A,F), whose proximal clusters spread beyond the region of active cortex.
In Figure 3 we show a schematic representation of a typical dendritic spread (white circles on the left) together with the smallest and largest diameters of the proximal cluster of layer 2/3 pyramidal neurons (black ellipse). We overlap the schematic of the arbors with a functional map of orientation. The overlap of structure and function indicates that the proximal clusters of layer 2/3 pyramidal neurons (and also some layer 6 pyramidal neurons) form synapses with neurons that lie in domains of the orientation map that have orthogonal orientation preferences to the domain that contains the cell body. Thus, from a simple consideration of the dimensions of the axonal clusters and the functional orientation patches, the situation outlined by Hubel and Wiesel is at least as bad as they imagined. The situation worsens when we consider singularities in the orientation map where the hypercolumn is effectively rotating around a point and regions with different orientation preferences are in very close proximity. Because of their appearance in false color images, these are called ‘pinwheels’ (Bonhoeffer and Grinvald, 1991 ; Maldonado et al., 1997 ; Ohki et al., 2006 ).
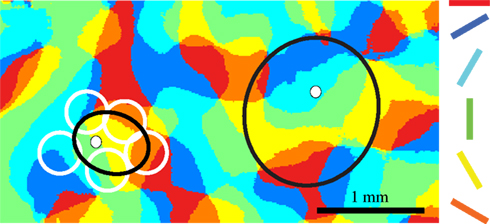
Figure 3 .Spread of proximal boutons over multiple orientation domains. The proximal clusters of neurons in layer 2, 3 and 6 can overlap with dendrites of functional domains representing orthogonal orientations. Proximal cluster of two layer 2/3 pyramidal neurons (black ellipse, the cell body is shown as a white dot) superimposed on an orientation map of area 17. Each region of area 17 is color-coded for its preferred orientation. The white circles surrounding the left cluster represent the coverage of a typical dendritic arbor.
Daisy Fields Forever
‘There is of course no reason why an orientation column should not have rich connections with another column of identical field orientation even though the two might be separated by as many as 15–18 different columns. Indeed, if eye preference columns are interconnected, and if one eye preference column does contain many orientation columns, then the interconnections must be highly specific, one orientation column being connected to another some distance away’ (Hubel and Wiesel, 1968 ). This prediction was vindicated by the experiments of Rockland and Lund, who made bulk injections of tracers into the shrew and primate cortex (Rockland and Lund, 1982 , 1983 ; Rockland et al., 1982 ). They discovered patchy labeled around the periphery of the injection. This patchy connectivity was subsequently found in many cortical regions (Rockland et al., 1982 ; Luhmann et al., 1986 ; Burkhalter and Bernardo, 1989 ; Kisvarday and Eysel, 1992 ; Yoshioka et al., 1992 ; Lund et al., 1993 ; Levitt et al., 1994 ; Fujita and Fujita, 1996 ; Pucak et al., 1996 ; Kisvarday et al., 1997 ; Tanigawa et al., 2005 ). Intracellular studies confirmed that lateral axonal projections of cortical neurons and cortical afferents are patchy (Gilbert and Wiesel, 1979 , 1983 ; Martin and Whitteridge, 1984a ). This clustering is especially prominent for the thalamic afferents and pyramidal cells, but is also true of the smooth neurons.
In their quantitative analysis of the distribution of clusters, Binzegger et al. (2007) discovered that the number of boutons in a cluster is exponentially related to the number of clusters the individual neurons forms. The largest cluster in terms of number of boutons is almost always the proximal cluster. From simply knowing the total number of boutons and the number of clusters, one can predict how many boutons are in the proximal cluster and successive clusters. Regardless of the number of clusters, however, between 30% and 90% of the boutons formed by a superficial layer pyramidal are in the proximal cluster. In a related, but more procrustean analysis, Stepanyants et al. (2009) estimated that 92% of the boutons that lie within a minicolumn originate from cells located more than 100 μm away. Thus, as was evident even from the early intracellular labeling studies (Gilbert and Wiesel, 1979 , 1983 ; Martin and Whitteridge, 1984a ), Hubel and Wiesel (1968) had been mistaken to suppose that neurons within a 30-μm column are much more strongly connected than the connections between these cortical columns.
Outside the proximal cluster, the remaining boutons formed by a superficial layer pyramidal cell are found in layer 5 and in the distal clusters in the superficial layers, where their collaterals form a structure known as the cortical ‘Daisy’ (Douglas and Martin, 2004 , 2007 ). The cortical Daisy is not found in rodents, but appears to be ubiquitous in all cortical areas in other species. It has one interesting property relevant to the discussion, which is that it scales in an interesting, species independent way across cortex. The diameter of the distal clusters (the ‘petals’ of the Daisy), which are formed by the convergence of the axons of many pyramidal cells, is proportional to the distance between the clusters (Douglas and Martin, 2004 ; Binzegger et al., 2007 ) (Figure 4 ). In the Macaque monkey, where the Daisy system has been most intensively studied, the dimensions of the Daisy increase from the occipital cortex to the prefrontal cortex. In the visual cortex, Hubel and Wiesel’s intuition that lateral projections connect like-to-like seems to be borne out in the Daisy (Livingstone and Hubel, 1984 ; Malach et al., 1993 ; Bosking et al., 1997 ; Kisvarday et al., 1997 ), but direct correlations of functional maps with the Daisy structure have not been done for any other areas, because the relevant functional properties are unknown.
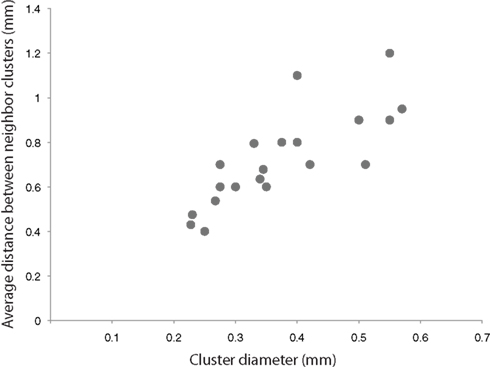
Figure 4 .The diameter of the distal bouton clusters, scales with the distance between the clusters (adapted from Binzegger et al. , 2007 ). Average measurement taken from various cortical areas and species (Rockland et al., 1982 ; Luhmann et al., 1986 ; Burkhalter and Bernardo, 1989 ; Kisvarday and Eysel, 1992 ; Yoshioka et al., 1992 ; Lund et al., 1993 ; Levitt et al., 1994 ; Fujita and Fujita, 1996 ; Kisvarday et al., 1997 ).
Function ÷ Structure = ?
The data presented above indicates that Hubel and Wiesel’s puzzle, with which we began Part II, is real and remains unsolved. Given this mismatch between the size of individual neurons and the regularity of the orientation map, how is it that we find well-tuned oriented cells in the superficial layers? In layer 4 we can always assume as many have (Hubel and Wiesel, 1962 ; Reid and Alonso, 1995 ; Ferster et al., 1996 ; Chung and Ferster, 1998 ) that the orientation selectivity is determined by the thalamic input. This is not so for the superficial and deep layers. We know that pyramidal cells are excitatory and that the major connections made by pyramidal cells are with each other. This is particularly relevant to the pyramidal cells of the superficial layers, where we estimate that most of the excitatory synapses a superficial pyramidal cells forms are with other superficial layer pyramidal cells (Binzegger et al., 2004 ). Thus, the envelope of excitatory input that any one superficial layer pyramidal cells receives must strongly reflect the axonal spread of the superficial layer neurons.
Penelope’s Tapestry
Thickets of ‘Minicolumns’
In the cat (as well as in primate and rodent) the apical dendrites of pyramidal cells form bundles that extend radially through the cortex. These have been called ‘minicolumns’ as they are clear anatomical evidence for columnar organization. The question is whether they bear any relation to the radial columns seen functionally (Peters and Yilmaz, 1993 ; see review by Rockland and Ichinohe, 2004 ). Although Mountcastle (Mountcastle, 1957 , 2003 ; Powell and Mountcastle, 1959a ) was convinced that ‘minicolumns’ were the basis of his functional columns Rockland and Ichinohe (2004) have discussed in some depth why these dendritic bundles do not reflect the functional columns. Moreover, while it is true that apical dendrites are radially aligned, the basal dendrites and axons of cortical pyramidal cells spread laterally over a distance of many minicolumns. This structural organization of the cortical wiring predicts abundant recurrence between different dendritic bundles. An in vitro study in the mice somatosensory cortex indicated that neurons within one bundle are as likely to be connected as neurons between adjacent bundles (Krieger et al., 2007 ).
The concept of the minicolumn highlights again the fundamental discrepancy between structure and function. For Hubel and Wiesel, the column was the structural means whereby the cortex could ‘digest’ the information arising from each small region of the visual field. This phagous process required that the relevant connections were made vertically between the thousands of neurons who shared receptive field locations and other aspects of receptive field specificity, and which could be connected serially to create the simple and complex receptive fields. It is worth noting that the ‘jitter’ in the visual receptive field positions along any radial column does not seem to be accompanied by a comparable jitter in the orientation preference (Hubel and Wiesel, 1962 , 1974b ). This is a paradox if one reflects that the standard feedforward model of orientation selectivity, and indeed the ON and OFF subfield organization of simple cells, requires a very high degree of retinotopic precision and that this precision needs to be propagated in the whole orientation column.
It is ironical that Mountcastle identified Lorente de Nó work as the origin of the concept of the cortical column, when recent evidence indicates that nothing like our textbook view of cortical columns is found in the mouse. In the rodent visual cortex the lack of columns, or indeed any apparent regularity in the map of orientation, is striking when compared to precision in the maps of orientation in carnivores, ungulates and primates (Hubel and Wiesel, 1962 , 1963 , 1968 ; Clarke and Whitteridge, 1976 ; Clarke et al., 1976 ; Girman et al., 1999 ; Ohki et al., 2005 ). The closest approximation to the cortical column is the somatosensory cortex of the mouse and other rodents, where the somatotopic representation of the whiskers is mapped in discrete patches, at least in layer 4. These were the patches that Lorente de Nó described in his study of the mouse cortex (Lorente de Nó, 1922 ). But these whisker representations are the equivalent to the map of visual space in the visual cortex and not at all equivalent to the segregated receptor specific ‘columns’ seen by Mountcastle in the somatosensory cortex of cat and monkey. Nor are they similar to the emergent properties of orientation or binocularity, arranged in swirling slabs, as seen in the cat and monkey visual cortex by Hubel and Wiesel. Indeed, for Hubel and Wiesel, ‘Whether they (the layer 4 whisker patches) should be considered columns seems a matter of taste and semantics’ (Hubel and Wiesel, 1974a ).
Neural Economies
In the visual cortex of whisking rodents, single unit recording provided no indication of columns, orientation or otherwise (Girman et al., 1999 ), although dendritic bundles are present (Peters and Kara, 1987 ). The imaging with calcium indicators confirmed the single unit results in showing an apparently random, column-less distribution of orientation preferences (Ohki et al., 2005 ), so that in the false color representations it looked like a spilled box of Smarties (“M ‘n M’s” in the USA). In appearance this is quite unlike the equivalent representation of candy stripes and colored pinwheels of the orientation maps in tree shrew, cat, ferret and monkey. Koulakov and Chklovskii (2001) suggested that different patterns of orientation columns reflect the operation of a wire minimization constraint in the lateral connections. Interestingly, Hubel and Wiesel (1962 , 1974a) had previously introduced this constraint of ‘economy of wiring’, as an organizing principle for a regular map of orientation. However, the rodent arrangement of spilled Smarties provides efficient wiring only under the constraint that every location has a random mix of neurons of all orientation preferences and that each neuron is required to connect equally to neurons of all orientation preferences. If this latter constraint is relaxed and neurons are allowed to connect more often to other neurons of like preference, then the pattern formed is more like the candy stripes of the ice cube model. The pinwheel/candy stripe patterns arise when both constraints exist and compete – connect to all versus connect only to like.
However, it may be that the problem of explaining the apparent disorder of the rodent orientation system is little different from that of explaining the emergence of a highly ordered orientation maps in the cat, sheep, tree shrew, and monkey. Both systems seem to require the notion of physiological discreteness, whether it be of individual cells, ‘minicolumns’, ice cube slabs, or pinwheels. For example, Hubel and Wiesel (1962 , 1963 , 1968 , 1974a ) were impressed by the abrupt discontinuities they occasionally discovered in tangential penetrations, which they felt was one strong argument for discreteness. Yet, from mouse to monkey visual cortex, the orientation selectivity of individual neurons cannot be accounted for by any evident structural patterning of the dendritic arbor (Martin and Whitteridge, 1984b ; Anderson et al., 1999 ), neither has such discrete patterning has been described for the proximal regions of the axon. Nor is it helpful to appeal to some hidden selectivity of connections that ensures that only like connects to like, since this is excluded by the spill over of the proximal axon cluster into unlike territory (as indicated above and in previous studies, Kisvarday et al., 1997 ; Yousef et al., 2001 ). The intracellular studies also show that like can be synaptically connected to unlike, yet still be well tuned for orientation (Schummers et al., 2002 ; Monier et al., 2003 ).
Conjectures and Representations
One route to understanding this complexity of circuitry is to remind ourselves that each cortical neuron represents not just a receptive field position and an orientation, but is multifunctional. Each neuron represents an array of different functional attributes. ‘Compared with cells in the retina of lateral geniculate body, cortical cells show a marked increase in the number of stimulus parameters that must be specified in order to influence their firing’ (Hubel and Wiesel, 1962 ). This combinatorial property, which was so apparent in the early single unit recordings, is also clearly evident in population recordings. This combinatorial power of the receptive field is revealed in the studies of DeAngelis (1999) and Yen (2007) who confirmed and extended Hubel and Wiesel’s observations that neighboring neurons may share some receptive field properties, but have other properties that very different. Thus they may share orientation and ocular dominance, but differ in the substructure of their receptive fields, or direction preference, or strength of binocular disparity tuning.
Another example is that of Basole et al. (2003) who used electrophysiological and optical recordings of ferret area 17 to show that the same neuronal population could respond to multiple combinations of orientation, length, motion axis and speed. The tuning to each of the stimulus properties was dependent on the others, and the lateral clusters formed by the axons of superficial layer pyramidal cells is one means by which stimulus features from different orientations, directions, etc., are combined within the same region of the visual field. Detailed modeling would be very helpful here to clarify the constraints on the wiring. This view on the responses of cortical neurons might solve the riddle of the elusive and illusive anatomical column, since the location of the columnar response to a particular stimulus feature is not fixed in the cortical sheet, one should not expect either to find anatomical boundaries of the column.
For 50 years, the neocortical column has been our model for the computational unit of the cortex. One very important implication of the columnar model is that the small computational unit is repeated throughout the visual cortex. In moving away from this rather static image of the functional architecture to the idea of repeated canonical circuits, it is not a great leap of the imagination to suppose that all of cortex carries a similar computation on its inputs, whether it be for perception, or more complex cognitive judgements (Barlow, 1980 ).
With this in mind we have developed the concept of a ‘canonical circuit’ for cortex, which embodies the idea of a repeated local circuit that performs some fundamental computations that are common to all areas of neocortex (Douglas et al., 1989 ; Douglas and Martin, 1991 ). The canonical circuit (Figure 5 ) is firmly based on an analysis of the statistics of the connections between the different types of cortical cells and their physiology. The vast majority of these connections are intracortical, either interlaminar or within the same lamina. However, the canonical microcircuit is not a ‘module’, nor does it specify a particular dimension, or number of neurons. Instead it captures some of essential attributes of the rules that govern the connections between different cell types that permit the multiple functions of cortical circuits such as recurrent excitation and inhibition, the amplification of weak inputs from thalamus or other cortical areas, and the balance of excitation and inhibition. How these attributes are employed and deployed, depends of course on the demands of a specific cortical area. An example of the implementation of the idea of the canonical circuit to other cortical regions, is the work of Heinzle et al. (2007) who used the canonical circuit derived from cat visual cortex to successfully model the function of the primate frontal eye field.
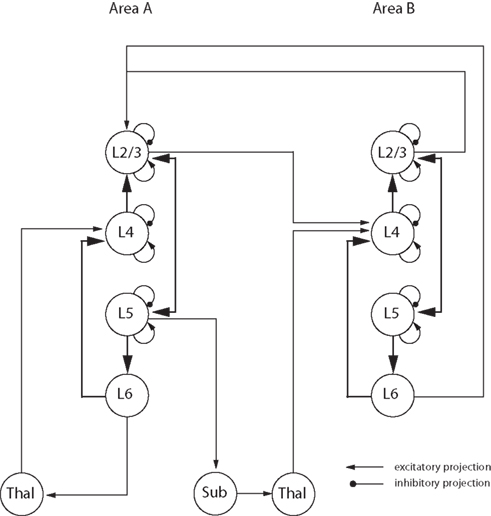
Figure 5. Representation of the major connections in the canonical microcircuit (adapted from Douglas et al. , 1989 ; Douglas and Martin, 1991 , 2004 ). Excitatory connections are represented by arrows and inhibitory ones as lines with round ends. Neurons from different cortical layers or brain structures are represented as circles. ‘Lx’ designates the cortical layer where the cell body is located, ‘Thal’ designates the thalamus and ‘Sub’ designates other subcortical structures.
‘Autopoietic’ Circuits
The dynamical properties of such recurrent networks generate interesting behaviors, when we consider that the cortical circuit is not a static entity, but is a transient entity formed by the subset of currently active neurons (e.g. Binzegger et al., 2009 ; Haeusler et al., 2009 ). Neurons that are below spike threshold are transiently disconnected from the circuit, so through activity the circuit changes its network architecture dynamically. In this sense the circuits are autopoietic: creating themselves by their own interactions and by the transformations of the representations embedded in their connections. An example is the emergence of orientation selectivity from the non-oriented precursors in the thalamus.
Within the canonical cortical circuit, the inhibitory threshold depends on the overall network activity. In the example of orientation selectivity, this inhibitory threshold ensures that only features of the input that match patterns embedded in the weights of the cortical excitatory connections are amplified by the recurrent circuits. Weakly-active neurons are suppressed due to action of the inhibitory network. Thus, the cortical network actively imposes an interpretation on an incomplete or noisy input signal. Different patterns of inputs drive the network towards different fundamental distributions of activity that reflects different aspects of the map of its excitatory connections. It is this dynamic aspect of cortical function that is inherent in the canonical circuit and offers a core circuit that can be replicated throughout neocortex.
Coda
How fortunate is it for us that Mountcastle and Hubel and Wiesel did not begin their seminal single unit studies in the rodent cortex! Any counterfactual history will indicate the significance of the loss that would have been incurred by cortical studies if they had not created a conceptual framework centered on the concept of the cortical column. Through their own studies on cat and monkey cortex they revealed a rich world of cortical structure and function – the ‘functional architecture’ of the cortex. Within this framework, studies of the development and plasticity of cortical columns flourished. Studies of cortical plasticity due to altered rearing provided crucial evidence that there were critical periods during development. The ocular dominance system, which is strongly plastic, and the orientation system, which is not, have both played major roles in understanding the role of visual experience in the maturation of the sensory cortex. It is difficult to see how the enormous expansion of cortical neuroscience would have occurred without their lead and example. Even now a new generation of muscular youth are applying their approach to probe the cortex of Mus musculus, trying to answer the same questions, exchanging optical and genetic methods for the gold-standards of tract-tracing and electrophysiology. Without this paradigm for studying the cortex, and without the central concept of the cortical column, much of the most influential work on neocortex in many different species over the past 50 years simply could not have happened. The column hypothesis has greatly enriched our understanding of the neocortex by providing a coherent description of the functional architecture of the cortex. However, the evident complexity of the structure and function of the component neurons, extracellular matrix, and glia that form the cortical circuits requires a comparable complexity of concepts. This is our Grand Challenge for the 21st century.
Conflict of Interest Statement
The authors declare that the research was conducted in the absence of any commercial or financial relationships that could be construed as a potential conflict of interest.
Acknowledgments
This work was supported by European Union Daisy Project Grant FP6-2005-015803 and Project 5 of SNF NCCR ‘Neural Plasticity and Repair’. We would like to thank John Anderson for the neuronal reconstructions shown in Figure 1 , Tom Binzegger for his sagacity in organizing and archiving these data, and Dylan Muir for Figure 4 .
References
Adams, D. L., Sincich, L. C., and Horton, J. C. (2007). Complete pattern of ocular dominance columns in human primary visual cortex. J. Neurosci. 27, 10391–10403.
Albus, K. (1975). A quantitative study of the projection area of the central and the paracentral visual field in area 17 of the cat. II. The spatial organization of the orientation domain. Exp. Brain Res. 24, 181–202.
Anderson, J. C., Binzegger, T., Kahana, O., Martin, K. A., and Segev, I. (1999). Dendritic asymmetry cannot account for directional responses of neurons in visual cortex. Nat. Neurosci. 2, 820–824.
Barlow, H. B. (1980). “Cortical function: a tentative theory and preliminary test,” in Neural Mechanisms in Behaviour, ed. D. McFadden (New York: Springer-Verlag), 143–171.
Basole, A., White, L. E., and Fitzpatrick, D. (2003). Mapping multiple features in the population response of visual cortex. Nature 423, 986–990.
Binzegger, T., Douglas, R. J., and Martin, K. A. (2004). A quantitative map of the circuit of cat primary visual cortex. J. Neurosci. 24, 8441–8453.
Binzegger, T., Douglas, R. J., and Martin, K. A. (2007). Stereotypical bouton clustering of individual neurons in cat primary visual cortex. J. Neurosci. 27, 12242–12254.
Binzegger, T., Douglas, R. J., and Martin, K. A. (2009). Topology and dynamics of the canonical circuit of cat V1. Neural. Netw. 22, 1071–1078.
Bonhoeffer, T., and Grinvald, A. (1991). Iso-orientation domains in cat visual cortex are arranged in pinwheel-like patterns. Nature 353, 429–431.
Bonhoeffer, T., and Grinvald, A. (1996). “Optical imaging based on intrinsic signals,” in Brain Mapping: The Methods (San Diego, CA: Academic Press, Inc), 55–97.
Bosking, W. H., Zhang, Y., Schofield, B., and Fitzpatrick, D. (1997). Orientation selectivity and the arrangement of horizontal connections in tree shrew striate cortex. J. Neurosci. 17, 2112–2127.
Burkhalter, A., and Bernardo, K. L. (1989). Organization of corticocortical connections in human visual cortex. Proc. Natl. Acad. Sci. U.S.A. 86, 1071–1075.
Chung, S., and Ferster, D. (1998). Strength and orientation tuning of the thalamic input to simple cells revealed by electrically evoked cortical suppression. Neuron 20, 1177–1189.
Clarke, P. G., Donaldson, I. M., and Whitteridge, D. (1976). Binocular visual mechanisms in cortical areas I and II of the sheep. J. Physiol. 256, 509–526.
Clarke, P. G., and Whitteridge, D. (1976). The cortical visual areas of the sheep. J. Physiol. 256, 497–508.
DeAngelis, G. C., Ghose, G. M., Ohzawa, I., and Freeman, R. D. (1999). Functional micro-organization of primary visual cortex: receptive field analysis of nearby neurons. J. Neurosci. 19, 4046–4064.
Douglas, R. J., and Martin, K. A. (1991). A functional microcircuit for cat visual cortex. J. Physiol. 440, 735–769.
Douglas, R. J., and Martin, K. A. (2004). Neuronal circuits of the neocortex. Annu. Rev. Neurosci. 27, 419–451.
Douglas, R. J., and Martin, K. A. (2007). Mapping the matrix: the ways of neocortex. Neuron 56, 226–238.
Douglas, R. J., Martin, K. A., and Whitteridge, D. (1989). A canonical microcircuit for neocortex. Neural. Comput. 1, 480–488.
Ferster, D., Chung, S., and Wheat, H. (1996). Orientation selectivity of thalamic input to simple cells of cat visual cortex. Nature 380, 249–252.
Fujita, I., and Fujita, T. (1996). Intrinsic Connections in the macaque inferior temporal cortex. J. Comp. Neurol. 368, 467–486.
Gilbert, C. D., and Wiesel, T. N. (1979). Morphology and intracortical projections of functionally characterised neurones in the cat visual cortex. Nature 280, 120–125.
Gilbert, C. D., and Wiesel, T. N. (1983). Clustered intrinsic connections in cat visual cortex. J. Neurosci. 3, 1116–1133.
Girman, S. V., Sauve, Y., and Lund, R. D. (1999). Receptive field properties of single neurons in rat primary visual cortex. J. Neurophysiol. 82, 301–311.
Haeusler, S., Schuch, K., and Maass, W. (2009). Motif distribution, dynamical properties, and computational performance of two data-based cortical microcircuit templates. J. Physiol. Paris 103, 73–87.
Heinzle, J., Hepp, K., and Martin, K. A. (2007). A microcircuit model of the frontal eye fields. J. Neurosci. 27, 9341–9353.
Helmstaedter, M., de Kock, C. P., Feldmeyer, D., Bruno, R. M., and Sakmann, B. (2007). Reconstruction of an average cortical column in silico. Brain Res. Rev. 55, 193–203.
Horton, J. C., and Adams, D. L. (2005). The cortical column: a structure without a function. Philos. Trans. R. Soc. Lond., B, Biol. Sci. 360, 837–862.
Hubel, D. H., and Wiesel, T. N. (1962). Receptive fields, binocular interaction and functional architecture in the cat’s visual cortex. J. Physiol. 160, 106–154.
Hubel, D. H., and Wiesel, T. N. (1963). Shape and arrangement of columns in cat’s striate cortex. J. Physiol. 165, 559–568.
Hubel, D. H., and Wiesel, T. N. (1965). Binocular interaction in striate cortex of kittens reared with artificial squint. J. Neurophysiol. 28, 1041–1059.
Hubel, D. H., and Wiesel, T. N. (1968). Receptive fields and functional architecture of monkey striate cortex. J. Physiol. 195, 215–243.
Hubel, D. H., and Wiesel, T. N. (1969). Anatomical demonstration of columns in the monkey striate cortex. Nature 221, 747–750.
Hubel, D. H., and Wiesel, T. N. (1972). Laminar and columnar distribution of geniculo-cortical fibers in the macaque monkey. J. Comp. Neurol. 146, 421–450.
Hubel, D. H., and Wiesel, T. N. (1974a). Sequence regularity and geometry of orientation columns in the monkey striate cortex. J. Comp. Neurol. 158, 267–293.
Hubel, D. H., and Wiesel, T. N. (1974b). Uniformity of monkey striate cortex: a parallel relationship between field size, scatter, and magnification factor. J. Comp. Neurol. 158, 295–305.
Hubel, D. H., and Wiesel, T. N. (1977). Ferrier lecture. Functional architecture of macaque monkey visual cortex. Proc. R. Soc. Lond., B, Biol. Sci. 198, 1–59.
Hubel, D. H., and Wiesel, T. N. (2005). Brain and Visual Perception: The Story of a 25-year Collaboration. New York: Oxford University Press.
Kisvarday, Z. F., and Eysel, U. T. (1992). Cellular organization of reciprocal patchy networks in layer III of cat visual cortex (area 17). Neuroscience 46, 275–286.
Kisvarday, Z. F., Toth, E., Rausch, M., and Eysel, U. T. (1997). Orientation-specific relationship between populations of excitatory and inhibitory lateral connections in the visual cortex of the cat. Cereb. Cortex 7, 605–618.
Koulakov, A. A., and Chklovskii, D. B. (2001). Orientation preference patterns in mammalian visual cortex: a wire length minimization approach. Neuron 29, 519–527.
Krieger, P., Kuner, T., and Sakmann, B. (2007). Synaptic connections between layer 5B pyramidal neurons in mouse somatosensory cortex are independent of apical dendrite bundling. J. Neurosci. 27, 11473–11482.
LeVay, S., Connolly, M., Houde, J., and Van Essen, D. C. (1985). The complete pattern of ocular dominance stripes in the striate cortex and visual field of the macaque monkey. J. Neurosci. 5, 486–501.
LeVay, S., Wiesel, T. N., and Hubel, D. H. (1980). The development of ocular dominance columns in normal and visually deprived monkeys. J. Comp. Neurol. 191, 1–51.
Levitt, J. B., Yoshioka, T., and Lund, J. S. (1994). Intrinsic cortical connections in macaque visual area V2: evidence for interaction between different functional streams. J. Comp. Neurol. 342, 551–570.
Livingstone, M. S., and Hubel, D. H. (1984). Specificity of intrinsic connections in primate primary visual cortex. J. Neurosci. 4, 2830–2835.
Lorente de Nó, R. (1922). La corteza cerebral del ratón (primera contribución — la corteza acústica.). Trabajos del Laboratorio de Investigaciones Biológicas de la Universidad de Madrid, Vol. 20. Madrid: Universidad de Madrid, 41–78.
Lorente de Nó, R. (1949). “Cerebral cortex: architecture, intracortical connections, motor projections,” in Physiology of the Nervous System, ed. J. F. Fulton (New York: Oxford University Press), 288–312.
Luhmann, H. J., Martinez Millan, L., and Singer, W. (1986). Development of horizontal intrinsic connections in cat striate cortex. Exp. Brain Res. 63, 443–448.
Lund, J. S., Yoshioka, T., and Levitt, J. B. (1993). Comparison of intrinsic connectivity in different areas of macaque monkey cerebral cortex. Cereb. Cortex 3, 148–162.
Malach, R., Amir, Y., Harel, M., and Grinvald, A. (1993). Relationship between intrinsic connections and functional architecture revealed by optical imaging and in vivo targeted biocytin injections in primate striate cortex. Proc. Natl. Acad. Sci. U.S.A. 90, 10469–10473.
Maldonado, P. E., Godecke, I., Gray, C. M., and Bonhoeffer, T. (1997). Orientation selectivity in pinwheel centers in cat striate cortex. Science 276, 1551–1555.
Martin, K. A., and Whitteridge, D. (1984a). Form, function and intracortical projections of spiny neurones in the striate visual cortex of the cat. J. Physiol. 353, 463–504.
Martin, K. A., and Whitteridge, D. (1984b). The relationship of receptive field properties to the dendritic shape of neurones in the cat striate cortex. J. Physiol. 356, 291–302.
Monier, C., Chavane, F., Baudot, P., Graham, L. J., and Fregnac, Y. (2003). Orientation and direction selectivity of synaptic inputs in visual cortical neurons: a diversity of combinations produces spike tuning. Neuron 37, 663–680.
Mountcastle, V. B. (1957). Modality and topographic properties of single neurons of cat’s somatic sensory cortex. J. Neurophysiol. 20, 408–434.
Mountcastle, V. B., Berman, A. L., and Davies, P. W. (1955). Topographic organization and modality representation in first somatic area of cat’s cerebral cortex by method of single unit analysis. Am. J. Physiol. 183, 646.
Mountcastle, V. B., and Powell, T. P. (1959a). Central nervous mechanisms subserving position sense and kinesthesis. Bull. Johns Hopkins Hosp. 105, 173–200.
Mountcastle, V. B., and Powell, T. P. (1959b). Neural mechanisms subserving cutaneous sensibility, with special reference to the role of afferent inhibition in sensory perception and discrimination. Bull. Johns Hopkins Hosp. 105, 201–232.
Ohki, K., Chung, S., Ch’ng, Y. H., Kara, P., and Reid, R. C. (2005). Functional imaging with cellular resolution reveals precise micro-architecture in visual cortex. Nature 433, 597–603.
Ohki, K., Chung, S., Kara, P., Hubener, M., Bonhoeffer, T., and Reid, R. C. (2006). Highly ordered arrangement of single neurons in orientation pinwheels. Nature 442, 925–928.
Peters, A., and Kara, D. A. (1987). The neuronal composition of area 17 of rat visual cortex. IV. The organization of pyramidal cells. J. Comp. Neurol. 260, 573–590.
Peters, A., and Yilmaz, E. (1993). Neuronal organization in area 17 of cat visual cortex. Cereb. Cortex 3, 49–68.
Powell, T. P., and Mountcastle, V. B. (1959a). Some aspects of the functional organization of the cortex of the postcentral gyrus of the monkey: a correlation of findings obtained in a single unit analysis with cytoarchitecture. Bull. Johns Hopkins Hosp. 105, 133–162.
Powell, T. P., and Mountcastle, V. B. (1959b). The cytoarchitecture of the postcentral gyrus of the monkey Macaca mulatta. Bull. Johns Hopkins Hosp. 105, 108–131.
Pucak, M. L., Levitt, J. B., Lund, J. S., and Lewis, D. A. (1996). Patterns of intrinsic and associational circuitry in monkey prefrontal cortex. J. Comp. Neurol. 376, 614–630.
Reid, R. C., and Alonso, J. M. (1995). Specificity of monosynaptic connections from thalamus to visual cortex. Nature 378, 281–284.
Rockland, K. S., and Ichinohe, N. (2004). Some thoughts on cortical minicolumns. Exp. Brain Res. 158, 265–277.
Rockland, K. S., and Lund, J. S. (1982). Widespread periodic intrinsic connections in the tree shrew visual cortex. Science 215, 1532–1534.
Rockland, K. S., and Lund, J. S. (1983). Intrinsic laminar lattice connections in primate visual cortex. J. Comp. Neurol. 216, 303–318.
Rockland, K. S., Lund, J. S., and Humphrey, A. L. (1982). Anatomical binding of intrinsic connections in striate cortex of tree shrews (Tupaia glis). J. Comp. Neurol. 209, 41–58.
Rose, M. (1912). histologische Lokalization der Großhirnrinde bei kleinen Saügetieren (Rodentia, Insectivora, Chiroptera). J. Psychol. Neurol. 19, 119–479.
Schummers, J., Marino, J., and Sur, M. (2002). Synaptic integration by V1 neurons depends on location within the orientation map. Neuron 36, 969–978.
Stepanyants, A., Martinez, L. M., Ferecsko, A. S., and Kisvarday, Z. F. (2009). The fractions of short- and long-range connections in the visual cortex. Proc. Natl. Acad. Sci. U.S.A. 106, 3555–3560.
Tanigawa, H., Wang, Q., and Fujita, I. (2005). Organization of horizontal axons in the inferior temporal cortex and primary visual cortex of the macaque monkey. Cereb. Cortex 15, 1887–1899.
Yen, S. C., Baker, J., and Gray, C. M. (2007). Heterogeneity in the responses of adjacent neurons to natural stimuli in cat striate cortex. J. Neurophysiol. 97, 1326–1341.
Yoshioka, T., Levitt, J. B., and Lund, J. S. (1992). Intrinsic lattice connections of macaque monkey visual cortical area V4. J. Neurosci. 12, 2785–2802.
Keywords: cortical column, Daisy, bouton cluster, neuroanatomy, canonical microcircuit
Citation: da Costa NM and Martin KAC (2010) Whose cortical column would that be? Front. Neuroanat. 4:16. doi: 10.3389/fnana.2010.00016
Received: 15 December 2009;
Paper pending published: 21 February 2010;
Accepted: 08 April 2010;
Published online: 31 May 2010
Edited by:
Javier DeFelipe, Cajal Institute, SpainReviewed by:
Shaul Hestrin, Stanford University, USAKathleen S. Rockland, Massachusetts Institute of Technology, USA
Copyright: © 2010 da Costa and Martin. This is an open-access article subject to an exclusive license agreement between the authors and the Frontiers Research Foundation, which permits unrestricted use, distribution, and reproduction in any medium, provided the original authors and source are credited.
*Correspondence:
Nuno Maçarico da Costa, Institute of Neuroinformatics, University of Zurich and Swiss Federal Institute of Technology Zurich, Winterthurerstrasse 190, 8057 Zurich, Switzerland. e-mail: ndacosta@ini.phys.ethz.ch;
Kevan A. C. Martin, Institute of Neuroinformatics, University of Zurich and Swiss Federal Institute of Technology Zurich, Winterthurerstrasse 190, 8057 Zurich, Switzerland. e-mail: kevan@ini.phys.ethz.ch