Cell Densities in the Mouse Brain: A Systematic Review
 Daniel Keller
 Csaba Erö
 Henry Markram
- Blue Brain Project, École Polytechnique Fédérale de Lausanne, Geneva, Switzerland
The mouse brain is the most extensively studied brain of all species. We performed an exhaustive review of the literature to establish our current state of knowledge on cell numbers in mouse brain regions, arguably the most fundamental property to measure when attempting to understand a brain. The synthesized information, collected in one place, can be used by both theorists and experimentalists. Although for commonly-studied regions cell densities could be obtained for principal cell types, overall we know very little about how many cells are present in most brain regions and even less about cell-type specific densities. There is also substantial variation in cell density values obtained from different sources. This suggests that we need a new approach to obtain cell density datasets for the mouse brain.
Introduction
Here we review what is actually known about total cell density and cell-type specific density in the whole mouse brain and in the different brain regions. To our knowledge, this is the first attempt to determine the full corpus of knowledge available today on cell densities for all regions of the mouse brain.
Establishing the numbers of cells in the brain is arguably the first step when developing a complete catalog of cell-types as proposed by the Cell Census Network effort of the BRAIN Initiative (Bargmann et al., 2014). Cell density data could provide constraints when attempting to understand the brain's organization and function. For example, they could be used to help quantify the differences between species, calculate the energy consumption in different regions, understand the role of specific types of neurons in different brain regions and the computational properties and capabilities of different brain regions, and map and understand the connectome (Srinivasan et al., 2015; Weigand et al., 2017). They are also essential in integrative attempts to reconstruct and simulate the brain (Markram, 2006; Markram et al., 2015).
Today, there are some estimates for the cell numbers in the whole brain of several species (Lange, 1975; Herculano-Houzel et al., 2006, 2007), but how much do we know about the density of cells in each brain region? How much do we know about the density of specific cell-types in each brain region? How reliable are the estimates that have been reported? To answer these questions, we drew from the corpus of experimental literature that either provided such data directly or measurements that could be readily transformed into cell density. We adopted a standardized approach for transforming and analyzing data, and quantified the variability for different estimates of neuron density within regions and between different regions.
Cells within the central nervous system can be broadly classified into neurons, glia, endothelial cells, and pericytes (Kandel, 2013). These categories in turn are subject to further sub-classification. Neurons are functionally categorized according to whether they are excitatory, inhibitory, or neuromodulatory, electrically categorized by the manner in which they respond to stimulation, and anatomically categorized by the morphology of the dendrites and axons, their afferent and efferent projections and the specific proteins and genes that they express. Inhibitory interneurons are functionally categorized by their hypothesized impact on excitatory neurons, electrically categorized by their response properties, and anatomically categorized by their morphology and by their expression of specific proteins and genes (Markram et al., 2004). Neuromodulatory neurons are categorized according to the neuromodulatory neurotransmitter they produce (dopamine, noradrenaline, serotonin, histamine, etc…) and the brain regions where they reside in. Glia can be divided into two principal types: microglia and macroglia. Microglia play an immunological and scavenging role in the brain. Macroglia on the other hand can play diverse roles. Astrocytes, for example, support the neurotransmitter, ionic and metabolic needs of neurons; oligodendrocytes support the axons by producing myelin; endothelial cells line larger blood vessels, and pericytes support the smaller capillaries. Cells of different types can often be distinguished by marker expression and morphology.
We performed a large-scale search for reports cell densities and numbers within the adult mouse brain, focusing on what is known about the densities of neurons, endothelial cells, astrocytes, oligodendrocytes, and microglia. In principle, astrocytes, oligodendrocytes, microglia, and the other glia subtypes should sum up to equal the total glial densities reported in the literature. When possible, neurons were divided into excitatory cells and inhibitory interneurons. Numbers for other region-specific neuron types were also examined: dopaminergic neurons in the basal ganglia, granule cells in the hippocampus, and Purkinje and granule cells in the cerebellum.
Within the literature, cell density is estimated using several methodologies, including stereology, optical fractionation, simple estimation from micrographs, and whole-brain imaging. As discussed in the methods section, each approach has different degrees of reliability. This review combines and compares numbers obtained by disparate methods.
Methods
We strove to consider all published literature and dissertations which reported cell density and numbers for particular structures, which amounts to a corpus of literature spanning 60 years up to mid-2018. Papers were first identified using Pubmed and Google Scholar. References within identified papers were traced to identify additional sources. In some reports, it was necessary to extract data from bar plots by digitizing the graph and measuring the image.
The mouse strain, age, and gender were chosen in order to constrain the scope of the review. Cell densities can vary somewhat among mice of different strains (Nelson et al., 1998; Mozhui et al., 2007). We chose C57Bl/6 as the reference strain, as it is most frequently employed in experiments, though for some parameters only data from other strains was available. Male adult animals aged 55 days were preferentially studied, though sometimes only data from other ages or females was available. In such instances, data from animals older than P28 was preferentially used, since before this age the animals are still developing and rapidly changing.
Different markers which identify specific cell populations are generally used in studies that report cell density numbers. Most commonly, NeuN is used to mark neurons, S100β, CNPase, and Iba1 to mark oligodendrocytes, and S100β, Glial Fibrillary Acidic Protein (GFAP) and glutamine synthetase (GS) to mark astrocytes. However, some markers exhibit either incomplete coverage of the target cell population or label multiple cell types. For example, not all astrocytes express GFAP in the cortex and hippocampus of adult animals (Ling and Leblond, 1973; Kitamura et al., 1987; Walz and Lang, 1998; Savchenko et al., 2000). Therefore, relying only on this marker to identify astrocytes results in systematic undercounting (Wu et al., 2005) In addition to oligodendrocytes, antibodies directed against S100β, a member of the large S100 calcium-binding protein family, also label astrocytes (Grosche et al., 2013). In fact, S100β is expressed in more astrocytes than is GFAP (Rickmann and Wolff, 1995a,b). Even using light microscopy, oligodendrocytes and astrocytes can be distinguished by morphology, allowing S100β to be used to obtain density estimates for both types of cells. Oligodendrocytes also express CNPase (2′,3′-Cyclic-nucleotide 3′-phosphodiesterase), and the promoter element is commonly used to drive GFP expression for identifying oligodendrocyte populations (Vinet et al., 2010). Activated microglia are commonly labeled with Iba1 (Jinno et al., 2007).
Relevant papers reported several types of numbers: cell density, numbers of neurons in a particular structure as counted stereologically, or numbers of neurons in a slice or sampling region. Most studies do not directly study adult wild type mice as an end in itself, but instead test an experimental modification. In such cases, we could still use the data from the control cases corresponding to the wild type condition. When multiple measurements from mice were available from a single source, the mean value of all measurements was used. We should emphasize that many of the density numbers reported here were not directly reported in the original publications but rather are our own estimates derived from the data in the original paper. Calculations are provided in the Supplemental Material.
The most accurate and highly-refined method of measuring cell densities is via stereology, which uses statistical extrapolation during cell counting to obtain an estimate (Mouton, 2014). Stereologists count cells in a measured region directly, and generally have access to relevant parameters such as the degree of tissue shrinkage.
Sometimes cell density estimates are not given explicitly, but rather reported in two-dimensional (2D) micrographs of a single slice without any further correction (see Supplementary Material). It was thus necessary to divide by slice thickness to obtain volumetric density. This was done to analyze some measurements (Trune, 1982; Shimada et al., 1992; Caggiano and Brunjes, 1993; Anderson et al., 1998; Geisert et al., 2002; Angenstein et al., 2008; Lorke et al., 2008; Pernet et al., 2008; Jahanshahi et al., 2009; Pott et al., 2009; Richard et al., 2010; Binder et al., 2011; Sargeant et al., 2011 Huang et al., 2012; Barrera et al., 2013; Pitts et al., 2013; Reyes-Haro et al., 2013; Schmid et al., 2013; Chen et al., 2014). The corresponding estimates can be expected to be influenced by error in the slice thickness as well as by occlusion effects of overlapping cells. Furthermore, if cut neuronal cell bodies at the edges are not explicitly compensated for, the neuronal density estimate can be inaccurate. Edge effect error can be expected to decrease with increasing slice thickness.
In certain cases, only an absolute cell number for a given structure was reported (Heumann and Rabinowicz, 1980; Sturrock, 1989, 1991; Bayer et al., 1994; Bing et al., 1994; Scott et al., 1994; Jeffrey et al., 1995; Hadj-Sahraoui et al., 1996; Kempermann et al., 1997; Cunningham et al., 1999; Doulazmi et al., 1999; Andsberg et al., 2001; Geisert et al., 2002; Wirenfeldt et al., 2003; Woodruff-Pak, 2006; Zhang et al., 2007, 2012; Fabricius et al., 2008; Morris et al., 2008; Burguet et al., 2009; Dursun et al., 2011; Kuronen et al., 2012; Mouton, 2014). For example, the isotropic fractionator is a method that produces cell counts by first transforming dissected brain regions into isotropic suspensions of brain nuclei, which can be then counted and classified as neuronal or non-neuronal (Herculano-Houzel and Lent, 2005). Total cell counts for structures are reported. To obtain cell density when only an absolute number in a structure is given, it is necessary to divide the number in the structure by the volume of the structure. Volume estimates were taken from either the source paper, when possible, or from other sources such as the Allen Brain Atlas (Lein et al., 2007). When the volume comes from a different source, it is potentially influenced by subjective differences in identifying the boundaries of the structures.
Some experimental approaches may themselves be subject to inherent bias. For example, if no shrinkage factor is given when counting cells in a block of fixed tissue, the resulting cell densities most likely are overestimations. Using markers that do not stain every cell in a target population will produce systematic underestimation of the target population. It is difficult to compensate for such bias in a rigorous manner, given that the parameters needed to compensate are largely unknown. Systematic bias therefore likely contributes to the variability observed when data obtained using different approaches is combined.
Papers were screened according to whether the results were in a plausible range of values. If at least three papers reported a mean value for a particular parameter in a given region and a candidate paper reported a value more than a factor of two different than the consensus, the candidate paper was omitted for further consideration.
When combining the results of different studies, we assign equal weight per source. It is true that the number of samples used to estimate a value vary from source to source, but the methods used were so different as to preclude finer-grained pooling. We do not believe that the policy of equal weight per source introduces systematic bias into the review procedure.
The principal way of evaluating the results is by assessing the mean and standard deviation of estimates within individual brain regions and the standard deviation between average values in different brain regions. We also evaluate the degree of coverage of principal cell types for which data could be found in the major brain regions.
Results
We screened 101 papers reporting density-related information in the mouse. Of those papers, four were culled according to the removal criteria outlined above. Neuron densities are best characterized in the cortex, hippocampus, cerebellum, and striatum. Data for other subcortical structures and nuclei are sparse.
Neocortex
The cortex is located on the outside of the brain and is made of gray matter containing many neuronal cell bodies and relatively few myelinated axons. It is composed of multiple layers, each with different densities. Most excitatory cells are pyramidal cells, and non-neuronal cells outnumber neurons. Inhibitory GABAergic interneurons make up 15–20% of all cortical neurons (Gentet et al., 2000).
The density of neurons also varies across cortical areas. Table 1 lists relevant densities for cortex. Estimates of neuronal density range from 48,000 cells/mm3 in orbital cortex to 155,000 cells/mm3in visual cortex (see Table 1). Averaging neurons across all areas in Table 1 gives an average of 92,616 ± 25,000 cells/mm3 (mean ± std). In Table 1, estimates for total cell density are generally less than the sum of neuronal and non-neuronal densities, but larger than neuronal densities found in other work. The total cell density estimates were obtained using propidium iodide to stain all cellular nuclei in the CUBIC-X protocol (Murakami et al., 2018). The estimates used in the table may be better regarded as intermediate between total neurons and total cells, or a lower bound on the number of total cells.
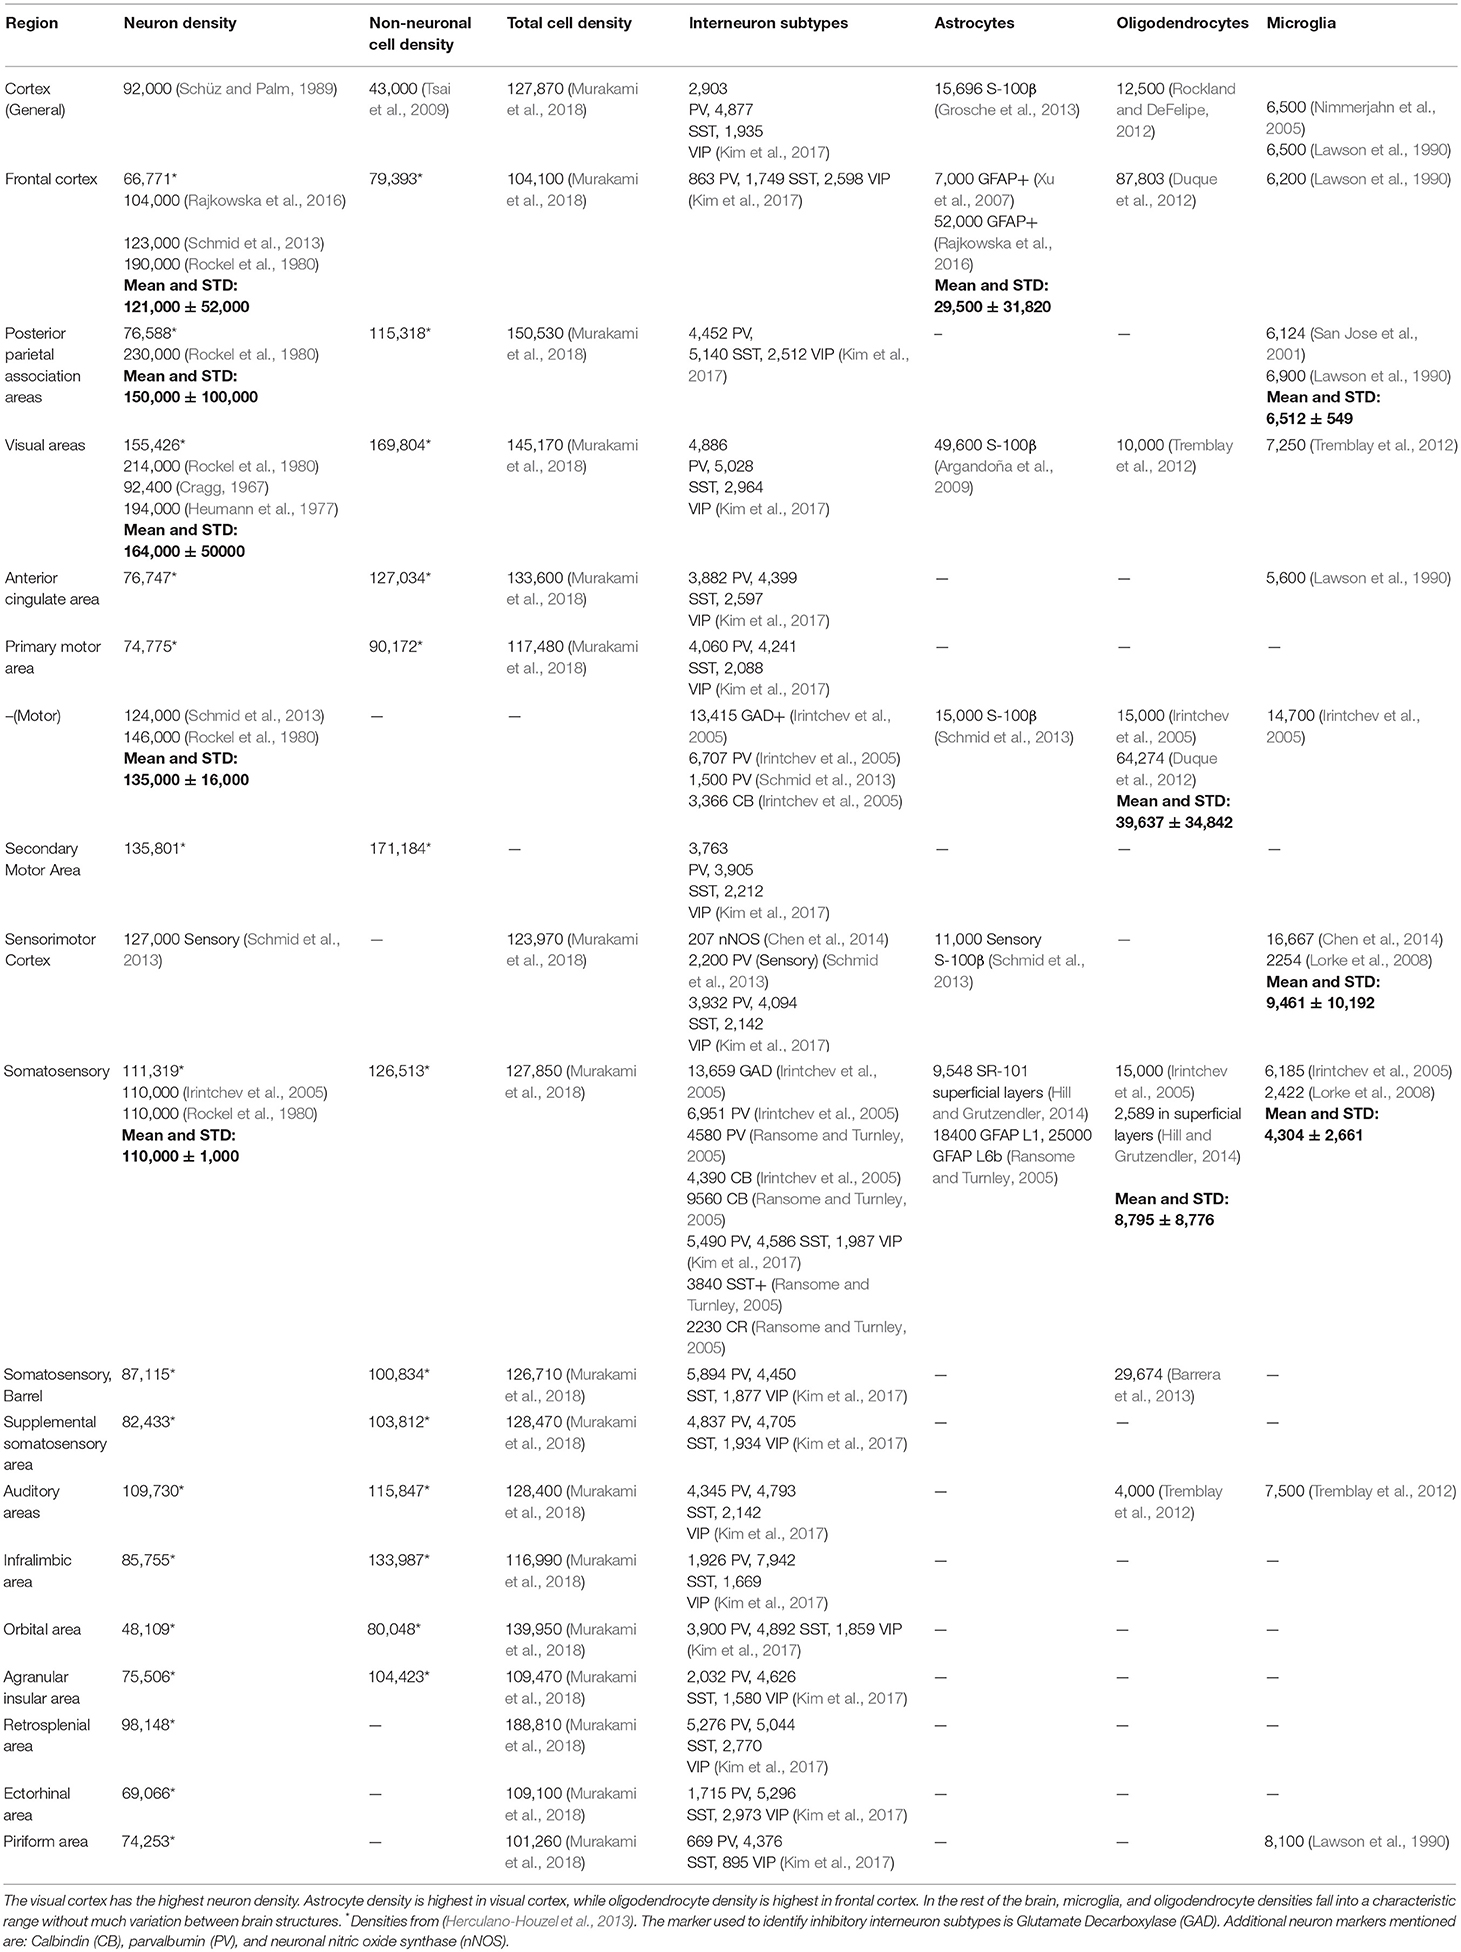
Table 1. Estimates of Cortical Density.
A variety of non-neuronal cells are present in cortex. Averaging the obtained astrocytic densities across available reports listed in Table 1 yields 20,000 ± 13,000 cells/mm3 (mean ± std); a mean ratio of astrocytes to neurons of 0.2 ± 0.1. Overall in cortex, endothelial cell density is 70,000 cells/mm3 (Niedowicz et al., 2014) and total glia density is 36,364 cells/mm3 (Geisert et al., 2002). Estimates of oligodendrocyte density varied widely, even for the same region. The average cortical density of microglia in Table 1 is 8,500 ± 3,900 cells/mm3. In the lesser-studied cortical regions, data for astrocytes, oligodendrocytes, and microglia is not readily available.
Neuronal densities vary across layers (Figure 1A). Excitatory neuron density peaks in the upper part of layer 4 and has a secondary peak in the deeper layers, while inhibitory neuron density is highest in layer 2 (Figure 1B). The excitatory peak approached 200,000 cells/mm3 while the layer 2 inhibitory peak was more than 10,000 cells/mm3 (Meyer et al., 2010, 2011).
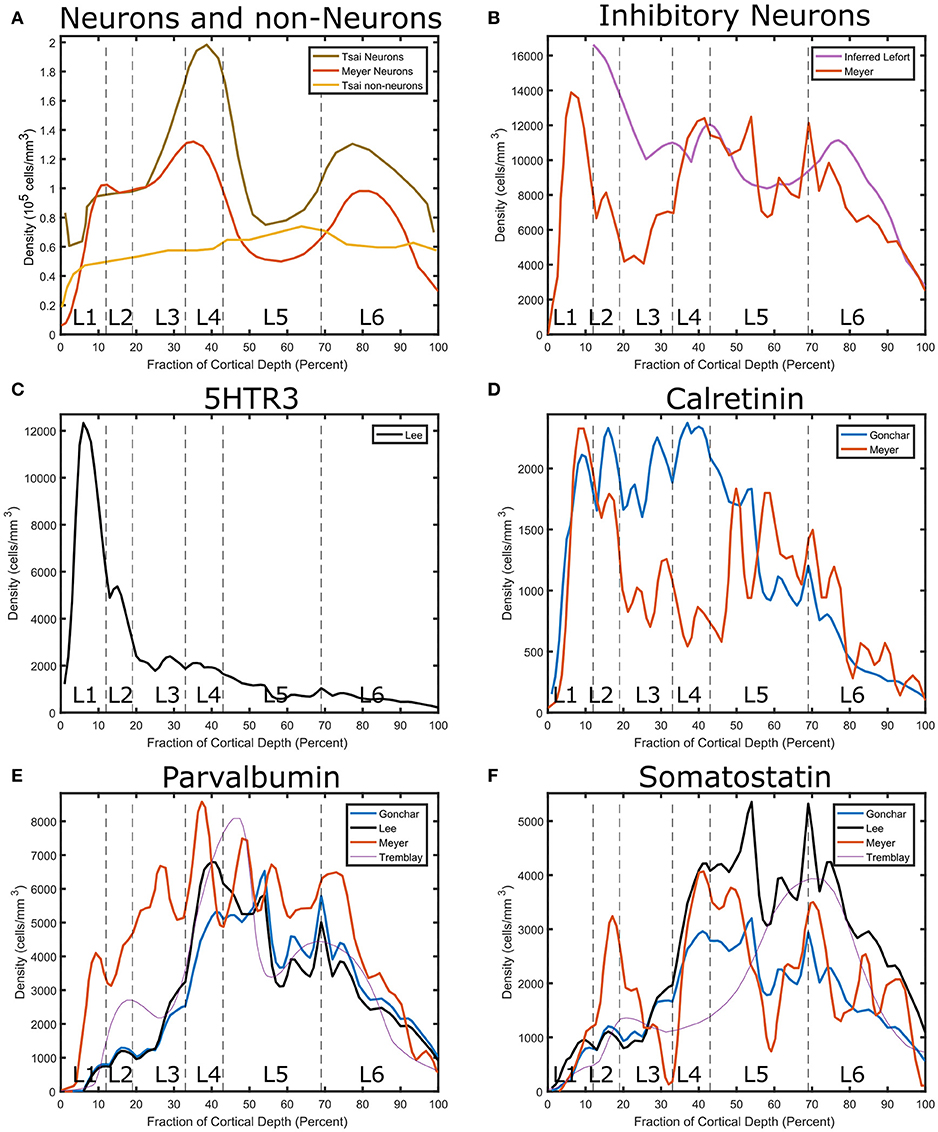
Figure 1. Layer-specific estimates of cell densities in granular cortex (Tsai et al., 2009) barrel cortex S1 (Meyer et al., 2010) and visual cortex (Gonchar et al., 2007) and somatosensory cortex (Lee et al., 2010,?). (A) Comparison between neurons and other types. Both data sets show a peak in layer 4 neuronal density and have a secondary peak in layer 6. (B) Interneuron Density. The layer-specific fraction of interneurons reported in Lefort et al. (2009) was multiplied by the neuron density reported in Tsai et al. (2009) for comparison to the Meyer data. Interneurons exhibit a peak in Layer 1, which is however not included in the Lefort data set. To obtain marker specific interneuron densities, the fraction of interneurons in each layer reported in Lee et al. (2010) and Gonchar et al. (2007) was multiplied by the interneuron density reported by Meyer. (C) Serotonin receptor distribution. It exhibits a peak in the superficial layers. The normalized Tremblay inhibitory density sum was scaled to match the inhibitory density from Meyer. (D) Calretinin distribution. It shows a peak in the central part of the cortex. (E) Parvalbumin distribution. (F) Somatostatin distribution.
Cortical interneurons can be coarsely categorized into three subtypes depending on primary markers expressed: the neuropeptide somatostatin (SST), parvalbumin (PV), and the ionotropic serotonin receptor 5HT3a (5HT3aR) (Rudy et al., 2011). The SST subtype comprises 30% of GABAergic neurons and the PV type is about 40% (ibid.). The 5HT3aR group forms the remaining 30% of the total interneuronal population. The 5HT3aR group is quite varied and is equally divided into all of the neurons that express the vasointestinal peptide (VIP) and another subgroup that does not express VIP (e.g., neurogliaform cells) (Rudy et al., 2011).
Layer-specific percentage breakdowns in interneuron types are obtained from the immunohistochemistry studies (Lee et al., 2010). We combine this information with an estimate of absolute neuron number to estimate the densities of interneuron types in different layers of cortex (Figures 1C–F). Neurons expressing 5HTR3A peak in layer 1. Neurons expressing calretinin (CR) exhibit different profiles depending on the source. The consensus from multiple sources is that PV neuron density peaks in layer 4 and 5a, while SST-expressing interneurons peak in the deep layers. While cholinergic interneurons do exist in the cortex, their density is much lower than the ones in these main categories.
Cells expressing 5HTR3A, SST, PV, and calbindin (CB) map to several cell sub-types (Table 2), with every subtype having its own morphological and electrical properties. Each marker in itself is not sufficient to distinguish the sub-class of interneuron.
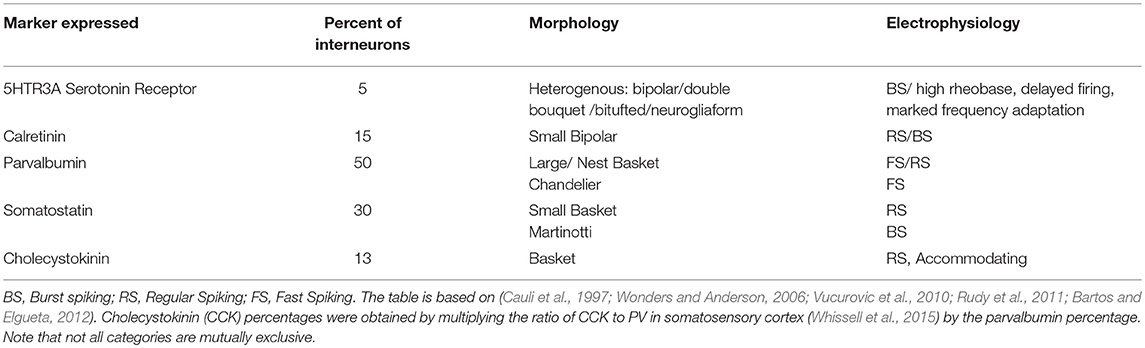
Table 2. Mapping of marker-expressing interneurons to standard cell types in cortex.
If more genes are used, more subtypes can be distinguished. Transcriptome-based studies have identified as many as 16 different types of interneurons in the cortex (Zeisel et al., 2015), which implies that further sub-division beyond common inhibitory markers is possible.
Hippocampus and Associated Areas
The hippocampus is part of the limbic system and plays a role in memory consolidation and spatial navigation. The majority of its input comes from the closely-associated entorhinal cortex. Neuron densities in the main part of hippocampus are lower than in cortex. Reported estimate of neuron density varied widely, as Table 3 illustrates. Densities for most cell types were available in the hippocampus proper, though in the subiculum and entorhinal cortex glia density information was sparse.
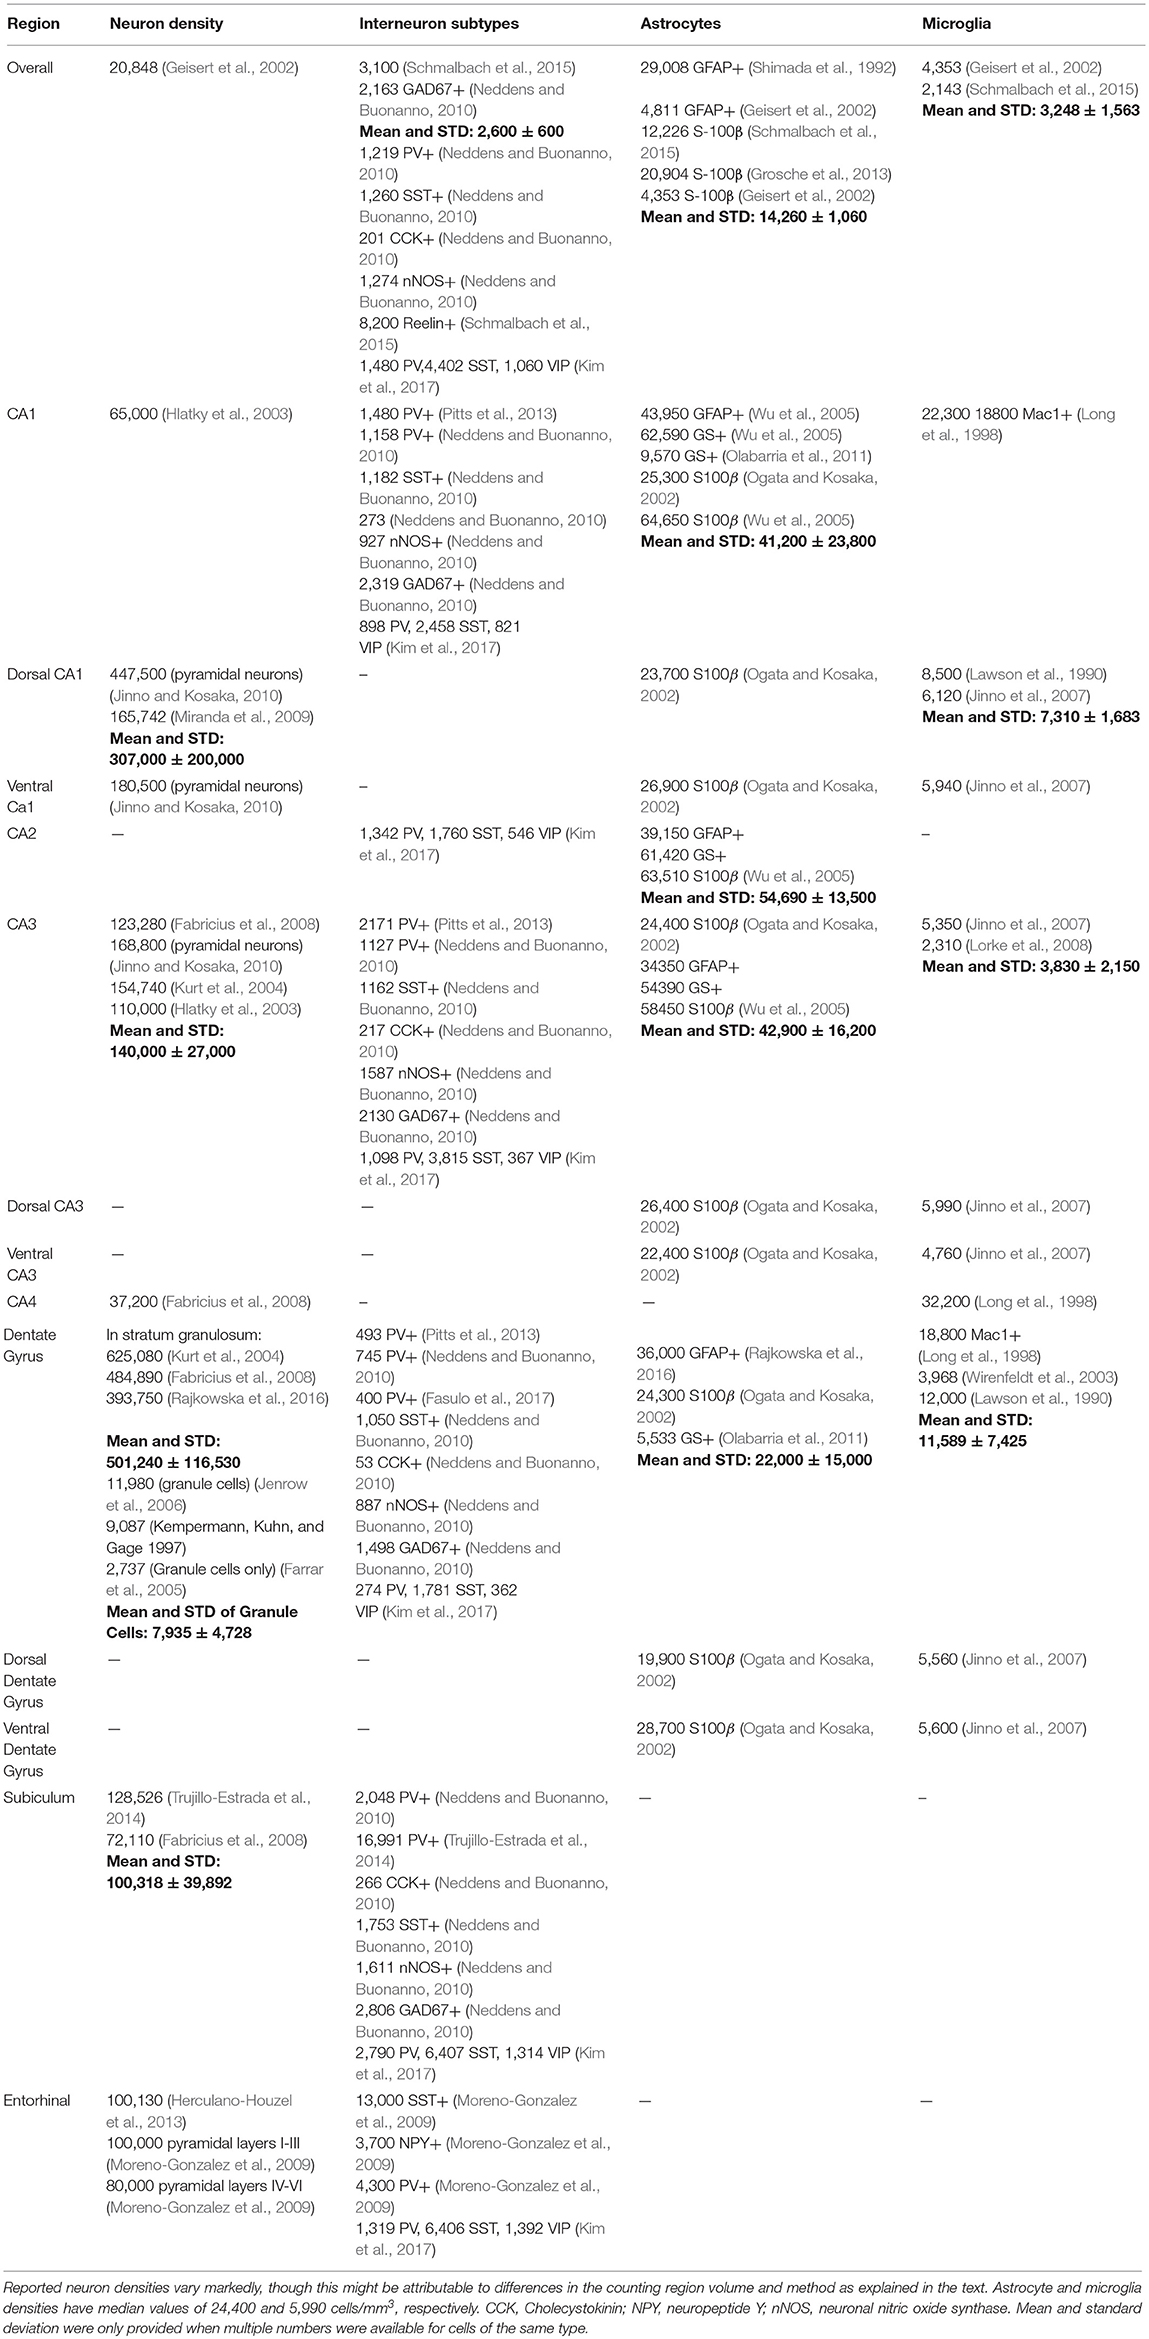
Table 3. Cell densities in hippocampus and associated regions.
The two major components of the hippocampus are the cornus ammonus (CA) and the dentate gyrus. The hippocampus shape has been compared to a ram's horn, from which the name cornus ammonus derives. The CA abbreviation is used to name the hippocampus subfields CA1-4. There are different strata within these structures, the stratum oriens, pyramidale, lucidum, radiatum, lacunosum, and moleculare. Cell bodies are not distributed uniformly, but rather the composition varies according to the strata. Few experimentalists make this distinction when determining cell densities, and cell densities therefore refer to the coarser regional designations.
Astrocyte estimates obtained using different markers were averaged together to obtain mean estimates of astrocytes in each region. This is likely to underestimate true density, since not all markers are expressed in all astrocytes. Still, the overall astrocyte to neuron ratio, 0.68, is higher than in cortex.
Oligodendrocytes in the hippocampus fall into at least four different types, each distributed differently according to strata (Vinet et al., 2010). Each has characteristic distributions and density. However, absolute numerical densities of oligodendrocytes in the hippocampus are hard to come by. Therefore, they are not included in Table 3.
Cerebellum
The cerebellum, present in the hindbrain, plays an important role in motor control. It has a high density of neurons. Indeed, it represents half of the total neuron number in the brain. There are two main types of neurons in the cerebellum: granule cells and Purkinje Cells. While granule cells are small, Purkinje Cells are large and only found in a single thin layer. Due to the ambiguity inherent in measuring the volume of the Purkinje Cell layer we took the Purkinje Cell density to be number with respect to the area of the Purkinje Cell layer interface rather than to a volume. The units were accordingly neurons/ mm2. Aside from this issue, the cerebellum is relatively simple. There are fewer primary cell types in the cerebellum, and the circuit layout follows a stereotyped pattern.
Granule cell estimates vary markedly, possibly due to the difficulty in counting them. Their small size and high density mean that cells may become difficult to distinguish. Astrocyte and oligodendrocyte density information was generally sparse for the cerebellum. The ratio of astrocytes to neurons was lower in cerebellum than in cortex or hippocampus.
Subcortical Structures
Subcortical structures are quite heterogeneous. Included in this category are various nuclei, the striatum, the thalamus, and the hypothalamus (Table 5). Although some such as the olfactory bulb and nucleus, amygdala, and hypothalamus have neuronal densities higher than cortex, others such as the striatum, substantia nigra, and superior colliculus have the same or lower density.
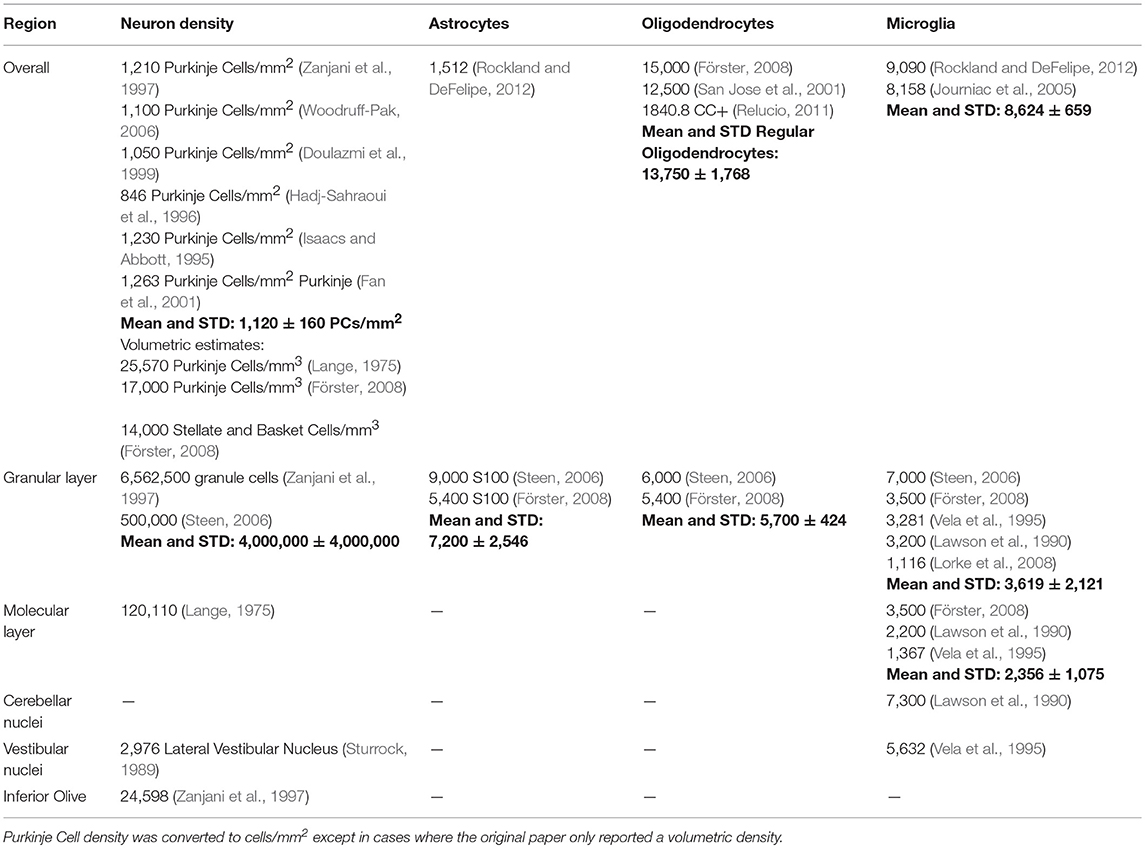
Table 4. Cell densities in cerebellum and associated structures.
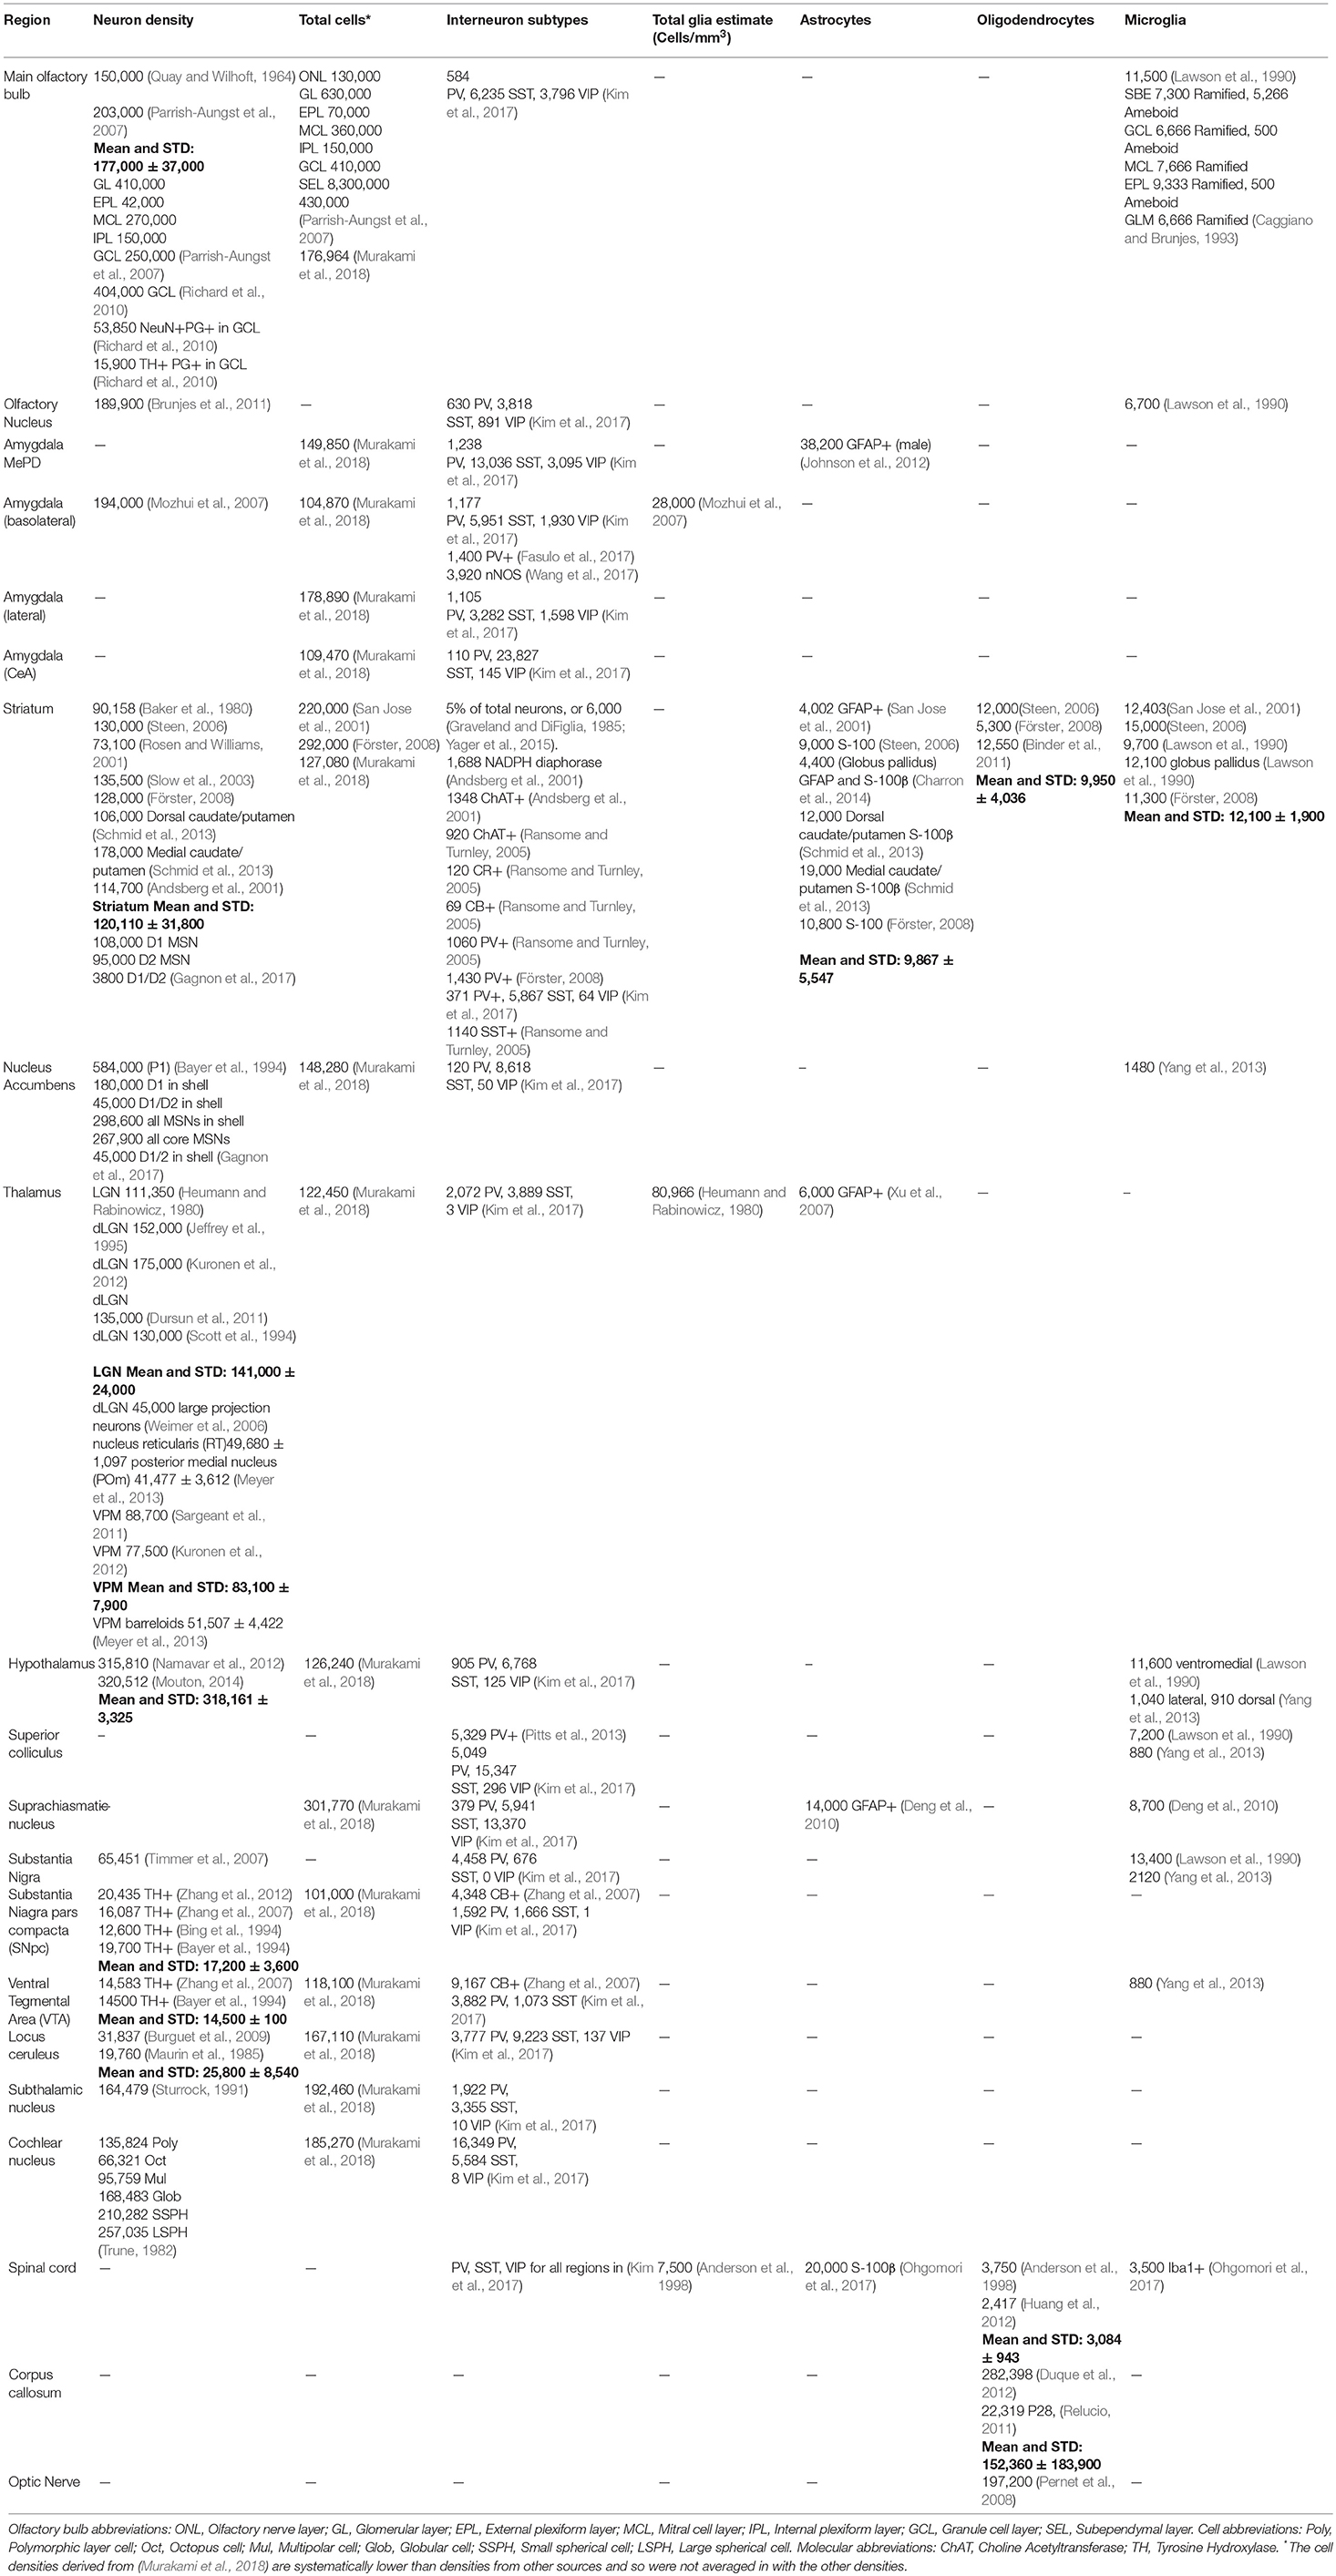
Table 5. Cell densities for subcortical structures.
The amygdala is composed of multiple nuclei, for which estimates of neuron, interneuron, and total glia density were generally available. We were not able to find estimates for astrocyte, oligodendrocytes, and microglia for most amygdalar nuclei. However, the densities of neurons and glia for these structures have been measured in the rat (Chareyron et al., 2011). In the basolateral amygdala, the density of PV+ neurons from Fasulo agrees well with those reported by Kim, who reports PV+, SST, and VIP interneurons for all regions of the brain (Kim et al., 2017).
Striatal neurons are composed of 95% Medium Spiny Neurons, with the remaining 5% being interneurons (Graveland and DiFiglia, 1985; Yager et al., 2015). We therefore estimated interneuron density by taking 5% of the total average density of striatal neurons from Table 5, which works out to be 6,000 cells/mm3. This estimate of interneuron density is consistent with the sum of the interneuron subtypes found by other means (Kim et al., 2017). In the striatum the density of PV+ neurons from Forster is greater than the density reported by Kim.
The inferior colliculus can be divided into several areas, each with a particular interneuron composition (Beebe et al., 2016). However, this structure is not included in the following table since we could not identify neuron density information for each region.
Overall, subcortical structure densities are the most poorly characterized regions of the entire mouse brain. Not all subcortical structures have been sufficiently well-studied to justify their inclusion in the table. For example, we were not able to obtain good data for the septum, habenular nuclei, and pineal gland, among other structures.
Sparsity of Data
Principal cell coverage differed by region. In the hippocampus, 68% of the four cell categories searched for could be found in the sub-regions considered. In the cerebellum, 58% were found. In the cortex, 69% of seven cell categories were found, and in subcortical structures, 49% of seven cell categories were obtained. Furthermore, the amount of information per cell category differed by region (Table 6).
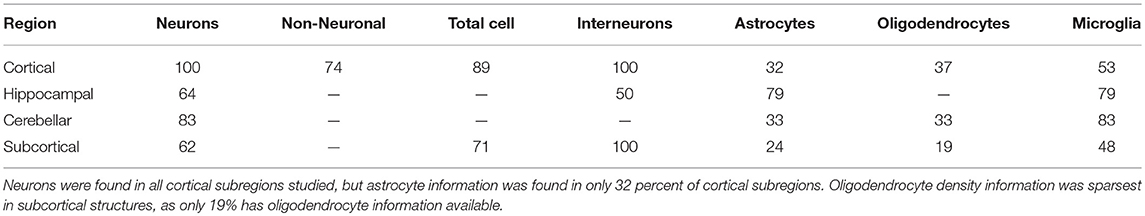
Table 6. Percent of subregions in each region for which cell category information was found.
When the most common cell types are plotted against the size of the region investigated (Figure 2), it is apparent that coarsely-defined regions have more data. As the target region becomes smaller, less data is available. In particular, oligodendrocyte densities are not well-characterized for finer structures. Oligodendrocyte density is, of course, highest in the white matter—as high as 85,000 cells/mm3 (Scafidi et al., 2014). Ultimately, the most coherent and complete data sets are obtained from scanning an entire brain (Murakami et al., 2018), since then considerations of region size are less important.
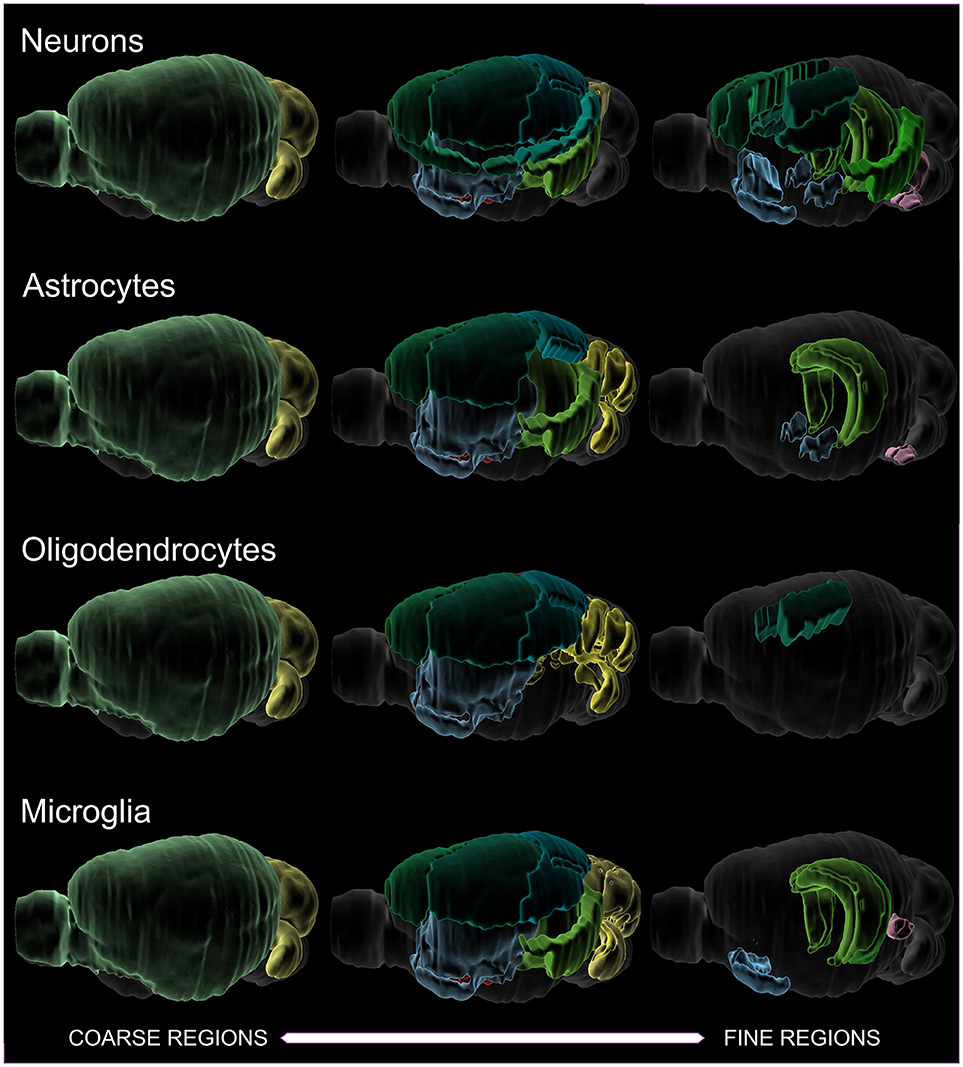
Figure 2. Visualization of literature densities as a function of region size, for neurons, astrocytes, oligodendrocytes, and microglia. An example of a coarse region would be cortex, while a finer region would be somatosensory barrel cortex. Oligodendrocytes have the sparsest data when finer regions are investigated. Note that total cells and various interneuron subtypes have been assayed in their entirety across the whole brain, and so are not included in this depiction. The colors serve to distinguish the boundaries of the identified regions.
Discussion
This review draws from the results of over100 published, experimental studies to assemble an overview of what is known about brain cell density. We found that estimates derived from different studies varied greatly, and that the current state of knowledge is still fragmented.
Experimental methods have potential sources of error. Stereology is the most rigorous approach but is also subject to observer bias in which subjective differences in cell counting arise (West, 1999). When labeled cells are used, some cell types may be undercounted when a marker expressed in only a subset of the cell population is used as a proxy for quantifying the entire population. Indeed, when multiple reports are available, a wide range of estimates is sometimes observed. While assembling the data, we found that extra transformations were sometimes needed to convert to density units, a process with the potential to introduce additional error. For example, we found that extrapolations to volumetric density from a 2D count generally were lower than densities obtained using other methods. In such extrapolations, the degree of tissue shrinkage incurred during fixation is usually not known as well, which introduces an additional source of error. Estimates of sample volume can pose a significant challenge to obtaining reliable density numbers (Oorschot, 1994).
Standard deviations of more than 50% of the mean were common when comparing the densities for the same cell type and region derived from multiple sources. In cortex, the standard deviation between neuronal density in different regions, 31,000 cells/mm3, is less than the average internal standard deviation within a region, 43,800 neurons/mm3. Therefore, the variability in different estimates of the same region is more than the variability arising from inherent differences between regions. Experimental estimates were improved in subcortical structures, as the standard deviation of individual region estimates was 19,000 neurons/mm3 compared to an inter-region standard deviation of 150,000 neurons/mm3. Subcortical structures are diverse, so much inter-regional variability is to be expected. In the hippocampus, the intra-region estimates for the same region had an average standard deviation of 96,000 neurons/mm3, while the inter-region standard deviation was 150,000 neurons/mm3. So regional estimates are still relatively useful. In the cerebellum a large variability in estimates was observed in estimates of granule cell numbers, and improved measurements would be useful in this region.
Densities for neurons and common cell types were available for the more-studied regions of the brain. However, astrocyte and oligodendrocyte density in particular were not well-characterized outside of the main brain regions. The sparseness of the data from the literature illustrates that alternative approaches are needed to fill in the gaps. One possible strategy is to use data for cell densities from related regions to fill in the gaps, or for regions at lower levels in a structural hierarchy to inherit their properties from parent regions.
Glia amounts differed by region. The ratio of astrocytes to neurons varied across the brain. It was higher in the hippocampus than in the cortex, which in turn was higher than in the cerebellum. The difference in this ratio could reflect variations in the volumetric sizes of neurons, as well as different metabolic needs. Microglia estimates typically fell in the range of 3,000–9,000 cells/mm3, even in regions such as the cerebellum where neuron density is high. However, some regions such as the striatum had more microglia (12,000 cells/mm3). Microglia are quite diverse (Grabert et al., 2016), which may be linked to the observed differences in density.
Inhibitory interneuron proportion is comparable between cortex and hippocampus. In the somatosensory cortex, the interneuron proportion is 12.3%. while in motor cortex it is 13.5% Overall in the hippocampus, the interneuron proportion is 12.5%. Although measurements for PV, SST, and VIP expressing interneurons were available for most regions, direct measurements of inhibitory interneurons were only available for limited regions. The fact that interneuron proportion does not vary markedly may help place the circuit in the proper operating regime, as inhibitory interneurons serve to counterbalance excitatory neuron activity.
Even within a region, cell densities can vary across the structure. The mapping of region names to structures used in this review does not have sufficient granularity to resolve this issue. For example, even within a named cortical layer, cell densities can vary. The most accurate density map of the brain would, therefore, not necessarily associate densities with the names of structures, but would rather measure densities at all points in a three-dimensional reference atlas. This would mitigate inhomogeneity and substructure effects and reduce subjectivity in defining brain regions.
Advances in microscopy and data processing have the potential to collect cell density information for the entire brain. Recently a quantitative brain-wide (qBrain) cell counting approach based on automated imaging by serial two-photon tomography and data analysis was developed (Kim et al., 2017). This method and a similar one (Silvestri et al., 2018) were able to produce maps of parvalbumin, somatostatin, and vasoactive intestinal peptide across the whole brain. Such an approach has the possibility to fill in many of the gaps in our current knowledge of cell densities. An expansion microscopy method has been used to identify the cell bodies of cells in the brain and construct a 3D atlas, the CUBIC-Atlas (Murakami et al., 2018). A microscopic technique that directly counts cells labeled with multiple markers has potential allow cell-type specific registration in space (Frasconi et al., 2014). In all such efforts, alignment to a standard reference atlas is critical.
Single cell transcriptomics can be used to identify genetically-defined cells in space (Codeluppi et al., 2018). As more transcriptome data becomes available, it should be possible to estimate cell densities for additional sub-types, subject to the constraint that all subtypes of a particular type of neuron should add up to the already measured density of that type. For example, the sum of all inhibitory neuron subtypes should match the total inhibitory neuron count and match densities.
In order to facilitate data sharing, it would be useful for experimentalists and theorists to come together to decide upon data presentation formats, and for journals to enforce a standardized way of presenting all stereological data. Specifying error as being either the standard error of the mean or the standard deviation, as well as sample size, would facilitate meta-analysis. Additionally, stating whether cell counts from a structure represent a single hemisphere or the entire brain would also help avoid ambiguous interpretation. In some papers, data was not reported numerically but rather in graphs and so had to be digitized to obtain a usable number. We would encourage researchers producing experimental data to take volume changes into account and provide shrinkage factors. Providing data in densities rather than custom or relative units would ensure the data is reusable. However, we recognize that experiments are designed with a question in mind and that numerical density is sometimes not an easily interpretable indicator of disease states as differences can be attributed to changes in either number or volume (West, 1999). In the end, development of a custom neuro-informatics system for researchers to deposit and share their properly-curated density numbers could enable data to be reused by the broader community.
A comprehensive knowledge of brain cell density will enable additional constraints on and validations of other aspects of brain circuit structure and function. For example, soma volumetric density is closely linked to neuronal density, and predicted soma volume fractions should align with experimentally-measured fractions. Similarly, synapse density is also closely related to type-specific neuron density, and predicted synapse densities based upon neuronal densities should be consistent with experiment measurements.
In this work, we have summarized most known estimates of brain cell density. This information will assist researchers in assessing the quality of their cell density estimates and identifying expected ranges of values. Overall, we find that for cortex, hippocampus, striatum, and cerebellum, cell densities can be reasonably constrained for principal cell types, but that for most other structures in the brain information is quite sparse. Given the limitations and inconsistencies of the literature, it is not possible to build a model of all the cell types in the brain by relying on measurements from any one source. The ultimate solution will be an integrated 3D atlas with high spatial resolution that can integrate all the data.
Author Contributions
DK collected the material. CE validated the estimates. DK and HM wrote the text.
Funding
This project has received funding from the European Union's Horizon 2020 Framework Programme for Research and Innovation under Grant Agreement No. 604102 (Human Brain Project Ramp-Up Phase) and Grant Agreement No. 720270 (Human Brain Project SGA1). This work was supported by the EPFL Blue Brain Project Fund and the ETH Board Funding to the Blue Brain Project.
Conflict of Interest Statement
The authors declare that the research was conducted in the absence of any commercial or financial relationships that could be construed as a potential conflict of interest.
The reviewer L-AD and handling Editor declared their shared affiliation.
Acknowledgments
We thank Karin Holm and Jay Coggan for editorial assistance and Christian O'Reilly for scientific feedback.
Supplementary Material
The Supplementary Material for this article can be found online at: https://www.frontiersin.org/articles/10.3389/fnana.2018.00083/full#supplementary-material
References
Anderson, T. J., Schneider, A., Barrie, J. A., Klugmann, M., McCulloch, M. C., Kirkham, D., et al. (1998). Late-onset neurodegeneration in mice with increased dosage of the proteolipid protein gene. J. Comp. Neurol. 394, 506–519.
Andsberg, G., Kokaia, Z., and Lindvall, O. (2001). Upregulation of p75 neurotrophin receptor after stroke in mice does not contribute to differential vulnerability of striatal neurons. Exp. Neurol. 169, 351–363. doi: 10.1006/exnr.2001.7646
Angenstein, F., Hilfert, L., Zuschratter, W., Altrock, W. D., Niessen, H. G., and Gundelfinger, E. D. (2008). Morphological and metabolic changes in the cortex of mice lacking the functional presynaptic active zone protein bassoon: a combined 1H-NMR spectroscopy and histochemical study. Cereb. Cortex 18, 890–897. doi: 10.1093/cercor/bhm122
Argandoña, E. G., Bengoetxea, H., and Lafuente, J. V. (2009). Physical exercise is required for environmental enrichment to offset the quantitative effects of dark-rearing on the S-100beta astrocytic density in the rat visual cortex. J. Anat. 215, 132–140. doi: 10.1111/j.1469-7580.2009.01103.x
Baker, H., Joh, T. H., and Reis, D. J. (1980). Genetic control of number of midbrain dopaminergic neurons in inbred strains of mice: relationship to size and neuronal density of the striatum. Proc. Natl. Acad. Sci. U. S. A. 77, 4369–4373. doi: 10.1073/pnas.77.7.4369
Bargmann, C., Newsome, W., Anderson, D., Deisseroth, K., Donoghue, J., MacLeish, P., et al. (2014). Report to the Advisory Committee to the Director. NIH. Available online at: https://www.braininitiative.nih.gov/pdf/BRAIN2025_508C.pdf
Barrera, K., Chu, P., Abramowitz, J., Steger, R., Ramos, R. L., and Brumberg, J. C. (2013). Organization of myelin in the mouse somatosensory barrel cortex and the effects of sensory deprivation. Dev. Neurobiol. 73, 297–314. doi: 10.1002/dneu.22060
Bartos, M., and Elgueta, C. (2012). Functional characteristics of parvalbumin- and cholecystokinin-expressing basket cells. J. Physiol. 590, 669–681. doi: 10.1113/jphysiol.2011.226175
Basta, D., Tzschentke, B., and Ernst, A. (2005). Noise-induced cell death in the mouse medial geniculate body and primary auditory cortex. Neurosci. Lett. 381, 199–204. doi: 10.1016/j.neulet.2005.02.034
Bayer, S. A., Triarhou, L. C., Thomas, J. D., and Ghetti, B. (1994). Correlated quantitative studies of the neostriatum, nucleus accumbens, substantia nigra, and ventral tegmental area in normal and weaver mutant mice. J. Neurosci. 14, 6901–6910. doi: 10.1523/JNEUROSCI.14-11-06901.1994
Beebe, N. L., Young, J. W., Mellott, J. G., and Schofield, B. R. (2016). Extracellular molecular markers and soma size of inhibitory neurons: evidence for four subtypes of GABAergic cells in the inferior colliculus. J. Neurosci. 36, 3988–3999. doi: 10.1523/JNEUROSCI.0217-16.2016
Binder, M. D., Xiao, J., Kemper, D., Ma, G. Z., Murray, S. S., and Kilpatrick, T. J. (2011). Gas6 increases myelination by oligodendrocytes and its deficiency delays recovery following cuprizone-induced demyelination. PLoS ONE 6:e17727. doi: 10.1371/journal.pone.0017727
Bing, G., Zhang, Y., Watanabe, Y., McEwen, B. S., and Stone, E. A. (1994). Locus coeruleus lesions potentiate neurotoxic effects of MPTP in dopaminergic neurons of the substantia nigra. Brain Res. 668, 261–265. doi: 10.1016/0006-8993(94)90534-7
Binzegger, T., Douglas, R. J., and Martin, K. A. (2004). A quantitative map of the circuit of cat primary visual cortex. J. Neurosci. 24, 8441–8453. doi: 10.1523/JNEUROSCI.1400-04.2004
Brizzee, K. R., Vogt, J., and Kharetchko, X. (1964). “Postnatal changes in glia/neuron index with a comparison of methods of cell enumeration in the white rat,” in Progress in Brain Research Growth and Maturation of the Brain, eds D. P. Purpura and J. P. Schadé (Elsevier), 136–149. doi: 10.1016/s0079-6123(08)61274-1
Brunjes, P. C., Kay, R. B., and Arrivillaga, J. P. (2011). The mouse olfactory peduncle. J. Comp. Neurol. 519, 2870–2886. doi: 10.1002/cne.22662
Burguet, J., Andrey, P., Rampin, O., and Maurin, Y. (2009). Three-dimensional statistical modeling of neuronal populations: illustration with spatial localization of supernumerary neurons in the locus coeruleus of quaking mutant mice. J. Comp. Neurol. 513, 483–495. doi: 10.1002/cne.21954
Bushong, E. A., Martone, M. E., Jones, Y. Z., and Ellisman, M. H. (2002). Protoplasmic astrocytes in CA1 stratum radiatum occupy separate anatomical domains. J. Neurosci. 22, 183–192. doi: 10.1523/JNEUROSCI.22-01-00183.2002
Caddy, K. W., and Biscoe, T. J. (1979). Structural and quantitative studies on the normal C3H and Lurcher mutant mouse. Philos. Trans. R. Soc. Lond. B. Biol. Sci. 287, 167–201. doi: 10.1098/rstb.1979.0055
Caggiano, A. O., and Brunjes, P. C. (1993). Microglia and the developing olfactory bulb. Neuroscience 52, 717–724. doi: 10.1016/0306-4522(93)90420-K
Cauli, B., Audinat, E., Lambolez, B., Angulo, M. C., Ropert, N., Tsuzuki, K., et al. (1997). Molecular and physiological diversity of cortical nonpyramidal cells. J. Neurosci. 17, 3894–3906. doi: 10.1523/JNEUROSCI.17-10-03894.1997
Chareyron, L. J., Lavenex, P. B., Amaral, D. G., and Lavenex, P. (2011). Stereological analysis of the rat and monkey amygdala. J. Comp. Neurol. 519, 3218–3239. doi: 10.1002/cne.22677
Charron, G., Doudnikoff, E., Canron, M. H., Li, Q., Véga, C., Marais, S., et al. (2014). Astrocytosis in parkinsonism: considering tripartite striatal synapses in physiopathology? Front. Aging Neurosci. 6:258. doi: 10.3389/fnagi.2014.00258
Chen, J.-R., Wang, B.-N., Tseng, G.-F., Wang, Y.-J., Huang, Y.-S., and Wang, T.-J. (2014). Morphological changes of cortical pyramidal neurons in hepatic encephalopathy. BMC Neurosci. 15, 15. doi: 10.1186/1471-2202-15-15
Chklovskii, D. B., Schikorski, T., and Stevens, C. F. (2002). Wiring optimization in cortical circuits. Neuron 34, 341–347. doi: 10.1016/S0896-6273(02)00679-7
Chvátal, A., Anderová, M., Hock, M., Prajerová, I., Neprasová, H., Chvátal, V., et al. (2007). Three-dimensional confocal morphometry reveals structural changes in astrocyte morphology in situ. J. Neurosci. Res. 85, 260–271. doi: 10.1002/jnr.21113
Codeluppi, S., Borm, L. E., Zeisel, A., Manno, G. L., van Lunteren, J. A., Svensson, C. I., et al. (2018). Spatial organization of the somatosensory cortex revealed by cyclic smFISH. bioRxiv [preprint] bioRxiv:276097. doi: 10.1101/276097
Cragg, B. G. (1967). The density of synapses and neurones in the motor and visual areas of the cerebral cortex. J. Anat. 101, 639–654.
Cunningham, J. J., Sherrard, R. M., Bedi, K. S., Renshaw, G. M., and Bower, A. J. (1999). Changes in the numbers of neurons and astrocytes during the postnatal development of the rat inferior olive. J. Comp. Neurol. 406, 375–383.
Deng, X.-H., Bertini, G., Palomba, M., Xu, Y.-Z., Bonaconsa, M., Nygård, M., et al. (2010). Glial transcripts and immune-challenged glia in the suprachiasmatic nucleus of young and aged mice. Chronobiol. Int. 27, 742–767. doi: 10.3109/07420521003681498
DiResta, G. R., Lee, J., Lau, N., Ali, F., Galicich, J. H., and Arbit, E. (1990). Measurement of brain tissue density using pycnometry. Acta Neurochir. Suppl. (Wien) 51, 34–36.
Doucette, J. R., Jiao, R., and Nazarali, A. J. (2010). Age-related and cuprizone-induced changes in myelin and transcription factor gene expression and in oligodendrocyte cell densities in the rostral corpus callosum of mice. Cell. Mol. Neurobiol. 30, 607–629. doi: 10.1007/s10571-009-9486-z
Doulazmi, M., Frédéric, F., Lemaigre-Dubreuil, Y., Hadj-Sahraoui, N., Delhaye-Bouchaud, N., and Mariani, J. (1999). Cerebellar Purkinje cell loss during life span of the heterozygous staggerer mouse (Rora(+)/Rora(sg)) is gender-related. J. Comp. Neurol. 411, 267–273.
Duque, A., Coman, D., Carlyle, B. C., Bordner, K. A., George, E. D., Papademetris, X., et al. (2012). Neuroanatomical changes in a mouse model of early life neglect. Brain Struct. Funct. 217, 459–472. doi: 10.1007/s00429-011-0350-9
Dursun, I., Jakubowska-Dogru, E., List, D., van der Liets, L. C., Coombs, J. L., and Berman, R. F. (2011). Effects of early postnatal exposure to ethanol on retinal ganglion cell morphology and numbers of neurons in the dorsolateral geniculate in mice. Alcohol. Clin. Exp. Res. 35, 2063–2074. doi: 10.1111/j.1530-0277.2011.01557.x
Fabricius, K., Wörtwein, G., and Pakkenberg, B. (2008). The impact of maternal separation on adult mouse behaviour and on the total neuron number in the mouse hippocampus. Brain Struct. Funct. 212, 403–416. doi: 10.1007/s00429-007-0169-6
Fan, H., Favero, M., and Vogel, M. W. (2001). Elimination of Bax expression in mice increases cerebellar purkinje cell numbers but not the number of granule cells. J. Comp. Neurol. 436, 82–91. doi: 10.1002/cne.1055
Farkas, E., and Luiten, P. G. (2001). Cerebral microvascular pathology in aging and Alzheimer's disease. Prog. Neurobiol. 64, 575–611. doi: 10.1016/S0301-0082(00)00068-X
Farrar, C. E., Huang, C. S., Clarke, S. G., and Houser, C. R. (2005). Increased cell proliferation and granule cell number in the dentate gyrus of protein repair-deficient mice. J. Comp. Neurol. 493, 524–537. doi: 10.1002/cne.20780
Fasulo, L., Brandi, R., Arisi, I., La Regina, F., Berretta, N., Capsoni, S., et al. (2017). ProNGF drives localized and cell selective parvalbumin interneuron and perineuronal net depletion in the dentate gyrus of transgenic mice. Front. Mol. Neurosci. 10:20. doi: 10.3389/fnmol.2017.00020
Fenlon, L. R., Liu, S., Gobius, I., Kurniawan, N. D., Murphy, S., Moldrich, R. X., et al. (2015). Formation of functional areas in the cerebral cortex is disrupted in a mouse model of autism spectrum disorder. Neural Develop. 10:10. doi: 10.1186/s13064-015-0033-y
Förster, J. (2008). Quantitative Morphological Analysis of the Neostriatum and the Cerebellum of Tenascin-C Deficient mice, doctoral dissertation, Hamburg.
Frasconi, P., Silvestri, L., Soda, P., Cortini, R., Pavone, F. S., and Iannello, G. (2014). Large-scale automated identification of mouse brain cells in confocal light sheet microscopy images. Bioinforma. Oxf. Engl. 30, i587–i593. doi: 10.1093/bioinformatics/btu469
Gabbott, P. L., and Stewart, M. G. (1987). Distribution of neurons and glia in the visual cortex (area 17) of the adult albino rat: a quantitative description. Neuroscience 21, 833–845. doi: 10.1016/0306-4522(87)90040-6
Gagnon, D., Petryszyn, S., Sanchez, M. G., Bories, C., Beaulieu, J. M., De Koninck, Y., et al. (2017). Striatal neurons expressing D1and D2Receptors are morphologically distinct and differently affected by dopamine denervation in mice. Sci. Rep. 7:41432. doi: 10.1038/srep41432
Garcia, A. D. R., Petrova, R., Eng, L., and Joyner, A. L. (2010). Sonic hedgehog regulates discrete populations of astrocytes in the adult mouse forebrain. J. Neurosci. 30, 13597–13608. doi: 10.1523/JNEUROSCI.0830-10.2010
Geisert, E. E., Williams, R. W., Geisert, G. R., Fan, L., Asbury, A. M., Maecker, H. T., et al. (2002). Increased brain size and glial cell number in CD81-null mice. J. Comp. Neurol. 453, 22–32. doi: 10.1002/cne.10364
Gentet, L. J., Stuart, G. J., and Clements, J. D. (2000). Direct measurement of specific membrane capacitance in neurons. Biophys. J. 79, 314–320. doi: 10.1016/S0006-3495(00)76293-X
Gonchar, Y., Wang, Q., and Burkhalter, A. (2007). Multiple distinct subtypes of GABAergic neurons in mouse visual cortex identified by triple immunostaining. Front. Neuroanat. 1:3. doi: 10.3389/neuro.05.003.2007
Grabert, K., Michoel, T., Karavolos, M. H., Clohisey, S., Baillie, J. K., Stevens, M. P., et al. (2016). Microglial brain region-dependent diversity and selective regional sensitivities to ageing. Nat. Neurosci. 19, 504–516. doi: 10.1038/nn.4222
Grand'maison, M., Zehntner, S. P., Ho, M.-K., Hébert, F., Wood, A., Carbonell, F., et al. (2013). Early cortical thickness changes predict β-amyloid deposition in a mouse model of Alzheimer's disease. Neurobiol. Dis. 54, 59–67. doi: 10.1016/j.nbd.2013.02.005
Graveland, G. A., and DiFiglia, M. (1985). The frequency and distribution of medium-sized neurons with indented nuclei in the primate and rodent neostriatum. Brain Res. 327, 307–311. doi: 10.1016/0006-8993(85)91524-0
Grosche, A., Grosche, J., Tackenberg, M., Scheller, D., Gerstner, G., Gumprecht, A., et al. (2013). Versatile and simple approach to determine astrocyte territories in mouse neocortex and hippocampus. PLoS ONE 8:e69143. doi: 10.1371/journal.pone.0069143
Haas, T. L., and Duling, B. R. (1997). Morphology favors an endothelial cell pathway for longitudinal conduction within arterioles. Microvasc. Res. 53, 113–120. doi: 10.1006/mvre.1996.1999
Hadj-Sahraoui, N., Frédéric, F., Delhaye-Bouchaud, N., and Mariani, J. (1996). Gender effect on Purkinje cell loss in the cerebellum of the heterozygous reeler mouse. J. Neurogenet. 11, 45–58. doi: 10.3109/01677069609107062
Halassa, M. M., Fellin, T., Takano, H., Dong, J. H., and Haydon, P. G. (2007). Synaptic islands defined by the territory of a single astrocyte. J. Neurosci. 27, 6473–6477. doi: 10.1523/JNEUROSCI.1419-07.2007
Herculano-Houzel, S., Collins, C. E., Wong, P., and Kaas, J. H. (2007). Cellular scaling rules for primate brains. Proc. Natl. Acad. Sci. U.S.A. 104, 3562–3567. doi: 10.1073/pnas.0611396104
Herculano-Houzel, S., and Lent, R. (2005). Isotropic fractionator: a simple, rapid method for the quantification of total cell and neuron numbers in the brain. J. Neurosci. 25, 2518–2521. doi: 10.1523/JNEUROSCI.4526-04.2005
Herculano-Houzel, S., Mota, B., and Lent, R. (2006). Cellular scaling rules for rodent brains. Proc. Natl. Acad. Sci. U.S.A. 103, 12138–12143. doi: 10.1073/pnas.0604911103
Herculano-Houzel, S., Watson, C., and Paxinos, G. (2013). Distribution of neurons in functional areas of the mouse cerebral cortex reveals quantitatively different cortical zones. Front. Neuroanat. 7:35. doi: 10.3389/fnana.2013.00035
Heumann, D., Leuba, G., and Rabinowicz, T. (1977). Postnatal development of the mouse cerebral neocortex. II. Quantitative cytoarchitectonics of visual and auditory areas. J. Hirnforsch. 18, 483–500.
Heumann, D., and Rabinowicz, T. (1980). Postnatal development of the dorsal lateral geniculate nucleus in the normal and enucleated albino mouse. Exp. Brain Res. 38, 75–85. doi: 10.1007/BF00237933
Hill, R. A., and Grutzendler, J. (2014). In vivo imaging of oligodendrocytes with sulforhodamine 101. Nat. Methods 11, 1081–1082. doi: 10.1038/nmeth.3140
Hill, R. A., Patel, K. D., Goncalves, C. M., Grutzendler, J., and Nishiyama, A. (2014). Modulation of oligodendrocyte generation during a critical temporal window after NG2 cell division. Nat. Neurosci. 17, 1518–1527. doi: 10.1038/nn.3815
Hlatky, R., Lui, H., Cherian, L., Goodman, J. C., O'Brien, W. E., Contant, C. F., et al. (2003). The role of endothelial nitric oxide synthase in the cerebral hemodynamics after controlled cortical impact injury in mice. J. Neurotrauma 20, 995–1006. doi: 10.1089/089771503770195849
Huang, J. K., Ferrari, C. C., Monteiro de Castro, G., Lafont, D., Zhao, C., Zaratin, P., et al. (2012). Accelerated axonal loss following acute CNS demyelination in mice lacking protein tyrosine phosphatase receptor type Z. Am. J. Pathol. 181, 1518–1523. doi: 10.1016/j.ajpath.2012.07.011
Irintchev, A., Rollenhagen, A., Troncoso, E., Kiss, J. Z., and Schachner, M. (2005). Structural and functional aberrations in the cerebral cortex of tenascin-C deficient mice. Cereb. Cortex 15, 950–962. doi: 10.1093/cercor/bhh195
Isaacs, K. R., and Abbott, L. C. (1995). Cerebellar volume decreases in the tottering mouse are specific to the molecular layer. Brain Res. Bull. 36, 309–314. doi: 10.1016/0361-9230(94)00207-H
Jahanshahi, M., Golalipour, M. J., and Afshar, M. (2009). The effect of Urtica dioica extract on the number of astrocytes in the dentate gyrus of diabetic rats. Folia Morphol. 68, 93–97.
Jeffrey, M., Fraser, J. R., Halliday, W. G., Fowler, N., Goodsir, C. M., and Brown, D. A. (1995). Early unsuspected neuron and axon terminal loss in scrapie-infected mice revealed by morphometry and immunocytochemistry. Neuropathol. Appl. Neurobiol. 21, 41–49. doi: 10.1111/j.1365-2990.1995.tb01027.x
Jenrow, K. A., Ratkewicz, A. E., Zalinski, D. N., Roszka, K. M., Lemke, N. W., and Elisevich, K. V. (2006). Influence of ionizing radiation on the course of kindled epileptogenesis. Brain Res. 1094, 207–216. doi: 10.1016/j.brainres.2006.03.096
Jinno, S., Fleischer, F., Eckel, S., Schmidt, V., and Kosaka, T. (2007). Spatial arrangement of microglia in the mouse hippocampus: a stereological study in comparison with astrocytes. Glia 55, 1334–1347. doi: 10.1002/glia.20552
Jinno, S., and Kosaka, T. (2010). Stereological estimation of numerical densities of glutamatergic principal neurons in the mouse hippocampus. Hippocampus 20, 829–840. doi: 10.1002/hipo.20685
Johnson, R. T., Schneider, A., DonCarlos, L. L., Breedlove, S. M., and Jordan, C. L. (2012). Astrocytes in the rat medial amygdala are responsive to adult androgens. J. Comp. Neurol. 520, 2531–2544. doi: 10.1002/cne.23061
Journiac, N., Doulazmi, M., Pajak, F., Mariani, J., and Vernet-der Garabedian, B. (2005). Quantitative analysis of microglial cells in the degenerating cerebellum of the staggerer (RORA(sg/sg)) mutant mouse. J. Neurogenet. 19, 143–154. doi: 10.1080/01677060600569762
Kempermann, G., Kuhn, H. G., and Gage, F. H. (1997). Genetic influence on neurogenesis in the dentate gyrus of adult mice. Proc. Natl. Acad. Sci. U.S.A. 94, 10409–10414. doi: 10.1073/pnas.94.19.10409
Kim, Y., Yang, G. R., Pradhan, K., Venkataraju, K. U., Bota, M., García Del Molino, L. C., et al. (2017). Brain-wide maps reveal stereotyped cell-type-based cortical architecture and subcortical sexual dimorphism. Cell 171, 456–469.e22. doi: 10.1016/j.cell.2017.09.020
Kitamura, T., Nakanishi, K., Watanabe, S., Endo, Y., and Fujita, S. (1987). GFA-protein gene expression on the astroglia in cow and rat brains. Brain Res. 423, 189–195. doi: 10.1016/0006-8993(87)90839-0
Korogod, N., Petersen, C. C., and Knott, G. W. (2015). Ultrastructural analysis of adult mouse neocortex comparing aldehyde perfusion with cryo fixation. eLife 4:e05793. doi: 10.7554/eLife.05793
Kuronen, M., Lehesjoki, A.-E., Jalanko, A., Cooper, J. D., and Kopra, O. (2012). Selective spatiotemporal patterns of glial activation and neuron loss in the sensory thalamocortical pathways of neuronal ceroid lipofuscinosis 8 mice. Neurobiol. Dis. 47, 444–457. doi: 10.1016/j.nbd.2012.04.018
Kurt, M. A., Kafa, M. I., Dierssen, M., and Davies, D. C. (2004). Deficits of neuronal density in CA1 and synaptic density in the dentate gyrus, CA3 and CA1, in a mouse model of Down syndrome. Brain Res. 1022, 101–109. doi: 10.1016/j.brainres.2004.06.075
Lange, W. (1975). Cell number and cell density in the cerebellar cortex of man and some other mammals. Cell Tissue Res. 157, 115–124. doi: 10.1007/BF00223234
Lawson, L. J., Perry, V. H., Dri, P., and Gordon, S. (1990). Heterogeneity in the distribution and morphology of microglia in the normal adult mouse brain. Neuroscience 39, 151–170. doi: 10.1016/0306-4522(90)90229-W
Lee, S., Hjerling-Leffler, J., Zagha, E., Fishell, G., and Rudy, B. (2010). The largest group of superficial neocortical GABAergic interneurons expresses ionotropic serotonin receptors. J. Neurosci. 30, 16796–16808. doi: 10.1523/JNEUROSCI.1869-10.2010
Lefort, S., Tomm, C., Floyd Sarria, J. C., and Petersen, C. C. (2009). The excitatory neuronal network of the C2 barrel column in mouse primary somatosensory cortex. Neuron 61, 301–316. doi: 10.1016/j.neuron.2008.12.020
Lein, E. S., Hawrylycz, M. J., Ao, N., Ayres, M., Bensinger, A., Bernard, A., et al. (2007). Genome-wide atlas of gene expression in the adult mouse brain. Nature 445, 168–176. doi: 10.1038/nature05453
Ling, E. A., and Leblond, C. P. (1973). Investigation of glial cells in semithin sections. II. Variation with age in the numbers of the various glial cell types in rat cortex and corpus callosum. J. Comp. Neurol. 149, 73–81. doi: 10.1002/cne.901490105
Long, J. M., Kalehua, A. N., Muth, N. J., Calhoun, M. E., Jucker, M., Hengemihle, J. M., et al. (1998). Stereological analysis of astrocyte and microglia in aging mouse hippocampus. Neurobiol. Aging 19, 497–503. doi: 10.1016/S0197-4580(98)00088-8
Lorke, D. E., Ip, C. W., and Schumacher, U. (2008). Increased number of microglia in the brain of severe combined immunodeficient (SCID) mice. Histochem. Cell Biol. 130, 693–697. doi: 10.1007/s00418-008-0463-2
Markram, H., Muller, E., Ramaswamy, S., Reimann, M. W., Abdellah, M., Sanchez, C. A., et al. (2015). Reconstruction and simulation of neocortical microcircuitry. Cell 163, 456–492. doi: 10.1016/j.cell.2015.09.029
Markram, H., Toledo-Rodriguez, M., Wang, Y., Gupta, A., Silberberg, G., and Wu, C. (2004). Interneurons of the neocortical inhibitory system. Nat. Rev. Neurosci. 5, 793–807. doi: 10.1038/nrn1519
Mathiisen, T. M., Lehre, K. P., Danbolt, N. C., and Ottersen, O. P. (2010). The perivascular astroglial sheath provides a complete covering of the brain microvessels: an electron microscopic 3D reconstruction. Glia 58, 1094–1103. doi: 10.1002/glia.20990
Maurin, Y., Berger, B., Le Saux, F., Gay, M., and Baumann, N. (1985). Increased number of locus ceruleus noradrenergic neurons in the convulsive mutant quaking mouse. Neurosci. Lett. 57, 313–318. doi: 10.1016/0304-3940(85)90511-7
Meitzen, J., Pflepsen, K. R., Stern, C. M., Meisel, R. L., and Mermelstein, P. G. (2011). Measurements of neuron soma size and density in rat dorsal striatum, nucleus accumbens core and nucleus accumbens shell: differences between striatal region and brain hemisphere, but not sex. Neurosci. Lett. 487, 177–181. doi: 10.1016/j.neulet.2010.10.017
Meyer, H. S., Egger, R., Guest, J. M., Foerster, R., Reissl, S., and Oberlaender, M. (2013). Cellular organization of cortical barrel columns is whisker-specific. Proc. Natl. Acad. Sci. U.S.A. 110, 19113–19118. doi: 10.1073/pnas.1312691110
Meyer, H. S., Schwarz, D., Wimmer, V. C., Schmitt, A. C., Kerr, J. N., Sakmann, B., et al. (2011). Inhibitory interneurons in a cortical column form hot zones of inhibition in layers 2 and 5A. Proc. Natl. Acad. Sci. U.S.A. 108, 16807–16812. doi: 10.1073/pnas.1113648108
Meyer, H. S., Wimmer, V. C., Oberlaender, M., Kock, C. P. J., de, Sakmann, B., and Helmstaedter, M. (2010). Number and laminar distribution of neurons in a thalamocortical projection column of rat vibrissal cortex. Cereb. Cortex 20, 2277–2286. doi: 10.1093/cercor/bhq067
Miranda, R., Sébrié, C., Degrouard, J., Gillet, B., Jaillard, D., Laroche, S., et al. (2009). Reorganization of inhibitory synapses and increased PSD length of perforated excitatory synapses in hippocampal area CA1 of dystrophin-deficient mdx mice. Cereb. Cortex 19, 876–888. doi: 10.1093/cercor/bhn135
Moreno-Gonzalez, I., Baglietto-Vargas, D., Sanchez-Varo, R., Jimenez, S., Trujillo-Estrada, L., Sanchez-Mejias, E., et al. (2009). Extracellular amyloid-beta and cytotoxic glial activation induce significant entorhinal neuron loss in young PS1(M146L)/APP(751SL) mice. J. Alzheimers Dis. 18, 755–776. doi: 10.3233/JAD-2009-1192
Morris, J. A., Jordan, C. L., and Breedlove, S. M. (2008). Sexual dimorphism in neuronal number of the posterodorsal medial amygdala is independent of circulating androgens and regional volume in adult rats. J. Comp. Neurol. 506, 851–859. doi: 10.1002/cne.21536
Mouton, P. R. (eds). (2014). Neurostereology: Unbiased Stereology of Neural Systems. Ames, IA: Wiley Blackwell.
Mozhui, K., Hamre, K. M., Holmes, A., Lu, L., and Williams, R. W. (2007). Genetic and structural analysis of the basolateral amygdala complex in BXD recombinant inbred mice. Behav. Genet. 37, 223–243. doi: 10.1007/s10519-006-9122-3
Murakami, T. C., Mano, T., Saikawa, S., Horiguchi, S. A., Shigeta, D., Baba, K., et al. (2018). A three-dimensional single-cell-resolution whole-brain atlas using CUBIC-X expansion microscopy and tissue clearing. Nat. Neurosci. 21, 625–637. doi: 10.1038/s41593-018-0109-1
Namavar, M. R., Raminfard, S., Jahromi, Z. V., and Azari, H. (2012). Effects of high-fat diet on the numerical density and number of neuronal cells and the volume of the mouse hypothalamus: a stereological study. Anat. Cell Biol. 45, 178–184. doi: 10.5115/acb.2012.45.3.178
Neddens, J., and Buonanno, A. (2010). Selective populations of hippocampal interneurons express ErbB4 and their number and distribution is altered in ErbB4 knockout mice. Hippocampus 20, 724–744. doi: 10.1002/hipo.20675
Nelson, E. L., Liang, C.-L., Sinton, C. M., and German, D. C. (1998). Midbrain dopaminergic neurons in the mouse: computer-assisted mapping. J. Comp. Neurol. 369, 361–371.
Nicaise, C., Mitrecic, D., Demetter, P., De Decker, R., Authelet, M., Boom, A., et al. (2009). Impaired blood-brain and blood-spinal cord barriers in mutant SOD1-linked ALS rat. Brain Res. 1301, 152–162. doi: 10.1016/j.brainres.2009.09.018
Niedowicz, D. M., Reeves, V. L., Platt, T. L., Kohler, K., Beckett, T. L., Powell, D. K., et al. (2014). Obesity and diabetes cause cognitive dysfunction in the absence of accelerated β-amyloid deposition in a novel murine model of mixed or vascular dementia. Acta Neuropathol. Commun. 2:64. doi: 10.1186/2051-5960-2-64
Nimmerjahn, A., Kirchhoff, F., and Helmchen, F. (2005). Resting microglial cells are highly dynamic surveillants of brain parenchyma in vivo. Science 308, 1314–1318. doi: 10.1126/science.1110647
Nurnberger, J. I., and Gordon, M. W. (1957). The cell density of neural tissues: direct counting method and possible applications as a biologic referent. Prog. Neurobiol. 2, 100–128; discussion 128–138.
Ogata, K., and Kosaka, T. (2002). Structural and quantitative analysis of astrocytes in the mouse hippocampus. Neuroscience 113, 221–233. doi: 10.1016/S0306-4522(02)00041-6
Ohgomori, T, Yamasaki, R., Takeuchi, H., Kadomatsu, K., Kira J, and Jinno, S. (2017). Differential activation of neuronal and glial STAT3 in the spinal cord of the SOD1G93A mouse model of amyotrophic lateral sclerosis. Eur. J. Neurosci. 46, 2001–2014. doi: 10.1111/ejn.13650
Olabarria, M., Noristani, H. N., Verkhratsky, A., and Rodríguez, J. J. (2011). Age-dependent decrease in glutamine synthetase expression in the hippocampal astroglia of the triple transgenic Alzheimer's disease mouse model: mechanism for deficient glutamatergic transmission? Mol. Neurodegener. 6:55. doi: 10.1186/1750-1326-6-5
Oorschot, D. E. (1994). Are you using neuronal densities, synaptic densities or neurochemical densities as your definitive data? There is a better way to go. Prog. Neurobiol. 44, 233–247. doi: 10.1016/0301-0082(94)90040-X
Oorschot, D. E. (1996). Total number of neurons in the neostriatal, pallidal, subthalamic, and substantia nigral nuclei of the rat basal ganglia: a stereological study using the cavalieri and optical disector methods. J. Comp. Neurol. 366, 580–599.
Pardridge, W. M. (1999). Blood-brain barrier biology and methodology. J. Neurovirol. 5, 556–569. doi: 10.3109/13550289909021285
Parrish-Aungst, S., Shipley, M. T., Erdelyi, F., Szabo, G., and Puche, A. C. (2007). Quantitative analysis of neuronal diversity in the mouse olfactory bulb. J. Comp. Neurol. 501, 825–836. doi: 10.1002/cne.21205
Pernet, V., Joly, S., Christ, F., Dimou, L., and Schwab, M. E. (2008). Nogo-A and myelin-associated glycoprotein differently regulate oligodendrocyte maturation and myelin formation. J. Neurosci. 28, 7435–7444. doi: 10.1523/JNEUROSCI.0727-08.2008
Pitts, M. W., Reeves, M. A., Hashimoto, A. C., Ogawa, A., Kremer, P., Seale, L. A., et al. (2013). Deletion of selenoprotein M leads to obesity without cognitive deficits. J. Biol. Chem. 288, 26121–26134. doi: 10.1074/jbc.M113.471235
Pott, F., Gingele, S., Clarner, T., Dang, J., Baumgartner, W., Beyer, C., et al. (2009). Cuprizone effect on myelination, astrogliosis and microglia attraction in the mouse basal ganglia. Brain Res. 1305, 137–149. doi: 10.1016/j.brainres.2009.09.084
Quay, W. B., and Wilhoft, D. C. (1964). Comparative and regional differences in serotonin content of reptilian brains. J. Neurochem. 11, 805–811. doi: 10.1111/j.1471-4159.1964.tb06729.x
Rajkowska, G., Clarke, G., Mahajan, G., Licht, C. M., van de Werd, H. J., Yuan, P., et al. (2016). Differential effect of lithium on cell number in the hippocampus and prefrontal cortex in adult mice: a stereological study. Bipolar Disord. 18, 41–51. doi: 10.1111/bdi.12364
Ransome, M. I., and Turnley, A. M. (2005). Analysis of neuronal subpopulations in mice over-expressing suppressor of cytokine signaling-2. Neuroscience 132, 673–687. doi: 10.1016/j.neuroscience.2004.12.041
Rauskolb, S., Zagrebelsky, M., Dreznjak, A., Deogracias, R., Matsumoto, T., Wiese, S., et al. (2010). Global deprivation of brain-derived neurotrophic factor in the CNS reveals an area-specific requirement for dendritic growth. J. Neurosci. 30, 1739–1749. doi: 10.1523/JNEUROSCI.5100-09.2010
Relucio, J. (2011). The Role of Laminin α2 in Oligodendrocyte Development and CNS Myelination. Available online at: http://hdl.handle.net/1951/56101
Ren, J. Q., Aika, Y., Heizmann, C. W., and Kosaka, T. (1992). Quantitative analysis of neurons and glial cells in the rat somatosensory cortex, with special reference to GABAergic neurons and parvalbumin-containing neurons. Exp. Brain Res. 92, 1–14. doi: 10.1007/BF00230378
Reyes-Haro, D., Mora-Loyola, E., Soria-Ortiz, B., and García-Colunga, J. (2013). Regional density of glial cells in the rat corpus callosum. Biol. Res. 46, 27–32. doi: 10.4067/S0716-97602013000100004
Richard, M. B., Taylor, S. R., and Greer, C. A. (2010). Age-induced disruption of selective olfactory bulb synaptic circuits. Proc. Natl. Acad. Sci. U.S.A. 107, 15613–15618. doi: 10.1073/pnas.1007931107
Rickmann, M., and Wolff, J. R. (1995a). S100 immunoreactivity in a subpopulation of oligodendrocytes and Ranvier's nodes of adult rat brain. Neurosci. Lett. 186, 13–16.
Rickmann, M., and Wolff, J. R. (1995b). S100 protein expression in subpopulations of neurons of rat brain. Neuroscience 67, 977–991. doi: 10.1016/0306-4522(94)00615-C
Rockel, A. J., Hiorns, R. W., and Powell, T. P. (1980). The basic uniformity in structure of the neocortex. Brain J. Neurol. 103, 221–244. doi: 10.1093/brain/103.2.221
Rockland, K. S., and DeFelipe, R. (2012). Cortical white matter: beyond the pale. Front. Media SA 5:67. doi: 10.3389/fnana.2011.00067
Rosen, G. D., and Williams, R. W. (2001). Complex trait analysis of the mouse striatum: independent QTLs modulate volume and neuron number. BMC Neurosci. 2:5. doi: 10.1186/1471-2202-2-5
Rudy, B., Fishell, G., Lee, S., and Hjerling-Leffler, J. (2011). Three groups of interneurons account for nearly 100% of neocortical GABAergic neurons. Dev. Neurobiol. 71, 45–61. doi: 10.1002/dneu.20853
San Jose, I., García-Atares, N., Pelaez, B., Cabo, R., Esteban, I., Vega, J. A., et al. (2001). Reduction of glial fibrillary acidic protein-immunoreactive astrocytes in some brain areas of old hairless rhino-j mice (hr-rh-j). Neurosci. Lett. 309, 81–84. doi: 10.1016/S0304-3940(01)02041-9
Sargeant, T. J., Wang, S., Bradley, J., Smith, N. J. C., Raha, A. A., McNair, R., et al. (2011). Adeno-associated virus-mediated expression of β-hexosaminidase prevents neuronal loss in the Sandhoff mouse brain. Hum. Mol. Genet. 20, 4371–4380. doi: 10.1093/hmg/ddr364
Savchenko, V. L., McKanna, J. A., Nikonenko, I. R., and Skibo, G. G. (2000). Microglia and astrocytes in the adult rat brain: comparative immunocytochemical analysis demonstrates the efficacy of lipocortin 1 immunoreactivity. Neuroscience 96, 195–203. doi: 10.1016/S0306-4522(99)00538-2
Scafidi, J., Hammond, T. R., Scafidi, S., Ritter, J., Jablonska, B., Roncal, M., et al. (2014). Intranasal epidermal growth factor treatment rescues neonatal brain injury. Nature 506, 230–234. doi: 10.1038/nature12880
Schmalbach, B., Lepsveridze, E., Djogo, N., Papashvili, G., Kuang, F., Leshchyns'ka, I., et al. (2015). Age-dependent loss of parvalbumin-expressing hippocampal interneurons in mice deficient in CHL1, a mental retardation and schizophrenia susceptibility gene. J. Neurochem. 135, 830–844. doi: 10.1111/jnc.13284
Schmid, J. S., Bernreuther, C., Nikonenko, A. G., Ling, Z., Mies, G., Hossmann, K. A., et al. (2013). Heterozygosity for the mutated X-chromosome-linked L1 cell adhesion molecule gene leads to increased numbers of neurons and enhanced metabolism in the forebrain of female carrier mice. Brain Struct. Funct. 218, 1375–1390. doi: 10.1007/s00429-012-0463-9
Schüz, A., and Palm, G. (1989). Density of neurons and synapses in the cerebral cortex of the mouse. J. Comp. Neurol. 286, 442–455. doi: 10.1002/cne.902860404
Scott, J. R., Jeffrey, M., and Halliday, W. G. (1994). Unsuspected early neuronal loss in scrapie-infected mice revealed by morphometric analysis. Ann. N. Y. Acad. Sci. 724, 338–343. doi: 10.1111/j.1749-6632.1994.tb38925.x
Shimada, M., Akagi, N., Goto, H., Watanabe, H., Nakanishi, M., Hirose, Y., et al. (1992). Microvessel and astroglial cell densities in the mouse hippocampus. J. Anat. 180 (Pt 1), 89–95.
Silvestri, L., Silvestri, L., Giovanna, A. P. D., Mazzamuto, G., Leergard, T., Orsini, F., et al. (2018). “Towards a full volumetric atlas of cell-specific neuronal spatial organization in the entire mouse brain,” in Biophotonics Congress: Biomedical Optics Congress 2018 (Microscopy/Translational/Brain/OTS) (2018), paper JTu3A.62 (Optical Society of America), JTu3A.62.
Sims, D. E. (1986). The pericyte–a review. Tissue Cell 18, 153–174. doi: 10.1016/0040-8166(86)90026-1
Slow, E. J., van Raamsdonk, J., Rogers, D., Coleman, S. H., Graham, R. K., Deng, Y., et al. (2003). Selective striatal neuronal loss in a YAC128 mouse model of Huntington disease. Hum. Mol. Genet. 12, 1555–1567. doi: 10.1093/hmg/ddg169
Srinivasan, S., Carlo, C. N., and Stevens, C. F. (2015). Predicting visual acuity from the structure of visual cortex. Proc. Natl. Acad. Sci. U.S.A. 112, 7815–7820. doi: 10.1073/pnas.1509282112
Stearns, N. A., Schaevitz, L. R., Bowling, H., Nag, N., Berger, U. V., and Berger-Sweeney, J. (2007). Behavioral and anatomical abnormalities in Mecp2 mutant mice: a model for Rett syndrome. Neuroscience 146, 907–921. doi: 10.1016/j.neuroscience.2007.02.009
Steen, A. (2006). Quantitative Morphological Analyses of the Striatum and Cerebellum of Tenascin-R Deficient Mice, doctoral dissertation, Hamburg.
Sturrock, R. R. (1989). Age related changes in neuron number in the mouse lateral vestibular nucleus. J. Anat. 166, 227–232.
Sturrock, R. R. (1991). Stability of neuron number in the subthalamic and entopeduncular nuclei of the ageing mouse brain. J. Anat. 179, 67–73.
Timmer, M., Cesnulevicius, K., Winkler, C., Kolb, J., Lipokatic-Takacs, E., Jungnickel, J., et al. (2007). Fibroblast growth factor (FGF)-2 and FGF receptor 3 are required for the development of the substantia nigra, and FGF-2 plays a crucial role for the rescue of dopaminergic neurons after 6-hydroxydopamine lesion. J. Neurosci. 27, 459–471. doi: 10.1523/JNEUROSCI.4493-06.2007
Tremblay, M.-È., Zettel, M. L., Ison, J. R., Allen, P. D., and Majewska, A. K. (2012). Effects of aging and sensory loss on glial cells in mouse visual and auditory cortices. Glia 60, 541–558. doi: 10.1002/glia.22287
Trujillo-Estrada, L., Dávila, J. C., Sánchez-Mejias, E., Sánchez-Varo, R., Gomez-Arboledas, A., Vizuete, M., et al. (2014). Early neuronal loss and axonal/presynaptic damage is associated with accelerated amyloid-β accumulation in AβPP/PS1 Alzheimer's disease mice subiculum. J. Alzheimers Dis. 42, 521–541. doi: 10.3233/JAD-140495
Trune, D. R. (1982). Influence of neonatal cochlear removal on the development of mouse cochlear nucleus: I. Number, size, and density of its neurons. J. Comp. Neurol. 209, 409–424. doi: 10.1002/cne.902090410
Tsai, P. S., Kaufhold, J. P., Blinder, P., Friedman, B., Drew, P. J., Karten, H. J., et al. (2009). Correlations of neuronal and microvascular densities in murine cortex revealed by direct counting and colocalization of nuclei and vessels. J. Neurosci. 29, 14553–14570. doi: 10.1523/JNEUROSCI.3287-09.2009
Vela, J. M., Dalmau, I., González, B., and Castellano, B. (1995). Morphology and distribution of microglial cells in the young and adult mouse cerebellum. J. Comp. Neurol. 361, 602–616. doi: 10.1002/cne.903610405
Vinet, J., Lemieux, P., Tamburri, A., Tiesinga, P., Scafidi, J., Gallo, V., et al. (2010). Subclasses of oligodendrocytes populate the mouse hippocampus. Eur. J. Neurosci. 31, 425–438. doi: 10.1111/j.1460-9568.2010.07082.x
Vucurovic, K., Gallopin, T., Ferezou, I., Rancillac, A., Chameau, P., van Hooft, J. A., et al. (2010). Serotonin 3A receptor subtype as an early and protracted marker of cortical interneuron subpopulations. Cereb. Cortex 20, 2333–2347. doi: 10.1093/cercor/bhp310
Walz, W., and Lang, M. K. (1998). Immunocytochemical evidence for a distinct GFAP-negative subpopulation of astrocytes in the adult rat hippocampus. Neurosci. Lett. 257, 127–130. doi: 10.1016/S0304-3940(98)00813-1
Wang, X., Liu, C., Wang, X., Gao, F., and Zhan, R.-Z. (2017). Density and neurochemical profiles of neuronal nitric oxide synthase-expressing interneuron in the mouse basolateral amygdala. Brain Res. 1663, 106–113. doi: 10.1016/j.brainres.2017.02.009
Weigand, M., Sartori, F., and Cuntz, H. (2017). Universal transition from unstructured to structured neural maps. Proc. Natl. Acad. Sci. U.S.A. 114, E4057–E4064. doi: 10.1073/pnas.1616163114
Weimer, J. M., Custer, A. W., Benedict, J. W., Alexander, N. A., Kingsley, E., Federoff, H. J., et al. (2006). Visual deficits in a mouse model of Batten disease are the result of optic nerve degeneration and loss of dorsal lateral geniculate thalamic neurons. Neurobiol. Dis. 22, 284–293. doi: 10.1016/j.nbd.2005.11.008
West, M. J. (1999). Stereological methods for estimating the total number of neurons and synapses: issues of precision and bias. Trends Neurosci. 22, 51–61. doi: 10.1016/S0166-2236(98)01362-9
Whissell, P. D., Cajanding, J. D., Fogel, N., and Kim, J. C. (2015). Comparative density of CCK- and PV-GABA cells within the cortex and hippocampus. Front. Neuroanat. 9:124. doi: 10.3389/fnana.2015.00124
Wirenfeldt, M., Dalmau, I., and Finsen, B. (2003). Estimation of absolute microglial cell numbers in mouse fascia dentata using unbiased and efficient stereological cell counting principles. Glia 44, 129–139. doi: 10.1002/glia.10277
Wonders, C. P., and Anderson, S. A. (2006). The origin and specification of cortical interneurons. Nat. Rev. Neurosci. 7, 687–696. doi: 10.1038/nrn1954
Woodruff-Pak, D. S. (2006). Stereological estimation of Purkinje neuron number in C57BL/6 mice and its relation to associative learning. Neuroscience 141, 233–243. doi: 10.1016/j.neuroscience.2006.03.070
Wu, Y., Zhang, A. Q., and Yew, D. T. (2005). Age related changes of various markers of astrocytes in senescence-accelerated mice hippocampus. Neurochem. Int. 46, 565–574. doi: 10.1016/j.neuint.2005.01.002
Xu, F., Grande, A. M., Robinson, J. K., Previti, M. L., Vasek, M., Davis, J., et al. (2007). Early-onset subicular microvascular amyloid and neuroinflammation correlate with behavioral deficits in vasculotropic mutant amyloid beta-protein precursor transgenic mice. Neuroscience 146, 98–107. doi: 10.1016/j.neuroscience.2007.01.043
Yager, L. M., Garcia, A. F., Wunsch, A. M., and Ferguson, S. M. (2015). The ins and outs of the striatum: role in drug addiction. Neuroscience 301, 529–541. doi: 10.1016/j.neuroscience.2015.06.033
Yamada, A., Saji, M., Ukita, Y., Shinoda, Y., Taniguchi, M., Higaki, K., et al. (2001). Progressive neuronal loss in the ventral posterior lateral and medial nuclei of thalamus in Niemann–Pick disease type C mouse brain. Brain Dev. 23, 288–297. doi: 10.1016/S0387-7604(01)00209-1
Yang, T.-T., Lin, C., Hsu, C.-T., Wang, T.-F., Ke, F.-Y., and Kuo, Y.-M. (2013). Differential distribution and activation of microglia in the brain of male C57BL/6J mice. Brain Struct. Funct. 218, 1051–1060. doi: 10.1007/s00429-012-0446-x
Zanjani, H. S., Vogel, M. W., Delhaye-Bouchaud, N., Martinou, J. C., and Mariani, J. (1997). Increased inferior olivary neuron and cerebellar granule cell numbers in transgenic mice overexpressing the human Bcl-2 gene. J. Neurobiol. 32, 502–516.
Zeisel, A., Muñoz-Manchado, A. B., Codeluppi, S., Lönnerberg, P., La Manno, G., Juréus, A., et al. (2015). Brain structure. Cell types in the mouse cortex and hippocampus revealed by single-cell RNA-seq. Science 347, 1138–1142. doi: 10.1126/science.aaa1934
Zhang, J., Pho, V., Bonasera, S. J., Holtzman, J., Tang, A. T., Hellmuth, J., et al. (2007). Essential function of HIPK2 in TGFbeta-dependent survival of midbrain dopamine neurons. Nat. Neurosci. 10, 77–86. doi: 10.1038/nn1816
Keywords: cell density, mouse brain, brain regions, stereology, whole-brain atlas
Citation: Keller D, Erö C and Markram H (2018) Cell Densities in the Mouse Brain: A Systematic Review. Front. Neuroanat. 12:83. doi: 10.3389/fnana.2018.00083
Received: 08 May 2018; Accepted: 20 September 2018;
Published: 23 October 2018.
Edited by:
Claus C. Hilgetag, Universitätsklinikum Hamburg-Eppendorf, GermanyReviewed by:
Leigh-Anne Dell, University Medical Center Hamburg-Eppendorf, GermanyPeter Jedlicka, Goethe-Universität Frankfurt am Main, Germany
Copyright © 2018 Keller, Erö and Markram. This is an open-access article distributed under the terms of the Creative Commons Attribution License (CC BY). The use, distribution or reproduction in other forums is permitted, provided the original author(s) and the copyright owner(s) are credited and that the original publication in this journal is cited, in accordance with accepted academic practice. No use, distribution or reproduction is permitted which does not comply with these terms.
*Correspondence: Daniel Keller, daniel.keller@epfl.ch