Department of Neurobiology, Harvard Medical School, Boston, MA, USA
Nearby neurons in mammalian neocortex demonstrate a great diversity of cell types and connectivity patterns. The importance of this diversity for computation is not understood. While extracellular recording studies in visual cortex have provided a particularly rich description of behavioral modulation of neural activity, new methods are needed to dissect the contribution of specific circuit elements in guiding visual perception. Here, we describe a method for three-dimensional cellular imaging of neural activity in the awake mouse visual cortex during active discrimination and passive viewing of visual stimuli. Head-fixed mice demonstrated robust discrimination for many hundred trials per day after initial task acquisition. To record from multiple neurons during operant behavior with single-trial resolution and minimal artifacts, we built a sensitive microscope for two-photon calcium imaging, capable of rapid tracking of neurons in three dimensions. We demonstrate stable recordings of cellular calcium activity during discrimination behavior across hours, days, and weeks, using both synthetic and genetically encoded calcium indicators. When combined with molecular and genetic technologies in mice (e.g., cell-type specific transgenic labeling), this approach allows the identification of neuronal classes in vivo. Physiological measurements from distinct classes of neighboring neurons will enrich our understanding of the coordinated roles of diverse elements of cortical microcircuits in guiding sensory perception and perceptual learning. Further, our method provides a high-throughput, chronic in vivo assay of behavioral influences on cellular activity that is applicable to a wide range of mouse models of neurologic disease.
Visual cortical responses to identical stimuli in behaving primates demonstrate rapid, task-dependent modulation. For instance, responses can be influenced by spatial, temporal and motivational context, arousal, task-difficulty, and selective attention (e.g., Richmond et al., 1983
; Spitzer and Richmond, 1991
; Desimone and Duncan, 1995
; Zipser et al., 1996
; Parasuraman, 1998
; Liu and Richmond, 2000
; O’Connor et al., 2002
; Boudreau et al., 2006
; Gilbert and Sigman, 2007
). Response modulation can be observed even at the level of primary visual cortex (V1; McAdams and Maunsell, 1999
; O’Connor et al., 2002
; Super, 2002
; McAdams and Reid, 2005
; Palmer et al., 2007
; Chen et al., 2008
; Herrero et al., 2008
). A poorly understood feature of most studies, however, is that behavioral modulation of responses in nearby neurons is heterogeneous, both in magnitude and even in sign.
The diversity of modulatory effects in nearby neurons may be related to differences in each neuron’s visual response properties (DeAngelis et al., 1999
; Martinez-Trujillo and Treue, 2004
), laminar depth (Mehta et al., 2000
), connectivity (Bravo and Karten, 1992
; Brown and Hestrin, 2009
) or cell type (see below). In particular, cortical inhibitory cell classes may be differentially modulated by behavioral context (Buia and Tiesinga, 2008
), providing a potential mechanism underlying dynamic regulation of local information flow. Although considerable anatomical, neurochemical, and physiological diversity exists in nearby neurons, only a small number of in vivo electrophysiological studies have correlated behavioral modulation of neural responses with information about cell type (Swadlow and Weyand, 1987
; Mitchell et al., 2007
; Chen et al., 2008
). These studies have all inferred cellular identity from extracellular spike waveforms, which has limited scope and reliability. Intracellular recordings in vivo, while more informative, have extremely low yield, and are not easily amenable to studies in awake and behaving animals (but see Margrie et al., 2002
; Crochet and Petersen, 2006
; Poulet and Petersen, 2008
; Harvey et al., 2009
).
To study how diverse elements within a local cortical microcircuit are engaged to optimize visual processing across changing task demands, we have developed a robust method for three-dimensional cellular imaging of mouse visual cortex during operant visual discrimination behavior. The ability to visualize tens or hundreds of simultaneously recorded neurons with two-photon calcium imaging provides several advantages over extra-cellular recordings (see Section ‘Discussion’). First, this technique offers the possibility of recording from the same volume of neurons across days and months, enabling new directions in the study of sensory perception and perceptual learning. Cellular imaging also facilitates labeling of anatomical identity (cell type, cell connectivity) of recorded neurons, in combination with molecular and genetic techniques. Two-photon imaging of cellular and neuropil signals has recently been described in awake, head-fixed mice and rats (Dombeck et al., 2007
, 2009
; Verhagen et al., 2007
; Greenberg et al., 2008
; Kuhn et al., 2008
; Mukamel et al., 2009
; for review, see Grewe and Helmchen, 2009
). However, no published work has imaged cellular responses in awake, head-fixed mice during sensory discrimination or during passive viewing of visual stimuli.
The mouse is the pre-eminent mammalian model system for genetic labeling or manipulation of specific cortical cell classes (O’Connor et al., 2009
). Cellular imaging in mice offers immense potential for understanding cortical function in healthy mice, as well as in mouse models of neurologic disease (e.g., Eichhoff et al., 2008
; Kuchibhotla et al., 2009
). While the imaging and behavioral techniques described here can be used in different cortical regions and using different sensory modalities, we focus on visual behaviors that allow direct comparison to the rich literature on visual behavior and neurophysiology in carnivores and primates. Indeed, electrophysiological studies in anesthetized (Dräger, 1975
; Mangini and Pearlman, 1980
; Metin et al., 1988
; Niell and Stryker, 2008
; Liu et al., 2009
) and awake (Niell and Stryker, 2009; Frenkel et al., 2006
; ) mice suggest that mouse visual cortical neurons demonstrate similar properties to those in carnivores and primates, despite an overall decrease in spatial acuity (Prusky and Douglas, 2004
; Niell and Stryker, 2008
). While freely moving mice have been shown to discriminate between oriented gratings (Reuter, 1987
; Prusky and Douglas, 2004
; Wong and Brown, 2006
), no operant behavioral technique currently exists for visual discrimination in head-fixed mice. Visual discrimination tasks using head fixation would significantly facilitate chronic, three-dimensional cellular imaging during behavior, in combination with accurate monitoring of eye position.
Here, we describe a GO–NOGO visual discrimination task in head-fixed mice, suitable for cellular imaging studies of visual perception, perceptual learning, task engagement, and task difficulty. We show that mice will perform this task (or passively view the same stimuli) for several hundred trials a day, and we demonstrate quantitative monitoring of neural and behavioral responses across hours, days and months. Combining visual behavior and imaging techniques with molecular and genetic technologies in mice (for review, see O’Connor et al., 2009
) will enable new translational approaches to dissecting the cellular mechanisms underlying visual behavior at the level of cortical microcircuits.
All procedures were conducted in accordance with the ethical guidelines of the National Institutes of Health and were approved by the IACUC at Harvard Medical School. Twenty-five male and female mice aged p30 to p75 at experiment onset were used in this study: 19 wild-type C57BL/6 (Charles River), 3 wild-type Swiss (Charles River), and 3 GAD67-GFP (Tamamaki et al., 2003
). Two-photon calcium imaging was attempted in 10 mice. Below, we provide detailed behavioral, surgical, and imaging procedures for two-photon calcium imaging during visual discrimination (see also Figure 1 and Section ‘Results’).
Visual Discrimination Training and Behavioral Monitoring
Visual stimulation
Visual stimuli were controlled and behavioral lick responses recorded by custom-written Presentation software (Neurobehavioral Systems). Visual stimuli were square- or sine-wave gratings (28°/cycle, 80 or 100% contrast, black and white) drifting at 2 Hz. Stimuli were presented at 60 Hz using a calibrated 19″ LCD monitor (Viewsonic VP930B). For orientation mapping, stimuli were either presented in random order, 4 s long and intermittent with 8 s ISI of gray screen at mean luminance (Figure 2
), or were 9.5 s long (with 9.5 s ISI), presented sequentially in counterclockwise order (Figure 6 and Movie S1 in Supplementary Material).
Training procedures
Mice were first handled for 3–14 days (>5 min on most days, or until mice began to groom while being held). Water scheduling then began, in which mice were given a total of 25 cc/kg water per day, during the training session (see below) or handling (via syringe with soft plastic tip). To achieve head restraint, awake, headposted mice were led into a custom semicircular plastic tube containing support for forepaws and a plastic shield to prevent grasping of the lickspout, and both headpost ends were clamped to 1/2″ posts (Thorlabs) using thumbscrews. The cylinder was held in place by beaker clamps (VWR), and adjusted to minimize stress on neck muscles. An accelerometer glued to the cylinder detected body motion (Figure S2 in Supplementary Material). Water was administered using a syringe or a lickspout at the onset of the restraint period, which was gradually extended from 5 min to >1 h over the course of 1–2 weeks. Several mice could be restrained simultaneously on the same table, further minimizing stress and training time. Once mice sat quietly for extended periods of time, automated training began (for additional details on training procedures, see Section Stable Visual Discrimination Behavior in Head-Fixed Mice and Figure 3
).
Rewards during automated training were 5–6 µl drops of water delivered using a computer-controlled solenoid (Minuteman Controls, EV 2-6), via a shaped syringe and plastic spout. Licks were detected as breaks in an optical beam (940 nm LED, Edmund), using custom electronics. Mice received auditory feedback following correct and incorrect lick responses (2 kHz tone or noise, respectively) presented via computer speakers. Early in training, incorrect licks or licks early in stimulus presentation also triggered presentation of a mild, brief airpuff (100 ms) to the facial skin, using a solenoid (Figure 3
), as well as additional ‘time-out’ delays (~2 s) before commencing the next trial. In some sessions, we used alternating active discrimination and passive viewing (no reward) blocks of trials (43 trials/block; see Figure 3 and Section ‘Variation of Behavioral Context’, below). We further deterred mice from licking during passive viewing blocks by swinging the lick spout in and out of reach using a solenoid (see Figure 1
A). Sessions were concluded when mice ceased to be engaged in the task. Because the mean number of active discrimination trials per session was ~300 (Table 1
), and ~40% of trials were target trials, then a 25-g mouse with a 90% hit rate (HR) would receive, on average, ~0.65 cc of water during a session (minimum total daily water for a mouse of this weight: 0.625 cc). For sessions with greater incidence of rewarded trials, no additional restriction was used on subsequent days. If less that the minimal amount of water was provided during training, then the mouse was supplemented to the minimal amount while in his home cage, >1 h following training.
Eyetracking
Eyetracking was performed using an ISCAN eyetracking system (240 Hz) coupled to a macro lens, positioned along the body axis of the mouse (Figure 1
A). The eye was illuminated using 940 nm LEDs positioned near the eye and out of the way of the monitor. A 940 nm narrow-band filter (Edmund) was placed in front of the eyetracking camera to block infra-red laser light emanating from the pupil. A second camera collected images of the eye at lower rates (20 Hz) via the ISCAN monitor output. This provided a simple, low-tech solution for detecting large horizontal eye displacements (Figure 2
D), and could be combined with less expensive eyetracking cameras (see also Stahl et al., 2000
; Sakatani and Isa, 2004
). We took a collapsed, horizontal cross-section of the eye from the 20 Hz images, located the pupil boundaries in each frame, and took the midpoint as the pupil position (Figures 2
D,E). This provided an offline means of tracking pupil position and rejecting trials with large eye movements. In general, horizontal eye movements (Figure S1 in Supplementary Material) and, to an even greater extent, vertical eye movements (not shown) were rare in mice during passive viewing, similar to eye stability during passive viewing in rabbits (Cano et al., 2006
).
Online ISCAN estimates of eye rotation using pupil position were contaminated by small translational motions (<300 µm) during licking or chewing, which could be removed by online tracking and subtraction of the corneal reflection spot generated by LED illumination (Figure S2 in Supplementary Material). Pupil displacement estimates using online or offline software were converted into angular displacements by correcting for off-axis camera location and assuming that the center of eye rotation was 1.09 mm behind the pupil (Stahl et al., 2000
). For synchronization of eyetracking, visual stimulation, behavioral responses, and imaging rigs, ISCAN outputs and all other triggers were digitized (2 kHz, National Instruments) and sorted offline (MATLAB, The MathWorks).
Behavioral analyses
Target stimuli were upwards drifting gratings, and non-target stimuli were identical gratings drifting in other directions (see Figures 3 and 4
). Hit rate (HR; fraction of trials with licks following target presentation) and false-alarm rates (FA; fraction of trials with licks following non-targets) for each non-target stimulus type were calculated for each block of 43 trials. The number of active discrimination trials per session (Table 1 and Figure 4
) only included trials in blocks with HRs exceeding 0.7. A useful measure of behavioral discriminability of targets from non-targets is given by d′ = norminv(HR) − norminv(FA), where norminv() is the inverse of the cumulative normal function (Green and Swets, 1966
). Values for HR and FA were truncated between 0.01 and 0.99. Higher d′ values indicate better discriminability (maximum d′ = 4.65). To estimate orientation threshold on a given day (Figure 4
C), we performed a linear fit to d′ values (for all non-targets with d′ < 2.5) and estimated the angular distance from the target predicted to generate a value of d′ = 1 (see Section ‘Task Acquisition and Long-term Stability’).
Surgery and Indicator Delivery
Expression of genetically encoded calcium indicator, YC3.6
Viral expression of the genetically encoded calcium indicator (GECI) yellow cameleon 3.6 (pAAV-CBA-YC3.6-WPRE, Kuchibhotla et al., 2008
; original FRET based probe described in Nagai et al., 2004
) was achieved in the left primary visual cortex, as follows: Mice were anesthetized and the scalp resected using aseptic technique. Approximately 1 µl of YC3.6 was injected over 10 min though a ~0.5 mm burrhole (2.7 mm lateral, 0.5 mm anterior to lambda), between 200 and 400 µm deep, using a glass pipette (20 µm tip) and a Picospritzer (<5 psi). After leaving the pipette in place for an additional 10 min, the pipette was removed and sutures applied to skin margins.
Headpost and other implants, craniotomy
A titanium headpost (grade 2, 0.05′ thick, 0.95 g; Figure 1
C) was implanted using aseptic technique, as follows: Mice were anesthetized with an initial dose of ketamine/xylazine (100 and 5 mg/kg), maintained on isoflurane (1.5% in 100% O2), and positioned in a stereotactic apparatus on a heating blanket. Atropine was administered (0.2 mg/kg, IM) and eyes were protected with ointment (Vetropolycin). Following resection of skin and clearing of skull fascia, a skull screw (00-96, Plastics One) was cemented in place placed on the anterior/right bone plate. In some mice, subdural electrocorticogram electrodes and a connector (Plastics One) were positioned over the right visual cortex in order to obtain gross measures of brain state (not shown). The skull was then covered with a thin layer of cyanoacrylate (Vetbond) and allowed to dry, followed by cementing of the headpost in an axis approximately parallel with the skull over the left primary visual cortex. White dental cement powder (Lang) mixed 3:1 with black powder paint (Pearl Arts #101463) was applied for structural support and to prevent stray light from the monitor from entering through the skull. O-rings (#13 and #15; McMaster-Carr) were glued to the headpost concentric with the center of the targeted craniotomy, to form a well for imaging (Figure 1
C) and to provide light-tight coupling with a #17 O-ring glued to flexible light shielding material (Thorlabs) that could be wrapped around the imaging objective. All wound margins adhered to the perimeter of the headpost and dental cement, and were treated with Vetropolycin prior to recovery. Buprenorphine injections (4 × 0.05 mg/kg) and prophylactic injections of antibiotics (cefazolin 500 mg/kg) were administered, and mice were single housed and allowed to recover with freely available water mixed with sulfatrim antibiotic (1:32) for >5 days before water scheduling recommenced.
Following habituation to head restraint and training in the visual discrimination task (Figure 1
A), a 3-mm diameter craniotomy was performed over primary visual cortex. Procedures were similar to headpost surgery except that dexamethasone (8 mg/kg, IM) was also applied. Care was taken to minimize dural tears or bleeding. Either sterile ACSF (HEPES-based, glucose-free), saline, or 1.5 or 3% agarose (type III-A, Sigma-Aldrich) was applied and a 5-mm glass coverslip (WPI) was sealed over the craniotomy using dental cement. The mouse was allowed to recover for at least 1–2 days before imaging.
Loading of synthetic calcium indicator
In some experiments (Figure 1
A), we performed a bolus loading of the calcium indicator Oregon Green BAPTA-1 AM (OGB1-AM; Invitrogen) with 10% DMSO and Pluronic F-127 (Stosiek et al., 2003
; Histed et al., 2009
), 200–300 µm below the cortical surface, under light isoflurane anesthesia. We distinguished neurons from astrocytes by labeling astrocytes via co-injection of the red dye sulforhodamine-101 (SR101, Nimmerjahn et al., 2004
). Passive viewing and/or behavior sessions began 1–2 h after recovery from surgery in the home cage, and lasted 2–5 h. Note that no additional systemic drugs (e.g., atropine) were used during this surgery that could influence subsequent behavior, and eyes were lightly taped shut to protect them from drying. Re-injection on subsequent days was achieved by removing the coverslip and penetrating the pre-existing agarose during dye injection, which minimized additional dural bleeding.
Two-Photon Calcium Imaging
Imaging hardware and software
The system for two-photon imaging in behaving mice is shown in Figure 1
B. In vivo calcium imaging was conducted with a homebuilt two-photon microscope. For optimal detection sensitivity, we used a two-inch optical path (2′ lenses and hardware for Thorlabs, 2″ filters and dichroics from Semrock and Chroma), and gallium arsenide photomultiplier tubes (PMTs, 2× increased sensitivity; Hamamatsu #H7422P-40MOD) coupled to electronic shutters (Uniblitz) to prevent PMT damage. The microscope permitted rapid alternation between blue/green and green/red dichroic cubes, in order to isolate signals from CFP or GFP (blue), YFP or OGB1-AM (green), or sulforhodamine (red; FF01-457_50, FF01-542_50, and FF01-629_53, respectively; Semrock). We achieved high excitation efficiency using an Olympus 25× (NA 1.05) or Nikon 16× (NA 0.8) objective together with a Mai Tai laser (830 nm for YC3.6, 800 nm or 920 nm for OGB 1-AM) with group delay dispersion compensation (Deep See ‘pre-chirp’ module, Newport). Scanning galvanometers (Cambridge Technology) provided a frame rate up to 64 Hz (32 × 32 pixels/frame, pixel dwell time: 16 μs), which required passive cooling of mirrors and active cooling of mirror drivers (using a chiller, WAtronix).
To achieve complete three-dimensional imaging of small volumes, we scanned the objective in a trapezoidal pattern using a piezo-scanner (Physik Instrumente, P-721.LLQ; 48 µm displacement, 3.5 µm/plane; Figure 1
B) controlled by a PC computer running custom-written Labview software, synchronized to output triggers sent from the two-photon acquisition computer. Image acquisition was controlled by a modified version of ScanImage (Pologruto et al., 2003
) and MATLAB (The MathWorks). To maintain constant fluorescence excitation across multiple depths and to avoid passing laser power during the two ‘flyback’ frames, we often modulated laser power with a Pockels cell (e.g., between 16 and 13 mW in Figure 6
), which was controlled by the MATLAB program.
Imaging acquisition and analysis
All image analyses were performed in MATLAB. Imaging during behavior typically involved three to four runs, each lasting 25 min (~200 trials/run, 100000 frames/run). Three-dimensional volumes (14 planes) were acquired at 4 Hz. These data were analyzed using a rigid, subpixel alignment procedure based on a 3D cross- correlation with an average volume generated from motion-free epochs. Alignment was performed on the OGB-1 channel or YFP channel (for YC3.6) and the estimated shifts were then applied to that channel as well as the SR101 or CFP channel, respectively. Volumes could also undergo subsequent co-registration that corrected for motions faster than 4 Hz (Figure 5
), by first performing rigid 2D co-registration on each plane in the volume, followed by estimation of shifts of the plane in the Z dimension, and interpolation back to an evenly spaced volume.
Time courses of responses were obtained by summing signals from all pixels within 3D cell masks. The cell masks were first derived using an automated algorithm, then corrected by hand to eliminate obvious errors, and finally eroded to minimize contamination by neuropil signals. For ratiometric imaging (Figure 7
), fluorescence ratio (R) was defined as the ratio of YFP fluorescence (green channel) to CFP fluorescence (blue channel). The mean (F0 or R0) was subtracted from each trace, and traces were subsequently high-pass filtered (200 s cutoff, third order Butterworth filter). Traces were then converted to fractional changes: dF/F0 = [F(t) − F0]/F0, dR/R0 = [R(t) − R0]/R0. For average traces (Figures 2
C,6
D and 7
B,C), the mean of each trace in the 2 s prior to stimulus onset was subtracted from all time points.
Overview
Our procedures for imaging cellular responses during passive viewing and visual behavior are summarized in Figure 1
A (see also Section ‘Materials and Methods’). The sequence began with daily handling, headpost implant surgery, and habituation of the animal to head restraint and sitting in a plastic half cylinder (Figure 1
B; ease of habituation was a useful indicator of successful task acquisition and stable neural recordings). Next, a cranial window was placed over left visual cortex, and the mouse was allowed to recover. At this point, head-fixed mice could be trained on visual discrimination tasks of varying complexity and difficulty (Section ‘Stable Visual Discrimination Behavior in Head-fixed Mice’), allowing combination with three-dimensional cellular imaging during visual behavior (Section ‘Chronic Cellular Imaging of Visual Responses During Behavior’). Alternatively, acute mapping of visual responses in non-anesthetized mice could be conducted using a more basic, two-dimensional imaging rig (Section ‘Cellular Imaging in Identified Neurons During Awake, Passive Viewing’).
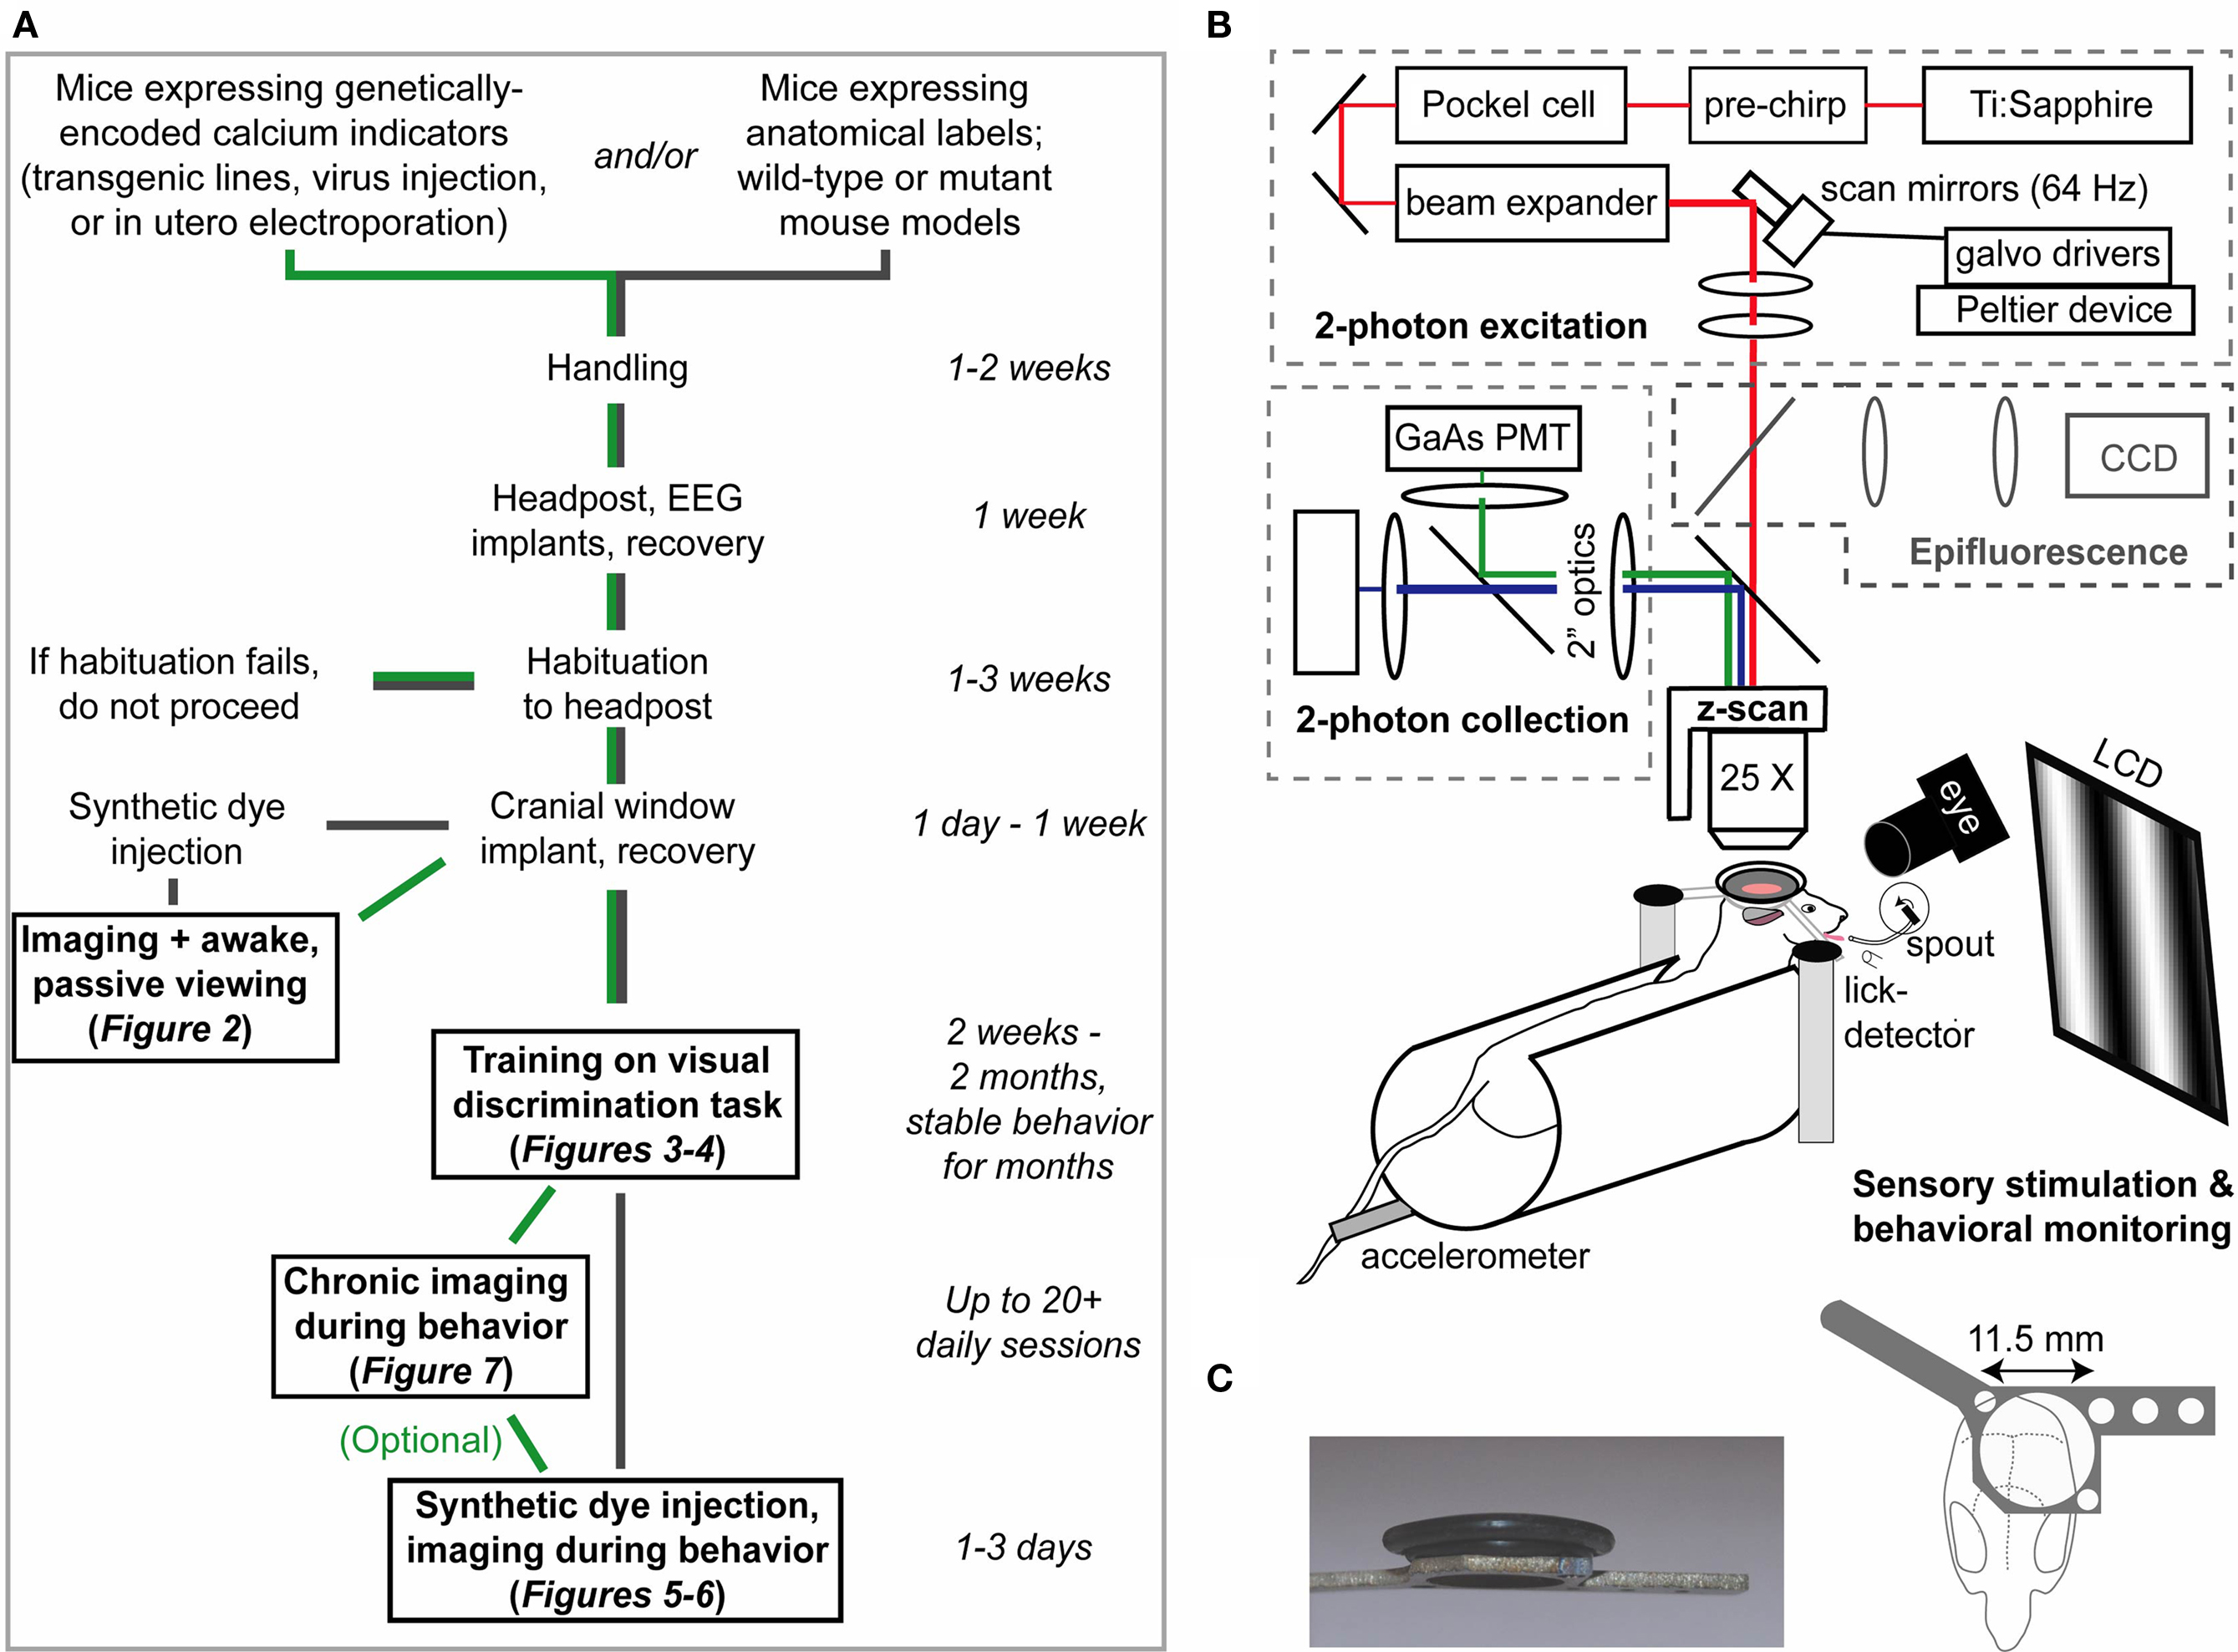
Figure 1. Overview and setup for two photon calcium imaging in awake and behaving mice. (A) Schematic timeline for combining cellular imaging with visual behavior. Green and gray paths delineate routes for imaging with genetically encoded calcium indicators or bolus-loaded synthetic calcium indicators, respectively. (B) Head-fixed mice view an LCD monitor during concurrent two-photon calcium imaging and eyetracking. Optimized fluorescence excitation and light collection, combined with fast 3D imaging, allow robust measurements of neural responses on single trials. (C) A titanium headpost secured over visual cortex and an imaging well constructed from rubber O-rings provided excellent stability, wide viewing angle, and light shielding (see Section ‘Materials and Methods’).
Cellular Imaging in Identified Neurons during Awake, Passive Viewing
Before we attempted to record visual responses during behavioral engagement (Section ‘Chronic Cellular Imaging of Visual Responses During Behavior’), we first established simple methods for imaging during passive viewing. We found that stable neural responses (with minimal brain motion or eye motion) could be obtained in the majority of trials during passive stimulus presentation (Figure S1 in Supplementary Material), enabling visual mapping studies in un-anesthetized mice using standard two-dimensional imaging. Figure 2
provides an example of calcium responses of cortical neurons during awake, passive viewing, using acute loading of synthetic calcium indicator, OGB1-AM (cf. Ohki et al., 2005
; Mrsic-Flögel et al., 2007
). Excitatory neurons and inhibitory neurons could be classified in vivo in this mouse due to expression of green fluorescent protein in all GABAergic neurons (Figure 2
A, green neurons; Tamamaki et al., 2003
; Sohya et al., 2007
; Kerlin et al., 2009
). An example of orientation-tuned responses to drifting gratings (28°/cycle square wave, 2 Hz) is shown in Figure 2
B. Responses could be detected in single trials in GABAergic and non-GABAergic neurons (Figure 2
C). These data illustrate the value of two-photon calcium imaging in awake, transgenic mice, providing robust responses in genetically identified cell types.
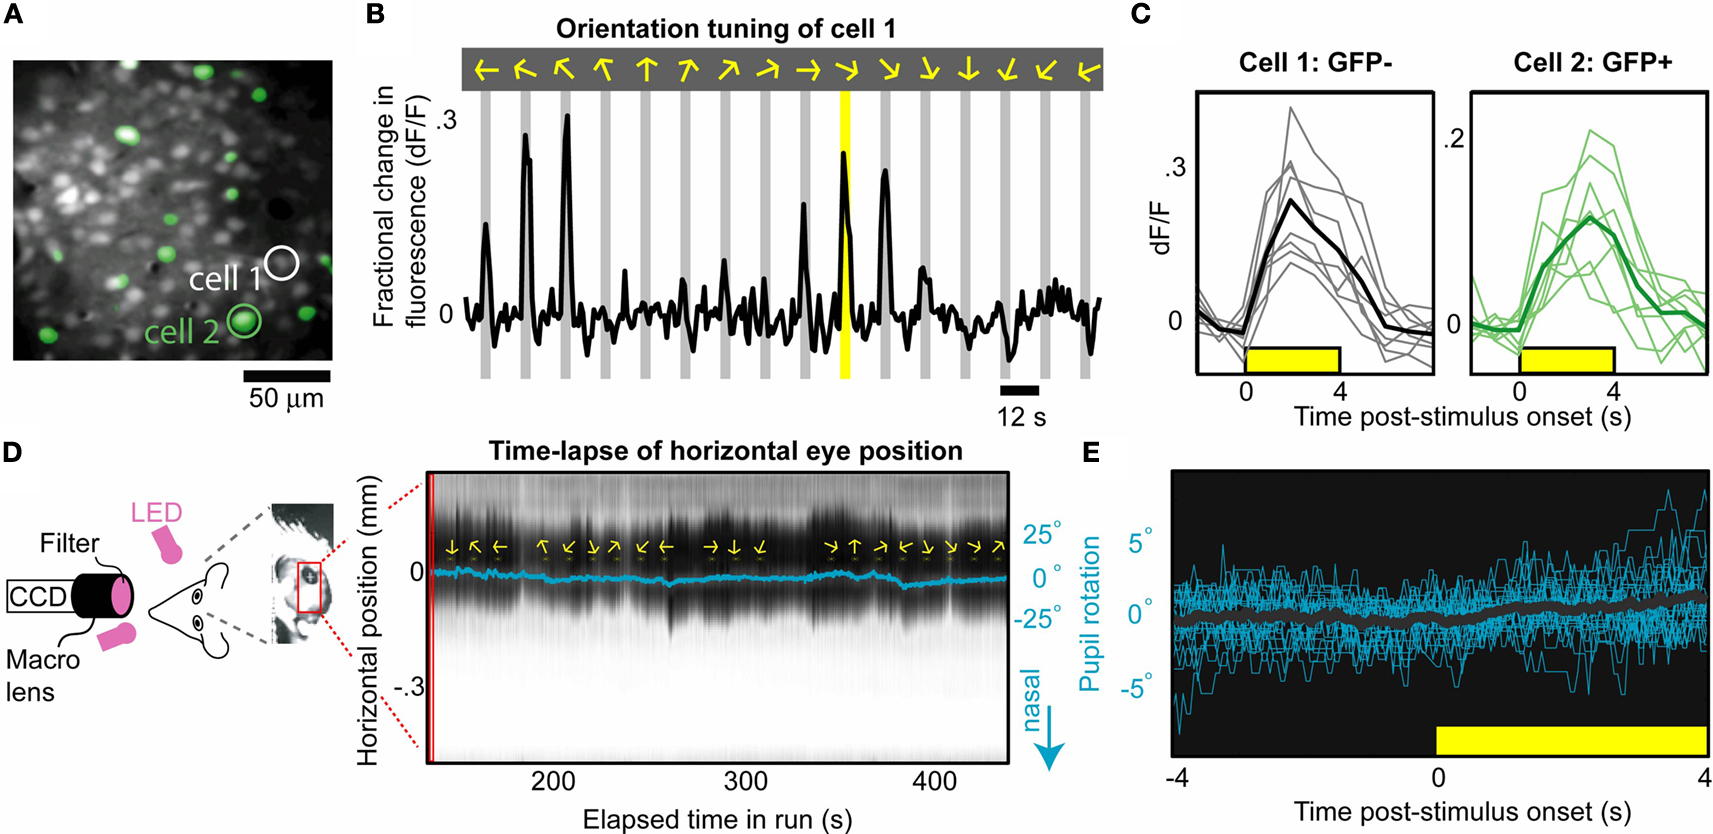
Figure 2. Mapping visual responses in identified excitatory and inhibitory neurons in awake mice. (A) Average image of neurons loaded with synthetic calcium indicator, OGB1-AM, in an awake, transgenic mouse expressing GFP in all GABAergic neurons (labeled in green; image depth: 145 µm below pia; 45 mW excitation at 800 nm). (B) Orientation tuning curve (cell 1; average of eight trials) demonstrating calcium responses during presentation of drifting oriented gratings in 16 directions (arrows and gray bars). (C) Examples of single-trial responses to repeated presentations of the same stimulus (yellow bar in B), in one excitatory (gray, cell 1) and one inhibitory (green, cell 2) neuron. Thick lines indicate mean responses. (D) Concurrent eyetracking (left panel) demonstrated relatively stable pupil position (slow drifts <10°, with minor changes in dilation) across hundreds of seconds. Right panel: Time-lapse of cross-section of mouse eye (black: pupil). Pupil location (blue line) was estimated using simple offline tracking of pupil edges. Yellow arrows indicate stimulus presentation. (E) Pupil time course following alignment to stimulus onset [N = 24 traces; mean pupil location in (4 s, 4 s) was subtracted from each trace; black line: mean trace]. For the stimuli used in this manuscript (28°/cycle, drifting at 2 Hz), stimulus-evoked eye movements were not consistently observed, and trials with spontaneous eye movements were rare (see also Figures S1 and S2 in Supplementary Material).
Imaging in head-fixed mice also facilitates monitoring of eye movements. In general, drifting gratings in the range of low spatial (0.02–0.1 cyc/deg) and temporal (1–2 Hz) frequencies employed here did not evoke significant eye movements. We monitored eye motion using an infra-red camera and simple video analyses (20 Hz; e.g., Figure 2
D and Figure S1 in Supplementary Material) or using more sophisticated online tracking software (240 Hz; see Figure S2 in Supplementary Material, and Section ‘Materials and Methods’). Figure 2
D demonstrates the relative stability in eye motion across several hundred seconds of passive viewing from the above experiment (slow drifts <10°, and no or minimal stimulus-evoked eye motion, <4°; for additional analyses, see Figure S1 in Supplementary Material). Given the larger size of cortical receptive fields in mice compared to higher mammals (Dräger, 1975
; Mangini and Pearlman, 1980
; Metin et al., 1988
; Niell and Stryker, 2008
), small eye motions should not influence cortical responses significantly, particularly when using a very large screen and sinusoidal gratings of low spatial frequency. Rare, large eye movements can be tracked and rejected offline (Figure S1 in Supplementary Material).
Stable Visual Discrimination Behavior in Head-Fixed Mice
Behavioral setup
Head-fixed mice could be trained to discriminate between gratings drifting in different directions, using a ‘GO–NOGO’ operant discrimination task (see Section ‘Materials and Methods’). The task structure is described in Figure 3
A. Water-scheduled mice were trained to lick following presentation of an upward drifting ‘target’ grating, and to suppress licking following ‘non-target’ gratings drifting in other directions. Correct detection of a target (‘hit’) was indicated with a pure tone (2 kHz) and rewarded with a drop of water (5–6 µl), while responses to non-target stimuli (‘false-alarms’) were indicated using white noise.
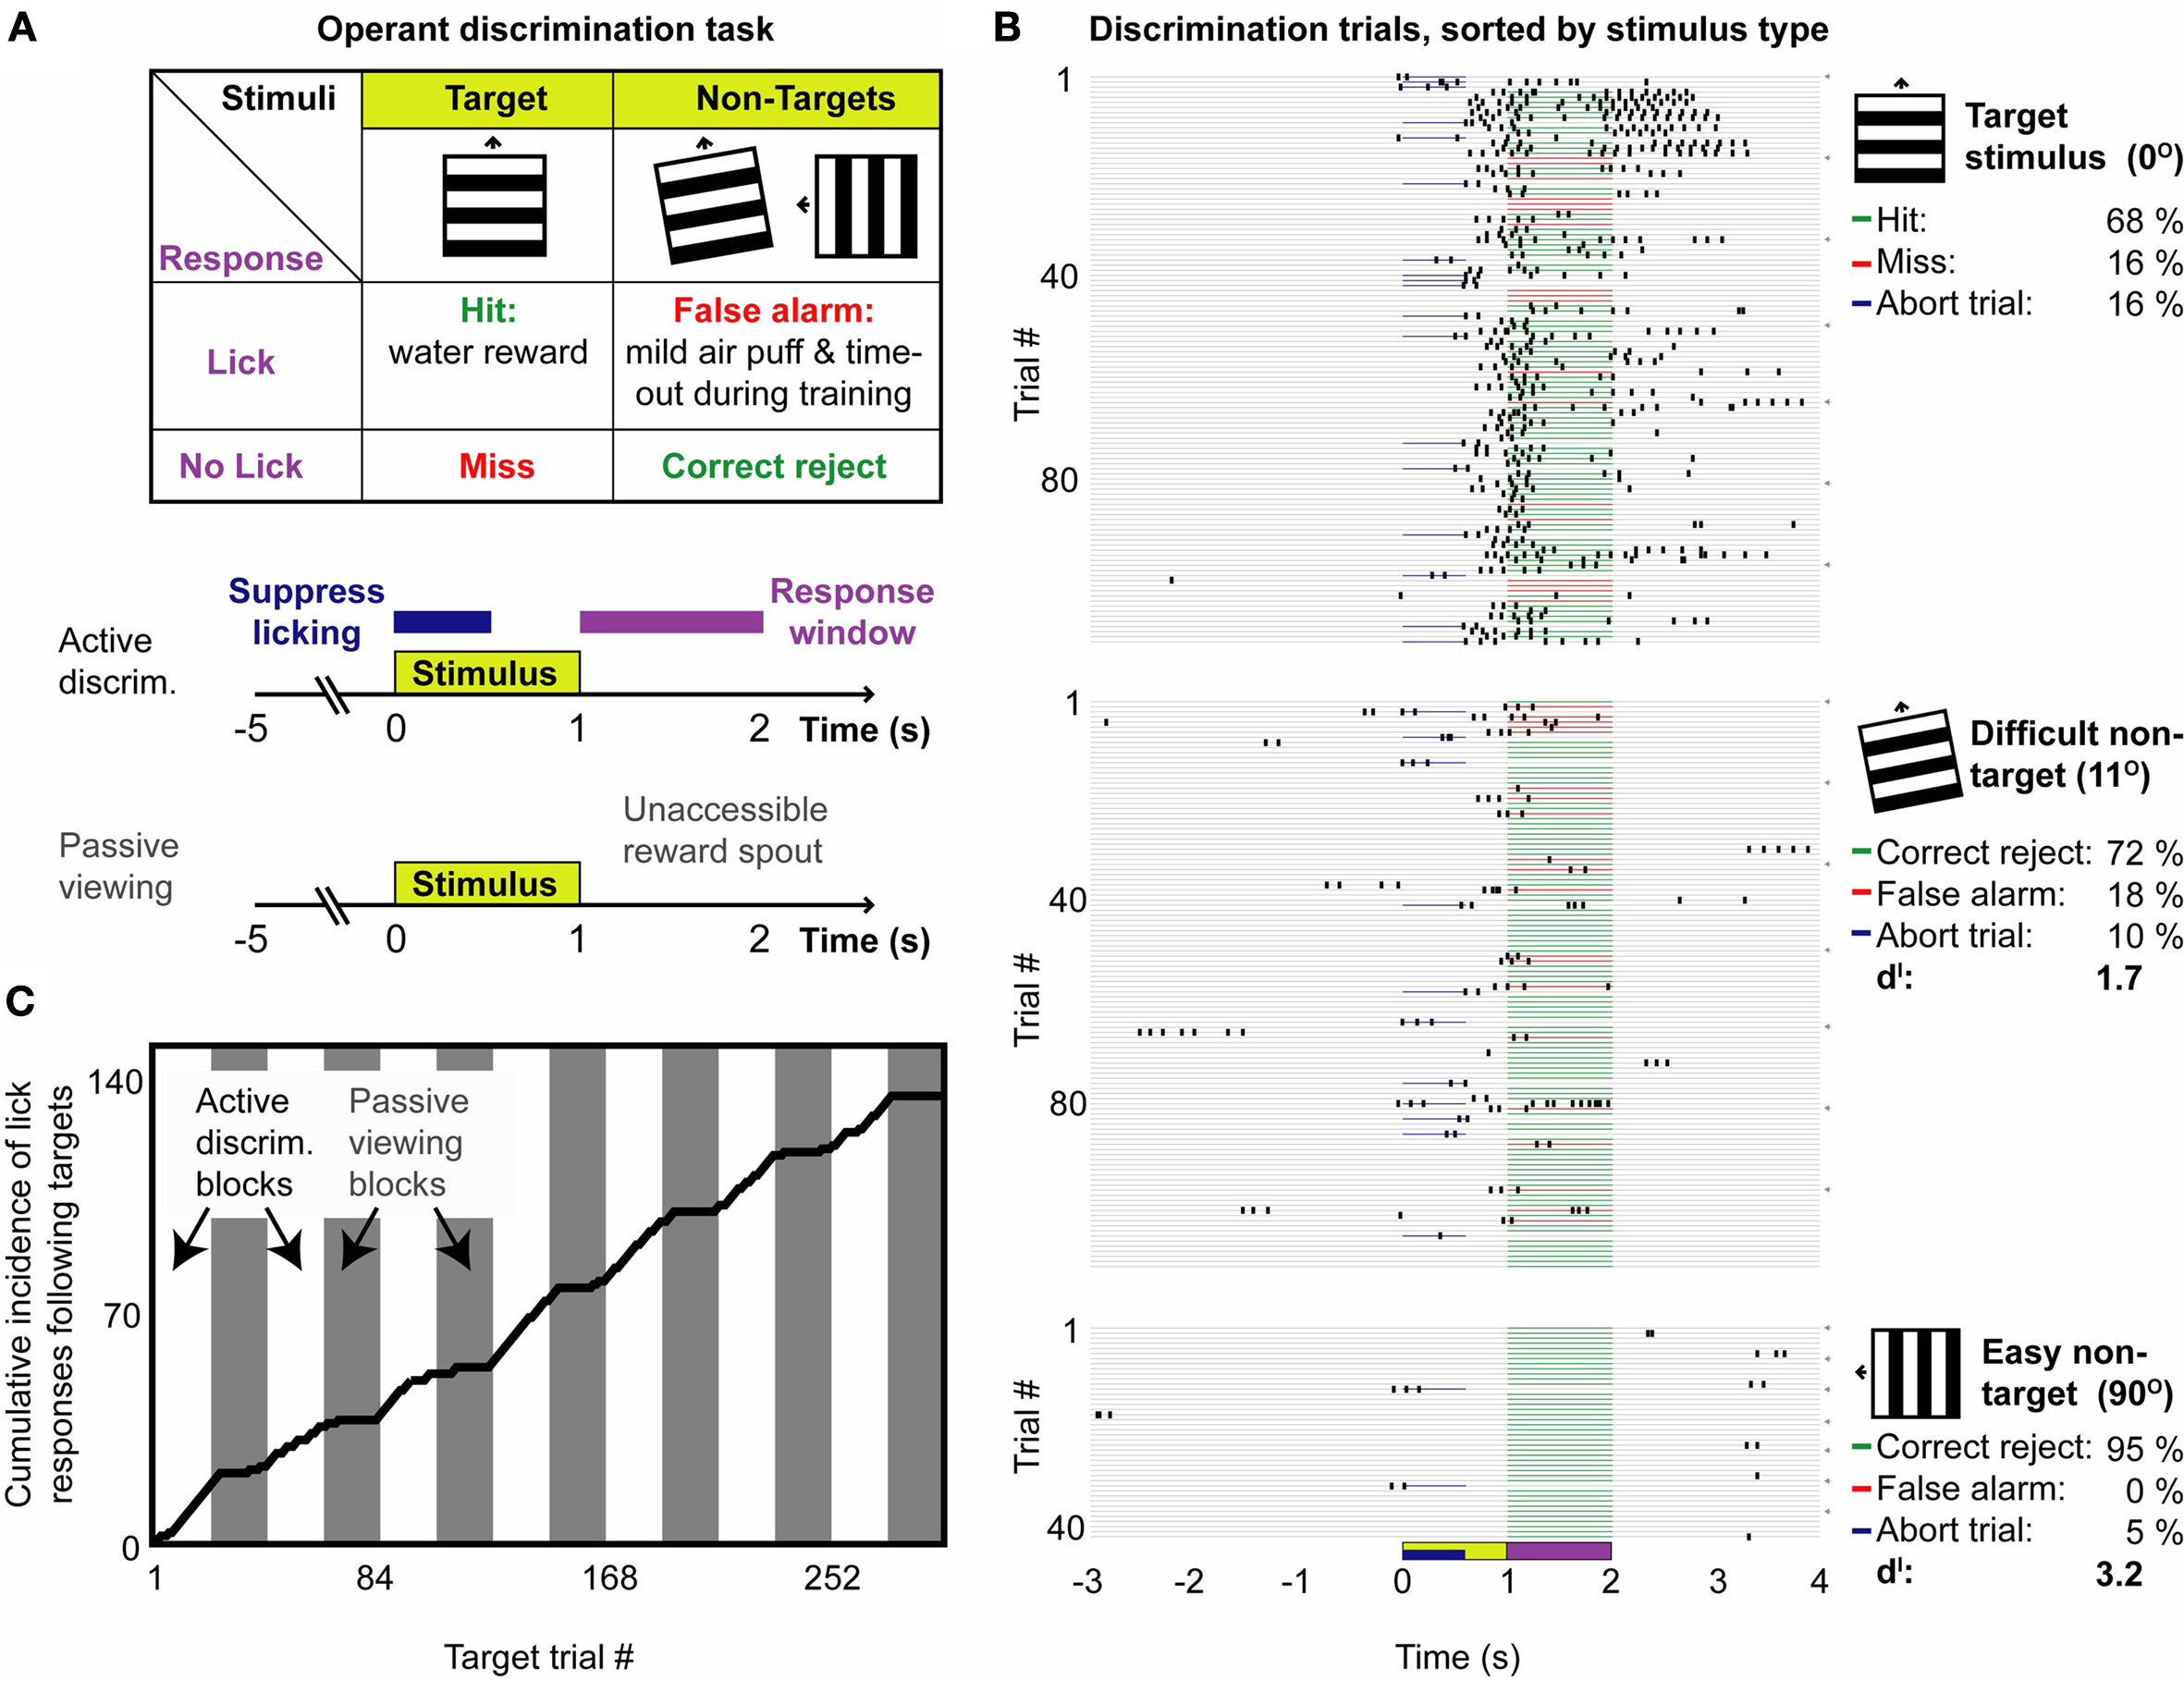
Figure 3. GO–NOGO operant visual orientation discrimination task: Basic paradigm and variants. (A) Upper panel: Mice were rewarded with water for licking following upward drifting oriented gratings, and received negative reinforcement for licking to other non-target orientations, including a 500 ms white noise burst, and, early in training, a 2 s time-out and a mild airpuff stimulus. Lower panel: Following the end of the 1 s stimulus (yellow box), mice had 1 s to lick to indicate a response (purple line). Stimuli were presented 7–8 s apart, which encouraged cessation of licking following the end of the previous trial. Mice could also be partially deterred from spurious licking by aborting trials with lick responses immediately following stimulus onset (blue line). Blocks in which the mouse performed this basic discrimination paradigm could be inter-digitated with passive viewing blocks in which the lickspout was removed. (B) Example behavioral session containing active discrimination and passive viewing trials. Behavioral responses are shown for active discrimination trials only, sorted by stimulus type. These data demonstrate correct decisions (green lines) in the majority of trials – Lick responses to target stimuli (top), and suppression of responses following difficult non-targets (middle; 11°) and easy non-targets (bottom; 90°). The average performance and discriminability (d′) is shown at the right. Note that minimal licking occurred prior to stimulus onset or during the enforced lick-suppression window (blue lines: aborted trials). Behavior did not extinguish following passive viewing blocks (gray arrows at right indicate onset of each active discrimination block, not including five initial target trials). (C) Same session, cumulative incidence of target trials containing lick responses. Mice quickly learned to cease licking following target stimuli when the lick-spout was removed during passive viewing blocks (gray bars).
For initial training sessions, we presented only target stimuli (at 0.5 Hz), and delivered a drop of water automatically following each presentation. The inter-stimulus interval was then gradually extended by several seconds across sessions, while maintaining high response rates (>80%). At this point, we switched to an operant discrimination task, by (1) making reward presentation contingent on a lick response, and (2) by presenting non-target stimuli as well as target stimuli. For several sessions early in training, a mild airpuff stimulus and an additional time-out period (~2 s) were also used to discourage responses to non-target stimuli. Early lick responses following stimulus presentation, which could diminish accuracy and hasten lick-related brain motion (see below) and eye motion (Figure S2 in Supplementary Material), were discouraged during training by aborting trials in which licking occurred in the first several hundred milliseconds (Figures 3
A,B). We maintained 7–8 s between trials to allow for previous lick responses to abate (and to permit previous evoked calcium signals to fully decay back to baseline). While we did not penalize licking prior to stimulus onset, most mice typically did not lick for several seconds prior to stimulus onset (e.g., Figure 3
B; but see Figure 6
A for an example of more sustained licking between trials).
Task acquisition and long-term stability
About half of the mice tested (13/25) learned to perform the visual discrimination task, but with variable learning rates. Training proceeded as follows: First, mice were rewarded for licking in response to drifting target stimuli, using an inter-stimulus interval that was gradually increased from 2 to 5–8 s. Subsequent training involved gradually increasing the similarity of target and non-target stimuli in 5–15 sessions by presenting non-target stimuli that were (1) orthogonal to target and stationary, (2) orthogonal and of increasingly similar speed to target, (3) of increasingly similar orientation to target gratings and of identical speed.
The latter part of this learning curve is shown for four mice, in sessions employing easy non-targets that were orthogonal to target stimuli and of equal speed, followed by sessions in which non-targets were presented at five increasingly difficult orientations (solid lines). We calculated discriminability of target from non-target stimuli using the ‘d-prime’ measure (d′, see Section ‘Materials and Methods’). Supposing a fractional response rate to target stimuli of 0.8, d′ values 0, 1, 2, and 3 correspond to non-target response rates of 0.8 (chance performance), 0.4, 0.12 and 0.015, respectively. In all mice, d′ values improved over days using easy (orthogonal) non-target stimuli (Figure 4
A, dashed lines). Discrimination rates in sessions involving more difficult non- targets (including 45° non-targets) began at an intermediate baseline performance and improved, suggesting partial transference of initial learning (Figure 4
A, solid lines). Complete psychometric curves across daily sessions are shown for one mouse (Figure 4
B). Orientation discrimination thresholds (at the level of d′ = 1) calculated for each day (see Section ‘Materials and Methods’) demonstrated steady improvement (Figure 4
C). Within ten sessions, mice were able to discriminate orientations as little as 10–20° apart, consistent with previous observations in freely moving mice (Reuter, 1987
). Absolute orientation thresholds likely depend on incidence of presentation of each stimulus (Figure 4
B, legend), and task structure (e.g., GO–NOGO vs. 2-AFC).
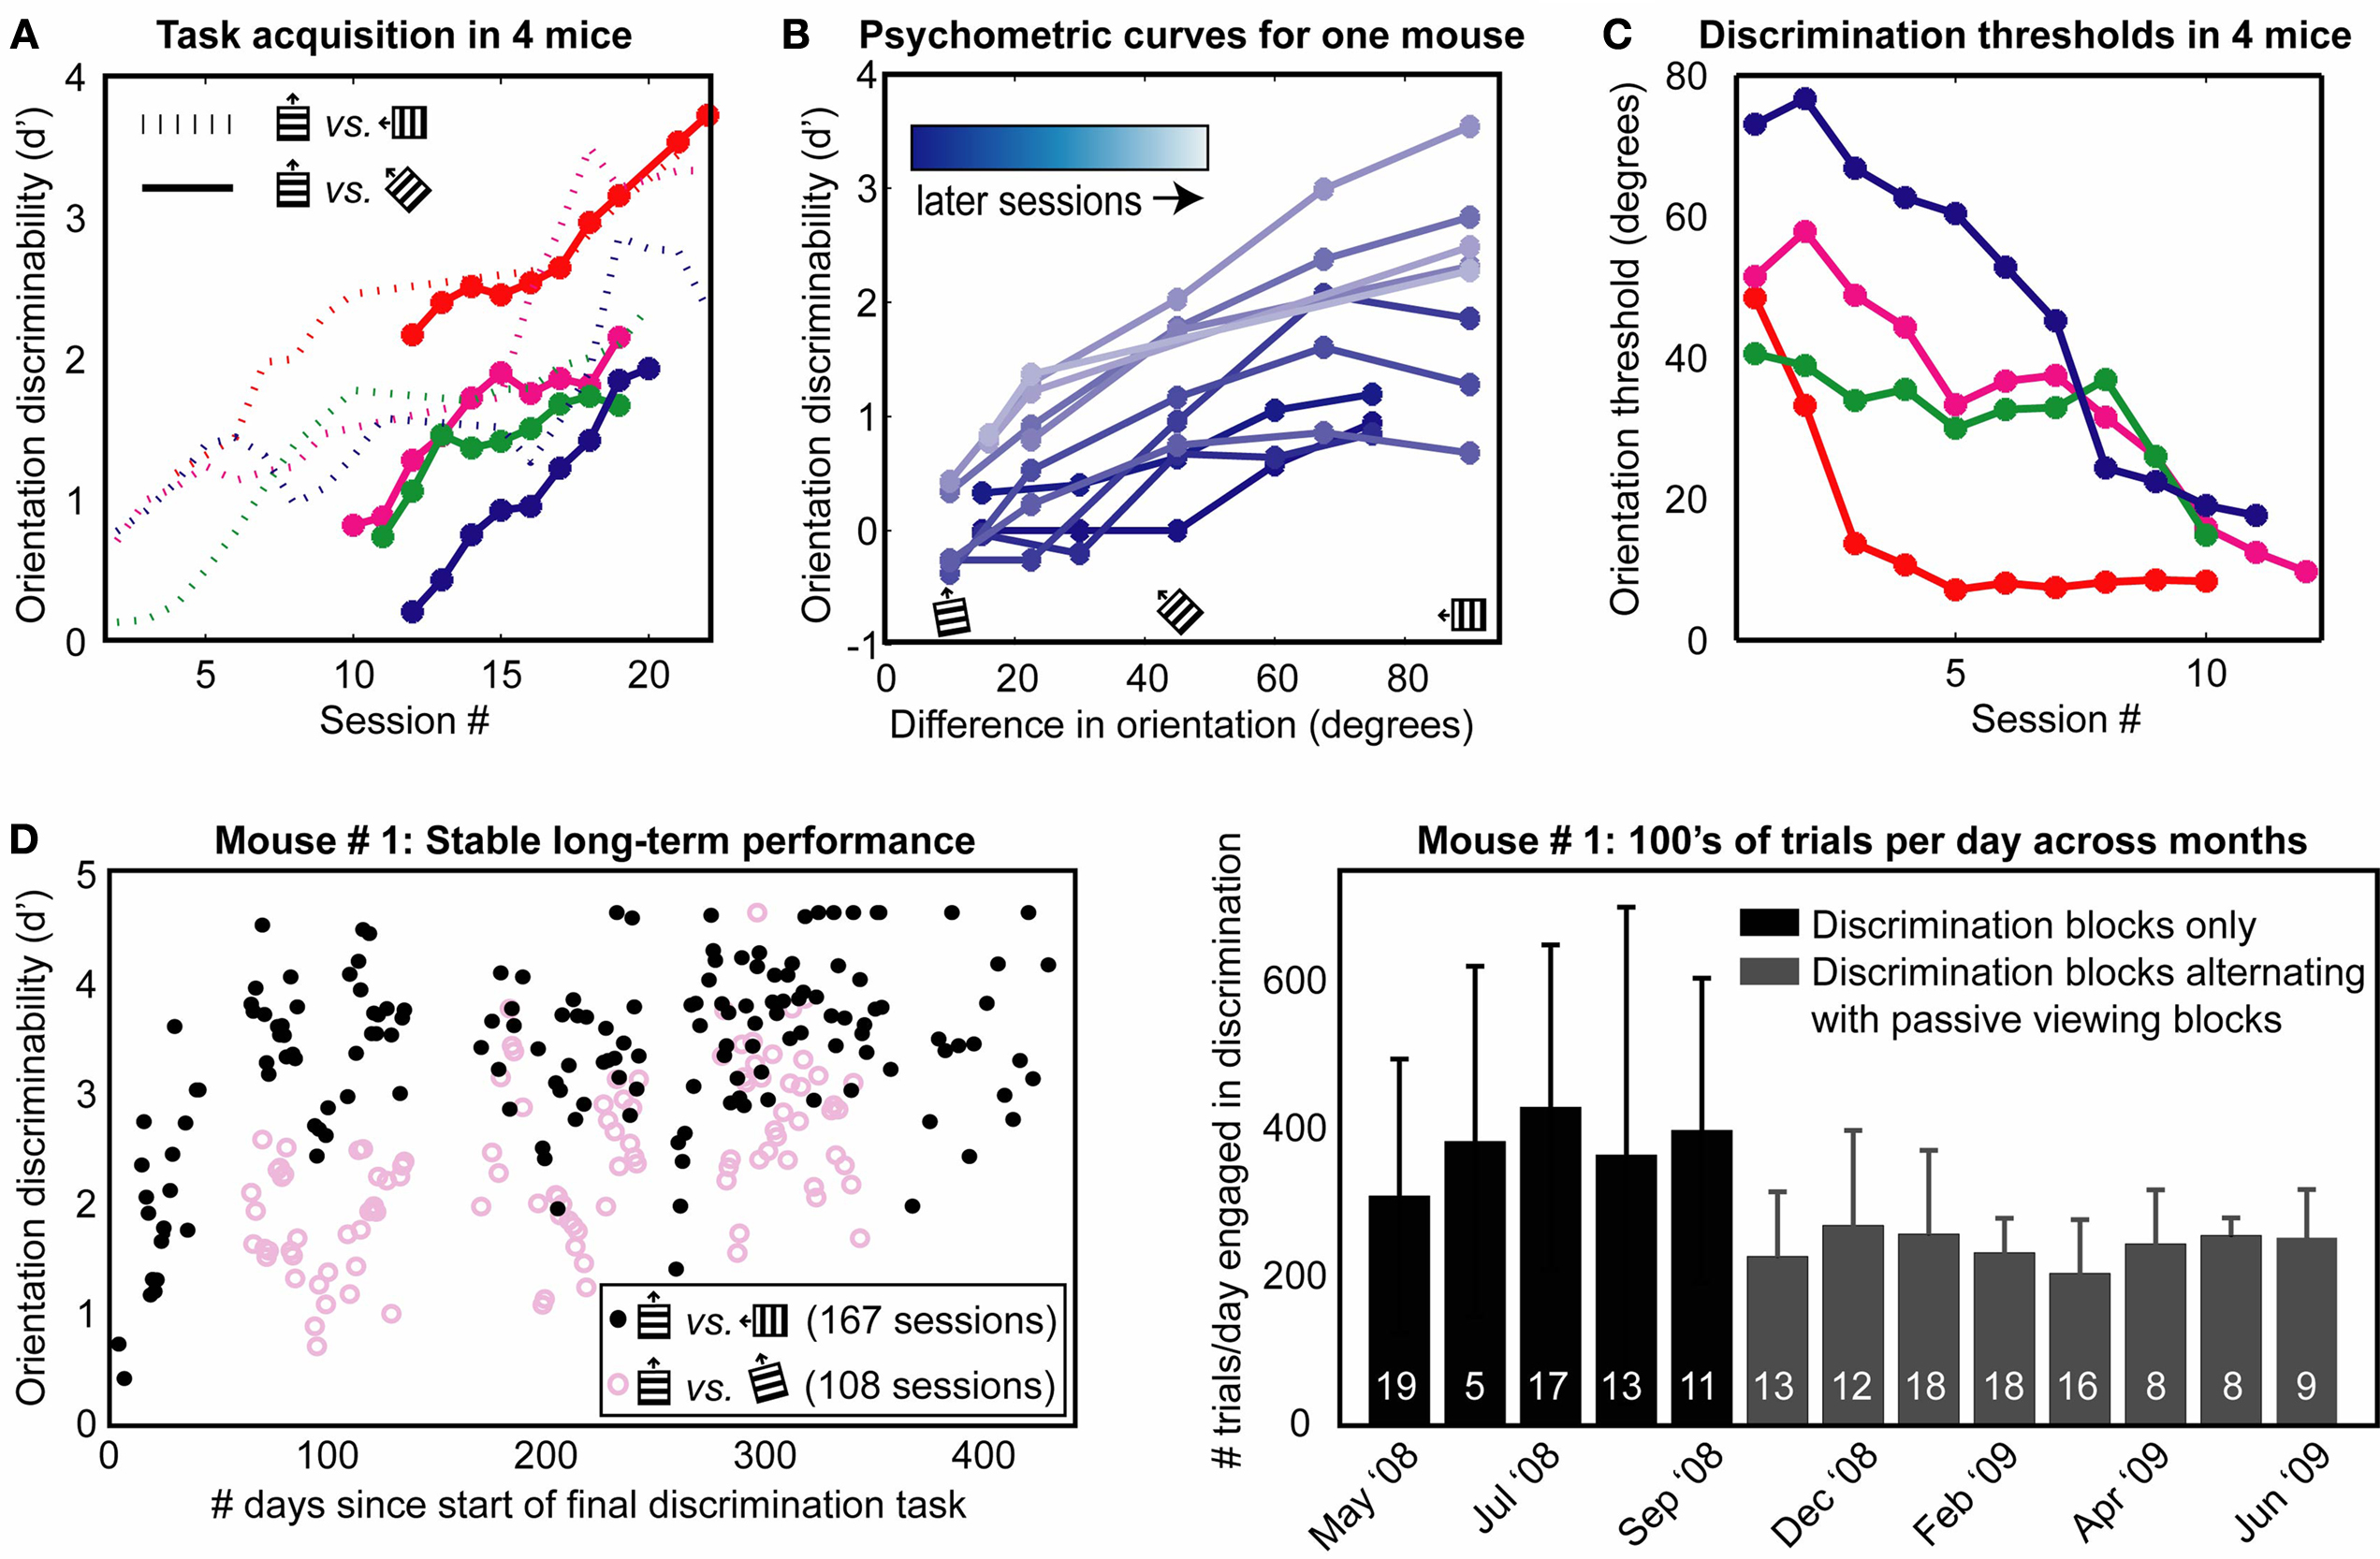
Figure 4. Task acquisition and long-term stability. (A) Discriminability (d′) of target from non-target stimuli improved over days, as shown in four mice (four different colors). Dashed lines: d′ for non-targets oriented 90° from the target. In subsequent sessions, more difficult non-target stimuli including 45° discrimination (solid lines) were used. (B) Example of psychometric curves across days for one mouse. Increased angular distance of non-targets from target resulted in better discrimination performance, as expected. Later training days (lighter curves) showed general improvement in performance. Frequency of stimulus presentation: (target, difficult non-target,…, easiest non-target) = (35, 7, 7, 31, 14, 6%). (C) Using these daily psychometric curves, orientations thresholds were estimated, for this mouse (blue line) and three other mice, as the angular discrimination achievable at a performance level of d′ = 1. Traces in (A,C) were smoothed with a 3-day boxcar filter for presentation. (D) Example of long-term stability in a mouse presented with three stimuli: Target (40% of stimuli), difficult non-target (~15° from target; 45% of stimuli) and easy non-target (90°; 15% of stimuli). This mouse demonstrated stable performance in 167 sessions spanning over one year (left panel) and was engaged in the discrimination behavior for several hundred trials a day (right panel, number of trials per day, mean ± SD). Later sessions (gray bars) involved alternating discrimination blocks and passive viewing blocks (the latter blocks, while not included in ordinate estimates, provided a useful control during subsequent imaging). For summary statistics of stability and performance across nine mice, see Table 1
. These data suggest that the current behavioral method can be used in studies imaging the same neurons across days and months, during task learning or disease progression/therapeutic intervention.
In a separate group of nine mice, we found that mice could perform the discrimination task routinely for several months to over a year, and typically performed on the order of 300 trials/day (Figure 4
B, Table 1 and Section ‘Materials and Methods’; over 1000 trials or 2 h in some sessions). Consistently high levels of discrimination performance were observed for orthogonal as well as for more difficult non-target stimuli (Figure 4
D and Table 1
). During this time, mice were also gradually habituated to the imaging environment, including the sounds and motions produced during typical microscope operation. These data suggest that head-fixed visual discrimination learning and steady-state performance can be reliably measured across many sessions – a key factor enabling chronic calcium imaging studies of neural correlates of perception and perceptual learning in the same neurons (see below), in both wild-type mice and in mouse models of disease and aging.
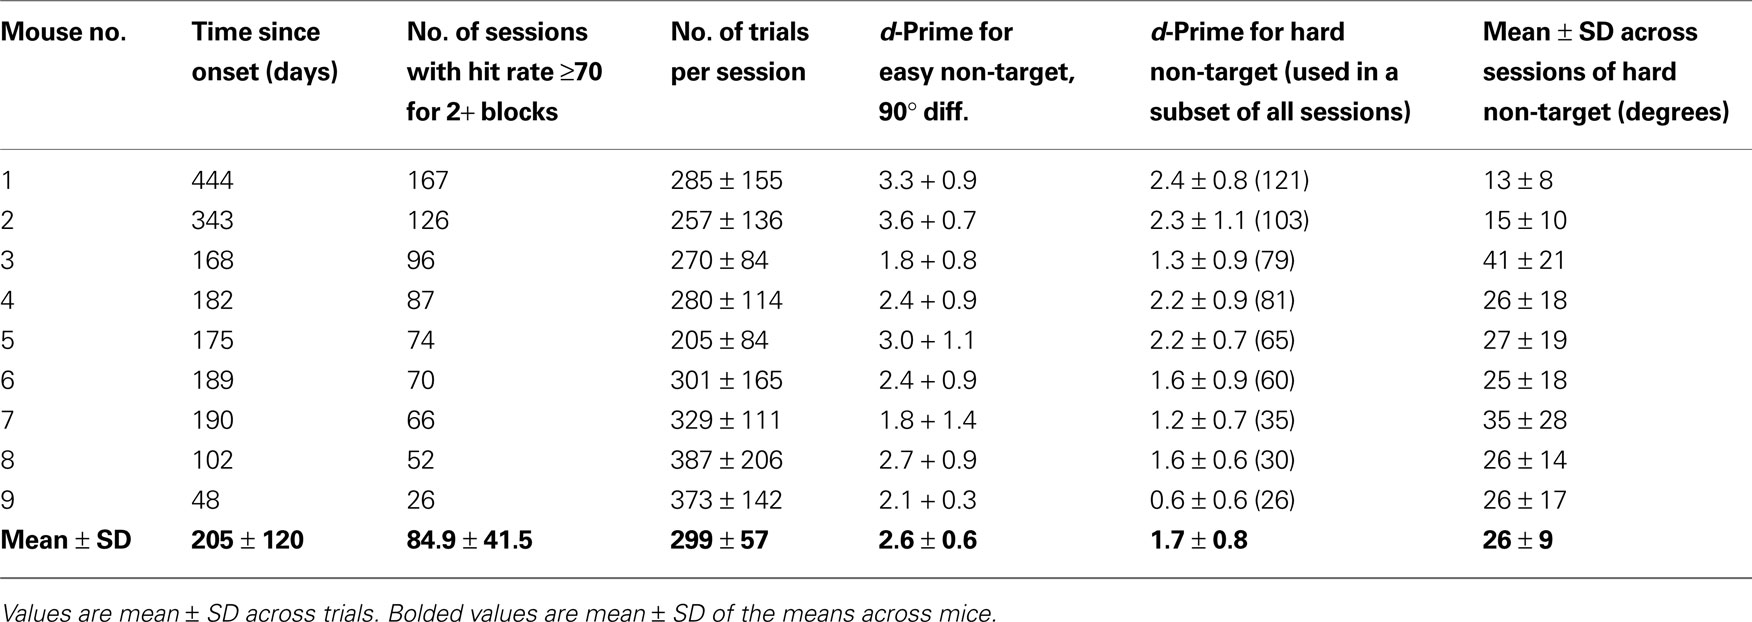
Table 1. Mice discriminate well for many trials per session, and for many sessions.
Variation of behavioral context
The above task can be readily modified to study context-dependent modulation of responses by varying task difficulty (proportional of ‘difficult’ vs. ‘easy’ non-target trials), or task engagement (presence/absence of reward). We varied task engagement using interleaved blocks of 43 trials in which mice either actively discriminated target and non-target stimuli, or passively viewed these same stimuli (Figure 3
A). During passive viewing, a solenoid removed the lickspout from reach (Figure 1
B), and mice quickly learned to stop licking in response to target stimuli until the following ‘engaged’ block began, suggesting that the learned stimulus association is not purely reflexive (Figure 3
C). Presentation of stimuli during passive viewing, or of novel stimuli during orientation mapping, did not lead to extinction of subsequent discrimination behavior (e.g., Figures 3
B,C and 4
D), allowing for comparison of neural responses obtained during behavior with receptive field mapping obtained during passive viewing.
Chronic Cellular Imaging of Visual Responses during Behavior
Three-dimensional motion correction
A major obstacle in our early efforts developing two- dimensional calcium imaging during behavior involved systematic, lick response-induced brain motion artifacts. To overcome this problem, we modified previous techniques (Göbel et al., 2007
) to achieve rapid, trapezoidal vertical movement of the microscope objective (Figure 1
B, Section ‘Materials and Methods’), generating complete local volumes at sufficiently fast rates to correct for rapid brain motion (and slow drift) in three dimensions. We found an acceptable trade-off between volume acquisition rate and volume size (and hence number of recorded neurons) by collecting a volume of 14 planes (3.5 µm spacing between planes) at 4 Hz, typically resulting in volumes up to 60 × 60 × 48 µm3 (containing ~20 neurons; Figure 5
A). Pre-processing of acquired volumes involved correcting each volume for rigid translation in 3D. Subsequently, each plane (acquired at 64 Hz) could be individually translated in 3D, allowing correction for motions occurring faster than 4 Hz (see Section ‘Materials and Methods’).
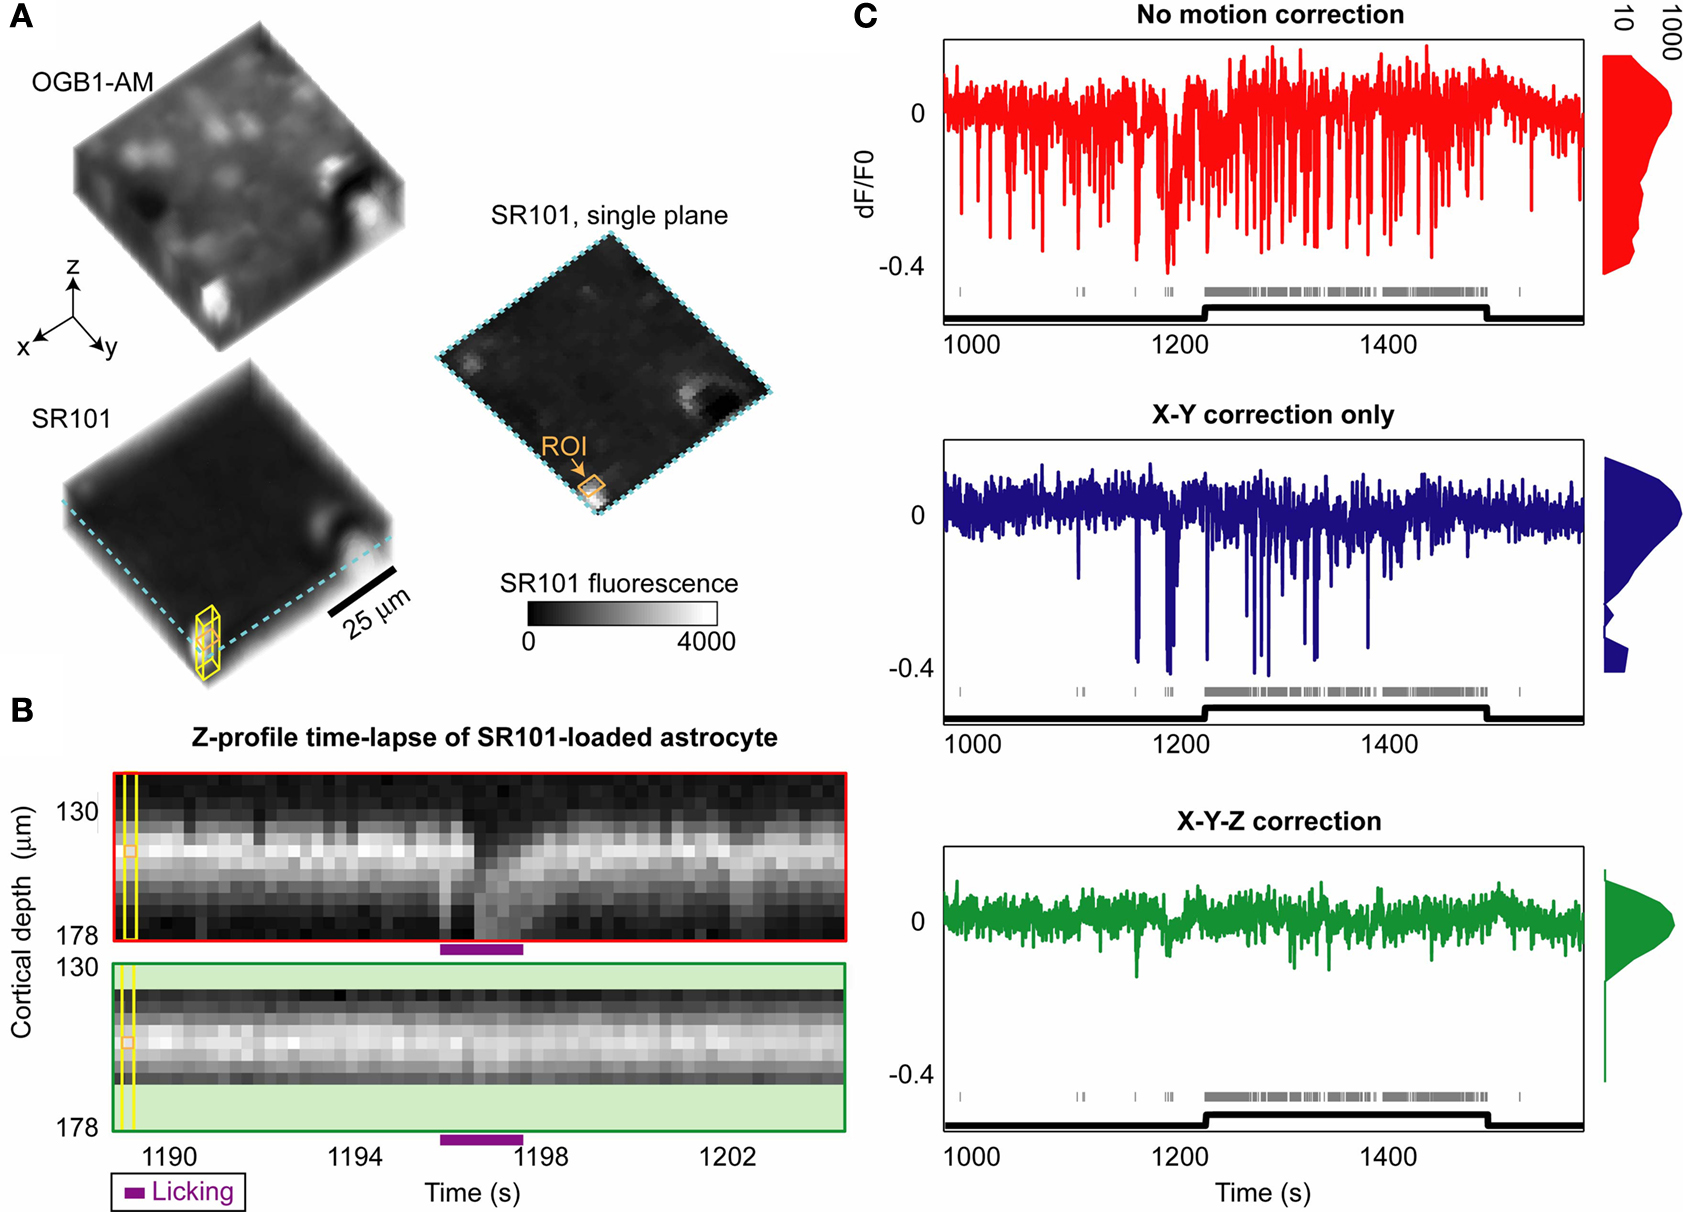
Figure 5. Three-dimensional imaging during behavior improves recording stability. (A) Average imaging volume corresponding to OGB calcium indicator (top left, green fluorescence) and static astrocytic label SR101 (bottom left, red fluorescence). Individual OGB volumes acquired at 4 Hz were co-registered in 3D, and estimated shifts were then applied to SR101 data. (B) SR101 data from a small square region at each imaging depth (yellow rectangular solid in A) surrounding an astrocyte was collapsed (in X–Y plane) for each 250 ms volume, revealing an apparent ‘sinking’ of the astrocyte to deeper planes during lick/jaw motion (top panel). Following post-processing and 3D rigid and subsequent plane-by-plane co-registration, the cell motion was greatly reduced (bottom panel; only a subset of planes were used after motion correction). (C) For typical studies imaging from one plane, SR101 fluorescence from the edge of this astrocyte should be stable over time, but instead shows severe motion artifacts (top panel). Gray ticks indicate licking, which mostly occurred during engaged blocks but not during passive viewing (black line). Using standard 2D rigid co-registration techniques (middle panel), some artifacts are reduced. However, 3D co-registration was necessary for near-complete elimination of artifacts (bottom panel), particularly those concurrent with onset of lick responses. Histograms on right indicate a narrower bandwidth of dF/F values using 3D correction, likely due to improved robustness to licking and other motion artifacts (e.g., breathing, heart rate).
The improvements in recording stability during behavior gained by incorporating three-dimensional imaging are illustrated in Figure 5
. A local volume was loaded with a green synthetic calcium indicator (OGB1-AM), and astrocytes were co-loaded with sulforhodamine (SR101; Nimmerjahn et al., 2004
), a red, calcium-insensitive fluorescent dye that generates a constant average fluorescence level in the absence of brain motion (Figure 5
A). Figure 5
B (top panel) shows a time-lapse image of average SR101 signal from a loaded astrocyte at multiple depths (Figure 5
A, yellow cube). This cell demonstrated up to 15 µm of ‘sinking’ Z-displacement as the mouse adjusted his posture, opened his jaw and began to lick – a displacement that is well-corrected by 3D co-registration methods (Figure 5
B, bottom; see also Figure S2B in Supplementary Material). By monitoring fluorescence in a single plane (Figure 5
A, orange square), one can observe artifactual effects of brain motion on SR101 signal that would occur using 2D imaging (Figure 5
C, top). Brain motion artifacts not related to licking were mostly corrected using standard 2D motion correction techniques, (Figure 5
C, middle), consistent with previous studies (Dombeck et al., 2007
; Greenberg and Kerr, 2009
). However, adequate correction of lick-related motion artifacts required 3D motion correction (Figure 5
C, bottom). Further, 3D motion correction also reduced motion contamination not related to licking (Figure 5
C, histograms), likely caused by body motion, chewing, breathing, and the heart beat (as indicated by the temporal pattern of shift-corrections estimated at 64 Hz, data not shown).
Imaging during visual behavior using synthetic dyes
Stable neural responses demonstrating high signal-to-noise ratio were achieved during visual behavior, following loading of synthetic calcium indicator OGB1-AM. Figure 6
A shows the time courses for 3 of 20 simultaneously recorded neurons. The same quality visual responses were obtained during licking (engaged condition) as during quiet, passive viewing. While these data clearly illustrate the strength of our 3D imaging techniques for obtaining clean neural traces during active discrimination (including during lick responses), the behavioral performance demonstrated in Figures 6
A and 7
A was below the level achieved during training (Table 1
), due to an increase in spurious licking compared to other mice (see Figure 3
B), and even compared to other imaging sessions from the same mouse (e.g., Figure S2 in Supplementary Material).
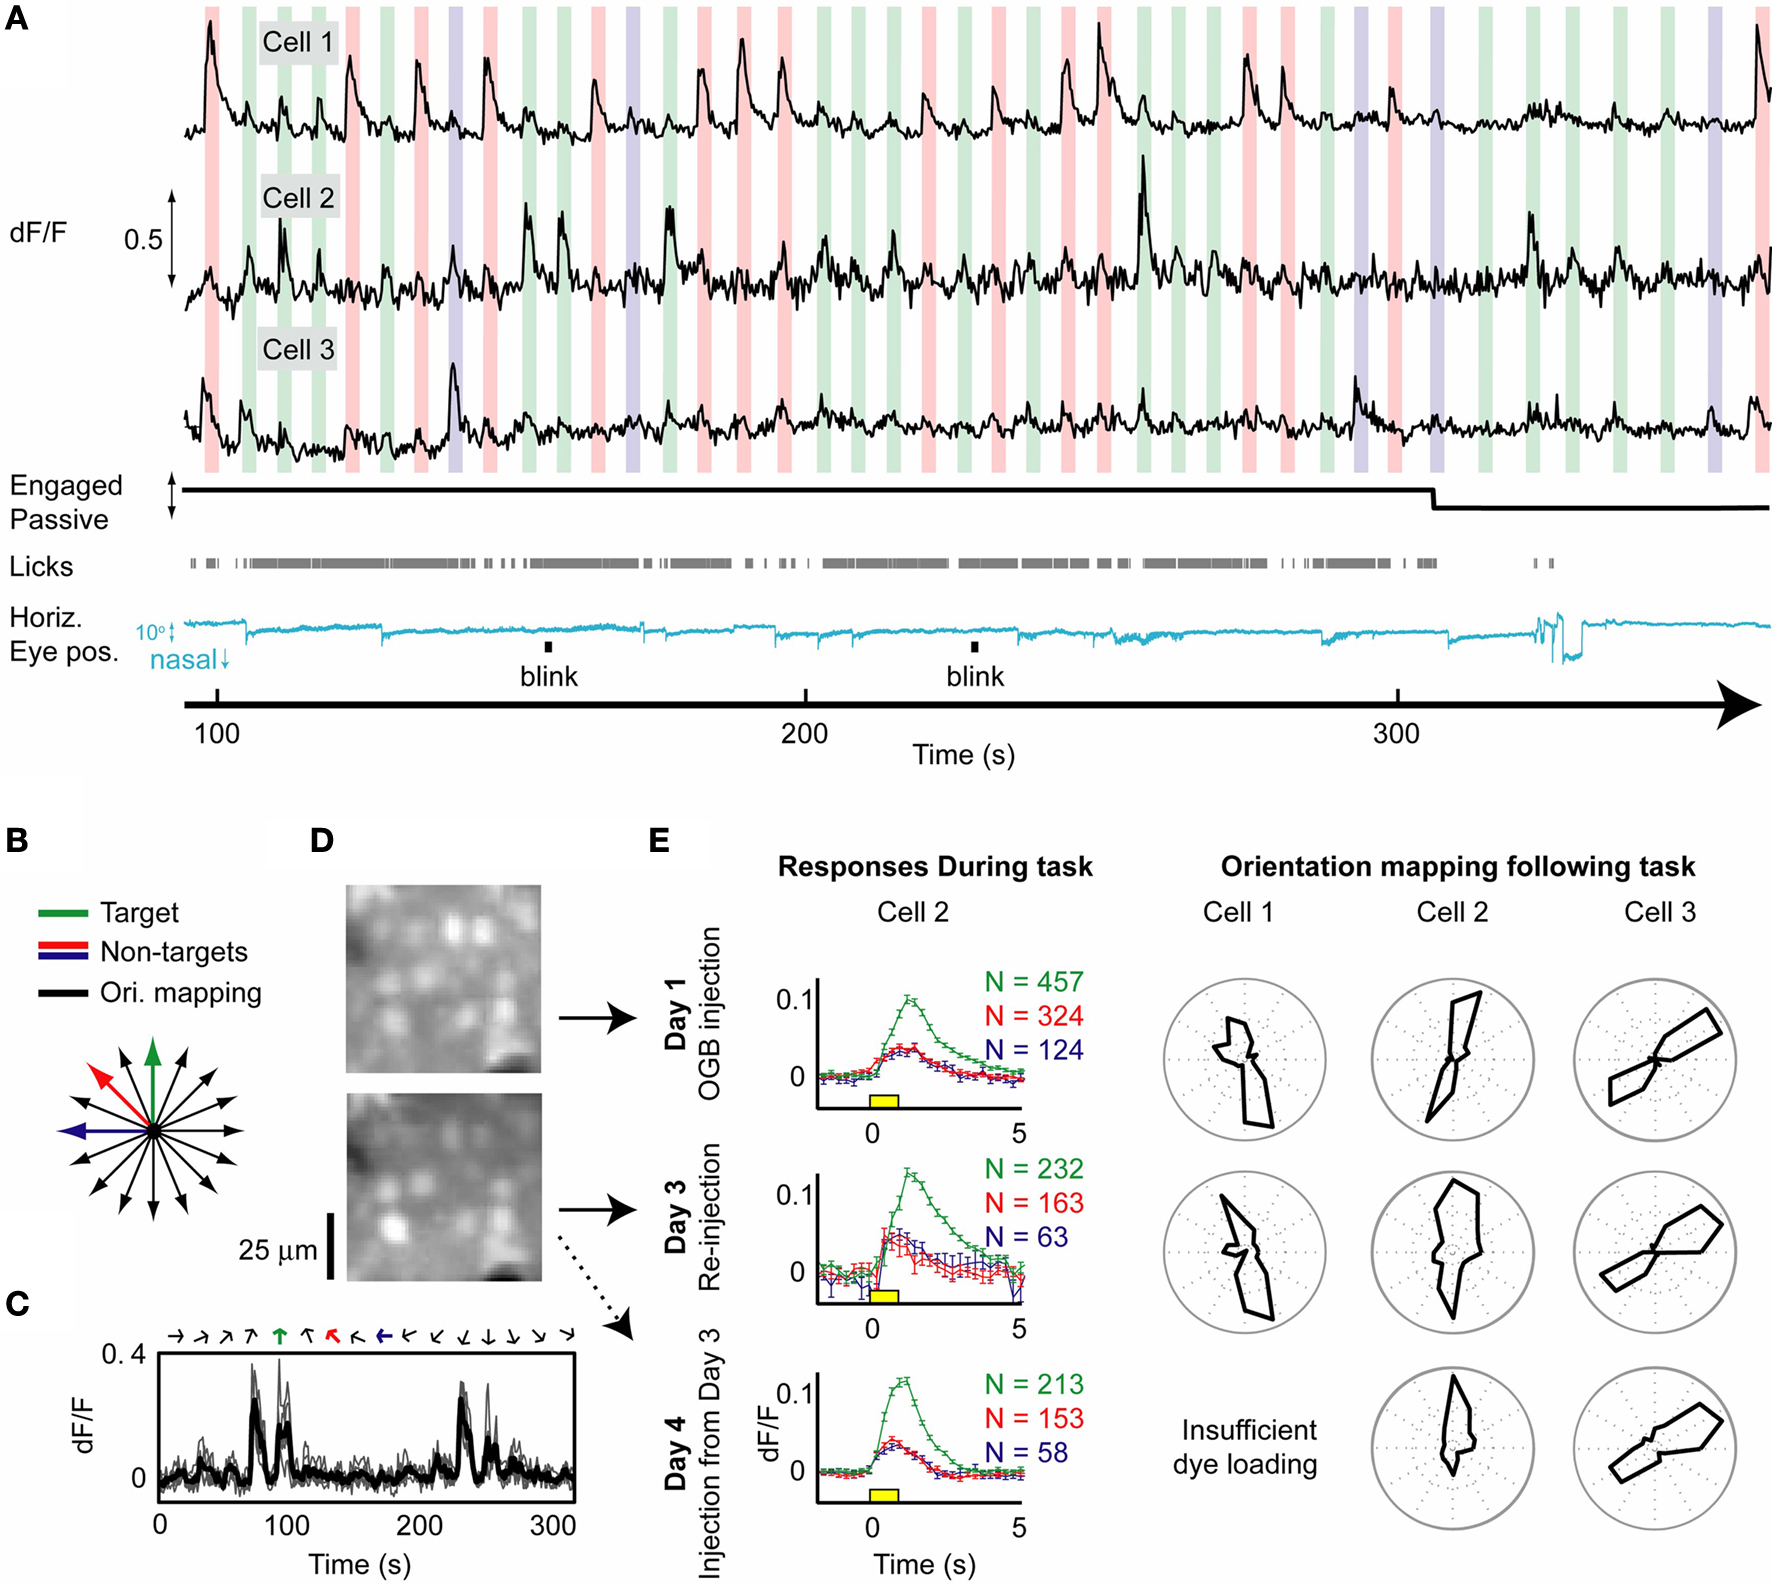
Figure 6. Simultaneous calcium responses from multiple cortical neurons during visual behavior. (A) Responses from 3 out of 20 neurons recorded simultaneously using OGB1-AM indicator during a 2-h behavior session (black traces; 130–178 µm deep; 13–16 mW excitation at 800 nm). Colored vertical bars indicate presentation of target (green) and non-target (red, blue) stimuli (1 s stimuli; bar widths are 3 s wide to emphasize stimulus selectivity of different neurons). Black line indicates task engagement/passive viewing, gray ticks indicate licking, and blue trace indicates online estimate of angular pupil displacement (downsampled to 50 Hz) after correction for translational motion (using corneal reflections). Small nasally directed eye rotations occurred concurrent with reward presentation. Visual responses were not strongly affected by licking or small changes in eye position. (B) Following cessation of behavioral trials (>900), mapping of orientation tuning in these same cells was performed in 16 orientations, including the three orientations used during behavior (colored lines). (C) Orientation responses in cell 2 for 16 consecutive orientations showed high signal-to-noise ratio in single trials (gray traces) and on average (black trace). (D) Neurons in and surrounding the imaged volume (upper panel) expelled the dye over ~12–36 h (not shown), but were reloaded and imaged 2 days later (lower panel). (E) Average responses (mean ± SE) during behavior (cell 2, left panels) were robust across large numbers of trials and across both these imaging sessions, as well as in a third session (Day 4) imaging calcium dye loaded a day earlier. Yellow box: stimulus presentation. Polar plots of orientation tuning mapped following behavioral sessions (normalized to peak response) were also stable across multiple days (right panels; different rows indicate different days).
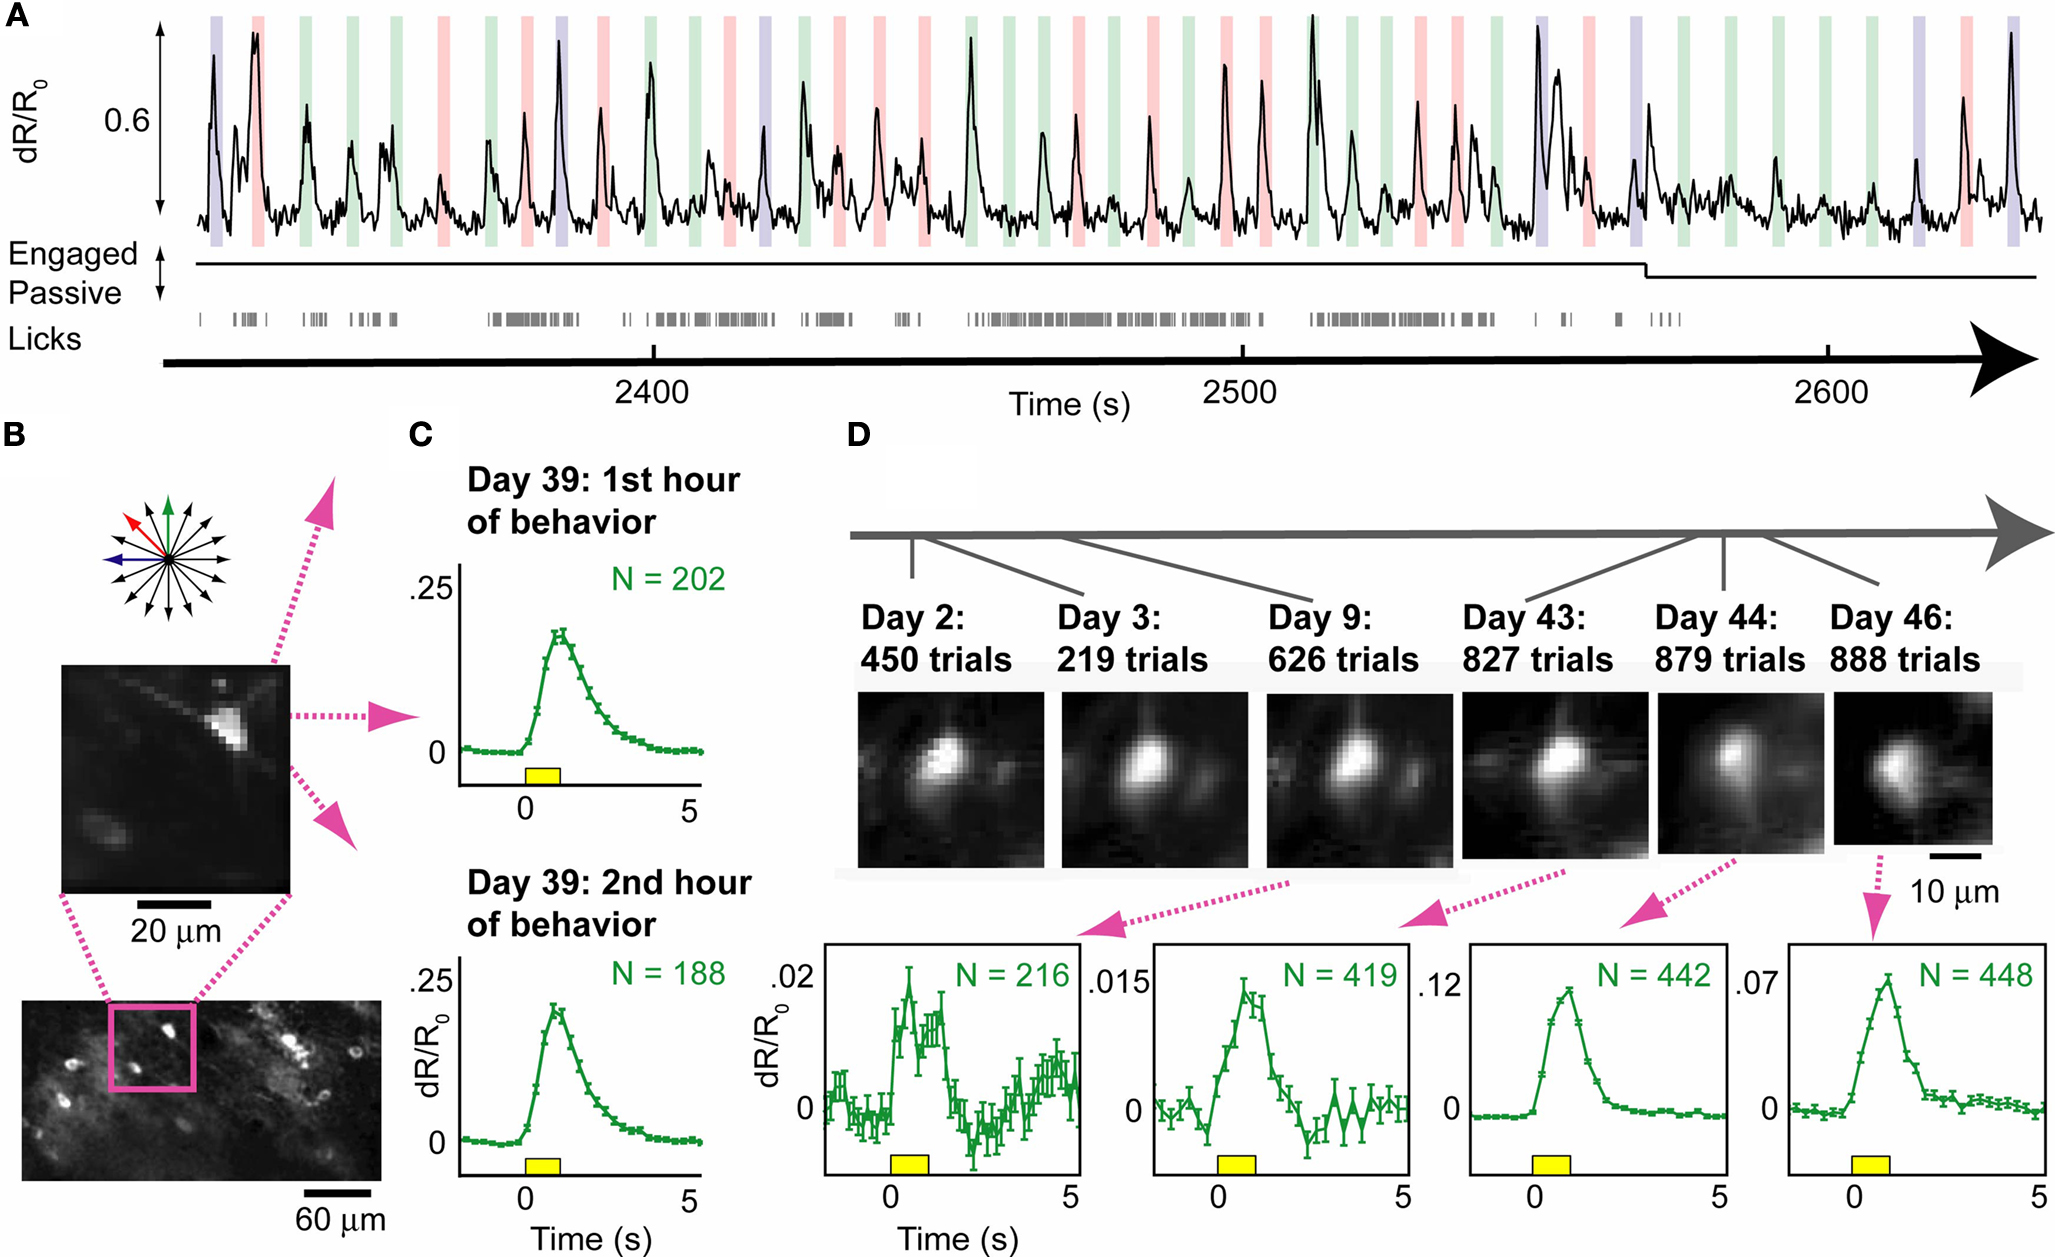
Figure 7. Stable recordings during visual behavior using a genetically encoded calcium indicator. (A) Strong calcium responses (black trace) during visual behavior recorded from a cell with virally induced expression of the ratiometric calcium indicator, YC3.6 (132–180 µm deep; 15 mW excitation at 830 nm). The trace was computed as the ratio of YFP to CFP fluorescence (using 4 Hz volume acquisition). All lines and colors are as in Figure 6
A. (B) Top: Color coded stimulus directions used. Middle one plane in the volume collected during imaging in (A). Bottom: Lower magnification image illustrates sparsity of expression. (C) Average responses (mean ± SE) to target stimuli presented during first and second hour of behavior. Response strength did not decline over two consecutive hours of imaging. (D) Another neuron in the same mouse demonstrated visual responses during behavioral sessions that were spaced over a month apart. Top: Timeline and images of the same neuron and its processes across behavioral sessions (and number of behavioral trials per session). Bottom: Responses to target stimuli during a large number of behavioral trials in four different imaging sessions.
Following 2 h of behavioral responses (905 trials), we could still perform detailed mapping of orientation preference for an additional hour during passive viewing (Figures 6
B,C,E). Responses to presentation of drifting grating stimuli (9.5 s duration) were consistent across presentations (Figure 6
C). The relative response strength of neurons to different stimulus orientations during behavior (Figures 6
A and 6
E, top left) was consistent with orientation tuning curves obtained during passive viewing (Figure 6
E, top right).
Two days following this initial recording of neural responses during behavior, we reloaded the same volume of neurons with synthetic calcium indicator OGB1-AM (Figure 6
D), and were again able to obtain stable responses during behavior and during subsequent orientation mapping (Figure 6
E, middle row). The day after this second injection, OGB1-AM expression was dimmer (dye persists in neurons for 8–30 h following injection), but again yielded responses during behavior and consistent orientation tuning from a subset of neurons (Figure 6
E, bottom row).
Imaging during visual behavior using genetically encoded calcium indicators
Although we found that robust imaging of neurons during one or several behavioral sessions is possible using synthetic calcium dyes, GECIs have recently demonstrated increased brightness and signal-to-noise that may soon rival synthetic indicators (Tamamaki et al., 2003
; Mank et al., 2008
; Wallace et al., 2008
; Tian et al., 2009
). GECIs have several clear advantages for use in behavioral studies (see Section ‘Discussion’). To illustrate the use of GECIs to record calcium responses during behavior, we used a viral vector to produce sparse expression of the ratiometric calcium indicator yellow cameleon (pAAV-CBA-YC3.6-WPRE, Nagai et al., 2004
; Kuchibhotla et al., 2008
; Figure 7
B) in layer II/III of primary visual cortex of a wild-type mouse via burr-hole injection (see Section ‘Materials and Methods’). We subsequently performed a craniotomy and cemented a sealed cranial window in place. After several months of training and stable behavior (Table 1
, Mouse 7, which was subsequently used for OGB imaging, Figure 6
), we performed 3D neural recordings during behavior. Increased calcium levels during visual stimulation lead to increased levels of YFP fluorescence, and decreased CFP fluorescence (Figure S3 in Supplementary Material). Figure 7
A illustrates ratiometric responses, which had high signal-to-noise even when the animal was licking. In general, measuring neural activity using the ratio of YFP/CFP fluorescence provided increased robustness to motion artifacts (Figure S1 in Supplementary Material; cf. Mank et al., 2008
) as compared with non-ratiometric indicators, even without 3D co-registration.
Average responses from this neuron did not attenuate across two consecutive hours of imaging in one behavioral session (Figure 7
C, 764 total trials across three orientations), and similar responses were also observed in a previous session in the same cell (not shown). An additional day of recording from this neuron during passive viewing demonstrated that the neuron was tuned for orientation (see Movie S1 in Supplementary Material). In total, we imaged YC-3.6-labeled neurons in over ten behavioral sessions in this mouse, including one neuron imaged in six different sessions spanning forty-six days (Figure 7
D). The same neurons could be found within minutes of the start of each session, using epifluorescence imaging (Figure 1
B), vascular and dural landmarks, and wide-field two-photon images at the appropriate depth (not shown). These results demonstrate the feasibility of combining well-controlled visual behavior with repeated, simultaneous calcium imaging of the same neurons across days and months.
We have described a method for achieving robust, chronic two-photon calcium responses from layer II/III cortical neurons in head-fixed mice performing a visual discrimination task. This technique offers many new opportunities for using molecular and genetic techniques to map and manipulate identified classes of neurons during well-controlled operant behavior. Below, we consider the benefits, shortcomings and possible improvements in the choice of (1) species (mice), (2) behavioral paradigm (head-fixed, visual GO–NOGO), and (3) recording modality (3D two-photon calcium imaging) to study circuit mechanisms underlying sensory perception, perceptual learning, and perceptual dysfunction.
Benefits of Studying Perceptual Mechanisms Using Cellular Imaging in Mice
Why use cellular imaging in mice to study mechanisms underlying sensory perception? The major advantage lies in the unique accessibility to genetically modified animals. For example, information on cell type (e.g., GABAergic neurons and subtypes, Figure 2
; O’Connor et al., 2009
) and potentially inter-areal connectivity (Brown and Hestrin, 2009
) of recorded neurons can be directly visualized in vivo in transgenic mice. Incorporating information on cell identity may help to explain the variability in context-dependent responses across nearby neurons. Two-photon imaging offers ease of access to most neurons in layer II/III across the lissencephalic cortex. Over nine retinotopically organized visual areas exist in mice, allowing comparative studies across multiple cortical areas. The physiological properties of secondary visual areas are largely unexplored (Wang and Burkhalter, 2007
), and may demonstrate increased multisensory responses (Brady et al., 2009
) and variations in context-dependent modulation (cf. O’Connor et al., 2002
). As imaging techniques continue to improve (cf. Figure 1
B), the small extent (~0.5–2 mm2) and relatively thin laminae of mouse visual cortical areas could conceivably allow near-complete, simultaneous imaging of every neuron within layer II/III of a given area during behavior. Our methods could also lend a new dimension to many of the genetic mouse models of neurologic disease that currently exist (e.g., Eichhoff et al., 2008
; Kuchibhotla et al., 2008
), providing a high- throughput, chronic assay of perceptual influences on single neurons throughout the course of disease progression or therapeutic treatment.
Several factors must be considered when selecting particular mice and mouse strains for head-fixed visual discrimination (Deacon, 2006
; Wong and Brown, 2006
). Inbred mice, while demonstrating more uniform behavior, may have retinal deficits or diminished capacity for learning compared to more outbred strains (e.g., Deacon, 2006
). Thus, when choosing a strain, and when pre-selecting individual mice for training, a compromise must be reached between ease of handling and acclimating to head restraint, and how quickly the animal learns a task (Van Dam et al., 2006
).
Benefits of Using Go–Nogo Visual Discrimination in Head-Fixed Mice
The visual discrimination task developed here for head-fixed mice recapitulates many of the advantages of head-fixed behaviors in primates. First, we found that mice will perform hundreds of trials per session (up to ~1000 per session) for several months to a year, allowing the averaging of visual responses across sessions that may be necessary to reveal more subtle behavioral effects. Note that the motivation of mice to perform the task was strongly dependent on water scheduling, and increasing session duration must be balanced with the potential for greater false-alarm rates. Although we are unaware of any protocol for training a mouse to visually fixate, we found that eye movements were small relative to the spatial frequencies of the presented stimuli, and any trials containing occasional large eye movements could be rejected offline (see Section ‘Materials and Methods’). Our use of sine wave stimuli (vs. square-wave) during recordings further decreased the possibility of strong, local luminance transients induced by eye-movements. Thus, our technique provides sufficiently well-controlled recordings of visual responses in awake/behaving animals to enable some comparisons with the wealth of primate visual studies that are most often carried out in non-anesthetized animals. While the GO–NOGO task employed here has disadvantages compared to two-alternative forced-choice (2-AFC) tasks commonly used in primates and freely moving mice, our task is relatively easy for mice to learn. Many of the strategies developed in the course of our work could be applied to the development of 2-AFC visual behaviors in head-fixed mice using, for example, a track-ball and virtual reality environment (Harvey et al., 2009
) or multiple lick response ports (P. Reinagel et al., personal communication). The use of response indicators other than licking (e.g., heading motion, left/right lever press using forepaws) may also help mitigate challenges associated with lick-induced brain motion. Complementary methods allowing two-photon calcium imaging of visual responses and other calcium activity in freely moving rats and mice have recently been published (Engelbrecht et al., 2008
; Flusberg et al., 2008
; Sawinski et al., 2009
). Imaging in freely moving animals may allow for easier implementation of naturalistic behaviors in the future, albeit with additional limitations in image quality, visual stimulus control, and number of trials per session as compared to head-fixed operant behaviors.
Mice demonstrated improved visual thresholds and task performance over the course of many days, which will prove useful in future studies of perceptual learning. The learning rates were slower than for a similar olfactory task in head-fixed mice (Komiyama et al., 2007
). These differences could be due to the greater behavioral salience of different odors as compared to initial visual stimuli employed in our task. While differences in stimulus speed (Section ‘Task Acquisition and Long-term Stability’) were useful for attaining initial discrimination of stimuli, varying of other stimulus parameters such as luminance, or behavioral factors such as running (Niell and Stryker, 2010
), may further increase visual salience and shorten acquisition time. In addition, the behavioral techniques described in this paper can likely be automated, allowing high-throughput training of large numbers of mice in the home cage (Meier et al., 2009
). Future experiments could conceivably decrease mouse-to-mouse variability and user-intensive training/surgical procedures by imaging a larger number of (locally or commercially acquired) mice that arrive pre-trained and already expressing calcium indicators. Transgenic mice with cell-type specific expression of sensitive GECIs are expected to become commercially available soon, and may replace more labor-intensive approaches (virus injection or in utero electroporation).
Head-fixed visual studies may offer improved stimulus control compared to other head-fixed preparations in rodents, such as tactile studies during active whisking (e.g., Harvey et al., 2001
; O’Connor et al., 2010
), allowing enhanced differentiation of internally vs. externally mediated changes in neural activity in different behavioral contexts (but see Ferezou et al., 2006
), and more direct comparison with behavioral neurophysiology experiments in higher mammals. Although mice are nocturnal and have less acute vision than carnivores or primates (Prusky and Douglas, 2004
; Wong and Brown, 2006
), we and others have demonstrated reasonably fine neural and behavioral discrimination of specific stimulus features such as orientation (e.g., Dräger, 1975
; Mangini and Pearlman, 1980
; Niell and Stryker, 2008
; Liu et al., 2009
).
Benefits of Two-Photon Calcium Imaging Using Various Indicators
We found that robust calcium responses from visualized neurons can be recorded across hours and days during visual discrimination, using both synthetic calcium dyes and GECIs. The choice of whether to use synthetic dyes or GECIs depends on the research question at hand. For example, neurons bulk-loaded with OGB1-AM dye are typically brighter than neurons expressing GECIs, and thus can be imaged with less laser power and potentially less cell damage. Further, OGB1-AM loads every cell in a local volume (~300 × 300 × 300 µm3), thus providing greater yield than GECI experiments where only a subset of neurons are been labeled using viral or electroporation techniques. Additionally, we found that clear, stable visual responses could be obtained from the dendrites of GECI-expressing neurons in awake mice (Movie S1 in Supplementary Material). As GECIs designed to report activity at individual synapses become available (e.g., Dreosti et al., 2009
), cellular integration of behaviorally modulated synaptic input could be explored using the head-fixed imaging approach described here.
Many GECIs such as TN-XXL (Mank et al., 2008
) and YC3.6 (Figure 7
; Nagai et al., 2004
) are ratiometric, which is helpful in canceling out residual motion artifacts. In our experience, however, three-dimensional imaging during behavior was still necessary for ruling out motion-related artifacts systematically linked to lick responses. Non-ratiometric GECIs and synthetic dyes may have greater utility in experiments involving operant behavior when co-expressed with calcium-insensitive fluorescent proteins in order to normalize signals during rapid cell motion and slow drift (Knopfel et al., 2006
). The onset of a bout of licking appeared to generate an apparent sinking of the recorded neuron out of the plane of imaging (Figure 5
), implying that changes in jaw position may be the cause of the motion artifact (see also Figure S2B in Supplementary Material). Imaging at high rates, as well as maintaining a pressurized cranial window, are all important in obtaining clean spontaneous and evoked signals before and during onset of lick responses. The 3D volume imaging method described in this paper differs from a previous 3D technique that selectively recorded neural activity at pre-determined cellular spots (Göbel et al., 2007
). The latter technique, while providing higher yield (large number of imaged neurons), would not be effective during operant behavior involving licking, unless it was combined with a predictive model of cell motion (Fee, 2000
; Dombeck et al., 2007
).
The observed improvement in behavioral orientation thresholds across sessions, combined with the ability to image calcium indicator signals across sessions in behaving animals, should open the possibility of studying neural correlates of visual task-related plasticity and learning. However, calcium indicators also act as calcium buffers that, in some cases, can perturb native calcium dynamics (Holthoff et al., 2002
; Pologruto et al., 2004
; but see Schmidt et al., 2003
for an example of negligible perturbation using OGB-1). These exogenous calcium buffers may also enhance or suppress synaptic plasticity (Tonkikh et al., 2006
). Plasticity experiments would benefit from in situ estimation of the indicator concentration (Stosiek et al., 2003
) and calcium affinity (Pologruto et al., 2004
; Hendel et al., 2008
). While these potential changes in native calcium dynamics using certain indicators could also modify neural activity, initial electrophysiological experiments in vivo have shown little effect of bulk loading of calcium indicators on basic cortical response properties (Ohki et al., 2005
; Sato et al., 2007
). For example, Ohki and colleagues observed typical orientation tuning curves in single-unit recordings from cat visual cortical neurons loaded with OGB-1 AM (Ohki et al., 2005
).
Finally, while calcium signals do increase monotonically with spike rate, dye and calcium kinetics are slow compared to spike recordings (~10 s of ms onset, 100–1000 s of ms decay). Analysis and calibration methods to extract spike rate information from genetically encoded and synthetic calcium indicator signals in cortical pyramidal neurons are beginning to come of age (Smetters et al., 1999
; Kerr et al., 2005
; Wallace et al., 2008
; Bonin et al., 2009
; Greenberg and Kerr, 2009
; Mukamel et al., 2009
; Tian et al., 2009
). In the case of interneurons, reliable reconstruction of spike trains can be extremely challenging, due to slower calcium kinetics (Goldberg et al., 2003
) and higher firing rates (Niell and Stryker, 2008
). Precise knowledge of spike timing may not be necessary to begin to address basic questions of behavioral modulation in visual cortex, such as whether neurons of a given class increase or decrease their evoked or spontaneous activity during different behavioral tasks and brain states.
The authors declare that the research was conducted in the absence of any commercial or financial relationships that could be construed as a potential conflict of interest.
We thank P. Dempsey and W. Danse for assistance with behavioral training, D. Smith, A. Vagodny and M. Henry for assistance with surgical procedures and headpost development, D. Brittain for assistance in developing 3D imaging, and V. Bonin, S. Yurgenson, A. Kampff, D. Robson, M. Histed, B. Sabatini, T. LaFratta, and J. LaFratta for additional assistance with microscope construction. T. Komiyama provided critical assistance with behavioral task development. K. Kuchibhotla and B. Bacskai provided advice and samples of YC3.6. We thank M. Cohen, C. Moore and members of the Reid lab for helpful discussions and comments on the manuscript. This work was supported by NIH grant R01 EY018742 and by the Helen Hay Whitney Foundation (M. L. Andermann).
The Supplementary Material for this article can be found online at http://www.frontiersin.org/cellularneuroscience/paper/10.3389/fncel.2010.00003/
Tian, L., Hires, S. A., Mao, T., Huber, D., Chiappe, M. E., Chalasani, S. H., Petreanu, L., Akerboom, J., McKinney, S. A., Schreiter, E. R., Bargmann, C. I., Jayaraman, V., Svoboda, K., and Looger, L. L. (2009). Imaging neural activity in worms, flies and mice with improved GCaMP calcium indicators. Nat. Methods 6, 875–881.