1
Section on Cognitive Neuropsychology, Laboratory of Brain and Cognition, National Institute of Mental Health/National Institutes of Health, Bethesda, MD, USA
2
MEG Core Facility, National Institute of Mental Health/National Institutes of Health, Bethesda, MD, USA
Experience with visual objects leads to later improvements in identification speed and accuracy (“repetition priming”), but generally leads to reductions in neural activity in single-cell recording studies in animals and fMRI studies in humans. Here we use event-related, source-localized MEG (ER-SAM) to evaluate the possibility that neural activity changes related to priming in occipital, temporal, and prefrontal cortex correspond to more temporally coordinated and synchronized activity, reflected in local increases in the amplitude of low-frequency activity fluctuations (i.e. evoked power) that are time-locked to stimulus onset. Subjects (N = 17) identified pictures of objects that were either novel or repeated during the session. Tests in two separate low-frequency bands (theta/alpha: 5–15 Hz; beta: 15–35 Hz) revealed increases in evoked power (5–15 Hz) for repeated stimuli in the right fusiform gyrus, with the earliest significant increases observed 100–200 ms after stimulus onset. Increases with stimulus repetition were also observed in striate/extrastriate cortex (15–35 Hz) by 200–300 ms post-stimulus, along with a trend for a similar pattern in right lateral prefrontal cortex (5–15 Hz). Our results suggest that experience-dependent reductions in neural activity may affect improved behavioral identification through more coordinated, synchronized activity at low frequencies, constituting a mechanism for more efficient neural processing with experience.
Experience with objects that is gained through vision or other sensory modalities leads to long-lasting improvements in the speed and accuracy of object identification, a behavioral phenomenon referred to as “repetition priming” (Tulving and Schacter, 1990
; Schacter and Buckner, 1998
). Priming has played a critical role in our understanding of the brain organization of long-term memory in that it can be dissociated neuropsychologically from more explicit forms of memory such as free recall or recognition, and it does not depend exclusively on the hippocampus and related medial temporal lobe structures (e.g. Warrington and Weiskrantz, 1974
; Graf et al., 1984
; see Squire, 1992
, for review). Instead, it appears to reflect alterations to long-term perceptual, conceptual, decision and/or response-related representations that are stored in the neocortex (e.g. McClelland et al., 1995
; Dobbins et al., 2004
; Wig et al., 2005
, 2009
; Horner and Henson, 2008
; Race et al., 2009b
; see Schacter et al., 2007
, for review). Both electrode recordings in non-human primates (e.g. McMahon and Olson, 2007
; Peissig et al., 2007
) and functional imaging studies in humans (e.g. van Turennout et al., 2000
; Koutstaal et al., 2001
; Vuilleumier et al., 2002
) reveal a network of brain areas involved in repetition priming with object pictures. Overwhelmingly, regions thought to be involved in priming display repetition suppression (RS), a reduction in firing rate or blood-oxygen level dependent (BOLD) response with repeated stimulus presentation, including regions in posterior cortex ( fusiform gyrus; early visual areas extending into extrastriate visual areas) and anterior cortex (inferior frontal gyrus) (see Henson, 2003
; Schacter et al., 2007
, for reviews).
These joint observations pose a basic puzzle for systems and cognitive neuroscience: How is it that widespread reductions in neural activity can support improvements in behavioral performance? One possibility is that processing speed is facilitated so that the neural response to a repeated object occurs earlier relative to when it was first seen. Single-cell recording studies in monkeys, however, have demonstrated that the onset of firing-rate responses to repeated/familiar stimuli in prefrontal (e.g. Rainer and Miller, 2000
) and inferotemporal cortex (e.g. Li et al., 1993
; Freedman et al., 2006
; McMahon and Olson, 2007
; Anderson et al., 2008
) is not temporally shifted to earlier time points. Rather, activity is reduced throughout the duration of the firing-rate response after initial onset. Another possibility is that experience leads to “sharper”, more selective firing rate responses, conveying more information about stimulus identity at lower average rates, thereby increasing the efficiency of the system (Desimone, 1996
; Rainer and Miller, 2000
; Baker et al., 2002
; Freedman et al., 2006
; see Grill-Spector et al., 2006
, for review). However, repetitions over time scales that are relevant for most priming studies in humans, such as within a single day’s recording session, have tended to show the largest firing rate decreases in cells that respond best to a given stimulus, consistent with a proportional scaling-down of firing rates (Li et al., 1993
; Miller et al., 1993
; McMahon and Olson, 2007
). One recent proposal that can resolve these observations is that reduced activity reflects greater temporal coordination and synchronization of neural responses, leading to more efficient neural processing (e.g. Gotts, 2003
; Ghuman et al., 2008
).
Gotts (2003)
used computational modeling to explore how reduced neural firing might produce a more efficient system. By including biologically proportionate levels of excitatory and inhibitory inputs and short-term plasticity mechanisms within the computer simulations, stimulus repetition was found to lead to a proportional scaling of firing rates while simultaneously enhancing local neural synchrony (see also Bazhenov et al., 2005
). This enhanced synchrony was in lower oscillation frequencies (e.g. 0–15 Hz), was phase-locked to the onset of the stimulus (i.e. “evoked” synchrony), and produced a stronger, more reliable and synchronized input to downstream regions of the system. As firing rate decreased in the model, neural synchrony increased in conjunction with performance and metabolic efficiency improvements (see Figure 1
). This low-frequency coherent activity was also present in the model’s excitatory synaptic currents, permitting predictions in population-level imaging methods, such as BOLD fMRI, microelectrode recordings of local field potentials (LFPs), and source-localized EEG/MEG, that are thought to reflect local synaptic activity more than spiking activity, per se (e.g. Logothetis et al., 2001
). The model was primarily aimed at addressing short-term repetition effects lasting tens of seconds in single-cell recording and fMRI-Adaptation experiments (e.g. Grill-Spector and Malach, 2001
; Miller et al., 1993
), but it nevertheless raised the possibility that more synchronized, coherent activity might be the means by which reduced activity can produce behavioral facilitation in longer-term repetition priming paradigms (see Salinas and Sejnowski, 2000
; Engel et al., 2001
, for similar proposals). In line with this basic view, a recent MEG study (Ghuman et al., 2008
) using source-localized data reported enhanced long-range coupling (phase-locking) between prefrontal and temporal cortex for repeated compared to novel stimuli at 10–15 Hz. The onset latency of these increases in long-range phase-locking (∼200–250 ms post-stimulus) also predicted the magnitude of repetition priming observed across subjects.
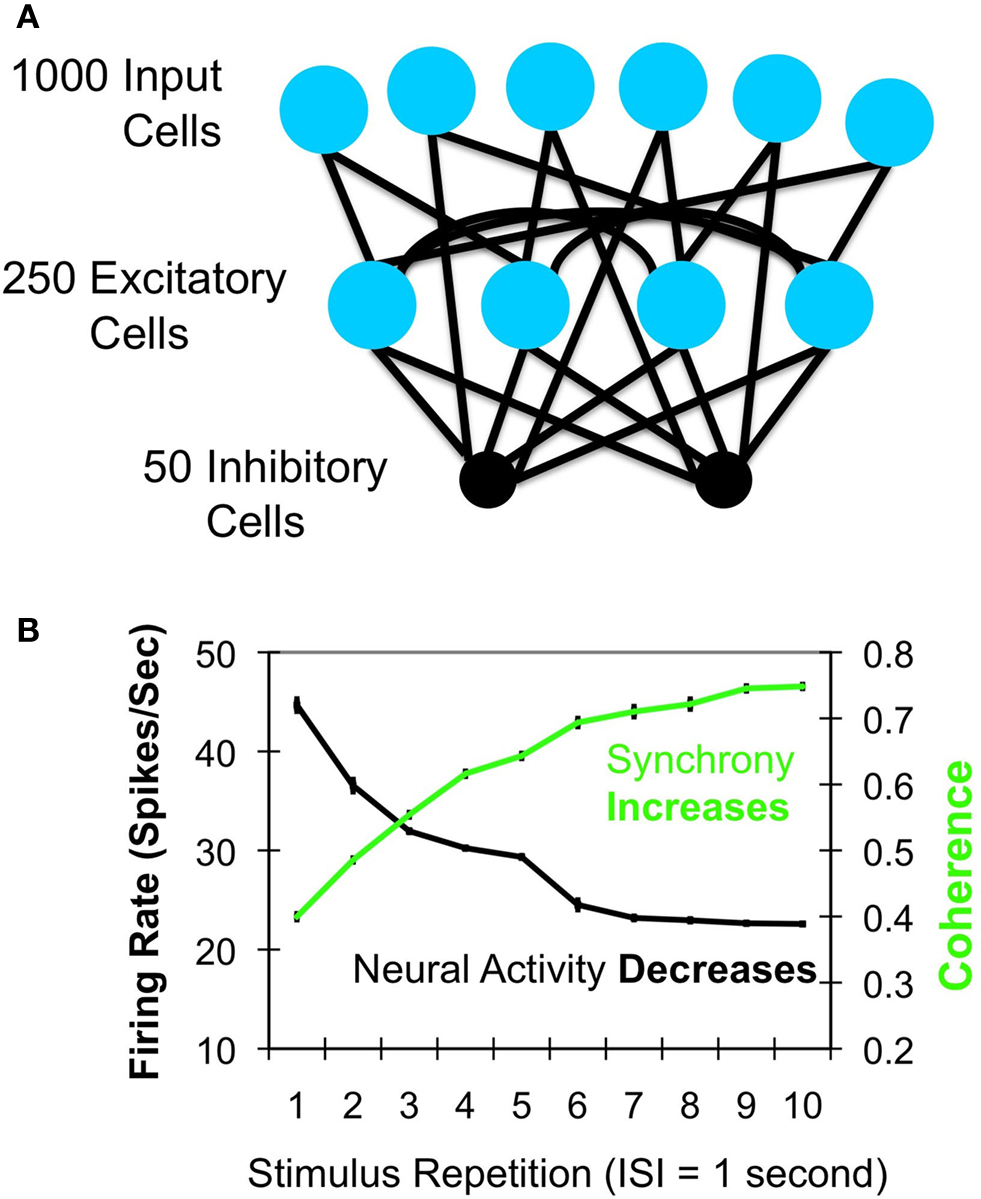
Figure 1. Gotts (2003)
model. (A) Architecture of the model. One thousand simulated input neurons projected to 250 excitatory and 50 inhibitory neurons, which were themselves probabilistically interconnected. Parameters were fit to independent sources of in vitro physiological data for pyramidal cells and fast-spiking interneurons. (B) With short-term stimulus repetitions (each tetanus was 500 ms in duration), the model neurons showed decreases in firing rates while simultaneously showing increases in spike synchronization (coherence; green curve) at low oscillation frequencies (<15 Hz), as well as speeded response times and increased metabolic efficiency (not shown).
More efficient and temporally coordinated activity is a promising idea in explaining how reduced activity can drive improved identification performance. This idea generally predicts that fluctuations in neural activity over local populations of cells that are evoked by the stimulus onset should be larger for repeated stimuli, as well as more coherent and phase-locked across distant, yet anatomically connected cortical regions that are involved in task performance. EEG/ERP (event-related potential) studies of stimulus repetition and priming that measure voltages recorded from the surface of the scalp have occasionally found evidence in support of this general hypothesis, with larger amplitude ERPs observed to repeated or familiar stimuli as early as 150–170 ms post-stimulus (e.g. Schendan and Kutas, 2003
; Scott et al., 2006
; Peissig et al., 2007
). However, many studies have failed to find effects this early, with the earliest differences between novel and repeated conditions commonly being observed between 200–300 ms and extending out until 700–800 ms post-stimulus (e.g. Bentin and Peled, 1990
; Rugg et al., 1992
, 1997
; Paller and Gross, 1998
; Swick, 1998
; Olichney et al., 2000
; Henson et al., 2003
, 2004
; Kiefer, 2005
). The nature of these repetition effects has also not always been consistent with larger evoked responses to repeated stimuli, with a number of studies reporting decreases in amplitude or power with repetition (e.g. Fiebach et al., 2005
; Gruber and Muller, 2005
; Race et al., 2009a
). However, the spatial resolution of raw scalp EEG signals is quite coarse compared to microelectrode recordings and source- localized EEG/MEG signals. It is possible that poor spatial resolution and/or averaging data across individual subjects with different onset latencies or source locations is eliminating earlier effects. The contributions of deeper sources of activity shown by fMRI studies to be central to stimulus repetition and priming effects (e.g. fusiform gyrus) are also difficult to estimate in raw scalp recordings without source modeling. On these points, it is interesting to note that recent micro- and transcranial electrode recording studies in monkeys have shown strong and reliable enhancement of evoked responses for familiar stimuli, corresponding to larger low-frequency (∼5–15 Hz) activity fluctuations (inferotemporal cortex: Anderson et al., 2008
; occipital cortex: Peissig et al., 2007
; for similar findings in cat visual cortex, see von Stein et al., 2000
). Additionally, and importantly, Anderson et al. (2008)
showed that larger evoked responses in the local field potential (LFP) occurred simultaneously with standard RS in the spiking activity. The earliest increases in the evoked response occurred at approximately 170-ms post-stimulus (the well-characterized N170: e.g. Jeffreys et al., 1992
; Tanaka and Curran, 2001
; Carmel and Bentin, 2002
; Rossion et al., 2002
).
To examine whether local, low-frequency increases in the magnitude of the evoked response (i.e. evoked power) might underlie repetition priming in humans, we utilized magnetoencephalography (MEG) with event-related source localization (ER-SAM; Cheyne et al., 2007
). The prediction of the Gotts (2003)
model and recent electrode recording studies in monkeys (Peissig et al., 2007
; Anderson et al., 2008
) is that local stimulus-evoked power at low-frequencies should increase for repeated stimuli within brain regions previously identified in fMRI studies as showing RS during visual object priming (i.e. bilateral fusiform, striate/extrastriate, and lateral prefrontal cortices; e.g. van Turennout et al., 2000
; Koutstaal et al., 2001
; Vuilleumier et al., 2002
). The onset of the earliest of these evoked power changes in occipitotemporal brain regions (e.g. fusiform gyrus in humans) should also be observed at times that are comparable to those observed in monkeys (∼170-ms post-stimulus). Accordingly, our study looked at the time course of repetition-related changes in evoked power within these pre-defined anatomical regions of interest in two specific low- frequency bands that have been identified as relevant in prior studies of priming and stimulus repetition, as well as observed here in a time- frequency analysis of our average sensor data: (1) 5–15 Hz, theta/alpha (von Stein et al., 2000
; Gotts, 2003
; Duzel et al., 2005
; Ghuman et al., 2008
), and (2) 15–35 Hz, beta (Duzel et al., 2005
; Race et al., 2009a
).
Procedure
Seventeen right-handed normal volunteers (Mean Age = 28.82, range 22–37; 8 males) gave informed consent following NIH guidelines and participated in the MEG study. During scanning, subjects were shown gray-scale pictures of objects selected from 12 categories (fruits, vegetables, animals, tools, utensils, weapons, instruments, toys, clothing, body parts, furniture, and vehicles) and were instructed to name each item covertly as quickly as possible and to press a button as soon as they identified each item (Figure 2
). Pictures were displayed for 300 ms, followed by a variable inter-stimulus interval (1700–3200 ms) during which a fixation cross was displayed on the screen. Ten objects with distinct names from each category were shown, with half of the items appearing once (List A = 60 items) and half the items appearing three times (List B = 60 items). Presentation of List A or B as novel or repeated was counterbalanced across subjects, and the items in the two lists were equated in name frequency. In addition, 60 phase-scrambled pictures of objects were shown. Novel pictures and first presentation of the to-be-repeated items were then collapsed for data analysis (“Novel”) as were the second and third presentation of repeated items (“Repeated”). This resulted in the comparison of 120 Novel items with 120 Repeated items, providing greater power for our MEG source localization. Averaging across the two counterbalanced item orders, the average duration between Novel and Repeated stimuli was 4.6 min, with largely overlapping presentation of the two trial types (from time = 0 at the beginning of the experiment: Novel Range = 2.1–1030.6 s; Novel Mean = 376.5 s; Novel SD = 280.6 s; Repeated Range = 76.2–1040.3 s; Repeated Mean = 652.7 s; Repeated SD = 263.0 s).
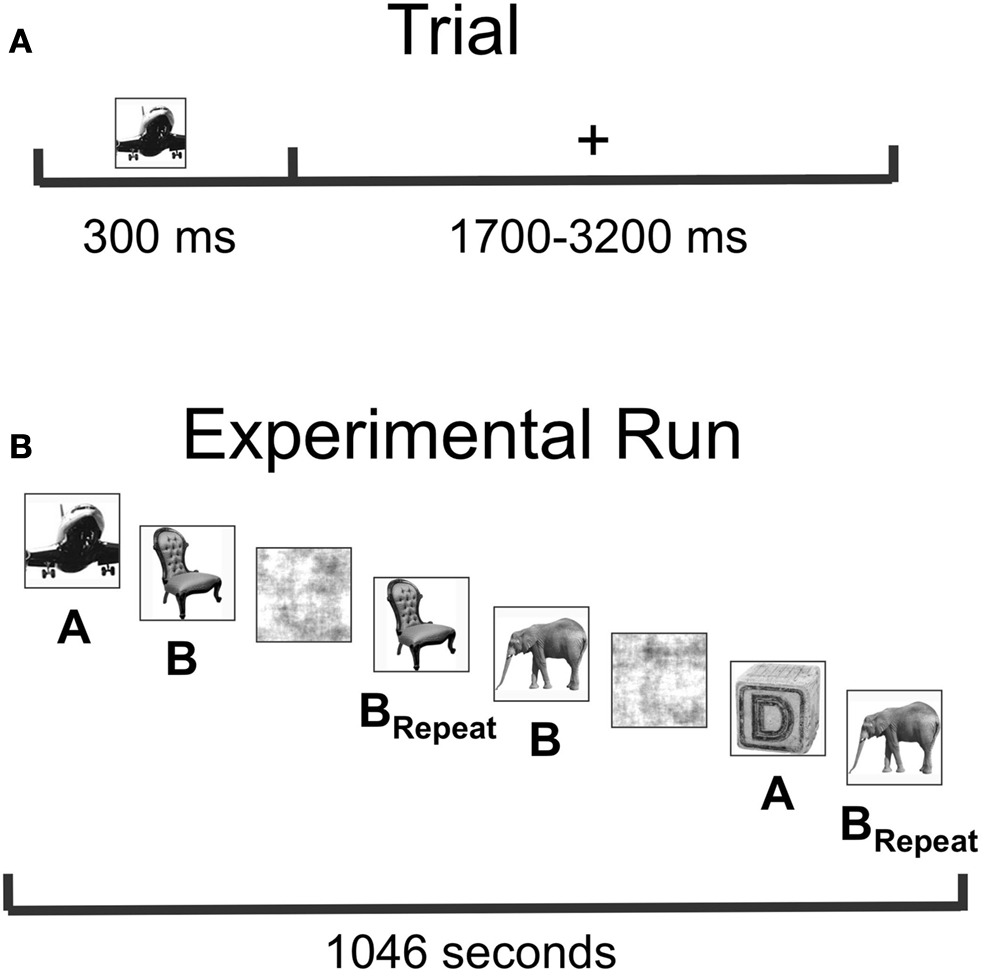
Figure 2. Task and experimental design. (A) Subjects were instructed to name single objects covertly. Stimuli were presented for a duration of 300 ms, followed by a randomly chosen inter-stimulus interval (ISI) ranging from 1700 to 3200 ms, resulting in a single-trial duration of 2000–3500 ms. Subjects were instructed to press a button as soon as they knew the name of the object, and response times were recorded. (B) Graphical depiction of the basic experimental design. Pictures in List A were always Novel (presented only once during the experimental run). Pictures in List B were presented a total of three times, with the first presentation included as Novel, and the final two presentations included as Repeated (BRepeat). Phase-scrambled versions of the stimuli randomly intervened between intact pictures, and Lists A and B were counterbalanced as Novel versus Repeated across subjects.
Data Acquisition
Neuromagnetic data were recorded at 600 Hz with a bandwidth of 0–150 Hz using a CTF 275 MEG system (VSM MedTech Ltd., Canada) composed of a whole-head array of 275 radial 1st-order gradiometer/SQUID channels housed in a magnetically shielded room (Vacuumschmelze, Germany). Synthetic 3rd gradient balancing was used to remove background noise on-line. Fiducial coils were placed on the nasion, left preauricular, and right preauricular sites of each participant. These were energized before and after each run to localize each participant’s head with respect to the MEG sensors. In a separate session, high-resolution T1-weighted anatomical images of each subject’s brain were obtained with a 3-Tesla whole-body scanner (GE Signa, Milwaukee, WI). The MEG data were then co-registered with these scans during source localization.
MEG Data Analysis
Data were edited and filtered to remove environmental and physiological artifacts. An evoked time-frequency analysis was first performed on the raw sensor data for each subject to confirm that the two frequency bands of interest (5–15 and 15–35 Hz) were indeed relevant and appropriate for the current dataset. For each subject, time epochs of sensor data during which stimuli were presented were first averaged across all trials in the time domain (Novel and Repeated trials from −200- to 500-ms post- stimulus; N = 240) and then processed using the Stockwell Transform (Stockwell et al., 1996
). The initial and final 100 ms of each stimulus epoch were ignored in order to eliminate edge artifacts in the Stockwell- transformed data. The resulting evoked time-frequency spectrograms were then normalized to the average of the −100–0 ms pre-stimulus period, log-transformed, and then averaged across sensors and subjects.
Event-related synthetic aperture magnetometry (ER-SAM, Cheyne et al., 2007
) was then used to: (1) help identify anatomical regions of interest (ROIs), and (2) attribute sources to time-varying, band-limited power in the two frequency bands of interest (5–15 and 15–35 Hz) for Novel versus Repeated trials.
ROI Definition
Anatomical regions of interest were specified a priori based on the location of stimulus-related activity and the existence of RS in previous BOLD fMRI studies of visual object identification (e.g. Koutstaal et al., 2001
; van Turennout et al., 2000
; Vuilleumier et al., 2002
). They consisted of the following anatomical masks generated for a standardized, grey-matter segmented brain (N27 brain, AFNI software, Cox, 1996
): bilateral striate/extrastriate cortex (Brodmann Areas 17 and 18), left and right fusiform gyri (anterior to the occipital notch, Talairach and Tournoux, 1988
, at a Y-coordinate of −70; ventral to a Z-coordinate of 0), and left and right lateral prefrontal cortex (anterior to the precentral gyrus at a Y-coordinate of 0). These ROI masks based entirely on standardized anatomical coordinates were then combined with the MEG data to restrict the masks to those source locations within the cortical volume that also showed significant changes (either increases or decreases) in evoked power during the stimulus events. All 240 stimulus epochs (−100–500 ms after picture onset, pooling Novel and Repeated trials) were extracted for this purpose. A single covariance matrix was computed on these unaveraged epochs in one broad frequency band (band-pass filtered 5–60 Hz). Beamformer weights were calculated with a vector lead-field calculation (Sekihara et al., 2001
) in 7 mm steps across the volume, using a multi-sphere head model derived from individual participants’ structural MRIs (based on brain shapes). Virtual time-series data were then averaged in the time domain, with evoked source power during the stimulus quantified in five non-overlapping time bins of 100 ms (0–100, 100–200, 200–300, 300–400, 400–500 ms) as the log10 ratio of power in each time bin relative to the 100-ms pre-stimulus period (see Cornwell et al., 2007
, for another example of the formulation used here). By directly contrasting two time windows of virtual data, uncorrelated noise passed through the spatial filters is factored out of the resulting power ratios and does not need to be explicitly estimated. Group analyses were performed in AFNI (Cox, 1996
) after normalizing each source volume by scaling to the standard deviation (reducing the influence of inter-subject global power variability on local source power estimates) and then transforming individual subjects’ volumes into a common Talairach coordinate space (Talairach and Tournoux, 1988
). Changes in 5–60 Hz power during the stimulus at each source location could then be evaluated with a mixed effects ANOVA, with time bin as the fixed effects factor (five levels) and subject as the random factor (N = 17). The main effect of time bin was then thresholded for each source location at an alpha level of p < 0.005 (corrected for multiple comparisons using False Discovery Rate, Genovese et al., 2002
, within the grey-matter mask: q < 0.004), and finally conjoining this mask with the a priori anatomical ROIs resampled to a spatial resolution of 7-mm isotropic.
Band-limited power analyses
Time-varying source power estimates for Novel and Repeated trials were calculated for the two frequency bands of interest (5–15 and 15–35 Hz) in a manner very similar to that just described for estimating stimulus-related changes in 5–60 Hz power. However, separate covariance matrices were computed for Novel and Repeated trials (N = 120 trials each) and for the 5–15 and 15–35 Hz bands, resulting in four sets of beamformer weights (Novel 5–15 Hz, Repeated 5–15 Hz, Novel 15–35 Hz, and Repeated 15–35 Hz). Virtual time-series data were then similarly averaged in the time domain, with evoked source power for Novel and Repeated trials at 5–15 and 15–35 Hz quantified in five separate time bins of 100 ms as the log10 ratio of power in each time bin relative to the 100-ms pre-stimulus period. Group analyses were performed in AFNI (Cox, 1996
) after re-scaling sources to the standard deviation and transforming subjects’ volumes into Talairach coordinates. Separate mixed-effects repeated measures ANOVAs were conducted in each frequency band (5–15 and 15–35 Hz) for each anatomical ROI, with Condition (Novel, Repeated) and Time Bin (0–100, 100–200, 200–300, 300–400, 400–500 ms) serving as the fixed effects factors and Subjects as the random factor. Each ANOVA permitted testing of the main effects and interactions of the fixed factors, as well as a test of the grand mean across all conditions against zero (indicating increases or decreases in event-related power relative to the prestimulus period, collapsing across Condition and Time Bin). Data for individual subjects were averaged across sources within each ROI such that each subject contributed 2 (Condition) × 5 (Time Bin) power estimates per ROI and frequency band. A modified Bonferroni correction (Keppel, 1991
) was applied such that the number of ANOVAs conducted per ROI (2 frequency bands = 2 tests) was accounted for (corrected to alpha = 0.05), but the choice of ROIs (five total: striate/extrastriate, L/R fusiform, L/R prefrontal) was permitted without correction given that they were determined a priori based on BOLD fMRI studies. Given this allowance, we performed an additional check on the likelihood that our results could be observed due to chance using more sensitive permutation tests (Maris and Oostenveld, 2007
). Permutation tests use Monte Carlo simulation to calculate the chance probability of an event or combination of events by randomly re-labeling data across conditions (such as Novel and Repeated) and re-performing the same family of statistical tests, keeping track of the number of random iterations in which a significant result was observed. For the permutation tests conducted here, one iteration involved the random relabeling of the Novel and Repeated conditions for each subject and the recalculation of the mixed effects ANOVAs for each ROI × frequency band combination; this process was then repeated for a total of 10,000 iterations. Finally, for those ROIs exhibiting significant effects, we performed follow-up post-hoc tests of Condition for each time bin (corrected for five test bins using permutation tests, 10,000 iterations) to determine the earliest latency of the power differences due to repetition. Post-hoc tests were also used to determine which sources within each ROI contributed significantly to the ROI-level effects.
Behavioral Data
Paired t-tests performed on the reaction time (RT) data confirmed that there were no significant differences between the novel and first presentation of the to-be-repeated items [Novel vs. First Presentation: paired t-test, t(16) = −0.99, P < 0.3] or between the second and third presentation of repeated items [Second vs. Third Presentation: t(16) = −1.76, P < 0.1], allowing us to combine conditions. As expected, we found a significant RT advantage for the Repeated compared to Novel stimuli [t(16) = −3.72, P = 0.002] (Mean Repeated RT = 519 ms, Mean Novel RT = 572 ms).
Time-Frequency Analysis of Sensor Data
Previous studies of priming, stimulus repetition and familiarity have highlighted the relevance of low oscillation frequencies in the ranges of theta/alpha (5–15 Hz: e.g. von Stein et al., 2000
; Duzel et al., 2005
; Ghuman et al., 2008
) and beta (15–35 Hz: e.g. Duzel et al., 2005
; Race et al., 2009a
). Therefore, we first confirmed that these frequencies were present in our event-related MEG data by conducting an evoked time-frequency analysis of the sensor data using the Stockwell (S) transform (Stockwell et al., 1996
). The MEG signals at each sensor were averaged in the time domain across all stimulus events (pooling Novel and Repeated trials), S-transformed, normalized to 100 ms of pre-stimulus power, converted to log base 10, and then averaged across all sensors and subjects. Figure 3
shows the resulting average spectrogram. A large increase in evoked power was observed in both the 5–15 and 15–35 Hz frequency bands by approximately 100-ms post-stimulus, an increase that was more transient in the 15–35 Hz band and relatively sustained in the 5–15 Hz band. While studies of “induced” power (non-phase-locked) have shown a decoupling of theta and alpha frequencies in perception and memory contexts, event-related phase-locked components of power are more often coordinated between theta and alpha (see Klimesch et al., 2008
, for review). Our evoked power measurements for these sensor-level data in the 5–15 Hz band also show joint increases in theta and alpha frequencies, indicating that banding the data is reasonable in this context.
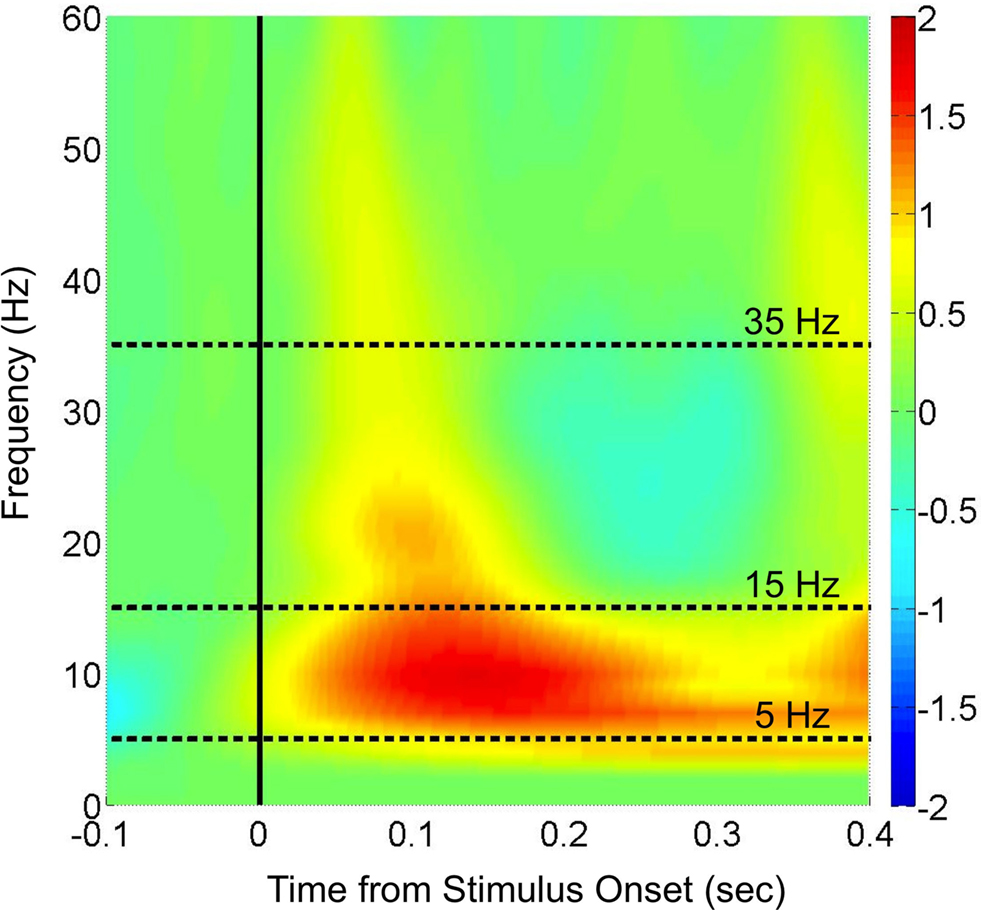
Figure 3. Time-frequency analysis of the evoked MEG response to stimuli in the sensor data. Following artifact removal, the MEG responses at each sensor to each trial (including both Novel and Repeated trials, from −200 to 500 ms post-stimulus) were averaged in the time domain, yielding an evoked response to the stimulus onset. The trial-averaged data for individual sensors were then submitted to the Stockwell (S) transform (Stockwell et al., 1996
) to yield time-frequency spectra, and these spectra were then averaged across sensors and across subjects (the initial and final 100 ms are ignored in order to eliminate edge artifacts in the transformed data). Shown in color is the log10 ratio of power in individual time/frequency bins divided by the average power from −100 to 0 ms at each corresponding frequency, with Frequency in Hz on the y-axis and Time in seconds relative to stimulus onset on the x-axis. The two frequency bands of interest (theta/alpha: 5–15 Hz; beta: 15–35 Hz) are denoted by dashed lines in the interior of the spectrogram.
ROI Analyses
Having confirmed that evoked power is increased during the stimulus in both the 5–15 and 15–35 Hz frequency bands for the sensor-level data, we conducted separate ER-SAM analyses in these bands. The source power estimates in five 100-ms time bins from stimulus onset were then submitted to Group-level ROI analyses using the a priori defined, grey-matter-segmented cortical masks in Talairach space for striate/extrastriate, left and right fusiform gyri, and left and right lateral prefrontal cortex (see Figure 4
). Separate mixed-effects, repeated measures ANOVAs were conducted in each ROI for each frequency band, allowing simultaneous evaluation of four band-limited effects: (1) a test of the grand mean power (across Condition and Time Bin) against zero (i.e. pre-stimulus baseline), (2) a main effect of Time Bin (collapsed across Condition), (3) a main effect of Condition (collapsed across Time Bin), and (4) an interaction of Condition with Time Bin. We first report the results for the first two effects, as they indicate basic evoked power changes relative to a prestimulus baseline for a given frequency band, as well as changes in evoked power over time during the stimulus. Significant increases in evoked power relative to baseline were observed during the stimuli in all five ROIs for the 5–15 Hz frequency band [F(1,16) > 15.7, P < .003, corrected by modified Bonferroni, for all], as well as in the striate/extrastriate [F(1,16) = 29.58, P = 0.0001, corrected] and right fusiform ROIs [F(1,16) = 6.54, P = 0.05, corrected] for the 15–35 Hz frequency band. Changes in evoked power during the stimulus (a main effect of Time Bin) were also observed in all five ROIs for the 5–15 Hz band [F(4,64) > 3.59, P < 0.03, corrected, for all] and for the 15–35 Hz band [F(4,64) > 4.80, P < 0.004, corrected, for all]. These results provide strong evidence of stimulus processing within these frequency bands for all five ROIs.
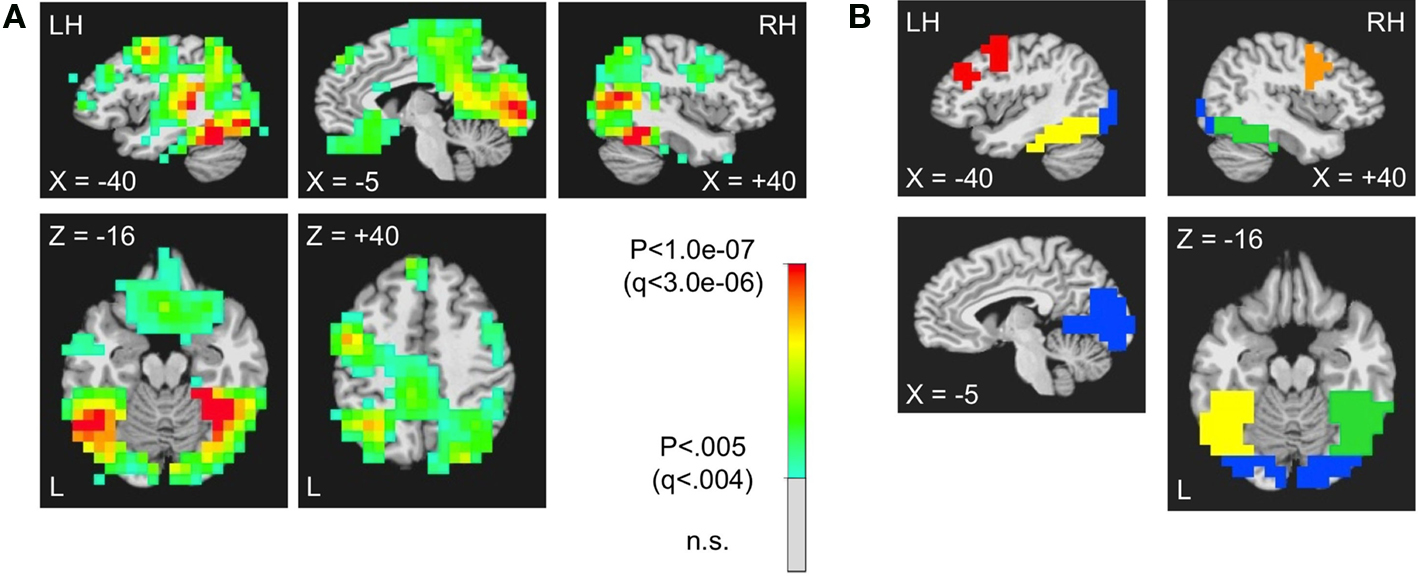
Figure 4. Defining the anatomical ROI masks used in the band-limited, source-localized MEG analyses. (A) Source locations showing significant changes in broadband power (5–60 Hz) during the first 500 ms of stimulus processing (five time bins of 100 ms, pooling Novel and Repeated trials) (p < 0.005, FDR corrected for multiple comparisons at q < 0.004; Genovese et al., 2002
). (B) The significant source locations in (A) were combined with anatomical regions that were determined a priori based on prior neuroimaging studies within a grey-matter-segmented version of the N27 brain (AFNI software, Cox, 1996
). Separate ROI masks were made for striate/extrastriate (shown in blue), Left and Right Fusiform Gyrus (yellow and green, respectively), and Left and Right Lateral Prefrontal Cortex (red and orange, respectively).
We next examined the main effects of repetition Condition (Novel vs. Repeated) on evoked power and the interaction of Condition with Time Bin in each ROI. In the 5–15 Hz frequency band, we observed a significant main effect of Condition in the right fusiform gyrus, with greater evoked power for Repeated stimuli [F(1,16) = 7.5, P = 0.03, corrected by modified Bonferroni] (see Figure 5
A). Post-hoc analyses revealed that power increases for Repeated stimuli were significant in the 100–200 ms bin (P = 0.046, corrected for five test bins using permutation tests), as well as in the 400–500 ms bin (P = 0.0065, corrected for five bins), consistent with early evoked power increases for Repeated stimuli around 170 ms, as has been recently observed for electrical activity in monkey occipitotemporal and inferotemporal cortex (Peissig et al., 2007
; Anderson et al., 2008
). Note that corresponding effects can also be observed in the evoked MEG responses of individual subjects (Figure 5
B). Similar, but slightly later effects were observed in the striate/extrastriate ROI within the 15–35 Hz band [F(1,16) = 6.1, P = 0.05, corrected by modified Bonferroni], with significant increases in evoked power during Repeated trials in the 200–300 ms (P = 0.043, corrected for five bins) and 300–400 ms bins (P = 0.032, corrected for five bins; see Figure 6
). A follow-up 3-way Condition × Time Bin × ROI (right fusiform, striate/extrastriate) interaction failed to reach significance. Additionally, a trend (P = 0.07, corrected by modified Bonferroni) for an interaction between Condition and Time Bin was observed in right lateral prefrontal cortex in the 5–15 Hz frequency band, with a trend for greater evoked power during Repeated trials in the 200–300 ms time bin (P = 0.073, corrected for five bins; see Figure 7
). It is important to point out that these statistics are conservative in the sense that all sources within an ROI were included in the average rather than just those reaching significance individually. Those sources that were significant individually (P < 0.05, uncorrected) within each of the three ROIs are shown in blue in Figures 5
–7
, with the darkest shades of blue indicating the strongest effects (see colorbar in each figure for significance levels).
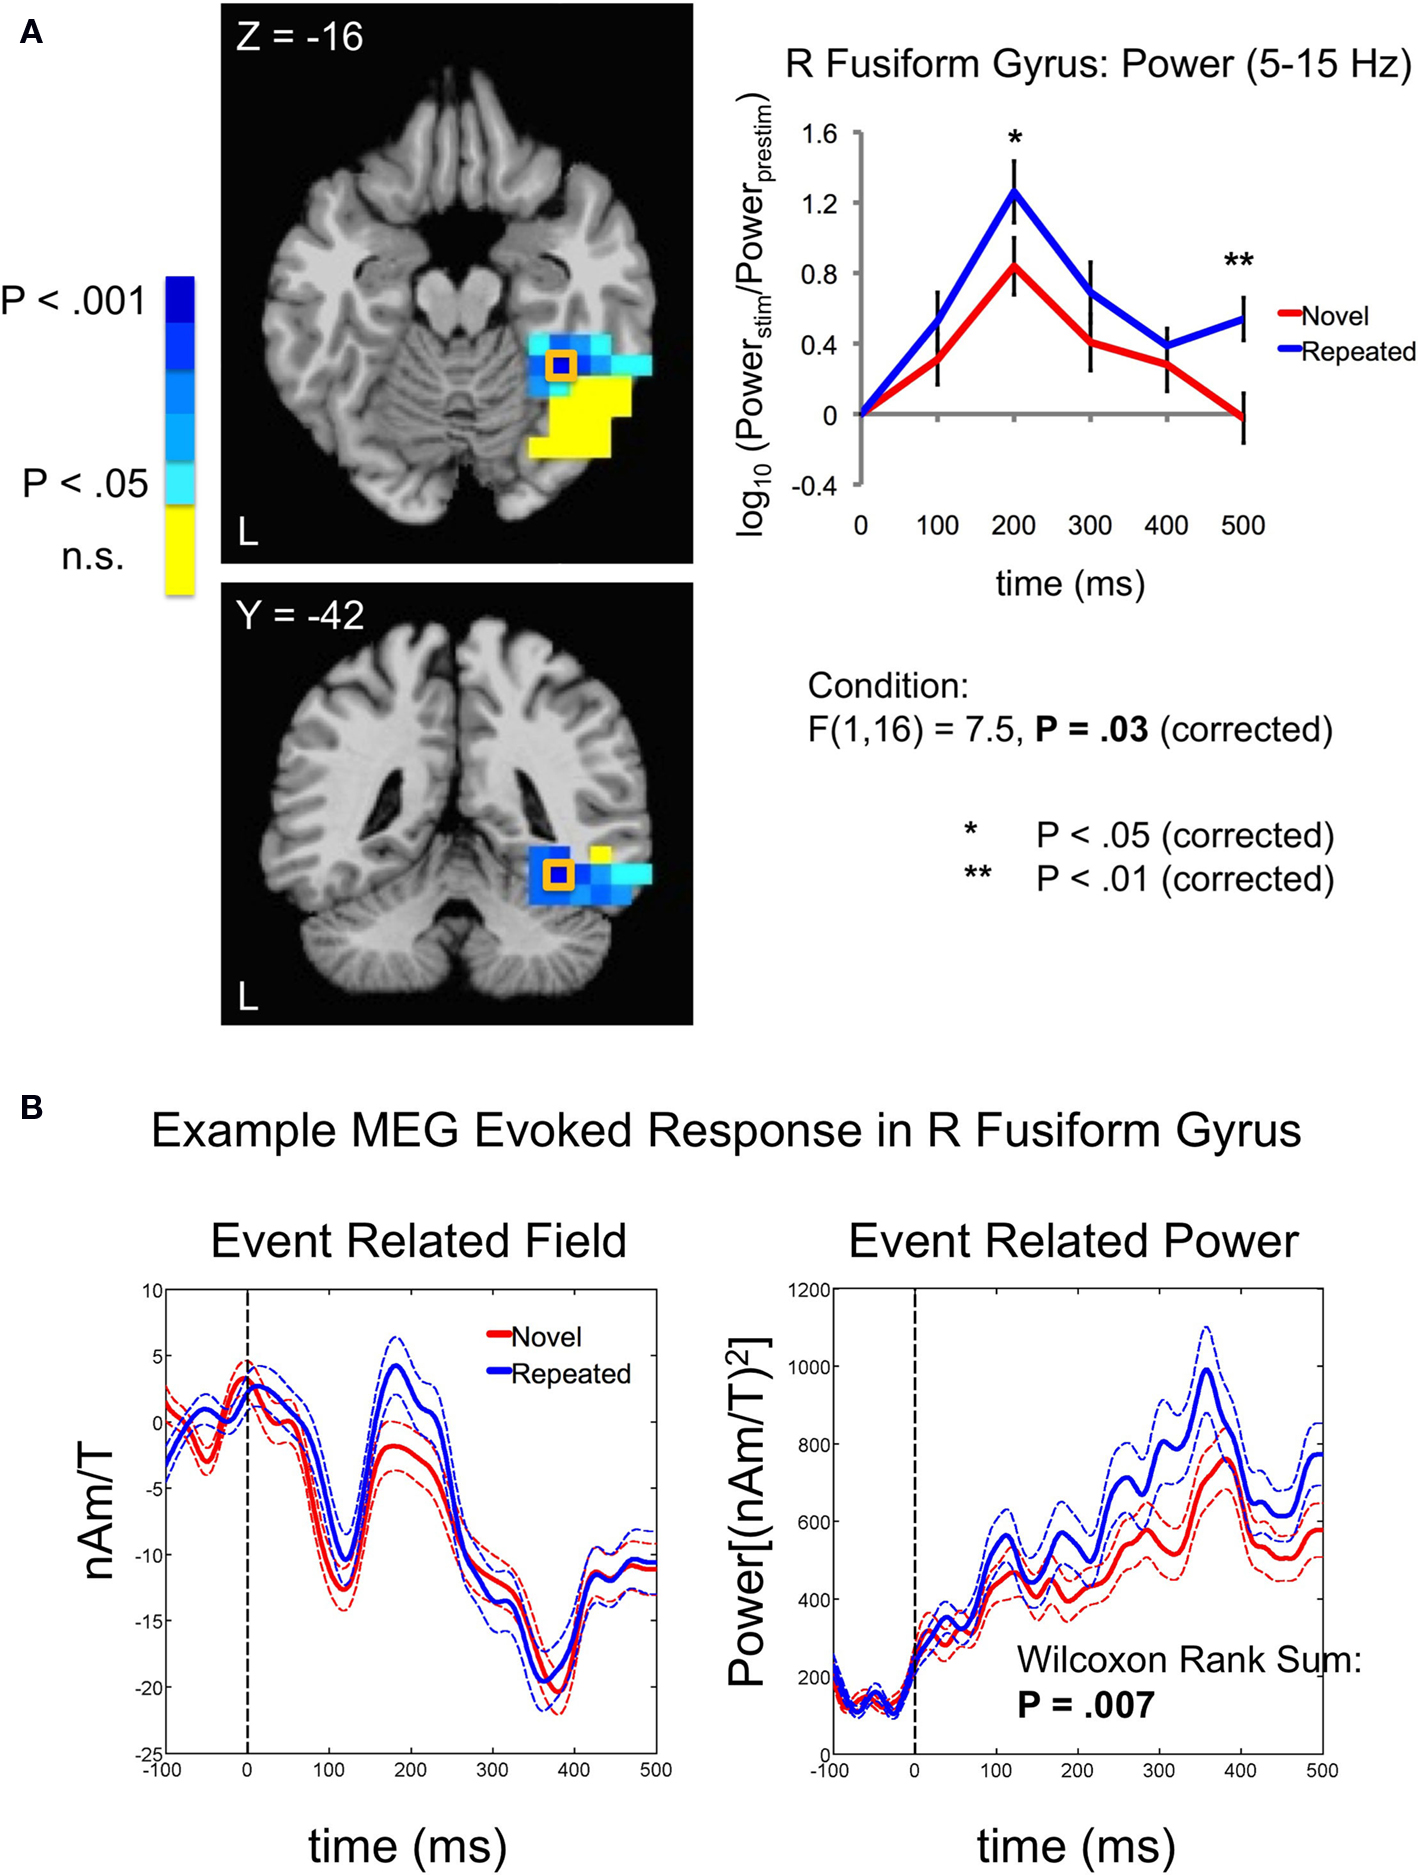
Figure 5. Increases in evoked low frequency power (5–15 Hz) for Repeated stimuli in right fusiform gyrus. (A) Evoked power increases were observed for Repeated compared to Novel trials in the band-limited (5–15 Hz), source-localized MEG data [blue compared to red curves in right panel]. Power is shown in 100-ms time bins, with the time label corresponding to the end of each 100-ms period (e.g. 200 ms refers to the 100–200 ms bin). Post-hoc tests showed that the earliest significant increases were in the 100–200 ms time bin, followed by a later increase in the 400–500 ms time bin. Curves were based on the entire right fusiform mask (shown in Figure 4
). Sources within this mask that were significant individually (uncorrected for multiple comparisons) are shown in the left panels in shades of blue, with darker shades of blue indicating stronger effects (see colorbar for related P-values). Sources within this mask that failed to show significant effects individually are shown in yellow. Y-and Z-coordinates correspond to the Talairach and Tournoux (1988)
atlas. (B) Evoked power increases can also be seen in individual subjects, calculated over trials. The event related field (left panel) averaged across the Novel and Repeated trials is shown for a single subject at the peak source location for the group-level power differences in the right fusiform [+35,−42,−16; outlined in (A) with an orange square]. The response on each trial was low-pass filtered below 20 Hz and then baseline-corrected to the mean of the pre-stimulus period (−100–0 ms). Squaring the signal at each time sample for each trial then yielded a measure of instantaneous power (right panel). A Wilcoxon Rank Sum test revealed that the power, averaged over time samples per trial, was greater for Repeated than for Novel trials (z = 2.73, P = 0.007). nAm/T (nano Ampere meters per Tesla) is a measure of the amplitude of the estimated current dipole. Error bars indicate standard error of the mean.
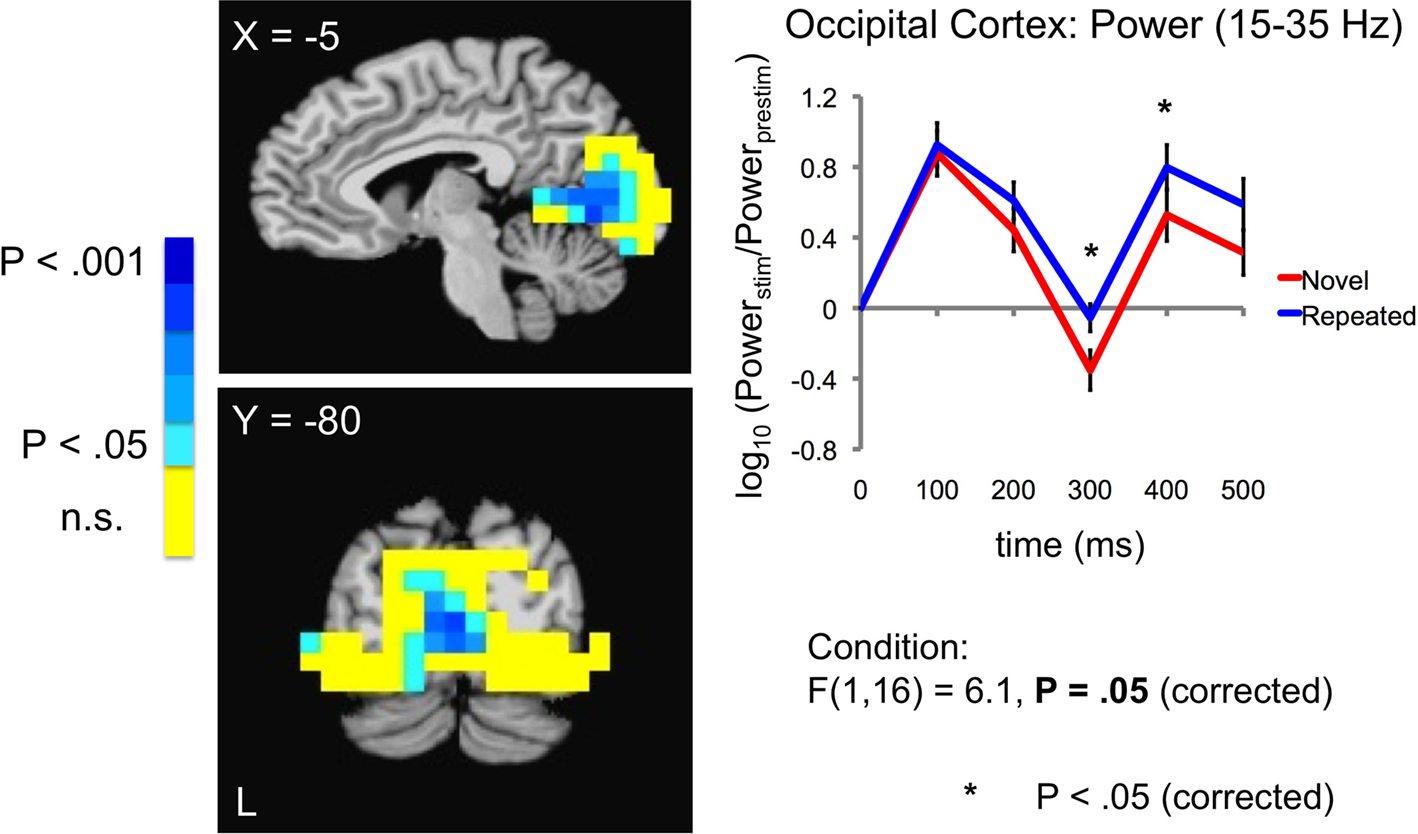
Figure 6. Increases in evoked low frequency power (15–35 Hz) for Repeated stimuli in striate/extrastriate cortex. Evoked power increases were observed for Repeated compared to Novel trials in the band-limited (15–35 Hz), source-localized MEG data (blue compared to red curves in right panel). Power is shown in 100-ms time bins, with the time label corresponding to the end of each 100-ms period (e.g. 200 ms refers to the 100–200 ms bin). Post-hoc tests for individual 100-ms time bins showed that the earliest significant increases were in the 200–300 ms time bin, followed by the 300–400 ms time bin. Curves were based on the entire striate/extrastriate mask (shown in Figure 4
). Conventions are as in Figure 5
A.
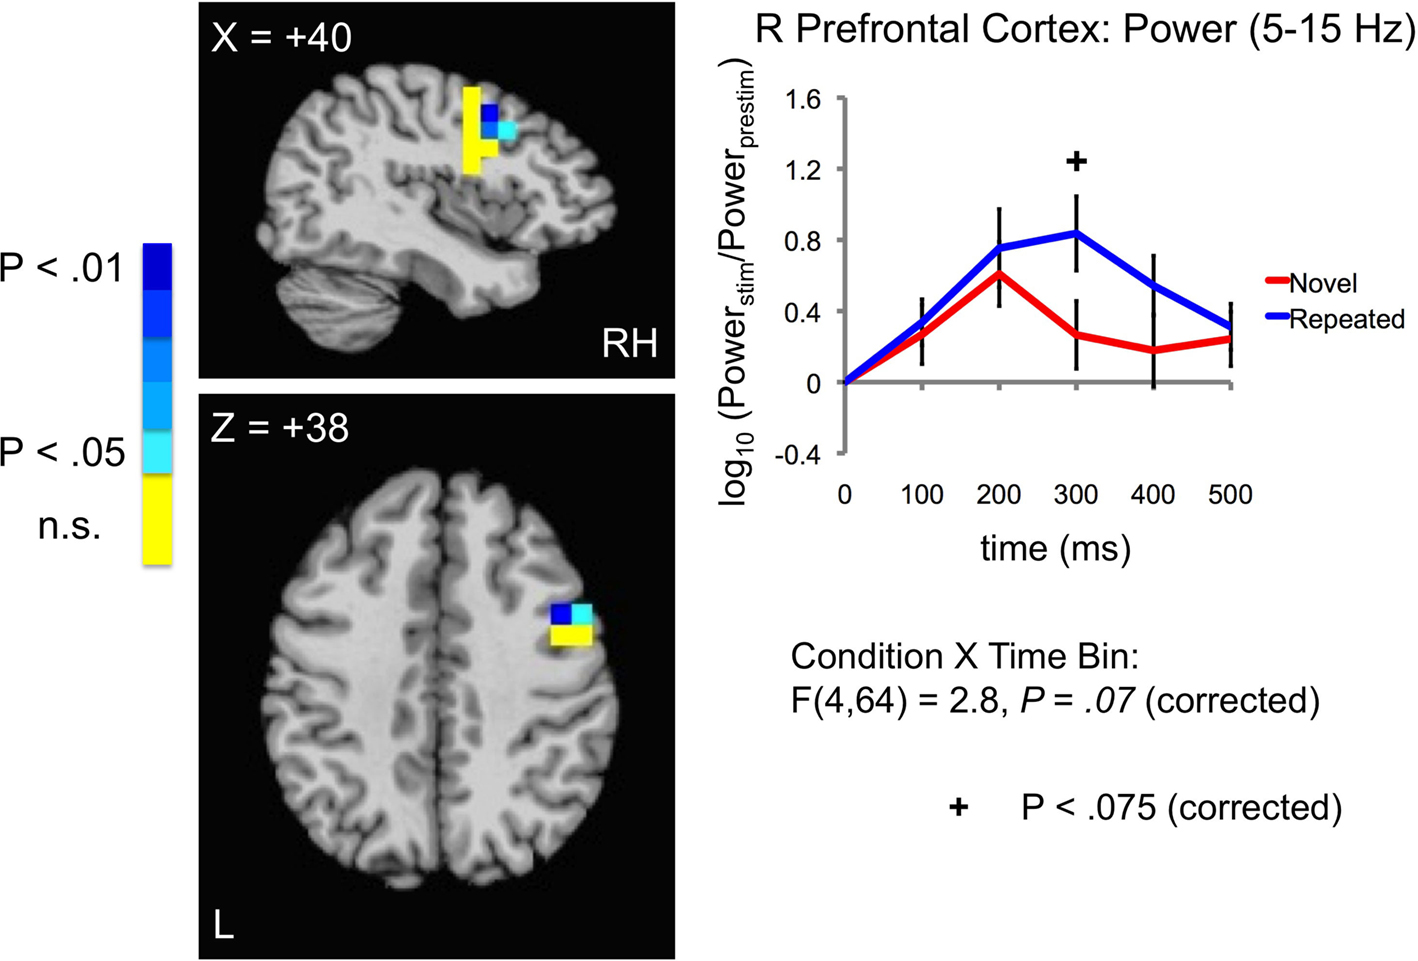
Figure 7. Increases in evoked low frequency power (5–15 Hz) for Repeated stimuli in right lateral prefrontal cortex. A statistical trend was observed for a Condition × Time Bin interaction in right lateral prefrontal cortex (5–15 Hz) (blue and red curves in right panel correspond to Repeated and Novel conditions, respectively). Power is shown in 100-ms time bins, with the time label corresponding to the end of each 100-ms period (e.g. 200 ms refers to the 100–200 ms bin). Post-hoc tests for individual 100-ms time bins showed a trend for increases in the 200–300 ms time bin. Curves were based on the entire right prefrontal mask (shown in Figure 4
). Conventions are as in Figure 5
A (blue sources indicate a significant Condition × Time Bin interaction; see colorbar for related P-values).
Our modified Bonferroni correction for multiple comparisons addressed two separate sets of ANOVAs (two frequency bands) within each ROI, but it permitted tests in five ROIs without correction, as these were specified a priori using previous fMRI studies (e.g. Keppel, 1991
). We carried out an additional set of permutation tests (Maris and Oostenveld, 2007
) in order to address the likelihood that the full set of tests that we conducted could have yielded our pattern of results by chance. On a given permutation, we randomly re-labeled the Novel and Repeated conditions for each subject and then re-conducted the same 10 mixed effects ANOVAs (5 ROIs × 2 frequency bands) as for the original data. We repeated this process for 10,000 permutations and evaluated the likelihood that our results could be observed due to chance as the proportion of iterations in which at least three individual ROIs yielded results at significance levels matching those in the original data (allowing any combination of main effects of Condition or interactions of Condition × Time Bin). The likelihood of observing three (or more) ROIs with results matching our hypothesis (greater power for Repeated trials) and at equivalent significance levels was determined to be P ≤ 0.0071 (71/10,000 permutations). Given that the actual results matched our hypothesis with no ROI showing opposite effects, this analysis provides strong evidence that our pattern of results is not due to alpha inflation that results from testing multiple ROIs.
We had no specific predictions about changes in evoked power in the gamma frequency range (35–60 Hz) with stimulus repetition, and we are aware of no studies showing such changes (Gruber et al., 2004
; Gruber and Muller, 2005
, have reported effects in scalp EEG for induced, but not evoked gamma). However, evoked power increases in the gamma frequency range were apparent in the sensor-level data (see Figure 3
), and we therefore carried out an additional set of unplanned comparisons for band- limited data in gamma frequencies (35–60 Hz). While we found significant evoked power increases relative to a 100-ms prestimulus baseline in several ROIs [striate/extrastriate, left fusiform, right prefrontal: F(1,16) > 6.23, P < 0.025, uncorrected, for all], as well as significant main effects of Time Bin [striate/extrastriate, left and right fusiform, left prefrontal: F(4,64) > 5.02, P < 0.001, uncorrected, for all], no main effects of repetition Condition or interactions of Condition with Time Bin were observed (all P’s > 0.19, uncorrected).
ROI Analyses: Effects on Total Power
In this study, we have evaluated the extent to which stimulus repetition leads to increases in low frequency evoked power. However, the selectivity of our observed changes to evoked, as opposed to induced or total power (non-phase-locked) cannot be inferred from these analyses alone. Accordingly, we conducted a separate set of ROI analyses in the same ROIs and frequency bands for local, non-phase-locked changes in power. For each subject, rather than averaging the virtual time series at each source location in the time domain (across trials) prior to calculating power (i.e. ER-SAM, Cheyne et al., 2007
), more standard non-phase-locked SAM analyses (Sekihara et al., 2001
) were carried out in which the power for each time bin per trial was calculated first and then averaged across trials, producing a measure of “total” power (i.e. event-related, but not phase-locked to stimulus onset). Repetition-related changes were then evaluated in the 5–15 Hz (theta/alpha), 15–35 Hz (beta), as well as the 35–60 Hz (gamma), frequency bands using the same mixed-effects ANOVA approach. We applied the same modified Bonferroni correction for multiple comparisons that were applied during the ER-SAM ROI analyses in order to afford more direct comparisons across the evoked power and total power results.
In the 5–15 Hz frequency band, tests of the grand mean power (across Condition and Time Bin) against zero (i.e. pre-stimulus baseline) revealed significant decreases in total power in striate/extrastriate, left and right fusiform ROIs [F(1,16) > 23.23, P < 0.0004, corrected, for all]. All five ROIs showed a significant main effect of Time Bin, with the pattern reflecting a gradual decrease in total power across bins [F(4,64) > 4.20, P < 0.009, corrected, for all]. However, there were no main effects of Condition or interactions of Condition with Time Bin. The results when collapsing across repetition condition are consistent with a pattern of alpha “desynchronization” that is often observed to stimulus onset in induced power analyses (e.g. Klimesch et al., 2008
). In the 15–35 Hz frequency band, tests of the grand mean power against zero (i.e. pre-stimulus baseline) revealed significant total power decreases (beta desynchronization) in all five ROIs [F(1,16) > 19.17, P < 0.001, corrected, for all]. Similarly, significant main effects of Time Bin were observed in all ROIs, reflecting a gradual decrease in total power across bin [F(4,64) > 15.38, P < 2.0e−08, corrected, for all]. In addition, an interaction of Condition and Time Bin was observed in left lateral prefrontal cortex [F(4,64) = 3.68, P < 0.02, corrected]. However, interpretation of this interaction was complicated by the fact that none of the individual time bins showed significant differences (uncorrected) between Novel and Repeated conditions. Lastly, in the 35–60 Hz frequency band, significant total power decreases (relative to pre-stimulus baseline) were observed in left and right lateral prefrontal cortex [F(1,16) > 12.15, P < 0.007, corrected, for both]. Significant main effects of Time Bin were also observed in striate/extrastriate, and left and right lateral prefrontal cortex, reflecting a gradual decrease in total power across bin [F(4,64) > 3.91, P < 0.02, corrected, for all]. There were no main effects of Condition or interactions of Condition with Time Bin for total power in gamma frequencies. In all, the analyses of total power failed to find strong repetition-related effects in any of the three frequency bands, suggesting that the local changes in evoked power reported above are associated more specifically with phase-locking to stimulus onset.
Correlations with Behavior
Comparisons of reaction times (RTs) at the group level showed significantly faster RTs to Repeated than to Novel stimuli (see Behavioral Data). Given the concomitant increases in 5–15 and 15–35 Hz evoked power for Repeated stimuli that we observed, also at the group level, we evaluated whether more specific correlations could be observed between evoked power and RT changes over subjects. Averaging over source locations that showed significant Repeated versus Novel differences at the group level (shown in shades of blue in Figures 5
–7
), we calculated the average power difference for each subject in the striate/extrastriate, right fusiform, and right lateral prefrontal cortex ROIs. We then correlated these power changes with average RT changes (i.e. “priming” magnitude) across subjects. We failed to find these more specific correlations by subject [5–15 Hz in right fusiform ROI: r(15) = 0.271, P < 0.3; 15–35 Hz in the striate/extrastriate ROI: r(15) = 0.143, P < 0.6; 5–15 Hz in 200–300 ms time bin of right lateral frontal ROI: r(15) = 0.144, P < 0.6]. The lack of findings in this regard could be due to weak power (i.e. too few subjects), different localization of peak sources across subjects, or the true lack of strong evoked power-behavioral correlations.
As predicted by recent computer modeling (Gotts, 2003
) and electrode recording studies in animals (Peissig et al., 2007
; Anderson et al., 2008
), we observed increases in low-frequency evoked power for repeated stimuli in ventral temporal and occipital cortical areas, as well as in prefrontal cortex. These repetition-related power increases were not observed in non-phase-locked measures of total power, indicating that they depended more specifically on the phase relationship to stimulus onset. These effects were detected early in stimulus processing (100–200 ms post-stimulus) for sources attributed to the right fusiform gyrus, consistent with the timing of similar effects observed in microelectrode recordings of local field potentials in monkey inferotemporal cortex (Anderson et al., 2008
). This agreement speaks to the utility of source localizing approaches in MEG such as ER-SAM (e.g. Cheyne et al., 2007
; Cornwell et al., 2007
). Similar effects have occasionally been observed in transcranial and scalp-recorded EEG/ERP studies (e.g. Schendan and Kutas, 2003
; Scott et al., 2006
; Peissig et al., 2007
), but most studies have not found early increases in ERP amplitude at the time of the N170 (e.g. Bentin and Peled, 1990
; Rugg et al., 1997
; Paller and Gross, 1998
; Swick, 1998
; Henson et al., 2003
; Kiefer, 2005
; Race et al., 2009a
). The lack of such effects may have to do with the broad spatial resolution of scalp EEG (i.e. averaging over local current sources that do show these effects with those that do not) and/or the absence of source modeling in previous studies. While the onset time of the repetition effects in our study did not interact significantly by ROI, effects appeared to occur slightly later in occipital than in fusiform cortex, suggestive of possible feedback effects between temporal and occipital cortex. Later effects in occipital relative to temporal cortex would be consistent with the predictions of a recent Bayesian model of stimulus repetition and learning effects (Henson, 2003
; Friston, 2005
, 2008
), in which suppressive feedback from higher-level cortical areas “predicts” and constrains activity in earlier sensory areas. Future studies with high spatiotemporal resolution should examine this relationship in greater detail, perhaps in electrical recordings that do not require source modeling [i.e. microelectrode recordings of LFPs or intracranial EEG, e.g. Puce et al., 1999
; Canolty et al., 2006
.
Our methods in the current study were optimized to detect spatially localized changes in evoked power, which are distinct from methods used to estimate cross-area phase-locking and coherence. Nevertheless, our findings regarding local power changes complement a recent source-localized MEG study (Ghuman et al., 2008
) in which responses at task-related sites in prefrontal and temporal cortex were more strongly phase-locked (∼10–15 Hz) across areas for repeated stimuli. In that study, the latency of the enhancement in across-area phase-locking was between 200–250 ms post-stimulus and predicted the magnitude of repetition priming across subjects. In our study, we have demonstrated that local evoked power in similar frequencies and at similar latencies can also increase with repetition. While we observed a correspondence between reaction time changes and evoked power changes by condition at the group level (Repeated vs. Novel), we failed to find more specific correlations of evoked power and behavioral changes by subject. This may be due to weak statistical power, spatial misalignment of peak effects in individuals, or the true lack of a strong evoked power–behavior relationship, with repetition-related changes in across-area phase-locking being more predictive of priming effects than local evoked power changes. Nevertheless, improved temporal coordination within and/or across task-related brain regions may be the mechanism by which reduced neural activity is able to elicit faster and more accurate behavioral identification in a more efficient manner. The exact form that improved temporal coordination takes at the single-cell level is still unclear. Our results are consistent both with improved precision in the times of individual spikes across populations of cells (as in the Gotts, 2003
, model), as well as in coordinated fluctuations in average firing rate.
The proposal of improved temporal coordination is notably similar to those developed in recent microelectrode recording studies in monkeys within the domains of attention, working memory, and visual search (Fries et al., 2001
; Pesaran et al., 2002
; Bichot et al., 2005
; Buschman and Miller, 2007
; Saalmann et al., 2007
; Gregoriou et al., 2009
). In such studies measuring spiking activity and LFPs simultaneously, improved performance has been associated with enhanced spike-LFP phase-locking (coherence) in the gamma frequency range both within (Fries et al., 2001
; Pesaran et al., 2002
; Bichot et al., 2005
), as well as across connected brain regions (Gregoriou et al., 2009
). Our results differ from these studies in that local increases in power are found in lower frequencies (theta/alpha and beta) and are phase-locked to the stimulus onset (i.e. evoked; compare to Bichot et al., 2005
; Gregoriou et al., 2009
). While the spatiotemporal integrative properties of cortical cells may not dictate identical facilitation for improved input coordination at all oscillation frequencies, computer simulations of single neurons have suggested that qualitatively similar effects can be observed at both high and low input frequencies (Salinas and Sejnowski, 2000
). The exact mechanism by which effects such as those reported here can occur over such long delays (tens of minutes) is unknown (the Gotts, 2003
, model focused on relatively short-term stimulus repetitions over a few seconds). However, the mechanism undoubtedly involves LTP/LTD and perhaps spike- timing-dependent synaptic plasticity (e.g. Markram et al., 1997
; Bi and Poo, 1998
; Sjöstrom et al., 2001
), which could potentially improve the temporal coordination of active neural ensembles. Another possibility is that long-term synaptic plasticity, by strengthening and weakening the appropriate synaptic connections on the neural representation of the prime stimulus, more effectively “resets” the ongoing low- frequency oscillations when repeated at a later time, permitting a few well-coordinated spike volleys to wave through the cortex and drive a more effective response (e.g. see Makeig et al., 2002
; Lakatos et al., 2007
, 2008
, for similar proposals in cross-modal integration and attention). Future work in microelectrode recordings with monkeys and in intracranial recordings taken from humans (e.g. Puce et al., 1999
; Canolty et al., 2006
) will be critical in evaluating these possibilities.
The experience-dependent effects in the current study were lateralized to the right hemisphere. It has not escaped our attention that previous BOLD fMRI studies of picture naming have tended to show more left-lateralized responses (e.g. van Turennout et al., 2000
, 2003
; Kan and Thompson-Schill, 2004
; de Zubicaray et al., 2006
; Graves et al., 2007
; Mechelli et al., 2007
). The right lateralization of effects in the current study may indicate that it is primarily the visual form aspects of object identification, rather than verbal aspects of name retrieval, that were facilitated. On this point, it is important to note that identical repetitions of visual stimuli, as were used in our study, lead to RS in the right, as well as in the left hemisphere (e.g. Koutstaal et al., 2001
; Wig et al., 2009
). A recent visual object categorization experiment using fMRI has also found right-lateralized effects of experience in occipitotemporal and prefrontal cortex (Jiang et al., 2007
). Studies that orthogonalize different system-level task components that contribute to priming effects (e.g. Horner and Henson, 2008
; Race et al., 2009b
; Wig et al., 2009
) should ultimately be useful in clarifying this issue.
The authors declare that the research was conducted in the absence of any commercial or financial relationships that could be construed as a potential conflict of interest.
This work was supported by the National Institute of Mental Health Intramural Research Program. We’d like to thank Tom Holroyd, Richard Coppola, and Avniel Ghuman for technical advice and helpful discussions.