
- Department of Neuroscience, Columbia University, New York, NY, USA
Sensory decisions may be influenced by non-sensory information regarding reward magnitude or reward likelihood. Given identical sensory information, it is more optimal to choose an option if it is a priori more likely to be correct and hence rewarded (prior reward likelihood bias), or if it yields a larger reward, given that it is the correct choice (reward magnitude bias). Here, we investigated the ability of macaque monkeys to integrate reward magnitude and prior reward likelihood information into a categorical decision about stimuli with high signal strength but variable decision uncertainty. In the asymmetric reward magnitude condition, monkeys over-adjusted their decision criterion such that they chose the highly rewarded alternative far more often than was optimal; in contrast, monkeys did not adjust their decision criterion in response to asymmetric reward likelihood. This finding shows that in this setting, monkeys did not adjust their decision criterion based on the product of reward likelihood and reward magnitude as has been reported to be the case in value-based decisions that do not involve decision uncertainty due to stimulus categorization.
Introduction
Typical decisions depend on sensory information that is evaluated with respect to certain rules as well as non-sensory information such as reward magnitude and reward likelihood. Sensory evidence and non-sensory information may favor different choices. Based on signal detection theory it is possible to show that there is an optimal way to integrate reward information by shifting the decision rule/criterion as a function of the unconditional expected value of the options (see below). The aim of this experiment was to test whether macaque monkeys, one of the primary animal models of human decision making, integrate sensory and reward information optimally from the point of view of signal detection theory. In particular, we tested whether manipulations of reward magnitude and reward likelihood have the same effect on the monkeys’ decision criteria as predicted by signal detection theory.
Decision making tasks can incorporate several elements: sensory evidence, rules, and outcome values. In value-based decision tasks subjects choose among options based on their payoffs which are learned either by instruction or experience (Sugrue et al., 2005; Rangel et al., 2008). In sensory decision tasks, subjects infer the correct choice from the sensory information which is evaluated with respect to a particular decision rule (Romo and Salinas, 2003; Schall, 2003; Gold and Shadlen, 2007). Correct choices are rewarded equally regardless of which option was chosen. Real decision making, however, is oftentimes a mixture of sensory and value-based decision making: subjects choose between options which differ with respect to the rewards they offer based on sensory information that may help guide the decision process toward the correct choice. The ensuing problem which is a mixture between value-based and sensory decision making will be referred to as biased sensory decision making. In biased sensory decision tasks, the optimal choice will depend on both, sensory and non-sensory value information.
A typical example of biased sensory decision making is medical diagnostics: based on haptic or visual information a doctor needs to decide, for example, if a tumor is present or not. On the one hand, a random subject will be much more likely to be healthy, thus making the “no tumor” diagnosis almost a sure bet. On the other hand, failing to correctly diagnose a tumor will come at a much higher cost. In biased sensory decision tasks we can define the unconditional expected value as the product of reward (or cost) magnitude and the prior probability of the option being correct and hence rewarded. Based on this definition it can be shown that the optimal decision criterion which maximizes payoffs in the long run is a function of unconditional expected value (e.g., Green and Swets, 1966; Feng et al., 2009 or Materials and Methods). Hence, the optimal decision criterion is the same regardless of whether an option is a priori twice as likely to be correct, or associated with a reward that is twice as large.
The main finding in the field of value-based decision making is that the choice behavior of subjects may be approximated as a function of expected value. Human as well as non-human subjects will in general prefer the option with the largest expected value (matching law, e.g., expected utility theory, e.g., Bernoulli, 1738 for systematic deviations from expected utility theory see e.g., Kahneman and Tversky, 1979; Herrnstein, 1961;). As subjects seem to be able to estimate expected value of different response options and change their behavior accordingly, it is tempting to assume that the same mechanisms may also mediate the placement of decision criteria in biased sensory decision tasks. If this were the case, the shift of decision criteria could be approximated as a function of unconditional expected value.
It was the aim of the present study to investigate the relation between unconditional expected value and decision criteria in biased sensory decision tasks. In particular, we wanted to test whether changes of unconditional expected value have the same impact on decision criteria when caused by reward magnitude as opposed to prior reward likelihood manipulations. Our null hypothesis assumes that the neural network responsible for setting decision criteria in biased decision tasks will operate as a function of unconditional expected reward. In other words, we assumed that doubling the reward magnitude of an option has the same effect on decision criteria as doubling the likelihood of that option being correct, and hence rewarded. We speculate that neurons coding expected value/utility (Fiorillo et al., 2005; Tobler et al., 2005) could serve as the input to a network that could adjust decision criteria as a function of expected value/utility. Contrary to our expectations and predictions from signal detection theory, we found that decision criteria were only affected by manipulations of reward magnitude, and not by prior reward likelihood.
Materials and Methods
Subjects
Subjects were three male macaque monkeys (monkeys L, G, and C). At the time of the experiments the animals were between 5 and 9 years old and weighted between 8 and 12 kg.
Monkey C exhibited a strong response bias even in the absence of any reward manipulations. As this bias was probably due to damage caused during previous electrophysiological recordings, he was excluded from the second half of the experiments. Monkeys were prepared for the experiments by surgical implant of a post for restraining head movements and a scleral search coil to monitor eye-position. All methods were approved by the Institutional Animal Care and Use Committee at Columbia University and the New York State Psychiatric Institute.
Training and Prior Experience of the Animals
Our goal was to approximate the natural behavior of macaque monkeys in a biased decision making task. To do so we selected the animals according to two criteria. First, we made sure that our subjects were never before exposed to asymmetric reward magnitude or reward likelihood manipulations. Second, we used animals that had extensive experience (>12 months) with the sensory decision task in question. This reduced the potential effects of training history. All of the training procedures that were used (see below) are standard and did not encourage a particular pattern of behavior in the main experiment. In particular, we used standard shaping procedures to introduce the animals to the task. Prior to the implantation of the head-post, animals learned to touch a touch-screen for fluid rewards. Next, they learned to touch a fixation spot in order to initiate a trial and then, to touch a single response target following the appearance of particular visual stimulus. Once the monkeys were comfortable with the task, we started introducing a second distracter target on some fraction of the trials. Monkeys were only rewarded for choosing the correct target. Once the monkeys performed well on the task with the distractor target (>80% correct), a head-post was implanted and eye-movements were tracked either with a scleral search coil or an infrared eye-tracker. The monkeys quickly learned to fixate a fixation spot for fluid rewards and switched naturally from signaling their choices in the decision task with manual responses to eye-movements. At the time of the experiments reported here, the monkeys had extensive experience with the sensory decision task (>12 months) and potential effects of the training procedure on the outcome of the experiments were minimal.
Setup
The animals performed the task in an upright primate chair while head-movements were restrained by a surgically implanted head-post. Visual stimuli were generated and controlled by a CRS VSG2/3F video frame buffer. Stimuli were displayed on a 60-Hz CRT-monitor (1280 × 1024 pixels) which was placed at a distance of 50 cm. For two of the animals (monkey L and C), eye position was recorded with a scleral search-coil (CNC Engineering, Seattle, WA, USA) and digitized at a rate of 500 Hz. Prior to the implantation of an eye-coil half way through the experiments, eye position of monkey K was monitored with an infrared camera system and the free eye tracking software i_rec with a temporal resolution of 60 Hz.
Biased Sensory Decision Task
Monkeys categorized the speed of a moving random dot pattern as either fast or slow by making a saccade to a green and red target, respectively (see below or Figure 1A for more details). In the neutral condition, stimuli were selected such that all responses were equally likely to be correct and all correct responses were rewarded equally. On different days, we manipulated either the reward magnitudes associated with correct responses (reward magnitude bias) or biased the stimulus selection such that one of the responses had a higher likelihood of being correct and hence rewarded (reward likelihood bias). Both of these manipulations occurred in the context of a category bias condition during which higher reward magnitude/likelihood depended on the categorization, e.g., the “slow” category, i.e., the red target, was associated with higher reward magnitude/likelihood (see Figure 1B). Similarly, we implemented a motor bias condition for which higher reward magnitude/likelihood was associated with a particular motor response, e.g., higher reward magnitude/likelihood for a rightward saccade.
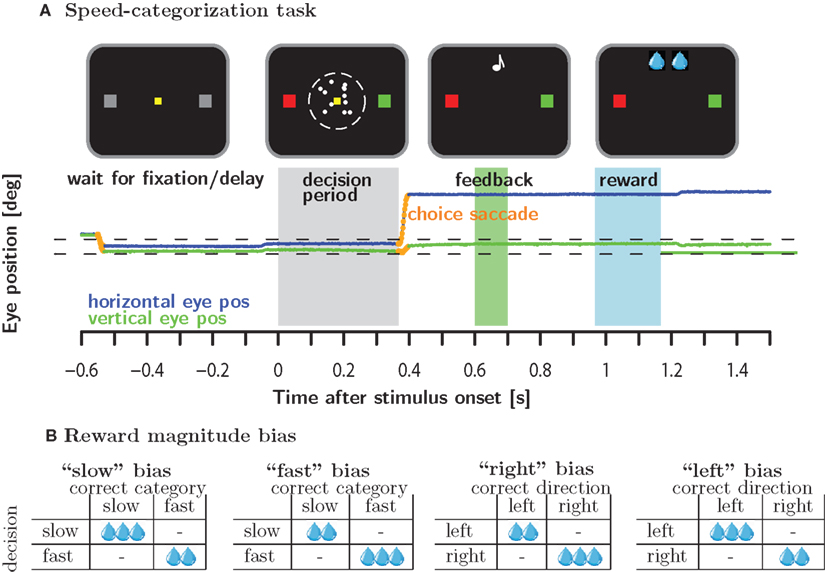
Figure 1. Methods. (A) Macaque monkeys were trained to categorize the speed of moving random dots as either slow or fast relative to a criterion speed which was learned by trial and error. Monkeys categorized speeds by making a saccade to the red and green target to signal slow and fast speeds, respectively. (B) In the reward magnitude condition, correct responses were either rewarded equally or according to one of four different asymmetric reward schedules. Reward magnitude was manipulating by changing number of valve openings as indicated by the number of water drops. A single valve opening corresponded to approximately 0.07 ml of water.
This gave rise to 2 (reward magnitude/likelihood) × 2(category/motor) × 2(fast/slow for category bias or right/left for motor bias) = 8 different bias conditions. On a given day, a subject experienced one block of trials from the eight bias conditions embedded in two blocks of neutral trials: neutral (200–400 trials) – biased (>600 trials) – neutral (until satiated). The rational for embedding the biased condition in blocks of neutral trials was to examine the evolution of the behavioral bias from a neutral starting point. The reward magnitude and reward likelihood bias conditions were run in separate blocks of 4 days each, during which we presented the four possible bias conditions: “slow” and “fast” category bias as well as “right” and “left” motor bias.
On different blocks of 4 days we used different reward magnitude asymmetries: the number of valve openings (see below) for the favored versus the unfavored option could be either 4 to 3, 4 to 2 or 3 to 2. In the reward likelihood condition, the favored option was always twice as likely to be correct than the unfavored option.
An individual trial was initiated when the subject looked at a yellow fixation target in the center of the monitor. After a random delay, a coherently moving random dot pattern appeared in a 5° circular window around the fixation target. At the same time, the two gray potential saccade targets 7° to the left and right of the fixation spot turned red and green, respectively. The position of the red and green target to the left or right of the fixation point was chosen randomly. The monkeys were trained to associate slow speeds with the red target and fast speeds with the green target. Subjects signaled the outcome of the categorization process by making a saccade to the target with the corresponding color. The subjects were free to signal their choice at any time after stimulus onset. For each subject, the stimulus speed of a particular trial was drawn randomly from a set of 6–10 predetermined speeds. The speeds were spaced symmetrically around the cutoff speed of 5.5°/s. The range of speeds was adjusted for each subject individually to account for differences in performance.
Following a valid choice saccade (see below) and a random uniformly distributed delay (200–500 ms), auditory feedback was delivered. A high tone (880 Hz) indicated a correct response, a low tone (440 Hz) indicated a wrong response. If the response was correct, the subjects were required to keep fixating the target in order to receive the fluid reward associated with the correct response. The delay between the auditory feedback and the fluid reward was uniformly distributed between 350 and 650 ms. Reward magnitude was varied exclusively by changing the number of valve openings. The duration of an individual valve opening was constant over all sessions and animals and corresponded to approximately 0.07 ml of water. Each valve opening was accompanied by a very high tone (1200 Hz). Hence, the subjects could easily track reward magnitude by monitoring the number of tones. Multiple valve openings were separated by a pause of 100 ms. Reward delivery was aborted if fixation was broken even if the intended number of valve openings had not been reached. The strict regulation of eye-movements even after the decision can be understood in the light of upcoming electrophysiological recordings in prefrontal cortex which is known to comprise neurons with strong oculomotor selectivity.
Eye movements during the task were restricted to a single saccade to one of the targets after stimulus onset (choice saccade). If the eye left the fixation window prior to stimulus onset, the trial was aborted. Similarly, if the eye left the fixation window after stimulus onset and failed to re-fixate on one of the two saccade targets, the trial was considered incomplete. Incomplete trials were indicated by a very low tone (220 Hz) and were never rewarded. If the eye failed to remain on the target of the initial saccade until the auditory feedback was given the trial was considered revised. Revised trials were never rewarded and indicated by a very distinctive auditory event: an upward followed by a downward sinusoidal sweep.
Incomplete and revised trials were not included in the analysis. In addition, we excluded complete trials with unrealistically short and uncharacteristically long reaction times. The lower reaction time cutoff was set at 110 ms. The upper cutoff was chosen as the 97.5 percentile of the reaction time distribution of the session in question.
In addition to the decision trials described above, subjects performed 10% instructed trials. In such trials the subjects did not have to categorize the stimulus since only a single saccade target appeared on the screen. In addition to the instructed trials, the monkeys also performed 10% fixation trials. During a fixation trial, only the saccade targets and not the random dots were presented on the screen. Monkeys were rewarded if they maintained fixation. This condition served as a control condition for electrophysiological recordings. In the current study it had no purpose other than to get the monkeys accustomed to it.
The timing parameters of the task differed slightly between the animals. For two of the monkeys the random delay prior to stimulus onset was uniformly distributed. For the initial sessions of monkey L the delay ranged between 300 and 500 ms, for monkey C the delay ranged between 200 and 500 ms. For monkey K as well as for the later sessions of monkey L the distribution of the delays followed a truncated exponential distribution with a rate parameter 500 ms and a maximum value of 1500 ms. In addition, a fixed delay of 500 ms was added such that the total delay ranged between 500 and 2000 ms.
Value-Based Decision Task
In addition to the biased sensory decision task described above, subjects also performed a value-based decision task. The value-based decision task was designed to be as similar as possible to the biased sensory decision task, with the following modifications: (1) The sensory information (motion stimulus) was removed. Instead, subjects were free to choose either saccade target, but the targets were not always rewarded equally. Subjects were cued when to make a saccade by the disappearance of the fixation spot. (2) We used a round and blue fixation point as well as round saccade targets to facilitate switching between the two tasks for the monkeys. (3) In the biased sensory decision task only the correct target (as determined by the sensory stimulus) was rewarded. The difficulty of the sensory discrimination was adjusted such that to average number of correct responses was between 70 and 85%. Lower reward rates dramatically reduced the animals’ compliance. To maintain a similar reward rate on the value-based decision task, we set the reward probability in the neutral condition to 60 and 80% for monkeys K and L, respectively. After the first week, we were able to change the reward rate from 80 to 60% for monkey L without losing compliance. In different sessions, responses were rewarded either with 3 or 4 valve openings. Within a single session, response magnitude never varied. A bias in favor of one of the response alternatives was introduced by setting the probability of the rewarded option to 80%, while setting that of the other option to 40%. (4) To encourage exploration of the alternatives we increased the percentage of instructed trials, i.e., trials with only a single response target. Initially we used 50% instructed trials. We changed this value to 40% after 1 week to increase the number of choice trials. In the biased sensory decision task, we were able to use a lower rate of instructed trials, because the easy trials served a similar purpose as the instructed trials. Except for these four differences, the biased sensory and the value-based decision tasks were identical.
Data Analysis
In order to quantify the behavioral bias in different reward conditions of the biased sensory decision task, standard psychometric functions were fit to the data using a maximum likelihood method. To that aim, responses were binarized, with 0 corresponding to “slow” and 1 to “fast” judgments. The psychometric functions were modeled as cumulative Gaussians with three parameters which described the point of subjective equality (PSE, represented by c), the just noticeable difference (JND, represented by σ) and lapse parameter λ with 0 ≤ λ < 0.5:

Here Φ corresponds to a Gaussian distribution function. The lapse parameter is thought to model trials in which the animal, for whatever reason, does not perform the task and randomly chooses a response.
Statistical significance was assessed with likelihood-ratio tests of appropriately constructed nested models. For example, to test for significant deviations of the PSE from 5.5 pix/frame (the actual category boundary between slow and fast speeds) we compared likelihood of a model in which PSE was allowed to vary freely with a model in which it was enforced to be equal to 5.5 pix/frame.
In addition, confidence intervals of the parameter estimates were assessed with a bootstrap procedure. To that aim we randomly generated binomially distributed responses B(n,p) for each condition, with n corresponding to the number of trials in a particular condition and p corresponding to the percent “fast” choices in that condition. A new psychometric function was fit to this bootstrapped data set. This procedure was repeated 1000 times yielding a set of 1000 parameter estimates.
Signal Detection Theory
Under the reasonable assumption that subjects will try to maximize reward, signal detection theory makes precise predictions about the shift of the decision criterion. In the following we will assume that the neuronal representation X of a stimulus speed s is variable from trial to trial, and can be represented as a Gaussian distribution with mean s and variance σ: X ∼ N(s,σ). Further, it is assumed that whenever the neuronal representation X exceeds a certain criterion value c, the stimulus is categorized as “fast.” In this setting, a bias will be represented by a change in the criterion value c.
Let us assume that r1/2 represents the reward magnitude associated with the two choices, respectively. Let sc be the actual cutoff speed that separates slow from fast speeds. The expected reward for a particular choice, e.g., “slow,” is given by the product of reward magnitude for this choice and the probability that this choice is correct. The mathematical description is given by Eq. 2:

Assuming that there are only two possible stimulus speeds spaced symmetrically around the cutoff speed: s1/2 = sc ± δ we can rewrite Eq. 2:
Here Φ indicates the density-function of a normal distribution. The first two terms together represent the non-sensory information, i.e., the reward magnitude and the prior reward likelihood of an option. The third term represents the sensory information, i.e., given the sensory evidence, how likely is option one or two to be the correct one. The cutoff c which optimizes expected reward can be found by equating the expected value for the two options:

In this form it is easy to appreciate that changing the reward magnitudes, i.e., r1/2 has the same effect as changing the reward likelihood priors, i.e., P(s = s1/2). Further, we can define r1/2P(s = s1/2) as the unconditional expected values of the two options which are known before the visual stimuli come on. Based on this definition, we can conclude that the optimal decision criterion is a function of the unconditional expected value.
In the current experiment we used six different speeds symmetrically spaced around the cutoff speed: si = sc ± δ1,2,3. Equation 4 can easily be expanded to accommodate this situation:
Here  denotes the reward associated with a correct “slow” categorization and vice verse. For a more detailed treatment see Feng et al. (2009). In the current context we determined the optimal shift c that solves Eq. 6 numerically.
Results
The aim of our experiment was to investigate sensory decision criteria of macaque monkeys when they choose between response alternatives differing with respect to reward magnitude or prior reward likelihood. For each experimental session, we analyzed two groups of trials: the block of neutral trials completed prior to the introduction of the biased reward schedule and the block of biased trials. We excluded the trials immediately following the introduction of the new reward schedule to allow some time for adjusting the decision criteria to the new reward contingencies. The minimum learning cutoff we used was 100 trials. In conditions for which a large number of biased trials were available we also tested the effect of excluding more trials (up to 600 trials). No qualitative differences were found.
Using nested likelihood tests described in section “Materials and Methods” we tested the following null-hypotheses for every recording session: (H01) The monkeys do not shift their decision criterion in response to the manipulations of reward contingencies, i.e., the decision criterion in the neutral and biased condition are identical: PSEn = PSEb. (H02) The stimulus discriminability does not change in the biased compared to the neutral condition: σn = σb. (H03) The monkeys adopt the optimal decision criterion in the neutral condition: PSEn = 5.5 pix/frame. (H04) In the biased block, the monkeys adopt a decision criterion at the optimal value deducted from signal detection theory.
Reward Magnitude Bias
Figure 2 shows the results of the initial four reward magnitude sessions (fast, slow, rightward, and leftward bias). For all three animals the decision criteria in the biased condition differ from the one in the neutral condition. The optimal decision criterion predicted by signal detection theory is indicated by the gray lines. In most cases, the observed decision criteria are shifted farther than optimal.
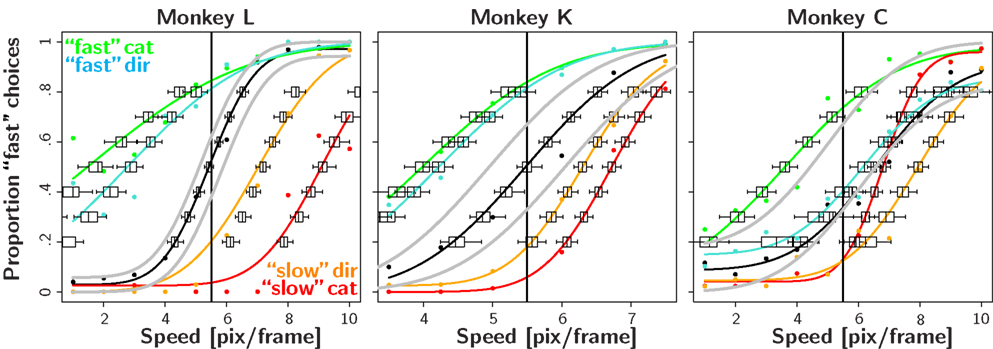
Figure 2. Reward magnitude bias. Psychometric functions for the first four recording session in the reward magnitude condition: the black color corresponds to the neutral condition averaged over all 4 days. The red and green colors correspond to trials in the slow and fast category bias condition, respectively. In order to visualize the effect of the direction bias we separated the trials into two conditions: The so called “slow direction bias” condition incorporates all trials where the red target could be reached by a saccade in the biased direction, i.e., red target on the left side during leftward bias and red target on the right side during the rightward bias. Similarly, the “fast direction bias” condition corresponds to trials where the green target could be reached by a saccade in the biased direction. The orange and cyan color corresponds to the slow and fast direction bias, respectively. The box and whisker plots indicate confidence intervals of a bootstrap procedure (see Materials and Methods for details). The gray lines indicate the predictions of the ideal observer analysis which maximizes reward given the stimulus discriminability observed in the neutral condition. The results show a clear pattern: unbiased behavior in the neutral condition and large shifts of the PSE in the expected direction for the biased conditions.
To quantify the results we tested the four null-hypotheses H01–H04 for every recording session (see Table 1). The results for H01 indicate that in almost all cases (45/48), the decision criteria shifted significantly in the direction predicted from the reward asymmetry. This finding provides very strong evidence for the assumption that reward magnitude manipulations have a strong effect on the sensory decision criteria.
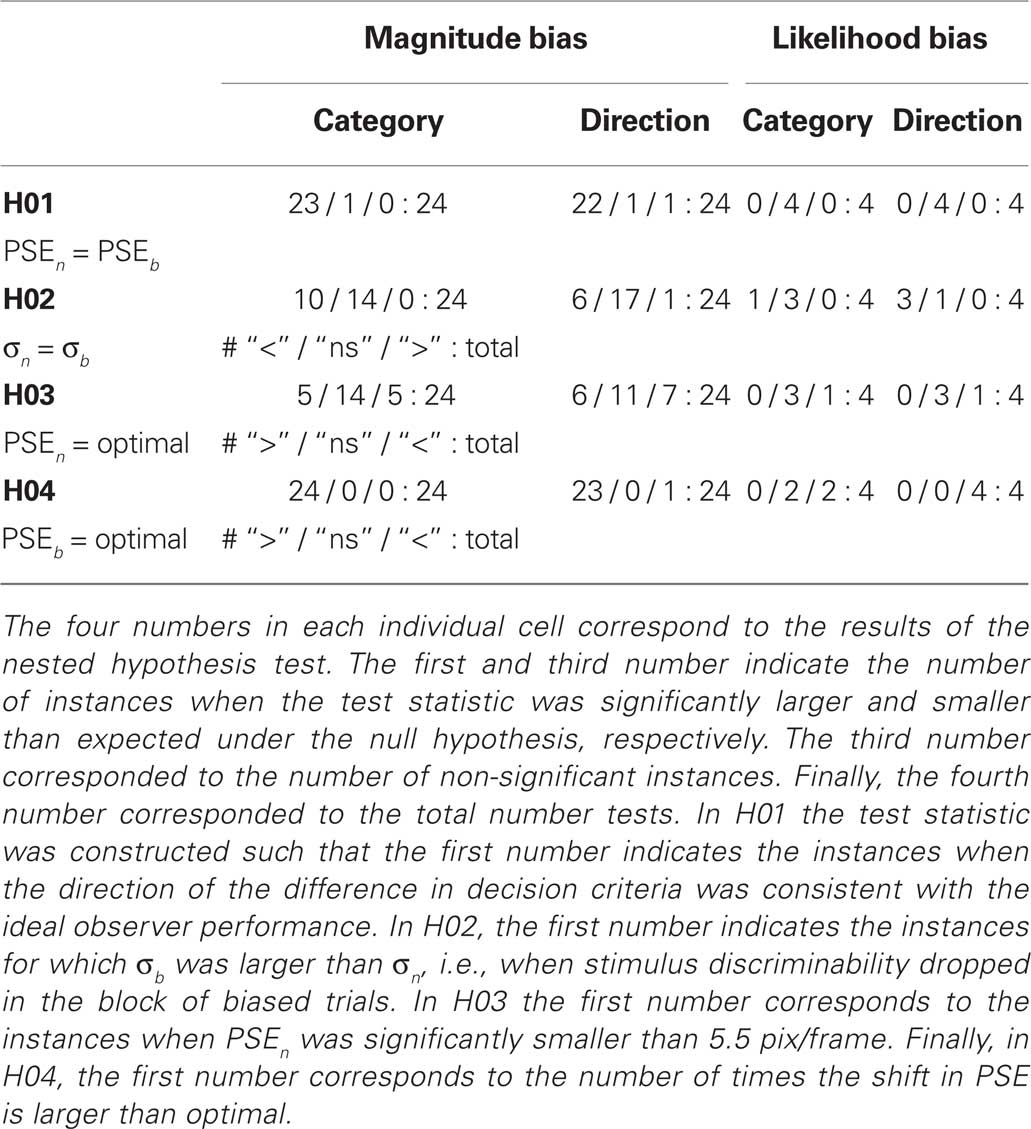
Table 1. Summary of the reward magnitude and reward likelihood experiments.
H02 tested whether stimulus discriminability differed in the neutral and biased condition. In 31 out of 48 cases this was not the case. For 16 out of the remaining 17 cases, we observed a decrease in stimulus discriminability in the biased condition (see also Figure 2). Additional analyses indicated that all animals exhibited this trend. However, it was most pronounced for monkey L which also tended to show the strongest effect of reward magnitude on the shift of the decision criteria (see for example Figure 2 or Table 2).
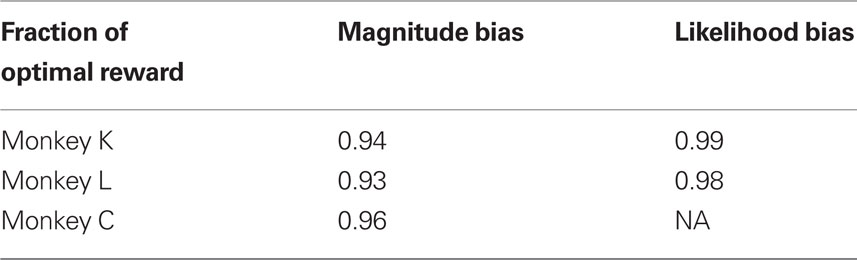
Table 2. Fraction of actual and optimal reward volume that could have been earned with the optimal decision criterion. Especially in the magnitude bias condition monkeys loose a considerable amount due to the suboptimal integration of sensory and non-sensory information.
H03 tested whether the decision criteria were optimal, i.e., at 5.5 pix/frame, in the block of neutral trials. In 25 out of 48 sessions the placement of the decision criteria was not significantly different from optimal. Overall, there was no systematic trend for decision criterion to deviate from 5.5 pix/frame in a particular direction. This is in part due to the fact that monkey C which did exhibit a systematic tendency to misplace the decision criterion in the neutral condition only performed four sessions before being excluded from the experiment. The large percentage of significant deviations from optimality indicate non-systematic daily fluctuations in the decision criteria. It is possible that these fluctuations are due to residual carry-over effects from the biased reward schedule presented on the previous day.
H04 tested the optimality of the decision criterion in the biased trial blocks. In 47 out of 48 instances, the observed shift of the decision criterion was significantly larger than the optimal shift. Note that the stimulus discriminability σ?tended to decrease in the blocks of biased trials (see H02). Hence, we used the lower stimulus discriminability in the biased block indicated by σb to estimate the optimal shift. Thus, the observed overcompensation cannot be attributed to reduced stimulus discriminability in the biased condition. Figure 5 illustrates the deviations from optimality in the neutral as well as the magnitude bias condition.
Further, we analyzed the impact of this overcompensation on the average reward magnitude. To that aim we estimated the expected reward magnitude that would be obtained using the optimal decision criterion and compared it with the expected reward magnitude predicted from the measured decision criterion. Table 2 reports the fraction of the expected reward magnitude using the actual and the optimal decision criterion. By over-adjusting the decision criterion, the three monkeys lost on average 7, 6, and 4% of the possible reward magnitude, respectively.
Prior Reward Likelihood Bias
Figure 3 shows the results in the biased reward likelihood condition for two monkeys. As monkey C had exhibited a natural bias even in the absence any reward manipulation, he was excluded from the remainder of the experiment. In stark contrast to the biased reward magnitude condition, there seemed to be no effect of prior reward likelihood on the placement of the decision criteria. This observation is backed by the nested likelihood-ratio tests (Table 1). The results from H01 show that summed over both animals, significant differences between the biased and the neutral condition were found in none of the eight cases. Similarly, the results from H04 indicate that the decision bound was placed significantly suboptimal in all eight instances. However, in contrast to the reward magnitude condition where the subjects shifted their criterion too far here they did not shift it far enough. Results from H02 and H03 do not seem to differ significantly from the ones found in the reward magnitude condition.
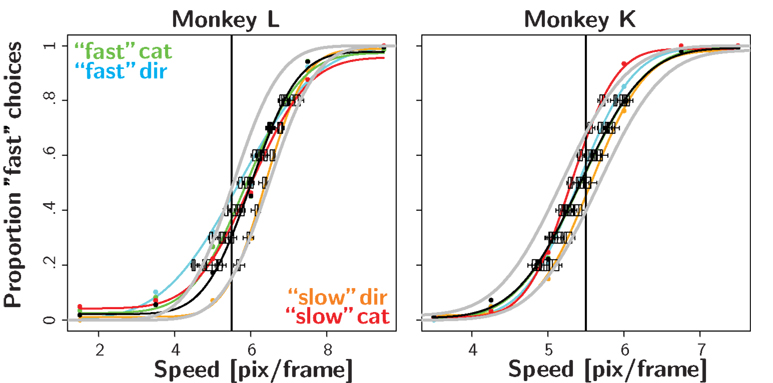
Figure 3. Reward likelihood bias. Psychometric functions for the first four recording session in the reward likelihood condition. Conventions as in Figure 2. In contrast to the reward magnitude condition, monkeys did not shift their PSE in the biased conditions.
Due to the suboptimal decision criteria, monkeys lost some fraction of the possible reward volume. However, the losses were considerable smaller than in the reward magnitude condition. Monkeys K and L lost 1 and 2%, respectively (see Table 2).
Figure 4 summarizes the main result regarding the differences between the reward magnitude and reward likelihood condition (see also Figure 5). In all but one of the cases, the observed shift in the reward magnitude condition is significantly larger than the optimal shift. In contrast, for six out of eight instances in the reward likelihood condition, the observed shift is significantly smaller than the optimal shift. Figure 4B illustrates the temporal progression of the results. The lack of an adjustment of the decision criterion in the reward likelihood condition can not be attributed to a linear trend over time: Overcompensation in the reward magnitude condition was found both before and after the reward likelihood sessions.
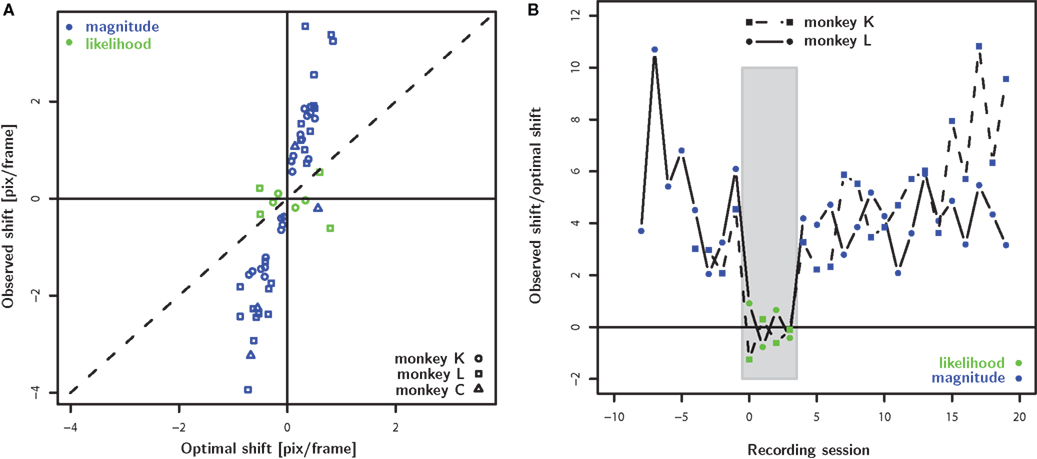
Figure 4. Population analysis. (A) The observed shift of decision criterion (PSE – 5.5 pix/frame) is plotted as a function of the optimal shift which was calculated based on the stimulus discriminability observed the same day in the biased condition. The green and blue color corresponds to the reward magnitude and reward likelihood conditions, respectively. In the reward magnitude condition, the animals consistently shift their decision criterion farther than optimal. In contrast, the decision criterion does not shift systematically in the reward likelihood condition. (B) The fraction of observed and optimal shift as a function of temporal progression of the recording sessions aligned to the first reward likelihood session. For both monkeys we observed overcompensation in the reward magnitude condition prior to and after the sessions which failed to find any compensation for the reward likelihood condition.
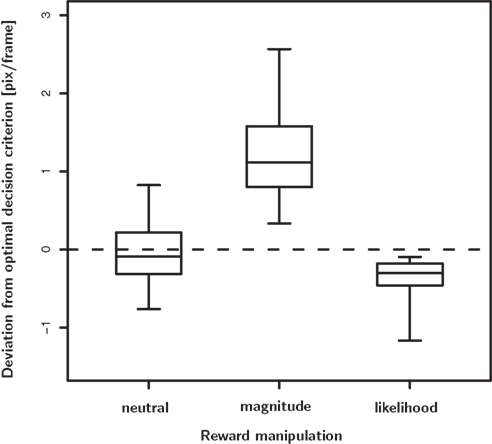
Figure 5. Deviation from the optimal decision criterion in the neutral, reward magnitude and reward likelihood condition. In the neutral condition there is no systematic deviation from optimality, despite considerable unsystematic variability. In the reward magnitude and the reward likelihood condition we do observes systematic deviation from optimality. In the magnitude bias condition subjects shift their decision criterion too far, i.e., they over-compensate. In contrast, they do not shift their decision criterion far enough in the likelihood bias condition, i.e., they under-compensate.
Motor Versus Category Bias
In each of the biased reward conditions (biased magnitude and biased likelihood), the bias was applied either to response direction (left or right) or response category (fast or slow). Visual inspection of Figure 2 suggests that the effect of reward magnitude is larger in the category bias condition than in the direction bias condition. In fact, for the subset of sessions presented in Figure 2 this difference is significant for two of the monkeys. We further tested this assumption on the population level. To that aim we used a linear model to predict observed shift as a function of optimal shift. We tested whether the fit of this model is improved by allowing the slope to vary as a function of bias type, i.e., category or motor bias. Our results indicate clearly that this is not the case (p = 0.94). Overall, our results indicate that biased reward schedules have the same effects on the shift of decision criteria in category and motor bias conditions.
Value-Based Decision Task
In the biased sensory decision task we found a striking dissociation between the subjects’ response to the reward magnitude and reward likelihood manipulation. To assure that these differences were not due to a general insensitivity of the subjects to reward likelihood, we tested their behavior in a standard value-based decision task. We found that both subjects readily adjusted their behavior to changes of reward likelihood in this task. Figure 7 shows how the subjects’ preference shifts toward the option that is twice as likely (80%) to be rewarded as the other option (40%). Averaging the responses from trial number 201 to 1200 after the introduction of the asymmetric reward schedule, monkey K and monkey L chose the favored option 63 and 26% more often than the other, respectively. Monkey K adjusted his choices considerably faster than monkey L. Monkey L responded less to the reward likelihood manipulation, especially in the second half of the experiment. Instead his behavior was strongly biased toward his naturally preferred response option, a rightward saccade. Nevertheless, the results show that both monkeys responded robustly to the changes in reward likelihood. For 10 out of 11 sessions we find that the animals choose the biased option significantly more often in the biased block than in the neutral block of trials (two-sample test for equality of proportions with continuity correction, α = 0.05).
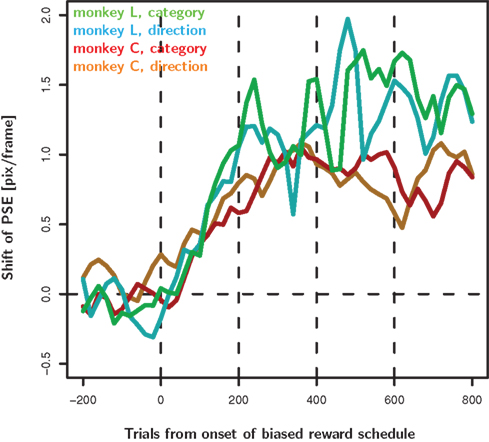
Figure 6. Decision criteria as a function of time from the introduction of the biased reward schedule. For each speed we calculated moving averages of percent “fast” choices as a function of time from the onset of the biased reward schedule. The moving average was calculated with a box-car kernel of ±25 trials. We fit a psychometric function to the data from each time-point in the moving average. Here we show the time-resolved PSE of the fitted functions. For both monkeys in both bias conditions, the decision criteria start moving in the predicted direction immediately after the introduction of the biased reward schedule. They reach a reasonably stable level after about 200 trials. Note that the graph averages over all trials of a given monkey and condition. Hence, a single line comprises data of e.g., the “fast” and “slow” category bias regardless of the reward asymmetry used on that particular day (4 versus 2 or 4 versus 3, or 3 versus 2 valve openings). These different conditions are balanced only for the first 600 trials.
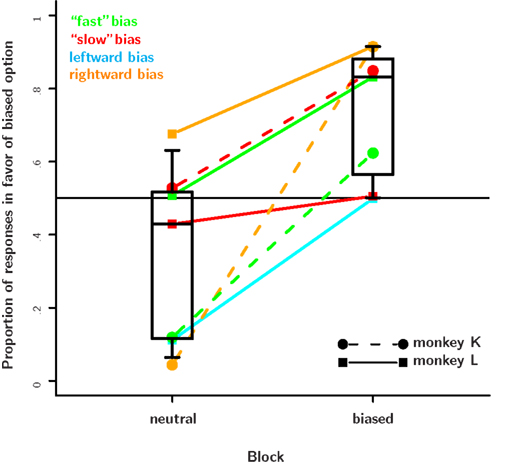
Figure 7. Results from the value-based decision task. The proportion of choices in favor of the biased response is plotted separately for the neutral and the biased blocks. Data from a particular bias type are connected by a dotted line. The plotting symbol and line type indicate the subject. In every single session, subjects shifted their preferences in favor of the response that was more likely to be correct. On most days this effect was quite strong and caused the monkeys to choose the biased response 80% of the time or more. On some days, however, the effect was rather small. This seemed to be the case when an animal already had a very strong bias, e.g., toward a particular direction and the likelihood manipulation favored a particular color. Further, while both monkeys responded to the reward likelihood manipulations, monkey K responded stronger and with a shorter delay than monkey L. As monkey K already had a very strong natural rightward preference, we did not run the rightward bias condition. The response bias in the neutral block is caused mainly by carry-over effects from the bias introduced on the previous day.
Discussion
In the current study we measured sensory decision criteria of macaque monkeys in response to manipulations of reward magnitude and prior reward likelihood favoring one of the two perceptual categories (“fast” or “slow”), or one of the two possible motor responses (leftward or rightward saccade). We report two main findings: first, decision criteria did shift in response to manipulations of reward magnitude. Ideal observer analysis showed that the observed shift was significantly larger than the value that would have optimized reward volume in the long run. Second, decision criteria did not shift in response to manipulations of prior reward likelihood. This is in clear contrast to human observers whose decision criteria are sensitive to changes in prior reward likelihood (e.g., Maddox, 2002). In the following we will discuss the implications of our findings in greater detail.
Reward Magnitude Versus Likelihood Bias
Our results show substantial and significant differences in the subjects’ decision criteria in response to manipulations of reward magnitude on the one hand and reward likelihood on the other. The decision criteria readily adjusted to the manipulation of reward magnitude (see Figure 2). In our animals which had never before experienced the reward magnitude manipulation, decision criteria began shifting within the first 100 trials (Figure 6). Within less than 200 trials the decision criterion reached a relatively stable level which was shifted significantly farther than predicted by an ideal observer model. The suboptimal placement of the decision bound in the reward magnitude condition cost the monkeys on average 6% of the expected reward volume, even after accounting for decreased stimulus discriminability in the biased condition. This value is substantially larger than the 1–2% reported previously in a related task (Feng et al., 2009).
In stark contrast, the decision criteria of the monkeys did not adjust to manipulations of prior reward likelihood (see Figure 3). This led to an average reduction in expected reward volume of 2%. Even after up to 1000 trials with unequal reward likelihoods we failed to find any sign which might hint at a shift of decision criteria. Clearly, we can not rule out that such a shift would have developed if the same likelihood bias had been maintained for several thousands of trials distributed over multiple days. Similarly, our study does not exclude that the animals will eventually learn to adapt more optimal decision thresholds in both conditions as they the gain more experience with the biased decision making task in general. However, this does not take away from our main finding which is that naive animals exhibit dramatically different responses to manipulations in reward magnitude on the one hand and prior reward likelihood on the other.
One possible explanation for the striking lack of an effect in response to the prior reward likelihood manipulation is that our subjects were insensitive to changes of reward likelihood in general, or that the differences in reward likelihood were too small to notice. However, our results from the value-based decision task show that this is not the case. In this task the subjects readily adjusted their behavior to differences in reward likelihood of the same magnitude. Hence, it seems more likely that the subjects failed to establish a connection between prior reward likelihood, decision criteria and reward maximization. This link may have been difficult to establish in the biased decision task, as there were two sources of information indicating which of the two options was more likely to be correct: the sensory evidence evaluated on a trial by trial basis and the prior reward likelihood estimated over a large sample of trials. The sensory evidence may in some way have prevented the use of the prior reward likelihood information. It is possible that differences in reward magnitude are more salient than differences in reward likelihood: reward size is experienced immediately while reward probability emerges over multiple trials. However, it is important to note that the reward magnitude effect develops gradually over more than 100 trials, suggesting that reward magnitude is also evaluated over a longer time scale.
Comparison Between Human and Macaque Observers
A large body of literature has examined the phenomenology of biased sensory decision making in human observers: These studies investigated how subjects adjust their decision criteria in categorization tasks with unequal reward magnitudes and/or prior reward likelihood (Busemeyer and Myung, 1992; Erev, 1998; Maddox, 2002; Voss et al., 2008; Feng et al., 2009; Navalpakkam et al., 2009). In the following, we want to relate our findings in macaque monkeys to the human literature in general and one very simple conceptual model in particular.
Several studies have shown that human subjects indeed adjust their decision criteria in response to both unequal reward magnitudes and prior reward likelihoods. However, subjects are conservative and do not adjust their criterion far enough in order to optimize expected reward (Green and Swets, 1966; Healy and Kubovy, 1981). Further, several studies have shown that humans place their decision criteria closer to the optimal criterion when faced with unequal prior reward likelihoods rather than unequal reward magnitudes (reviewed for example in Maddox, 2002).
Macaque monkeys and humans behave similar only in response to the reward magnitude manipulation: both species shift their decision criteria in response to such manipulations. However, while human subjects under-compensate, i.e., they do not shift their decision criteria far enough, macaques over-compensate (see Figures 2 and 4 as well as Feng et al., 2009). In contrast, the most pronounced interspecies differences can be observed in the prior reward likelihood condition: while human subjects show large and close to optimal shifts in this condition, macaques failed to show any significant shift in our biased decision task.
These clear differences suggest that different mechanisms underlie the adjustment of decision bounds in the two species. In the following we will relate our results to a very simple conceptual model which has been put forward to explain the behavior of human subjects in similar tasks: the so-called competition-between-reward-and-accuracy (COBRA) hypothesis holds that decision criteria arise as a compromise between accuracy and reward maximization.
The amount ΔcA by which decision criteria need to be shifted from the actual category bound sc in order to maximize accuracy is a function of the prior reward likelihoods, i.e., the base rates of the different categories:

The criterion value cA is the sum of actual category bound sc, and the optimal accuracy criterion shift: cA = sc + ΔcA. The index σ indicates that the optimal shift also depends on how well an observer is able to discriminate the different stimuli. The precise form of the functional relationship fσ is given by Eq. 6. The criterion shift ΔcR which maximizes reward volume is a function of unconditional expected values:
The COBRA hypothesis assumes that the actual criterion shift Δc is the weighted average of ΔcA and ΔcR. Consequently, the criterion c is given by:

In this context, behavior of human subjects can be approximated by setting both coefficients to non-zero values with a sum of less than 1 (e.g., wα = 0.2, wρ = 0.7). In the reward likelihood condition, ΔcA is identical to ΔcR. Consequently, wα and wρ add up to close to one, and lead to an almost optimal decision criterion. In the reward magnitude condition the two goals are mutually exclusive, i.e., ΔcR > ΔcA = 0. Hence wα and wR do not add up and cause a smaller and clearly suboptimal shift (see Maddox, 2002 for details). The behavior of the macaques in our task can not be explained in this framework of competition between accuracy and reward maximization: the strong effects of the reward magnitude manipulation on decision criteria would suggest a large coefficient wρ for the reward criterion. However, the lack of an effect in the reward likelihood condition would suggest negligible weights for both accuracy and reward maximization.
It is possible to expand the COBRA hypothesis in order to accommodate the behavior of the macaques. We will refer to this extension more generally as the criteria competition approach. Parallel to the accuracy criterion shift we define the magnitude criterion shift ΔcM as a function of reward magnitude:
Just as the accuracy criterion cA maximizes reward under the assumption of equal payoffs, the magnitude criterion cM maximizes reward under the assumption of equal base rates. Note that neither of the two criteria optimize reward if base rates and payoffs are unequal at the same time. In such cases, the expected reward criterion cR is the only optimal choice. In the criterion competition model, the actual criterion c arises as the weighted average of all three criteria:

Behavior of the macaques in our task can be emulated by setting wμ to a value larger than 1 and fixing both wα and wρ to 0 (e.g., wα = 0, wρ = 0, wμ = 2). The behavior of the human subjects can of course also be expressed in this larger framework. Due to the additional degree of freedom, there are a number of combinations of coefficients which can emulate the human behavior.
Category Versus Motor Bias
Categorization tasks used in macaques typically confound perceptual category with the motor response used to signal this category (Feng et al., 2009). Hence, a bias in favor of a perceptual category, may actually be represented as a motor bias favoring a particular motor response. So far, it is not known whether the neural mechanisms and the psychophysical effects of a category bias are identical to those of a motor bias. Thus, if humans acquired a category bias as favored by their instructions, and the monkeys a motor bias, the difference between the two species may actually reflect a difference between motor and category bias.
We tested this hypothesis by investigating whether decision bounds are affected equally by a motor and a category bias. We used a simple experimental procedure to dissociate category membership from motor response. This enabled us to compare the effects of a motor to a category bias. Overall, our results do not support the idea that category and motor biases have distinct effects on the placement of decision bounds. The initial finding of larger shifts in the category compared to the motor bias condition (Figure 2) could not be replicated later in the experiment. In summary, our results indicate that differences between human and macaque subjects can not be attributed to differences between motor and category biases.
Overcompensation in the Reward Magnitude Condition
In the following we will focus on the overcompensation which was consistently observed in the reward magnitude condition. First, we will review the mechanisms that have been put forward to explain the under-compensation of humans in similar tasks and explore whether these mechanisms may account for the overcompensation found in monkeys. Further, we will discuss two new approaches which are based on the decision confidence and an alternative optimization strategy which we refer to as operant matching.
Utility function
One possible explanation of the monkeys’ overcompensation is based on the assumption that subjects maximize utility of the rewards, not reward volume per se. In addition, different shapes of the utility functions for the two species may explain the different behavior of human and macaque observers in such tasks. For example, if human subjects have a concave utility function, they will value big rewards relatively less, and the shift which optimizes expected utility is smaller than the one that optimizes expected reward. Indeed, humans show signs of concave utility functions in a number of situations (e.g., Kahneman and Tversky, 1979). Additional support for this mechanism has been presented by Navalpakkam et al. (2009). When they encouraged human subjects to interpret rewards linearly by adding an extra cash prize for the subject with the best performance, they observed optimal criterion shifts.
Similarly, this mechanism may be responsible for the suboptimally large criterion shifts observed for the monkeys. However, in contrast to the concave utility function which explains the under-compensation of the humans, their overcompensation needs to be explained by convex utility functions. We rewrite Eq. 6 and replace the rewards ri with the utility of these rewards as denoted by u[ri]. In addition, we replace the variable decision criterion c with the observed decision criterion, i.e., PSE. We exploit the fact that at the PSE, the expected utility of both choices is equal:
We approximate u[r] as an exponential function: u[r] = rq. Hence we can rewrite Eq. 12:
Since the right hand side of Eq. 13 can be estimated from the psychophysical performance in the neutral condition (see Materials and Methods), it will give us an estimate of the fraction of the utilities that would have justified the observed shift of the decision criterion. This fraction can be compared to the fraction of the actual reward values, r1/r2. To do this, we solve Eq. 13 for the exponent q which will give us an estimate of the convexity or concavity of the utility function:
For the three monkeys L, K, and C we find very similar exponents q of 5.15 ± 2.36, 5.23 ± 2.59, and 4.21 ± 3.54 (mean ± standard deviation). With the exception of a single data point from monkey C, all estimates of q are larger than 2, indicating a strong convexity in the utility function. These analyses show that in principle, the suboptimally large criterion shifts of the monkeys may be explained by convex utility functions. This interpretation is supported by other studies presenting evidence in favor of convex utility functions for fluid rewards in monkeys (McCoy and Platt, 2005; Hayden et al., 2008). However, the value of the exponent q which was estimated to be on the order of 5 seems rather large.
We further performed an independent test of whether our monkeys exhibit evidence in favor of convex utility functions within the particular setting of our task. In order to do so, subjects performed the identical speed-categorization task with a slightly modified reward schedule. Correct responses for one of the categories were always rewarded with a fixed number of 3 valve openings. The other category was rewarded randomly with either 2 or 4 valve openings. If the monkeys have convex utility functions, they should prefer the variable option with a 50% chance of either 2 or 4 valve openings over the fixed one. Sensory decision criteria of one of the animals (monkey K) shifted in line with these predictions. The other animal (monkey L), however, was indifferent to the two reward schedules. In summary, the overcompensation of the monkeys may at least in part be related to a convex utility function for fluid rewards delivered in units of valve openings.
Confidence estimate
The optimal criterion that maximizes reward depends not only on the fraction of reward magnitudes, but also on the discriminability of the stimuli, σ (see Eq. 6): If the discriminability of the stimuli is low, i.e., σ is large and the psychometric function is flat, the optimal shift is large (see Figure 4). Hence, in order to produce an optimal criterion shift, the monkeys need to have a good estimate of σ. In the following we assume that the animals representation of stimulus discriminability is given by  . We can reformulate Eq. 6 by substituting
  for σ and the observed PSE for the optimal criterion shift c.

In most cases, Eq. 14 can be solved numerically for  . However, no solution exists if the sign of the observed shift of the decision criterion does match the sign of the optimal shift. For monkey L, averaged over all conditions, we find that a
  of 4.08 ± 1.03 explains the observed criterion placement. Compared to an actual value of stimulus discriminability of σ = 1.44 ± 0.40, this would corresponds to a pronounced underestimation of the psychophysical ability. For monkey K, the estimated value is
  , compared to an actual value of σ = 0.88 ± 0.28. For monkey C, Eq. 14 can not be solved in one instance. Averaged over the remaining instances we find an estimated value is
  , compared to an actual value of σ = 2.20 ± 1.20. This analysis suggests that overcompensation of the monkeys may in principle be due to a systematic underestimation of the monkeys’ psychophysical ability to discriminate the stimulus speeds.
The previous two sections have outlined that our results can be explained either by convex utility functions or under-confidence of the monkeys in their decision. A recent study by Kiani and Shadlen (2009) may help determine which of the two explanations is more likely to be accurate. In their study, monkeys engaged in a post-decision wagering task: After signaling their choice, monkeys were given an additional choice between sticking to their original, potentially wrong choice and a third option which featured a smaller but sure reward. Behavior in the post-decision wager is indicative of the confidence in their original choice: if they are sure about their decision, they should stick with the big prospective reward, if not, they might want to go with the small but sure reward. Similar to our task, it is possible to asses the optimality of the monkeys’ decisions strategy. Their analyses suggest that the behavior of the monkeys can be explained either by a convex utility function or overconfidence of the monkeys in their performance. Note that both, ours and their data set can be explained by convex utility functions. In contrast, erroneous confidence estimates do not provide a parsimonious explanation for both data sets: our data needs to be explained by under-confidence of the subjects, theirs by overconfidence. Taken together, the two studies seem to suggest that convex utility functions are more likely than erroneous confidence estimates to play a role in causing the observed suboptimal behavior.
Operant matching criterion
The COBRA hypothesis and its extension, the criteria competition approach, have already been discussed in section “Comparison between human and macaque observers.” In summary, we concluded that only the criteria competition approach may accommodate the findings from the two species.
Here, we will consider an additional expansion of the criterion competition approach which provides a novel explanation for the overcompensation observed for the monkeys. The explanation is based on the matching law first formulated by Herrnstein (1961). Hence, we refer to the mechanism as operant matching as opposed to the local “winner-take-all” mechanism which governs the behavior of the ideal observer. We define the value of a category, V(Ci), as the likelihood of being correct when choosing this category times the reward magnitude associated with this category:

The idea of operant matching is that the decision criterion is set such that the value of each category is equal:

Note that operant matching will produce category boundaries which can be quite distinct from the ideal observer analysis. For example, assume that the task is very easy and subjects perform virtually 100% correct. In this case, the ideal observer analysis holds that the criterion should not be shifted at all. However, if the criterion is not shifted, the values of the two categories as defined by operant matching are not identical. In particular, because all responses are correct, the value of each category is identical to the reward associated with it, i.e., V(Ci) = ri. Hence, operant matching holds that the criterion needs to be shifted until the value of both categories are equal.
The operant matching approach has certain limitations: Equation 16 can not be solved if ∃i,j:ri/rj < P(Cj). The following example illustrates the restriction: if we assume that there are only two categories which equally likely, and that r1 = 1 and r2 = 3, we find that r1/r2 = 1/3 < P(C1) = 0.5 and Eq. 16 has no solution: No matter how far the decision criterion is shifted, the value of category 1 will always be less or equal to 1. In contrast, the value of the second category will always be at least 1.5 (here we assume that P(“correct” | “choice = i”) ≥ P(Ci) = 0.5).
We refer to the criterion shift predicted by operant matching as ΔcO. It can easily be included into the criterion competition approach:

For all three monkeys, the global matching criterion predicted larger shifts than the criterion which optimizes rewards, cR. Hence, the differences between humans and monkeys may at least partially be caused by monkeys placing larger weight wO on the operant matching criterion.
Conclusion
In the current experiment we investigated sensory decision criteria of macaque monkeys in a biased decision making task where different options were more likely to be correct (prior reward likelihood bias) or associated with a larger reward if chosen correctly (reward magnitude bias). Our results show that decision criteria of naive monkeys over-adjust to the reward magnitude manipulation but fail to adjust at all to the reward likelihood manipulation. Importantly, the setting of decision criteria does not seem to be mediated by the unconditional expected value of the options as predicted by an ideal observer analysis. Rather, conditional reward magnitude alone determines the decision criteria of the monkeys in the task. This is in clear contrast to choice behavior in pure value-based decisions where the monkeys readily adjusted their behavior as a function of prior reward likelihood.
Conflict of Interest Statement
The authors declare that the research was conducted in the absence of any commercial or financial relationships that could be construed as a potential conflict of interest.
Acknowledgments
We want to thank Jack Grinband, Franco Pestilli, and Brian Lau for helpful discussions. Thanks to Brandon Murray for help with the data collection. We gratefully acknowledge funding by the DFG project TE819/1-1 to Tobias Teichert and NIH-MH059244 to Vincent P. Ferrera.
References
Bernoulli, D. (1738). Exposition of a new theory on the measurement of risk. Econometrica 22, 22–36 (originally published 1738; translated 1954).
Busemeyer, J. R., and Myung, I. J. (1992). An adaptive approach to human decision-making – learning-theory, decision-theory, and human- performance. J. Exp. Psychol. Gen. 121, 177–194.
Erev, I. (1998). Signal detection by human observers: a cutoff reinforcement learning model of categorization decisions under uncertainty. Psychol. Rev. 105, 280–298.
Feng, S., Holmes, P., Rorie, A., and Newsome, W. T. (2009). Can monkeys choose optimally when faced with noisy stimuli and unequal rewards? PLoS Comput. Biol. 5, e1000284. doi: 10.1371/journal.pcbi.1000284.
Fiorillo, C. D., Tobler, P. N., and Schultz, W. (2005). Evidence that the delay-period activity of dopamine neurons corresponds to reward uncertainty rather than backpropagating TD errors. Behav. Brain Funct. 1, 7.
Gold, J. I., and Shadlen, M. N. (2007). The neural basis of decision making. Annu. Rev. Neurosci. 30, 535–574.
Green, D., and Swets, J. (1966). Signal Detection Theory and Psychophysics. John Wiley: Oxford, England.
Hayden, B. Y., Heilbronner, S. R., Nair, A. C., and Platt, M. L. (2008). Cognitive influences on risk-seeking by rhesus macaques. Judgm. Decis. Mak. 3, 389–395.
Healy, A. F., and Kubovy, M. (1981). Probability matching and the formation of conservative decision rules in a numerical analog of signal-detection. J. Exp. Psychol. Hum. Learn. 7, 344–354.
Herrnstein, R. J. (1961). Relative and absolute strength of response as a function of frequency of reinforcement. J. Exp. Anal. Behav. 4, 267–272.
Kahneman, D., and Tversky, A. (1979). Prospect theory – analysis of decision under risk. Econometrica 47, 263–291.
Kiani, R., and Shadlen, M. N. (2009). Representation of confidence associated with a decision by neurons in the parietal cortex. Science 324, 759–764.
Maddox, W. T. (2002). Toward a unified theory of decision criterion learning in perceptual categorization. J. Exp. Anal. Behav. 78, 567–595.
McCoy, A. N., and Platt, M. L. (2005). Risk-sensitive neurons in macaque posterior cingulate cortex. Nat. Neurosci. 8, 1220–1227.
Navalpakkam,V., Koch, C., and Perona, P. (2009). Homo economicus in visual search. J. Vision 9, 1–16.
Rangel, A., Camerer, C., and Montague, P. R. (2008). A framework for studying the neurobiology of value-based decision making. Nat. Rev. Neurosci. 9, 545–556.
Romo, R., and Salinas, E. (2003). Flutter discrimination: neural codes, perception, memory and decision making. Nat. Rev. Neurosci. 4, 203–218.
Schall, J. D. (2003). Neural correlates of decision processes: neural and mental chronometry. Curr. Opin. Neurobiol. 13, 182–186.
Sugrue, L. P., Corrado, G. S., and Newsome, W. T. (2005). Choosing the greater of two goods: neural currencies for valuation and decision making. Nat. Rev. Neurosci. 6, 363–375.
Tobler, P. N., Fiorillo, C. D., and Schultz, W. (2005). Adaptive coding of reward value by dopamine neurons. Science 307, 1642–1645.
Keywords: reward bias, categorization, signal detection theory, psychometric function
Citation: Teichert T and Ferrera VP (2010) Suboptimal integration of reward magnitude and prior reward likelihood in categorical decisions by monkeys. Front. Neurosci. 4:186. doi: 10.3389/fnins.2010.00186
Received: 02 August 2010;
Paper pending published: 13 August 2010;
Accepted: 16 October 2010;
Published online: 19 November 2010
Edited by:
Daeyeol Lee, Yale University School of Medicine, USAReviewed by:
Benjamin Hayden, Duke University Medical Center, USA;Ming Hsu, University of California at Berkeley, USA
Copyright: © 2010 Teichert and Ferrera. This is an open-access article subject to an exclusive license agreement between the authors and the Frontiers Research Foundation, which permits unrestricted use, distribution, and reproduction in any medium, provided the original authors and source are credited.
*Correspondence: Tobias Teichert, Department of Neuroscience, Columbia University, 1051 Riverside Drive, Unit 87, New York, NY 10032, USA. e-mail: tt2288@columbia.edu