Gap prepulse inhibition and auditory brainstem-evoked potentials as objective measures for tinnitus in guinea pigs
- 1Department of Otolaryngology, Kresge Hearing Research Institute, University of Michigan, Ann Arbor, MI, USA
- 2Department of Molecular and Integrative Physiology, University of Michigan, Ann Arbor, MI, USA
Tinnitus or ringing of the ears is a subjective phantom sensation necessitating behavioral models that objectively demonstrate the existence and quality of the tinnitus sensation. The gap detection test uses the acoustic startle response elicited by loud noise pulses and its gating or suppression by preceding sub-startling prepulses. Gaps in noise bands serve as prepulses, assuming that ongoing tinnitus masks the gap and results in impaired gap detection. This test has shown its reliability in rats, mice, and gerbils. No data exists for the guinea pig so far, although gap detection is similar across mammals and the acoustic startle response is a well-established tool in guinea pig studies of psychiatric disorders and in pharmacological studies. Here we investigated the startle behavior and prepulse inhibition (PPI) of the guinea pig and showed that guinea pigs have a reliable startle response that can be suppressed by 15 ms gaps embedded in narrow noise bands preceding the startle noise pulse. After recovery of auditory brainstem response (ABR) thresholds from a unilateral noise over-exposure centered at 7 kHz, guinea pigs showed diminished gap-induced reduction of the startle response in frequency bands between 8 and 18 kHz. This suggests the development of tinnitus in frequency regions that showed a temporary threshold shift (TTS) after noise over-exposure. Changes in discharge rate and synchrony, two neuronal correlates of tinnitus, should be reflected in altered ABR waveforms, which would be useful to objectively detect tinnitus and its localization to auditory brainstem structures. Therefore, we analyzed latencies and amplitudes of the first five ABR waves at suprathreshold sound intensities and correlated ABR abnormalities with the results of the behavioral tinnitus testing. Early ABR wave amplitudes up to N3 were increased for animals with tinnitus possibly stemming from hyperactivity and hypersynchrony underlying the tinnitus percept. Animals that did not develop tinnitus after noise exposure showed the opposite effect, a decrease in wave amplitudes for the later waves P4–P5. Changes in latencies were only observed in tinnitus animals, which showed increased latencies. Thus, tinnitus-induced changes in the discharge activity of the auditory nerve and central auditory nuclei are represented in the ABR.
Introduction
Until recently, there were no reliable behavioral models to determine whether or not animals perceive the phantom sound known as tinnitus. Recently a test was developed by Turner et al. (Turner et al., 2006) based on the modification of the acoustic startle.
The mammalian acoustic startle response, which is elicited by sudden, loud sound, is characterized by muscle contractions of the face, neck, limb, and back resulting in a crouching posture. The primary startle reflex-eliciting circuit consists of the dorsal and ventral cochlear nucleus (DCN and VCN), cochlear root neurons, and the lateral superior olive, which deliver startle stimulus information to the caudal pontine reticular nucleus that mediates the startle via its projections to relevant muscles (Koch, 1999). The force produced during the startle can be enhanced or suppressed in the course of fear-potentiation via projections from structures such as auditory cortex, thalamus, amygdala, and hippocampus (Koch, 1999; Swerdlow et al., 2001; Li et al., 2009). Preceding the startle stimulus 30–500 ms with a non-startle-eliciting sensory input diminishes the startle amplitude. This “prepulse inhibition” (PPI) of the startle is mediated by a gating pathway comprised of the cochlear nucleus, inferior colliculus (IC), superior colliculus, and pedunculopontine tegmental nucleus, which project to the caudal pontine reticular nucleus.
The tinnitus test developed by Turner et al. (Turner et al., 2006) uses a gap embedded in different narrow gap-carrier bands as a prestimulus (gap-PPI) that reduces the startle amplitude. Animals perceiving tinnitus in a specific frequency band are predicted to have diminished detection of gaps embedded in gap-carrier bands similar to the tinnitus frequency. The ongoing tinnitus thus, masks the gap. This reduces the gating efficiency of the gap, producing a larger startle. This test thus not only detects tinnitus but also reveals its frequency content.
As the test relies on a pre-attentive modification of reflex behavior and the PPI doesn't require learning (Swerdlow et al., 2000; Fendt et al., 2001; Li et al., 2009), it takes less time and effort compared to tests requiring training (Jastreboff et al., 1988; Bauer and Brozoski, 2001; Heffner and Harrington, 2002; Ruttiger et al., 2003; Lobarinas et al., 2004), enabling simultaneous testing of many animals over long time periods. Gap-PPI is not influenced by threshold shifts limited to one ear (Bauer and Brozoski, 2001; Turner et al., 2006), which is important in studies using noise over-exposure to induce tinnitus.
To date, gap-PPI has been reliably used to demonstrate noise- and salicylate-induced tinnitus in rats, mice, and gerbils and has been validated with other conditioning techniques (Bauer and Brozoski, 2001; Turner et al., 2006, 2012; Yang et al., 2007; Turner and Parrish, 2008; Longenecker and Galazyuk, 2011; Nowotny et al., 2011). Here, we apply this test to guinea pigs, which have become a model species for auditory neuroscience because of easier accessibility of their cochleas and auditory brainstems for manipulations and recordings compared to rats and mice. We describe the basic features of the guinea pigs' startle and gating and show that noise exposure results in gap-PPI deficits comparable to that shown in rats.
While ABR's have been used to measure hearing threshold and can detect hearing loss, recent studies show that thresholds can recover after noise exposure even in the face of defective auditory nerve synapses and decreased ABR wave I amplitudes (Kujawa and Liberman, 2009; Lin et al., 2011), which can be one factor in the development of tinnitus. Therefore, changes in the ABRs can be used as an objective measure of tinnitus in addition to the gap detection testing. Furthermore, ABRs could reveal areas of the auditory brainstem that are involved in the tinnitus pathology.
The ABRs recorded here were comprised of five positive and four negative peaks (Figure 1) as described previously for guinea pigs and cats (Wada and Starr, 1983a; Simha et al., 1988; Melcher et al., 1996a; Hsu et al., 2008; Gourevitch et al., 2009). In the ongoing discussion about the generators of certain components of the ABR, there is a general consensus that the first wave or P1–N1 is generated by the VIIIth nerve (Wada and Starr, 1983a; Simha et al., 1988; Melcher and Kiang, 1996; Melcher et al., 1996a,b). There is evidence that P2 is generated by the anteroventral and posteroventral cochlear nucleus (Buchwald and Huang, 1975; Simha et al., 1988; Melcher and Kiang, 1996; Melcher et al., 1996a,b). Contribution of the trapezoid body is seen starting with the N2 wave (Wada and Starr, 1983a,b,c; Simha et al., 1988). Wave P3 as well as N3 is attributed to superior olivary complex (SOC) and medial nucleus of the trapezoid body (MNTB) (Achor and Starr, 1980; Gardi and Bledsoe, 1981; Simha et al., 1988; Melcher and Kiang, 1996; Melcher et al., 1996a,b). P4 and N4 have been found to represent SOC and the lateral lemniscus (LL) or the trapezoid body (Buchwald and Huang, 1975; Wada and Starr, 1983b; Simha et al., 1988; Popelar et al., 2008). There is also a general consensus that P5 is generated by the IC and/or the LL (Melcher and Kiang, 1996; Melcher et al., 1996a,b; Popelar et al., 2008).
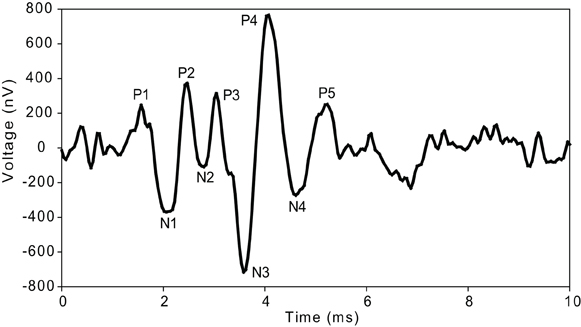
Figure 1. ABR waveform morphology. Typical waveform (12 kHz, 80 dB SPL) illustrating the peaks (P) and troughs (N) of the ABR waves measured in guinea pig.
We recorded ABRs to tonal stimulation (4, 6, 7, 8, 9, 12, 16 kHz) in 10 dB steps up to 90 dB SPL. Latencies as well as interpeak latencies and amplitudes of all five positive and negative waves were measured after recovery from TTS. These parameters were compared between normal, non-exposed animals, and noise exposed animals that had or had not developed tinnitus and this comparison was done for stimulus frequency regions inside and outside the tinnitus frequency region based on the results of the behavioral gap detection testing.
Part of the behavioral test results were used as confirmation of tinnitus occurence in a different study (Dehmel et al., 2012).
Methods
Animals
Male pigmented guinea pigs from Cady Ridge Farms (270–380 g at study onset; Chelmsford, MA, USA) were used in this study. All procedures were performed in accordance with the National Institutes of Health (NIH) Guidelines for the Use and Care of Laboratory Animals (NIH publication no. 80-23) and guidelines provided by the University Committee on Use and Care of Animals of the University of Michigan. The number of animals used differed for the different parts of the presented results, they are indicated in each figure legend and are as follows: 13 animals were used to characterize the TTS following the noise exposure, eight animals were used to characterize the dependence of the startle on the startle pulse level, 14 animals were used to characterize the gap- and noise pulse-PPI, of those seven were noise-exposed and four were sham-exposed and continued gap- and noise pulse-PPI testing after the exposures.
Behavioral Testing
A Kinder Behavioral Testing System (Poway, CA, USA) with testing cage and platform enclosed in a 40 × 30 × 35 cm testing chamber with speakers contained in the ceiling was used. The walls were lined with blue-pads to reduce reverberations ensuring that the 15 ms gap was “clean” as judged from an oscillogram. Two testing chambers were placed in a single walled sound booth. The signal spectra outside the gap-carrier/noise pulse bands were between 19 dB SPL and 24 dB SPL for the different frequency bands of the gap-carrier/noise pulse (4–6 kHz: 19 dB SPL, 8–10 kHz, and 12–14 kHz: 23 dB SPL, 16–18 kHz: 24 dB SPL). Gap-carrier/noise pulse bands and startle pulse calibrations were performed using a microphone (B&K ¼ inch 4136 and spectrum analyzer SR760, Stanford research systems) and guinea pig cloth model inside the testing cage with closed chamber and booth.
For the gap-PPI a 15 ms gap (excluding 5 ms offset/onset ramps) was embedded in four different 2 kHz gap-carrier bands (4–6 kHz, 8–10 kHz, 12–14 kHz, 16–18 kHz) and a broad-band noise (BBN) with two levels (60 and 70 dB SPL). The gap-carriers were played before the startle pulse for a variable time starting between 3.1 and 8.1 s to prevent anticipation of the startle pulse (Figure 2B). The prepulse in the noise pulse-PPI consisted of a 15 ms pulse (excluding 5 ms rise-fall time) of the same frequency bands as the gap-carrier (Figure 2A). The startle pulse (115 dB SPL, BBN, 20 ms) followed the gap onset or noise pulse by 100 ms. The maximum startle response in a time window 250 ms after the startle pulse was recorded.
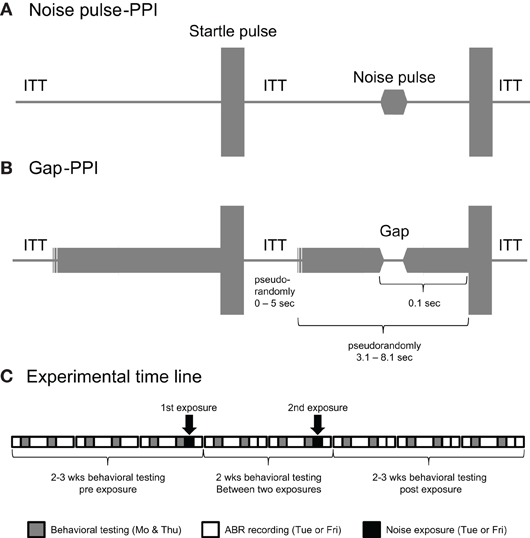
Figure 2. Stimulus structure for the noise pulse-PPI test (A) and Gap-PPI test (B) showing a trial without the prepulse followed by a trial with the prepulse. Note that the timeline is not entirely drawn to scale, because of the comparably long inter-trial interval time (ITT), which was pseudo-randomly varied between 0 and 5 s and the long pseudo-randomly varied time of 3.1–8.1 s between the start of a trial and the presentation of the startle pulse. The experimental timeline is shown in (C). Behavioral testing was done throughout the experiment, including 2–3 weeks before the first, and 2–3 weeks after the last exposure. Note that two of the 11 animals tested received only one noise exposure. The exposures and ABRs were done either on Tuesdays or Fridays for a certain animal; in the example shown in the (C) they were done on Fridays.
One block of the test session began with a recording trial with no sound to record the animals' background movement (Figure 2C). This was followed by two presentations of the startle pulse alone. At the outset this habituated the startle response to a more stable startle level (Swerdlow et al., 2000). This was followed by alternating trials of each gap-carrier band with gap (in the gap-PPI test) or noise pulse (in the noise pulse-PPI test) preceding the startle pulse and trials with the startle pulse only. For the gap-PPI the trials with 60 and 70 dB SPL background alternated as well as the sequence of gap preceding the startle pulse (“with gap” condition) or no gap preceding the startle pulse (“without gap” condition). Inter-stimulus trial time (without gap-carrier presentation in the gap-PPI session) was pseudorandomly varied (from 0 to 5 s) to prevent startle anticipation and interval-based habituation (Figures 2A,B). Together with the variable time length of the gap-carrier this resulted in a separation of the startle pulses between 3.1 and 13.1 s (Figures 2A,B). This block of trials containing all stimulus conditions (level and frequency of gap-carrier/noise pulse, trial with or without gap/noise pulse) was repeated 10 times. The sound booth and the testing chamber doors were opened for a short break between the gap-PPI and noise pulse-PPI session. Both sessions lasted about 35 min each.
The gap-PPI and noise pulse-PPI testing was performed throughout the study on two days each week (Monday and Thursday, unless otherwise noted; Figure 2C). ABRs and noise exposures were performed on the following day (Tuesdays or Fridays). Baseline gap-PPI and noise pulse-PPI testing were performed for 2–3 weeks before the noise exposure. After the first noise exposure, testing continued for another two weeks until the animals received a second noise or sham exposure (n = 9 animals; all of the control animals); two other animals received only one noise exposure (both no-tinnitus animals). After the last noise exposure the gap-PPI and noise pulse-PPI testing continued for 2–3 weeks. Behavioral data after the noise exposure was used only for days after the animals ABR had recovered.
Noise Exposure
The noise exposure was performed under anesthesia (first dose: 14 mg/kg body weight Xylazine and 110 mg/kg Ketamine; additional dose 2–3 h later, when responses to toe pinch occured: 4 mg/kg Xylazine and 13 mg/kg Ketamine). Body temperature was kept constant with a temperature controlled heating pad. The left ear was exposed for 2 h and the right ear was plugged with pieces of soft, moldable silicon ear plugs. A Beyer DT 48 speaker was enclosed in a custom-made housing that attached to a 3 cm silicon tube that ended in a cone-shaped plastic tip inserted about 2 mm tightly into the ear canal. Pilot experiments showed no influence of the noise on the unexposed ear. The noise was generated with digital signal processing hardware (TDT, Alachua, FL, USA) and Matlab and its spectrum is shown in Figure 2B. The noise was calibrated by inserting the plastic tip into a tube attached to a B&K ¼ inch microphone (4136) and spectrum analyzer (SR760 Stanford research systems).
ABR Recordings
Prior to ABR measurements the animals received an injection of antibacterial solution (enrofloxacin, 10 mg/kg body weight, Baytril, Bayer, KS, USA), after the ABR they received an injection of 10 ml saline and antibacterial eardrops (ofloxacin, 0.3%, Floxin Otic, Daiichi Sankyo Inc., Edison, NJ, USA).
ABR recordings were performed using BioSigRP software and RX5/RA4LI hardware (TDT, Alachua, FL, USA). The speaker (Beyer DT 48) calibration and acoustic stimulation were performed with SigGenRP software and RX8/PA5 hardware (TDT, Alachua, FL, USA). The speaker was coupled to the animals' ear canal as described above for the noise. ABRs were recorded immediately before and immediately after the noise exposure. ABRs were performed weekly on days following the behavioral testing after the exposure (Tuesdays, Fridays) under anesthesia (5 or 10 mg/kg body weight Xylazine) (AnaSed Injection, Akorn Inc., Decatur, IL, USA) and 20 or 40 mg/kg body weight Ketamine (Hospira Inc., Lake Forest, IL, USA). Body temperature was kept constant with a temperature controlled heating pad. Sanded 0.6 × 25 mm injection needles placed subdermally at vertex and on each masseter were used for recording, grounding, and reference. ABRs were recorded for 10 ms tone pips (2 ms ramp, 11 stimuli/s) starting with a level of 90 dB SPL, and decremented in 10 dB steps. Each level was repeated 250 times and the lower levels near threshold were re-run to record a second set of 250 presentations. ABR waveforms were visually inspected across levels; threshold was the lowest level of sound that resulted in one or more of the ABR waves being distinguishable by eye from the background noise. The second set of repetitions for the low levels was checked for waveform consistency.
Data Analysis
Data analysis and plotting were performed with Sigma Plot (Version 11, Systat Software Inc., Chicago, IL, USA) and SPSS (Version 17, SPSS Inc., Chicago, IL, USA). Two-Way repeated measure ANOVAs were performed on the averaged absolute startle data within each gap-carrier band for either the gap-PPI or noise pulse-PPI. Repeated within subject factors were trial type (with or without prepulse) and sound level (60 or 70 dB, Figure 6), an additional between subject factor was the animal group (control or exposure group, Figure 7; control or “tinnitus” or “no-tinnitus” group, Figure 9). Post-hoc all pairwise multiple comparisons were done using Holm–Sidak (p = 0.05).
ABR's were analyzed without any knowledge of group of animal. All ABR's were analyzed at 4, 6, 7, 8, 9, 12, and 16 kHz and from 90 to 50 dB SPL in decrements of 10 dB. Latency (time in ms at which the positive peak occurred after the stimulus onset) and interpeak latency (time between positive peaks) of each consecutive peak were measured (Figure 1). Increased interpeak latencies indicate further shifting of the peak in addition to the shift of P1.
Two types of linear mixed model statistics were used to reveal significant differences in ABR amplitudes and latencies. First, four linear mixed models with wave (P1, N1, etc.), group (control, tinnitus, no-tinnitus) and interaction as fixed effects and a pairwise comparison of groups for each wave were used to investigate significant differences between groups. This was done separately for amplitudes and latencies for ABR frequencies within the tinnitus frequency region (according to the behavioral test) and outside the tinnitus frequency region (results of those tests noted with < and > symbols). Second, linear mixed models with group, dB level, and interaction as fixed effects and pairwise comparison at each dB level revealed significant differences between the groups for single dB levels. This was done separately for each wave amplitude peak (P1, N1, etc.) and wave latency (PL P1, IPL 2–1, etc.) for frequencies with tinnitus and frequencies without tinnitus (results noted with * and ‡ symbols above and below the respective dB levels). Differences were significant at the 0.05 level, adjustment for multiple comparisons with Bonferroni.
Results
Temporary Threshold Shift Following Unilateral Narrow Band Noise Exposure
Since noise over-exposure is the most common cause of tinnitus among patients with known tinnitus origin (Davis and Rafaie, 2000; Eggermont, 2005) noise exposure was used to induce tinnitus in guinea pigs. In order to distinguish its effects on auditory thresholds from those on the measured tinnitus, unilateral noise exposure conditions were chosen (1/4 octave noise band centered at 7 kHz; Figure 3B) that resulted in a TTS in the exposed ear (Figure 3A). A center frequency of 7 kHz was chosen because it is within the central region of the guinea pig audiogram (Heffner et al., 1971; Prosen et al., 1978; Gourevitch et al., 2009), allowing the development of tinnitus within the hearing range of the guinea pig above and below the center of the noise band. The immediate mean threshold shift in the left/exposed ears during the first hour after the exposure was 50 dB centered at 8 kHz (black triangles, Figure 3A, p <= 0.001). One and two weeks after the exposure, the ABR thresholds of the exposed ears had recovered to their pre-exposure values (white triangles and dots, Figure 3A, p = 0.05).
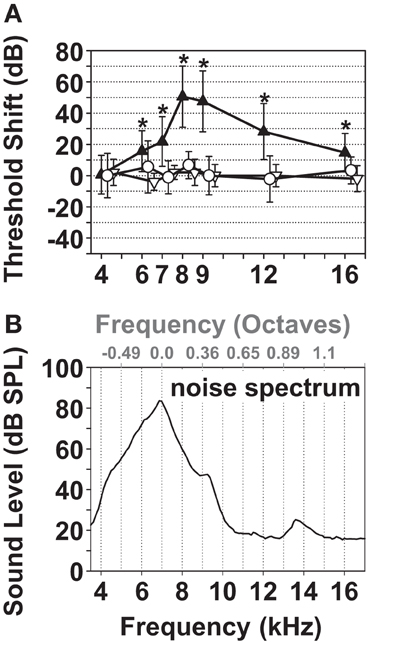
Figure 3. Characterization of the narrow band noise over-exposure protocol leading to TTS. (A) ABR threshold shift pre-exposure vs. immediately after the noise overexposure (black triangles) and one and two weeks after the exposure (white triangles and dots). The mean and standard deviation of the 1st and/or 2nd noise exposures (17 ABRs) of 13 animals are shown for the immediate (1 h) threshold shift (black triangles), one week (three animals/fiveABRs; white triangles) and 11–14 days after the noise exposure (seven animals/nine ABRs; white dots). *Marks significance in one-sample t-test against a mean threshold shift equaling 0 performed for each test frequency: p <= 0.001. (B) Noise Spectrum centered at 7 kHz, bandwidth 6.4–7.6 kHz (1.21 kHz, 1/4 octave band), RMS 97 dB SPL.
The Acoustic Startle Response in the Guinea Pig
Influence of the startle pulse level
The strength of the startle response was assessed for different startle pulse levels embedded in background noise (Figure 4). In this example, pulses embedded in the 12–14 kHz/70 dB SPL background elicited startle responses that increased in amplitude for sound levels above 80 dB SPL. No obvious (across the group of animals tested) and consistent (over the two test days for each animal) saturation of the startle response was observed up to the highest level of 115 dB SPL tested. The average 0.32 N for the startle at a level of 115 dB (Figure 4) was clearly not the maximal startle response of guinea pigs, which was dependent on the stimulus parameters (e.g., mean of 0.41 N with the startle pulse embedded in BBN 70 dB SPL; see Figure 6A). Therefore, 115 dB SPL was the chosen level for the subsequent gap-PPI and noise pulse-PPI tests to ensure a reliable startle response without presenting unnecessarily loud startle pulses above the saturation point.
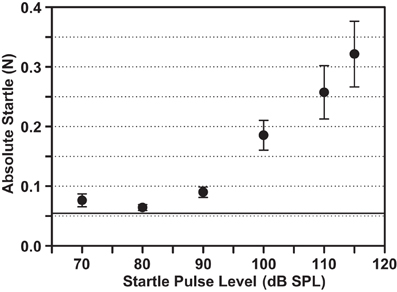
Figure 4. Acoustic startle response amplitude varies with the startle stimulus level and does not saturate up to 115 dB SPL. The startle amplitudes are plotted in response to different intensity pulses embedded in a background noise band of 12–14 kHz/70 dB SPL. Mean ± SEM for eight animals are shown, including two test days per animal. The horizontal line marks the Mean + SEM of the animal's background movement (without sound presentation).
Reliability of the startle response
A sufficiently large startle response is a prerequisite for observing its reduction by gaps or noise pulses. However, the startle response amplitude is affected by startle pulse level, stimulus repetition rate, and test session duration. The startle amplitude as well as the general background movement (without sound presentation) over the time course of a test session is shown in Figure 5. The decrement in startle response amplitudes over time, commonly described as short-term habituation (black and white circles, Figure 5) occurred in conjunction with decrements in the background movement of the animal such as walking, scratching, etc., over time (white triangles, Figure 5). The habituation affects the startle responses with and without the preceding gap in a similar way, because the habituation is a characteristic of the startle response itself, not of the circuitry mediating the sensorimotor gating i.e., reduction of the startle response by the gap. Thus, both graphs shifted to lower startle amplitudes in parallel over the time course of the session. Although the normalized startle response was variable, it did not show a clear pattern over time, especially when comparing the responses in the four different gap-carrier bands (gray graphs in the four panels of Figure 5; a Two-Way repeated measures ANOVA on ranks of the normalized startle, with the gap-carrier bands and trial number as repeated within subjects factors, revealed a significant effect of the gap-carrier bands but not of the trial number and no significant interaction between bands and trial number, p = 0.05). Moreover, the startle responses were clearly larger than the background movements (white triangles, Figure 5). These data demonstrate that it is possible to reliably measure the startle behavior of the guinea pig.
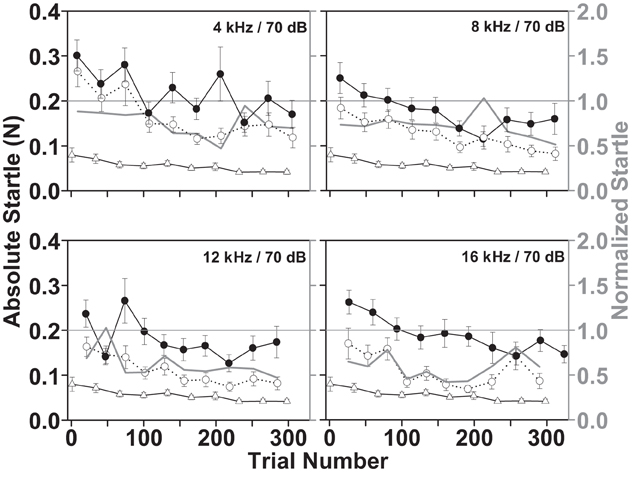
Figure 5. Short-term habituation of the startle responses and decrement of the background movement during a during a gap-PPI test session. Each stimulus condition was repeated 10 times. The mean ± SEM of the responses from 14 animals is shown over four test days (two consecutive weeks, Monday, and Thursday) for different background bands (4–6 kHz, 8–10 kHz, 12–14 kHz, 16–18 kHz, all at 70 dB SPL). Black filled circle graphs designate the absolute responses to a startle pulse without preceding gap; white circle graphs are the responses when the startle pulse follows a 15 ms gap, white triangle graphs indicate the background movement of the animal in intermingled trials without sound presentation (left Y axis). The gray line graphs plot the normalized startle response (startle “with gap”/startle “without gap”; right Y axis with gray labels) derived from the mean startle responses of all days of all animals.
Gap- and noise pulse-salience are indicated by reduced startle responses
A preceding gap reduced the startle response (white circles, Figure 5) even in the first trial of a session compared to the “without gap” condition (black filled circles, Figure 5). This reduction reflects the ability of the animal to detect the gap, which serves as a prepulse that reduces the startle response without the requirement of learning (Fendt et al., 2001; Li et al., 2009). Figure 5 also shows that the normalized startle did not increase over the time of the session, suggesting that the length of the gap was sufficiently above detection threshold not to be influenced by attention (Gewirtz and Davis, 1995).
The baseline gap-PPI for gaps in noise and noise pulse-PPI for noise pulses in quiet before noise exposure are shown in Figure 6. The results of the noise pulse-PPI test are used to indicate the salience of the same noise band used as a gap-carrier. Thus, a good performance on the noise pulse-PPI task indicates a solid salience of the noise band also used as gap-carrier. This helps to distinguish threshold changes from changes that affect gap detection. The normalized startle (startle “with gap”/“without gap”, right Y axis, Figure 6A) was smaller for the 70 dB SPL background noise bands (lower panels in Figure 6A) compared to the 60 dB SPL noise bands (upper panels in Figure 6A), presumably because of the greater gap salience in a louder carrier background i.e., producing a larger reduction of the startle by the gap. The normalized startle decreased as the frequency band of the gap-carrier increased and was smallest for the BBN carrier (0.81 for the 4–6 kHz and 0.49 for the BBN carrier). The reduction of the startle by the gap was significant for both levels and all gap-carrier bands (p < 0.05). The size of the absolute startle without the gap (black dots, left Y axis Figure 6) decreased from the 60 dB SPL background carrier to the 70 dB SPL background carrier, indicating a greater masking effect of a louder background on the startle pulse. Therefore, when the two levels of the gap-carrier were compared, for the 70 dB SPL level a smaller absolute startle was accompanied by a greater reduction of the startle due to the gap. Also in the noise pulse-PPI paradigm the reduction of the startle due to the noise pulse was larger for the 70 dB SPL compared to the 60 dB SPL noise pulse (normalized startle response, bars in upper panel vs. lower panel of Figure 6B). The normalized startle response varied for the 70 dB SPL noise pulse between 0.53 for the 4–6 kHz noise pulse and 0.37 for the BBN pulse. These baseline data show that the guinea pigs' ability to detect gaps and noise pulses can be reliably measured by the PPI tests. The 70 dB SPL gap-carrier and noise pulse conditions resulted in larger reductions of the startle response, and thus, are better suited to observe an increase in the normalized startle i.e., decreasing gap or noise pulse detection. We, therefore, concentrated on the gap-PPI and noise pulse-PPI in the 70 dB SPL condition after the noise exposure.
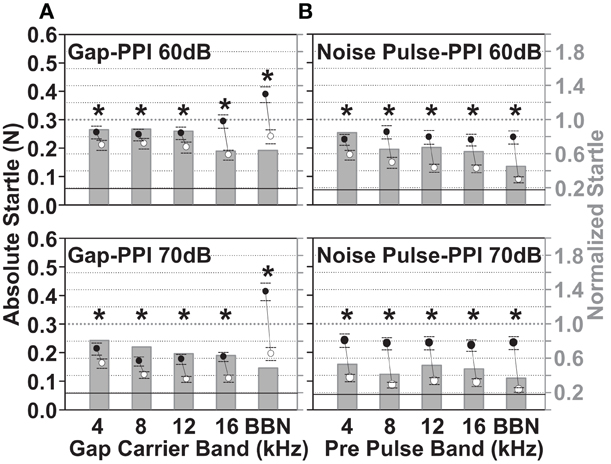
Figure 6. Guinea pigs show significant detection of gaps in background noise and noise pulses of 60 and 70 dB SPL. Baseline gap-PPI (A) and noise pulse-PPI (B) are shown before noise exposure for five different noise bands of the gap-carrier and noise pulse: 4–6 kHz, 8–10 kHz, 12–14 kHz, 16–18 kHz, and BBN. Top panels show the PPI of a 15 ms gap embedded in a 60 dB SPL gap-carrier and of a 15 ms pre pulse of 60 dB SPL, lower panels show the respective data for 70 dB SPL gap-carrier and noise pulse. The data is from 14 animals, during the three or four test-days per animal directly before the noise exposure (two days per week, Monday and Thursday), for 10 repetitions per stimulus condition. Normalized startle (bars, right Y-axis) was calculated by dividing all trials of all animals with gap (A) or noise pulse (B) by all trials without gap or noise pulse. The absolute startle response is shown as mean ±95% confidence interval of all trials without and of all trials with the gap or noise pulse (black and white dots and lines, left Y-axis). Gray dotted line at 1 is the startle without the gap or noise pulse preceding (normalized startle, right Y axis). The black line designates the mean +95% confidence interval of responses due to random background movements (recorded without sound presentation). The * marks significance in Two-Way repeated measures ANOVA (p < 0.05).
Decreased Gap Detection after Noise Exposure as an Indicator of Tinnitus
After establishing a baseline for the gap- and noise pulse-PPI, seven animals were over-exposed with noise and four animals served as controls, receiving a sham exposure. One to two weeks after noise exposure, after the ABR thresholds had recovered (Figure 3), the normalized startles of the noise exposed animals were increased for the gap in the 8–10 kHz gap-carrier band (white bars, Figure 7A), the difference between the startle in the “with gap” and “without the gap” condition was not significant. This indicates decreased gap detection for the noise exposed group compared to the control group. In contrast to the gap-PPI, the noise pulse-PPI (Figure 7B) showed a significant difference between the “with pulse” and “without pulse” condition indicating a significant detection of the pulses for all frequency bands. Therefore, the decreased gap detection in the 8–10 kHz band after noise exposure was not a result of decreased salience of the gap-carrier. The diminished gap detection after noise exposure in the 8–10 kHz gap-carrier band is hypothesized to be a reflection of tinnitus that develops in the noise exposed animals and is pronounced in this frequency band as it “masks the gap”.
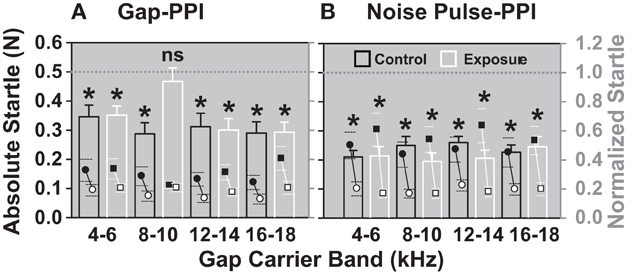
Figure 7. After noise exposure animals cannot detect a gap in the 8–10 kHz band anymore (A), while their noise pulse-PPI (B) is still significant (detectible) in all bands. The normalized startle response (mean + SEM) of exposed animals (white bars; N = 7) is shown in comparison with control sham exposed animals (black bars; N = 4) for the four different gap-carrier/noise pulse bands. Normalized startle responses were derived from the mean of all trials of one animal for one day with the gap normalized to the mean of all trials of one animal of one day without the gap. *Indicates significance in Two-Way repeated measures ANOVA (p < 0.05).
Not all patients with abnormal audiograms or noise exposures develop tinnitus (Lockwood et al., 2002; Kaltenbach et al., 2005). Therefore, an analysis based on groups of animals that develop tinnitus vs. those that do not is ideal. The distribution of gap-PPI data for the different gap-carrier bands is shown for individual animals in Figure 8. In agreement with the significant increase in the normalized startle across the group of noise exposed animals (Figure 7), the distribution of normalized startles for the 8–10 kHz carrier was shifted toward higher values compared to the control animals (black line distribution curve, top panel vs. bottom panel of 8–10 kHz in Figure 8). The distribution of the data of single animals for the 8–10 kHz gap-carrier (colors of stacked histogram, top row panels in Figure 8) divides the noise exposed group into two subgroups, which mark the extremes of the distribution: animals whose data points are above the mean of the control group (“tinnitus” group, pale, striped bars), and a second group of animals, whose data points are at or below the mean of the control group (“no-tinnitus” group: dark bars). The tinnitus animals were also characterized by increased normalized startle responses compared to their pre-exposure responses. Although there was only a significant difference for the noise exposed vs. the control group as a whole for the 8–10 kHz gap-carrier (Figure 7), the “tinnitus” group animals tend to have higher normalized startle values also for the 12–14 kHz, 16–18 kHz gap-carrier bands (pale bars shifted to the right compared to dark bars, top row panels Figure 8).
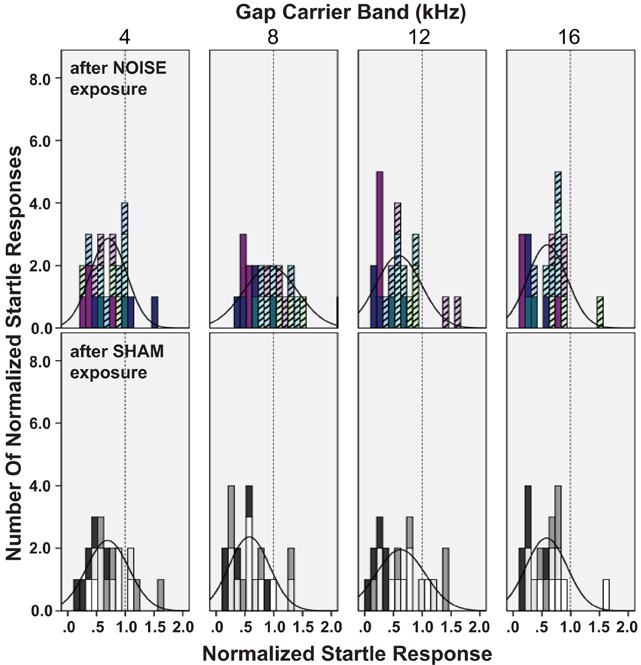
Figure 8. Noise exposure differentially affects gap-PPI in subgroups of noise exposed animals. Normalized startle responses for single days after noise exposure are shown as histograms for the different gap-carrier bands (panel columns), overlaid with the normal distribution curve of the histograms (black graph based on mean and standard deviation). Normalized startle responses were derived from the mean of all trials of one animal for one day with the gap normalized to the mean of all trials of one animal for one day without the gap. Data is included for 2–5 days with recovered ABR thresholds (2, 3, 3, 4, 4, 4 test days in the noise exposed groups and 5 days in the control group). Top row: noise exposed animals (N = 7), bottom row: control animals (N = 4). The individual animals' data are identified by the color of the stacked histograms. Noise-exposed animals are grouped as “tinnitus” (light, pastel colored striped bars, N = 4) or “no tinnitus” (dark colored bars, N= 3). “Tinnitus” animals show normalized responses shifted toward higher startle values. The dotted line in each panel marks 1 (100% startle).
The absolute startles of the gap-PPI and noise pulse-PPI task, together with the resulting normalized startles are shown for the “tinnitus” and “no-tinnitus” groups of animals (classified with Figure 8) in comparison to the control group in Figure 9. There was no significant difference between the “with gap” and “without gap” condition in the 8–10, 12–14, and 16–18 kHz bands in the tinnitus group (Figure 9A), indicating deteriorated gap detection in those bands, whereas the control groups' data showed significant differences in all bands. The difference between the “with prepulse” and “without prepulse” condition (Figure 9B) was significant for all three groups of animals in all frequency bands. This indicates tinnitus residing in the 8–18 kHz bands, which diminishes the gap detection in those bands. Even though the absolute startle “without gap” was decreased for the 8–10 kHz and the 12–14 kHz band in the “tinnitus” group compared to the control group it was still larger than the startle “with gap” in the control group i.e., giving room for further reduction of the startle due to the gap. That means that the failure to decrease the startle by the gap was not caused by a floor effect, further supporting tinnitus as underlying cause for the increased normalized startle.
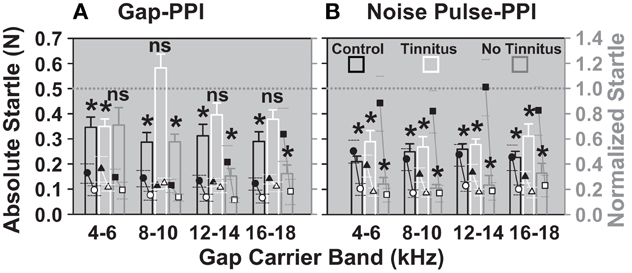
Figure 9. Animals in the tinnitus group show no significant detection of gaps in gap-carrier bands between 8 and 18 kHz. Normalized (bars, right Y axis, mean) and absolute startles (dot plots, left Y axis, mean ±95% confidence interval) are shown for the two noise exposure groups and the control group after the noise/sham exposure. (A) Gap-PPI and (B) noise pulse-PPI. Black bars and circles: sham exposure control group (n = 4), white bars and triangles: “tinnitus” group (n = 4), gray bars and squares: “no tinnitus” group (n = 3). Black symbols designate the mean of the absolute startles “without gap”, white symbols designate the mean of the startles “with gap”. Normalized startle responses were derived from the mean of all trials of one animal for one day with the gap normalized to the mean of all trials of one animal of one day without the gap. The *indicates significance in Two-Way repeated measures ANOVA (p < 0.05).
Modifications of ABR Waves Accompanying Tinnitus Manifestation
Amplitudes of all ABR waves for frequencies with and without tinnitus were larger for tinnitus animals and smaller for the no-tinnitus group compared to the control group. The increase in amplitude across all sound levels of the tinnitus animals compared to the control group was significant for the earlier waves N1, P2, and N3 (con < tinn labels, Figure 10A), whereas the amplitude decrease across sound levels of the no-tinnitus group was significant for the later waves P4, N4, and P5 (con > notinn labels, Figure 10A, p < 0.05, Linear mixed model, pairwise comparison of groups for each wave, details see Methods). Significant increases in the tinnitus groups' wave amplitudes were not confined to the frequency range of the tinnitus, but were observed for frequencies with tinnitus (N1), frequencies without tinnitus (P2), and for both frequency ranges (N3). In case of single levels showing significant differences these were observed at the highest levels tested (* and ‡ labels at 80 and 90 dB, Figure 10A, p < 0.05, Linear mixed model, pairwise comparison at each level for each IPL, details see Methods). ABR wave latencies tended to be longer in tinnitus animals and shorter in no-tinnitus animals. However, while there were no significant changes for the no-tinnitus group, the latency increase for the tinnitus animals was significant for P1, IPL 2–1, IPL 4–3, and IPL 5–4 (con < tinn labels, Figure 10B, p < 0.05, Linear mixed model, pairwise comparison of groups for each wave, details see Methods). These significant increases in latency for the tinnitus group were specific for frequencies with tinnitus (IPL 2–1 and IPL 5–4) or affected both frequency ranges (PL P1 and IPL 4–3).
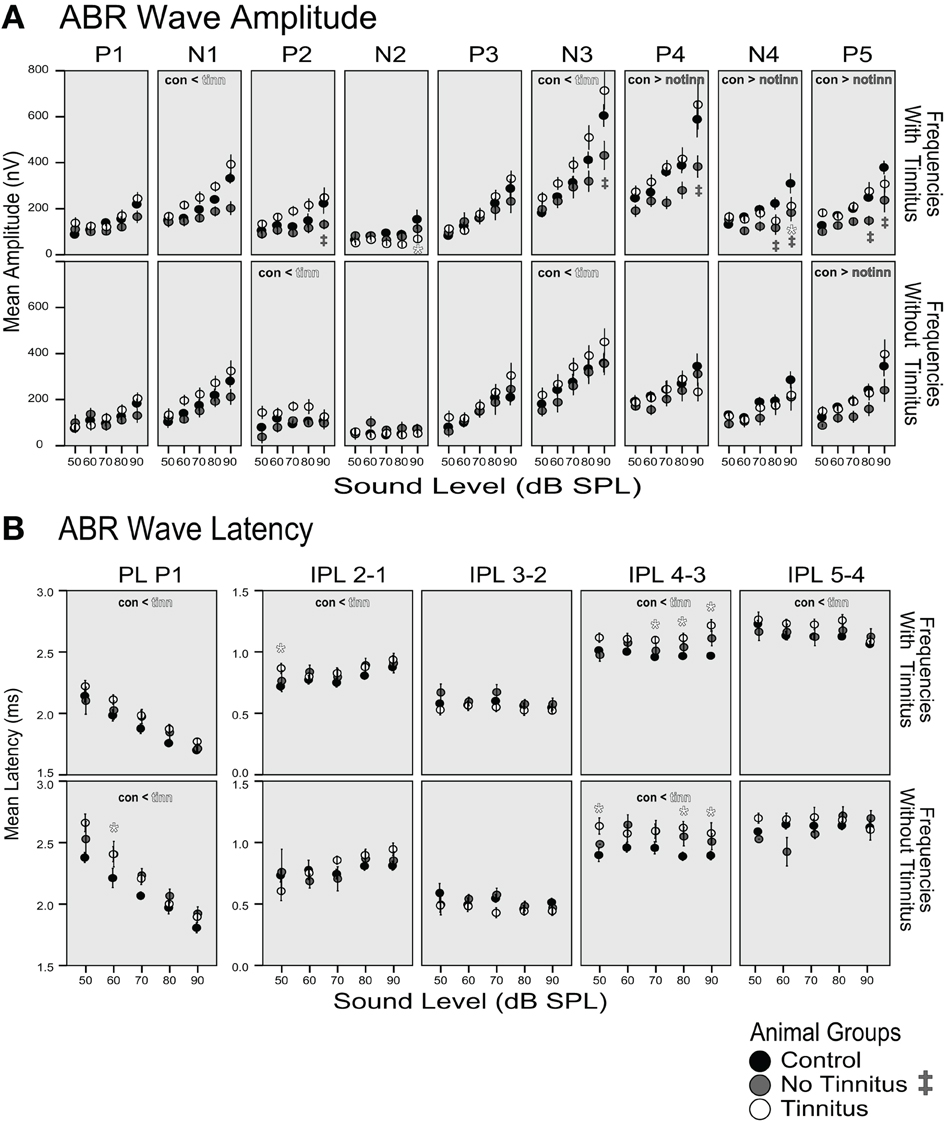
Figure 10. (A) Amplitude and (B) latency of ABRs as functions of sound level. Data was averaged across frequencies “with tinnitus” according to the PPI tests (8, 9, 12, 16 kHz; upper row panels in A and B) and “without tinnitus” (4, 6, 7 kHz; lower row panels). The mean and standard error is shown for the group of control (black dots, n = 4 animals), no-tinnitus (gray dots, n = 3 animals) and tinnitus animals (white dots, n = 4 animals). Significant differences between groups for an ABR parameter are indicated with < or > in the respective panel (p < 0.05, linear mixed model statistics with pairwise comparisons of groups across dB level) and significant differences for single levels are indicated with * (tinnitus vs. control group) and with ‡ (no-tinnitus vs. control; p < 0.05, linear mixed model statistics with pairwise comparisons at each level). For details see Methods. P1, P2, P3, P4, P5: positive wave peaks, N1, N2, N3, N4: negative wave troughs, PL: peak latency, IPL: interpeak latency, measured between the positive wave peaks.
Discussion
PPI of the Acoustic Startle Response in the Guinea Pig
In rats, startle reductions of 45–50% occur for 15 and 20 ms gaps in a 75 dB SPL BBN background (Wang et al., 2009b; Swetter et al., 2010). The similarity to the data obtained here (reduction of 51% in a 70 dB SPL BBN) underlines the suitability of the gap-PPI test in the guinea pig.
The startle response did not saturate at higher startle pulse levels as in other species (Pilz and Schnitzler, 1996; Plappert and Pilz, 2002; Gaese et al., 2009; Sun et al., 2009). However, we measured the startle response in the presence of background noise used for the gap- and noise pulse-PPI tests. The background masks the startle pulse and reduces the startle, so larger startles and greater saturation occurs without a background noise. Such a masking effect was also seen in the baseline gap-PPI: increasing the background noise from 60 to 70 dB SPL decreased the absolute startle for trials “without gap.”
The average startle for the 115 dB SPL startle pulse was 0.32 N, below the maximal startle but above background movements. This is important to avoid ceiling and floor effects when measuring PPI, i.e., a lower startle is more resistant to a further reduction, whereas a higher startle is relatively more reduced (Swerdlow et al., 2000). Baseline gap-PPI showed no relative floor effect: the absolute startle “without gap” in the 70 dB SPL condition was smaller than that in the 60 dB SPL condition, but its reduction was larger. Therefore, the larger startle response reduction in the 70 dB SPL condition can be attributed to greater salience of the gap in a louder carrier.
Short-term habituation of the startle but not of the gap-PPI, as shown previously, suggests that the animals' attention remained constant during the session or that the 15 ms gap length was sufficiently above detection threshold not to be influenced by attention. Decreasing attention results in a reduction of PPI if the prepulses are too close to detection threshold (Wu et al., 1984; Gewirtz and Davis, 1995). Habituation, a proposed correlate of synaptic depression in the caudal pontine reticular nucleus, is specific for the stimulus modality of the prepulse (Simons-Weidenmaier et al., 2006). However, in our dataset the animals' background movement also decreased, suggesting habituation or decreased arousal during the session.
Influence of Noise-Induced Temporary Threshold Shift on PPI
After recovery from noise exposure guinea pigs showed significantly diminished gap-PPI but normal noise pulse-PPI in the 8–10 kHz noise band compared to the control group. The absolute startle responses also indicated tinnitus-like behavior in the 12–14 and 16–18 kHz bands in a subgroup of animals. This is interpreted as tinnitus perception in the 8–10/12–14/16–18 kHz frequency bands, which corresponds to the frequency regions that showed TTS immediately after exposure.
Distinguishing tinnitus from other consequences of noise exposure
Gap detection is level-dependent below 20–30 dB SL (Hamann et al., 2004). However, monaural threshold elevation with an earplug does not diminish gap-PPI tested with the present paradigm (Turner et al., 2006). Also, results of the noise pulse-PPI test have been used to argue against hearing loss as a cause for diminished gap-PPI (Yang et al., 2007; Turner and Parrish, 2008). In this and previous studies (Turner et al., 2006; Turner and Parrish, 2008; Wang et al., 2009a) unilateral noise exposures causing TTS were preferred so as to leave one ear undisturbed to accomplish the behavioral task. This will be an important challenge for human studies using the gap-PPI paradigm. Deciding if one ear is undisturbed is difficult based on the knowledge that even with normal thresholds noise exposure can cause deafferentation and loss of hair cells or spiral ganglion cells and other structural and activity changes (Weisz et al., 2006; Zheng et al., 2006, 2007; Bauer et al., 2007; Brozoski et al., 2007; Kujawa and Liberman, 2009; Wang et al., 2009a; Zeng et al., 2009).
Changes in absolute vs. normalized startle—tinnitus behavior equals increased startle in the “with gap” condition
Changes in PPI after noise exposure reveal changes in both startle behavior, i.e., changes in the pathway mediating the acoustic startle, and in PPI, i.e., the pathway mediating sensorimotor gating (Swerdlow et al., 2000; Yee et al., 2005). Ideally, changes in sensorimotor gating occur because of gap detection deficits due to tinnitus, without concomitant changes in startle behavior. This would be expressed as an increase in the startle “with gap” and no change of the startle “without gap”. However, this “ideal case” is unlikely given the unavoidable effects of factors like aging and experience that influence startle behavior and gating (Friedman et al., 2004; Swetter et al., 2010). Changes over time unrelated to noise exposure were taken into account by comparing data for noise-exposed animals with an experience- and age-matched control group and resulted predominantly in a decrease in the startle in trials with and without gaps (not shown). Factors decreasing the startle over time presumably existed also in noise-exposed animals, but here development of tinnitus counteracted the decrease over time and increased the startle in the “with gap” condition only. Factors decreasing the startle over time should also affect noise pulse-PPI. However, the noise pulse-PPI was not diminished after noise exposure, pointing to tinnitus specifically affecting gap-PPI. A comparable absolute startle “without gap” between the control and experimental groups showed that changes in the normalized startle data were not contaminated by “relative floor/ceiling effects” (Swerdlow et al., 2000; Yee et al., 2005), with a higher startle response being more susceptible to a reduction and a smaller startle more susceptible to an enhancement. The difference between groups occurred in the startle response “with gap”, which was higher in the “tinnitus” group (Figure 9A), consistent with the hypothesis of tinnitus masking the gap.
Tinnitus and hyperacusis
In the present study, hyperacusis would likely result in decreased normalized startle responses for the gap- and noise-pulse PPI test as the gap carrier and noise-pulse are both well above hearing threshold. The startle response without preceding gap or noise-pulse should be increased (Sun et al., 2009). These expectations are met by the no-tinnitus group, which shows decreased normalized startles and increased absolute startles in the gap-PPI and noise pulse-PPI test. Because tinnitus and hyperacusis often co-occur (Anari et al., 1999; Schaaf et al., 2003; Nelson and Chen, 2004; Dauman and Bouscau-Faure, 2005), their effects on normalized startle responses in the gap-PPI test could counteract each other, with tinnitus increasing and hyperacusis decreasing the normalized startle values.
The site of tinnitus manifestation
Because of the gap-PPI specificity (pulse-PPI is not influenced, Figures 7, 9) tinnitus presumably occurs in neuronal groups that are part of the gap-encoding circuitry. The auditory input pathways of the gating circuits mediating the PPI reside in the auditory brainstem and midbrain (Koch, 1999; Li et al., 2009) and neuronal correlates of gap-detection in the IC match behavioral performance (Walton et al., 1997). Still top-down modulation from cortical inputs to the brainstem/midbrain could influence PPI by changed attention to the prepulses (Li et al., 2009; Du et al., 2011) and deficits in gap-PPI have been observed after cortex inactivation (Ison et al., 1991).
Noise-exposure also changes activity levels in structures outside the auditory system. Activity changes in structures as amygdala, hypothalamus, locus coeruleus, and others, have been implicated in tinnitus development (Wallhausser-Franke et al., 2003; Zhang et al., 2003; Mahlke and Wallhausser-Franke, 2004; Wang et al., 2009a; Rauschecker et al., 2010). These structures also play a role in the modulation of the acoustic startle and of the PPI (Koch, 1999; Li et al., 2009). Descending modulation of the gating circuit modifying the effectiveness of a prestimulus for PPI would change the normalized startle. However, changes in the gating circuit would presumably not be specific for the frequency or type of the auditory prepulse. In our data-set gap-PPI changed only for specific gap-carrier bands (8–10 kHz, 12–14 kHz, and 16–18 kHz) but not for the 4–6 kHz gap-carriers. In addition, the pulse-PPI task did not show changes. This argues against changes in descending modulation of the gating circuit underlying the observed tinnitus like behavior supporting the concept that gap encoding of auditory neurons in the primary gating pathway is disturbed due to tinnitus.
Changes of ABRs with Tinnitus Development
The amplitude of the tinnitus groups' ABRs were increased for the earlier waves up to N3, although this was only significant for waves N1, P2, and N3 and not specific for the tinnitus frequency range. The increase in amplitude fits the assumption that tinnitus is caused by hyperactivity and hyper-synchrony in the auditory brainstem and midbrain, i.e., in the auditory nerve (N1), anteroventral and posteroventral cochlear nucleus (P2), and SOC and/or MNTB [N3; (Buchwald and Huang, 1975; Achor and Starr, 1980; Gardi and Bledsoe, 1981; Wada and Starr, 1983a; Simha et al., 1988; Melcher and Kiang, 1996; Melcher et al., 1996a,b)].
This contradicts studies showing reduced wave I and III amplitudes in patients with tinnitus (Lemaire and Beutter, 1995; Schaette and Kempter, 2009; Schaette and McAlpine, 2011), however, corroborates another study showing enlarged wave III amplitudes in tinnitus patients (Attias et al., 1996). Otherwise enlarged waves were only found in middle latency responses, not in the early ABR waves (Gerken et al., 2001; Singh et al., 2011). Hyperactivity in animals with tinnitus in single unit recordings has only been shown in the DCN (Brozoski et al., 2002; Kaltenbach et al., 2004; Dehmel et al., 2012). Hyperactivity after noise exposure has been shown in the VCN (Bledsoe et al., 2009; Vogler et al., 2011). However, hyperactivity after noise exposure in the auditory nerve, VCN, posteroventral cochlear nucleus, and their projection targets in the TB and SOC as suggested by our ABR data would need to be corroborated by unit recordings in animals with tinnitus.
The no-tinnitus animals showed a tendency for a reduction of wave amplitudes, which was significant for waves presumably generated by the SOC, TB, and LL [P4, N4; (Buchwald and Huang, 1975; Wada and Starr, 1983b; Simha et al., 1988; Popelar et al., 2008)] and by the IC and/or LL [P5; (Melcher and Kiang, 1996; Melcher et al., 1996a,b; Popelar et al., 2008)].
The effects seen in the early waves are not detectable in later waves starting with P4. This might result from plastic changes of e.g., synapse efficiency, excitatory-inhibitory balance that counteract the modified input from the lower brainstem.
The discrepancy between the ABR results of our study and the studies with tinnitus patients (Lemaire and Beutter, 1995; Schaette and Kempter, 2009; Schaette and McAlpine, 2011) might result from the longer times between the noise exposure and development of tinnitus in case of the human studies and/or the more diverse or unclear causes of tinnitus in patients compared to the controlled conditions in animal experiments.
There are no other animal ABR studies comparing noise-exposed animals with and without the development of tinnitus, however, in the studies investigating the effect of noise exposure a higher percentage of animals not developing tinnitus might have resulted in decreased wave I amplitudes, as in our no-tinnitus group (Kujawa and Liberman, 2009; Lin et al., 2011). In addition the difference between our study and the studies of Liberman et al. might be caused by the different noise exposure regimes (awake, binaural exposure in Libermans' studies vs. anesthetized, monaural in our model).
An effect on the latency of the ABR waveforms was only observed in the tinnitus group which showed a significant prolongation of the P1 latency and all interpeak latencies except IPL 3–2 for the tinnitus frequency range. These data replicate the prolonged latencies found in tinnitus patients (Lemaire and Beutter, 1995; Rosenhall and Axelsson, 1995; Gerken et al., 2001; Kehrle et al., 2008) and are assumed to indicate the effect of the noise exposure on the auditory nerve and additional conductivity and processing problems along the auditory pathway, which as shown here, lead to tinnitus.
Changes in amplitudes and latencies of the different ABR waves and thus in the gross activity of the respective structures would also change their function as part of the primary startle reflex-eliciting circuit (VCN and lateral superior olive) and of the gating pathway (cochlear nucleus and IC).
Conflict of Interest Statement
The authors declare that the research was conducted in the absence of any commercial or financial relationships that could be construed as a potential conflict of interest.
Acknowledgments
This work was supported by the Tinnitus Research Initiative, NIH R01DC004825, and P01 DC00078. We are grateful to Chris Ellinger and Dwayne Vailliencort for the excellent technical assistance with the setup and Beth Hand and Gary Dootz, for expert data collection and analysis. We thank Ben Yates for excellent graphic and editorial assistance and Jeremy Turner for valuable discussions and comments on the manuscript.
Abbreviations
ABR, auditory brainstem response; BBN, broad-band noise; DCN, dorsal cochlear nucleus; IC, inferior colliculus; LL, lateral lemniscus; MNTB, medial nucleus of the trapezoid body; PPI, prepulse inhibition; SOC, superior olivary complex; TTS, temporary threshold shift; VCN, ventral cochlear nucleus.
References
Achor, L. J., and Starr, A. (1980). Auditory brain stem responses in the cat. II. Effects of lesions. Electroencephalogr. Clin. Neurophysiol. 48, 174–190.
Anari, M., Axelsson, A., Eliasson, A., and Magnusson, L. (1999). Hypersensitivity to sound. Scand. Audiol. 28, 219–230.
Attias, J., Pratt, H., Reshef, I., Bresloff, I., Horowitz, G., Polyakov, A., and Shemesh, Z. (1996). Detailed analysis of auditory brainstem responses in patients with noise-induced tinnitus. Audiology 35, 259–270.
Bauer, C. A., and Brozoski, T. J. (2001). Assessing tinnitus and prospective tinnitus therapeutics using a psychophysical animal model. J. Assoc. Res. Otolaryngol. 2, 54–64.
Bauer, C. A., Brozoski, T. J., and Myers, K. (2007). Primary afferent dendrite degeneration as a cause of tinnitus. J. Neurosci. Res. 85, 1489–1498.
Bledsoe, S. C. Jr. Koehler, S., Tucci, D. L., Zhou, J., Le Prell, C., and Shore, S. E. (2009). Ventral cochlear nucleus responses to contralateral sound are mediated by commissural and olivocochlear pathways. J. Neurophysiol. 102, 886–900.
Brozoski, T. J., Bauer, C. A., and Caspary, D. M. (2002). Elevated fusiform cell activity in the dorsal cochlear nucleus of chinchillas with psychophysical evidence of tinnitus. J. Neurosci. 22, 2383–2390.
Brozoski, T. J., Ciobanu, L., and Bauer, C. A. (2007). Central neural activity in rats with tinnitus evaluated with manganese-enhanced magnetic resonance imaging (MEMRI). Hear. Res. 228, 168–179.
Buchwald, J. S., and Huang, C. (1975). Far-field acoustic response: origins in the cat. Science 189, 382–384.
Dauman, R., and Bouscau-Faure, F. (2005). Assessment and amelioration of hyperacusis in tinnitus patients. Acta Otolaryngol. 125, 503–509.
Davis, A., and Rafaie, E. A. (2000). “Epidemiology of tinnitus,” in Tinnitus Handbook, ed R. S. Tyler (San Diego, CA: Singular Publishing Group),1–24.
Dehmel, S., Pradhan, S., Koehler, S., Bledsoe, S., and Shore, S. (2012). Noise over-exposure alters long-term somatosensory-auditory processing in the dorsal cochlear nucleus – possible basis for tinnitus-related hyperactivity? J. Neurosci. 32, 1660–1671.
Du, Y., Wu, X., and Li, L. (2011). Differentially organized top-down modulation of prepulse inhibition of startle. J. Neurosci. 31, 13644–13653.
Fendt, M., Li, L., and Yeomans, J. S. (2001). Brain stem circuits mediating prepulse inhibition of the startle reflex. Psychopharmacology (Berl.) 156, 216–224.
Friedman, J. T., Peiffer, A. M., Clark, M. G., Benasich, A. A., and Fitch, R. H. (2004). Age and experience-related improvements in gap detection in the rat. Brain Res. Dev. Brain Res. 152, 83–91.
Gaese, B. H., Nowotny, M., and Pilz, P. K. (2009). Acoustic startle and prepulse inhibition in the Mongolian gerbil. Physiol. Behav. 98, 460–466.
Gardi, J. N., and Bledsoe, S. C. Jr. (1981). The use of kainic acid for studying the origins of scalp-recorded auditory brainstem responses in the guinea pig. Neurosci. Lett. 26, 143–149.
Gerken, G. M., Hesse, P. S., and Wiorkowski, J. J. (2001). Auditory evoked responses in control subjects and in patients with problem-tinnitus. Hear. Res. 157, 52–64.
Gewirtz, J. C., and Davis, M. (1995). Habituation of prepulse inhibition of the startle reflex using an auditory prepulse close to background noise. Behav. Neurosci. 109, 388–395.
Gourevitch, B., Doisy, T., Avillac, M., and Edeline, J. M. (2009). Follow-up of latency and threshold shifts of auditory brainstem responses after single and interrupted acoustic trauma in guinea pig. Brain Res. 1304, 66–79.
Hamann, I., Gleich, O., Klump, G. M., Kittel, M. C., and Strutz, J. (2004). Age-dependent changes of gap detection in the Mongolian gerbil (Meriones unguiculatus). J. Assoc. Res. Otolaryngol. 5, 49–57.
Heffner, H. E., and Harrington, I. A. (2002). Tinnitus in hamsters following exposure to intense sound. Hear. Res. 170, 83–95.
Heffner, R., Heffner, H., and Masterton, B. (1971). Behavioral measurements of absolute and frequency-difference thresholds in guinea pig. J. Acoust. Soc. Am. 49, 1888–1895.
Hsu, W. C., Wang, J. D., Lue, J. H., Day, A. S., and Young, Y. H. (2008). Physiological and morphological assessment of the saccule in Guinea pigs after noise exposure. Arch. Otolaryngol. Head Neck Surg. 134, 1099–1106.
Ison, J. R., O'Connor, K., Bowen, G. P., and Bocirnea, A. (1991). Temporal resolution of gaps in noise by the rat is lost with functional decortication. Behav. Neurosci. 105, 33–40.
Jastreboff, P. J., Brennan, J. F., Coleman, J. K., and Sasaki, C. T. (1988). Phantom auditory sensation in rats: an animal model for tinnitus. Behav. Neurosci. 102, 811–822.
Kaltenbach, J. A., Zacharek, M. A., Zhang, J., and Frederick, S. (2004). Activity in the dorsal cochlear nucleus of hamsters previously tested for tinnitus following intense tone exposure. Neurosci. Lett. 355, 121–125.
Kaltenbach, J. A., Zhang, J., and Finlayson, P. (2005). Tinnitus as a plastic phenomenon and its possible neural underpinnings in the dorsal cochlear nucleus. Hear. Res. 206, 200–226.
Kehrle, H. M., Granjeiro, R. C., Sampaio, A. L., Bezerra, R., Almeida, V. F., and Oliveira, C. A. (2008). Comparison of auditory brainstem response results in normal-hearing patients with and without tinnitus. Arch. Otolaryngol. Head Neck Surg. 134, 647–651.
Kujawa, S. G., and Liberman, M. C. (2009). Adding insult to injury: cochlear nerve degeneration after “temporary” noise-induced hearing loss. J. Neurosci. 29, 14077–14085.
Lemaire, M. C., and Beutter, P. (1995). Brainstem auditory evoked responses in patients with tinnitus. Audiology 34, 287–300.
Li, L., Du, Y., Li, N., Wu, X., and Wu, Y. (2009). Top-down modulation of prepulse inhibition of the startle reflex in humans and rats. Neurosci. Biobehav. Rev. 33, 1157–1167.
Lin, H. W., Furman, A. C., Kujawa, S. G., and Liberman, M. C. (2011). Primary neural degeneration in the Guinea pig cochlea after reversible noise-induced threshold shift. J. Assoc. Res. Otolaryngol. 12, 605–616.
Lobarinas, E., Sun, W., Cushing, R., and Salvi, R. (2004). A novel behavioral paradigm for assessing tinnitus using schedule-induced polydipsia avoidance conditioning (SIP-AC). Hear. Res. 190, 109–114.
Longenecker, R. J., and Galazyuk, A. V. (2011). Development of tinnitus in CBA/CaJ mice following sound exposure. J. Assoc. Res. Otolaryngol. 12, 647–658.
Mahlke, C., and Wallhausser-Franke, E. (2004). Evidence for tinnitus-related plasticity in the auditory and limbic system, demonstrated by arg3.1 and c-fos immunocytochemistry. Hear. Res. 195, 17–34.
Melcher, J. R., Guinan, J. J. Jr. Knudson, I. M., and Kiang, N. Y. (1996a). Generators of the brainstem auditory evoked potential in cat. II. Correlating lesion sites with waveform changes. Hear. Res. 93, 28–51.
Melcher, J. R., Knudson, I. M., Fullerton, B. C., Guinan, J. J. Jr. Norris, B. E., and Kiang, N. Y. (1996b). Generators of the brainstem auditory evoked potential in cat. I. An experimental approach to their identification. Hear. Res. 93, 1–27.
Melcher, J. R., and Kiang, N. Y. (1996). Generators of the brainstem auditory evoked potential in cat. III: Identified cell populations. Hear. Res. 93, 52–71.
Nelson, J. J., and Chen, K. (2004). The relationship of tinnitus, hyperacusis, and hearing loss. Ear Nose Throat J. 83, 472–476.
Nowotny, M., Remus, M., Kossl, M., and Gaese, B. H. (2011). Characterization of the perceived sound of trauma-induced tinnitus in gerbils. J. Acoust. Soc. Am. 130, 2827–2834.
Pilz, P. K., and Schnitzler, H. U. (1996). Habituation and sensitization of the acoustic startle response in rats: amplitude, threshold, and latency measures. Neurobiol. Learn. Mem. 66, 67–79.
Plappert, C. F., and Pilz, P. K. (2002). Difference in anxiety and sensitization of the acoustic startle response between the two inbred mouse strains BALB/cAN and DBA/2N. Genes Brain Behav. 1, 178–186.
Popelar, J., Grecova, J., Rybalko, N., and Syka, J. (2008). Comparison of noise-induced changes of auditory brainstem and middle latency response amplitudes in rats. Hear. Res. 245, 82–91.
Prosen, C. A., Petersen, M. R., Moody, D. B., and Stebbins, W. C. (1978). Auditory thresholds and kanamycin-induced hearing loss in the guinea pig assessed by a positive reinforcement procedure. J. Acoust. Soc. Am. 63, 559–566.
Rauschecker, J. P., Leaver, A. M., and Muhlau, M. (2010). Tuning out the noise: limbic-auditory interactions in tinnitus. Neuron 66, 819–826.
Rosenhall, U., and Axelsson, A. (1995). Auditory brainstem response latencies in patients with tinnitus. Scand. Audiol. 24, 97–100.
Ruttiger, L., Ciuffani, J., Zenner, H. P., and Knipper, M. (2003). A behavioral paradigm to judge acute sodium salicylate-induced sound experience in rats: a new approach for an animal model on tinnitus. Hear. Res. 180, 39–50.
Schaaf, H., Klofat, B., and Hesse, G. (2003). Hyperacusis, phonophobia, and recruitment. Abnormal deviations of hearing associated with hypersensitivity to sound. HNO 51, 1005–1011.
Schaette, R., and Kempter, R. (2009). Predicting tinnitus pitch from patients' audiograms with a computational model for the development of neuronal hyperactivity. J. Neurophysiol. 101, 3042–3052.
Schaette, R., and McAlpine, D. (2011). Tinnitus with a normal audiogram: physiological evidence for hidden hearing loss and computational model. J. Neurosci. 31, 13452–13457.
Simha, N., Paquereau, J., Cazals, Y., and Aran, J. M. (1988). Effects of electrolytic lesions of the superior olivary complex and trapezoid body on brainstem auditory-evoked potentials in the guinea pig. I. Vertex-tragus recordings. Audiology 27, 279–290.
Simons-Weidenmaier, N. S., Weber, M., Plappert, C. F., Pilz, P. K., and Schmid, S. (2006). Synaptic depression and short-term habituation are located in the sensory part of the mammalian startle pathway. BMC Neurosci. 7, 38.
Singh, S., Munjal, S. K., and Panda, N. K. (2011). Comparison of auditory electrophysiological responses in normal-hearing patients with and without tinnitus. J. Laryngol. Otol. 125, 668–672.
Sun, W., Lu, J., Stolzberg, D., Gray, L., Deng, A., Lobarinas, E., and Salvi, R. J. (2009). Salicylate increases the gain of the central auditory system. Neuroscience 159, 325–334.
Swerdlow, N. R., Braff, D. L., and Geyer, M. A. (2000). Animal models of deficient sensorimotor gating: what we know, what we think we know, and what we hope to know soon. Behav. Pharmacol. 11, 185–204.
Swerdlow, N. R., Geyer, M. A., and Braff, D. L. (2001). Neural circuit regulation of prepulse inhibition of startle in the rat: current knowledge and future challenges. Psychopharmacology (Berl.) 156, 194–215.
Swetter, B. J., Fitch, R. H., and Markus, E. J. (2010). Age-related decline in auditory plasticity: experience dependent changes in gap detection as measured by prepulse inhibition in young and aged rats. Behav. Neurosci. 124, 370–380.
Turner, J., Larsen, D., Hughes, L., Moechars, D., and Shore, S. (2012). Time course of tinnitus development following noise exposure in mice. J. Neurosci. Res. 90, 1480–1488.
Turner, J. G., Brozoski, T. J., Bauer, C. A., Parrish, J. L., Myers, K., Hughes, L. F., and Caspary, D. M. (2006). Gap detection deficits in rats with tinnitus: a potential novel screening tool. Behav. Neurosci. 120, 188–195.
Turner, J. G., and Parrish, J. (2008). Gap detection methods for assessing salicylate-induced tinnitus and hyperacusis in rats. Am. J. Audiol. 17, S185–S192.
Vogler, D. P., Robertson, D., and Mulders, W. H. (2011). Hyperactivity in the ventral cochlear nucleus after cochlear trauma. J. Neurosci. 31, 6639–6645.
Wada, S. I., and Starr, A. (1983a). Generation of auditory brain stem responses (ABRs). I. Effects of injection of a local anesthetic (procaine HCI) into the trapezoid body of guinea pigs and cat. Electroencephalogr. Clin. Neurophysiol. 56, 326–339.
Wada, S. I., and Starr, A. (1983b). Generation of auditory brain stem responses (ABRs). II. Effects of surgical section of the trapezoid body on the ABR in guinea pigs and cat. Electroencephalogr. Clin. Neurophysiol. 56, 340–351.
Wada, S. I., and Starr, A. (1983c). Generation of auditory brain stem responses (ABRs). III. Effects of lesions of the superior olive, lateral lemniscus and inferior colliculus on the ABR in guinea pig. Electroencephalogr. Clin. Neurophysiol. 56, 352–366.
Wallhausser-Franke, E., Mahlke, C., Oliva, R., Braun, S., Wenz, G., and Langner, G. (2003). Expression of c-fos in auditory and non-auditory brain regions of the gerbil after manipulations that induce tinnitus. Exp. Brain Res. 153, 649–654.
Walton, J. P., Frisina, R. D., Ison, J. R., and O'Neill, W. E. (1997). Neural correlates of behavioral gap detection in the inferior colliculus of the young CBA mouse. J. Comp. Physiol. A 181, 161–176.
Wang, H., Brozoski, T. J., Turner, J. G., Ling, L., Parrish, J. L., Hughes, L. F., and Caspary, D. M. (2009a). Plasticity at glycinergic synapses in dorsal cochlear nucleus of rats with behavioral evidence of tinnitus. Neuroscience 164, 747–759.
Wang, H., Turner, J. G., Ling, L., Parrish, J. L., Hughes, L. F., and Caspary, D. M. (2009b). Age-related changes in glycine receptor subunit composition and binding in dorsal cochlear nucleus. Neuroscience 160, 227–239.
Weisz, N., Hartmann, T., Dohrmann, K., Schlee, W., and Norena, A. (2006). High-frequency tinnitus without hearing loss does not mean absence of deafferentation. Hear. Res. 222, 108–114.
Wu, M. F., Krueger, J., Ison, J. R., and Gerrard, R. L. (1984). Startle reflex inhibition in the rat: its persistence after extended repetition of the inhibitory stimulus. J. Exp. Psychol. Anim. Behav. Process. 10, 221–228.
Yang, G., Lobarinas, E., Zhang, L., Turner, J., Stolzberg, D., Salvi, R., and Sun, W. (2007). Salicylate induced tinnitus: behavioral measures and neural activity in auditory cortex of awake rats. Hear. Res. 226, 244–253.
Yee, B. K., Chang, T., Pietropaolo, S., and Feldon, J. (2005). The expression of prepulse inhibition of the acoustic startle reflex as a function of three pulse stimulus intensities, three prepulse stimulus intensities, and three levels of startle responsiveness in C57BL6/J mice. Behav. Brain Res. 163, 265–276.
Zeng, C., Nannapaneni, N., Zhou, J., Hughes, L. F., and Shore, S. (2009). Cochlear damage changes the distribution of vesicular glutamate transporters associated with auditory and nonauditory inputs to the cochlear nucleus. J. Neurosci. 29, 4210–4217.
Zhang, J. S., Kaltenbach, J. A., Wang, J., and Kim, S. A. (2003). Fos-like immunoreactivity in auditory and nonauditory brain structures of hamsters previously exposed to intense sound. Exp. Brain Res. 153, 655–660.
Zheng, Y., Baek, J. H., Smith, P. F., and Darlington, C. L. (2007). Cannabinoid receptor down-regulation in the ventral cochlear nucleus in a salicylate model of tinnitus. Hear. Res. 228, 105–111.
Keywords: prepulse inhibition, gap detection, noise exposure, behavioral model of tinnitus, auditory brainstem responses
Citation: Dehmel S, Eisinger D and Shore SE (2012) Gap prepulse inhibition and auditory brainstem-evoked potentials as objective measures for tinnitus in guinea pigs. Front. Syst. Neurosci. 6:42. doi: 10.3389/fnsys.2012.00042
Received: 21 January 2012; Accepted: 08 May 2012;
Published online: 31 May 2012.
Edited by:
Larry Roberts, McMaster University, CanadaCopyright: © 2012 Dehmel, Eisinger and Shore. This is an open-access article distributed under the terms of the Creative Commons Attribution Non Commercial License, which permits non-commercial use, distribution, and reproduction in other forums, provided the original authors and source are credited.
*Correspondence: Susan E. Shore, Department of Otolaryngology, Kresge Hearing Research Institute, University of Michigan, Ann Arbor, Rm 5434 MSI, MI 48109-5616, USA. e-mail: sushore@umich.edu