Oscillations Governed by the Incoherent Dynamics in Necroptotic Signaling
 Fei Xu1,2
  Xiang Li
- 1Department of Physics, Xiamen University, Xiamen, China
- 2Wenzhou Institute, University of Chinese Academy of Sciences, Wenzhou, China
- 3State Key Laboratory of Cellular Stress Biology, Innovation Center for Cell Signaling Network, Xiamen University, Xiamen, China
- 4National Institute for Data Science in Health and Medicine, Xiamen University, Xiamen, China
Emerging evidences have suggested that oscillation is important for the induction of cell death. However, whether and how oscillation behavior is involved and required for necroptosis remain elusive. To address this question, a minimal necroptotic circuit is proposed based on the CNS pathway. Stochastic parameter analysis demonstrates that the essential structure for oscillation of the CNS circuit is constituted by a paradoxical component embedded with positive feedback among the three protein nodes, i.e., RIP1, caspase-8, and RIP3. Distribution characteristics of all parameters in the CNS circuit with stable oscillation are investigated as well, and a unidirectional bias with fast and slow dynamics that are required for high occurrence probability of oscillation is identified. Four types of oscillation behaviors are classified and their robustness is further explored, implying that the fast oscillation behavior is more robust than the slow behavior. In addition, bifurcation analysis and landscape approach are employed to study stochastic dynamics and global stability of the circuit oscillations, revealing the possible switching strategies among different behaviors. Taken together, our study provides a natural and physical bases for understanding the occurrence of oscillations in the necroptotic network, advancing our knowledge of oscillations in regulating the various cell death signaling.
Introduction
Oscillatory signaling is ubiquitous in vital movement, and precisely controls the sequential behaviors of many important physiological processes [1–3], such as circadian rhythm [4], embryonic development [5], neuron electrophysiology [6], and cell cycle [7]. Oscillation behavior of molecules, for instance, calcium ions, tumor suppressor gene p53, p38 MAPK (mitogen-activated protein kinases), and NF-κB (Nuclear Factor-kappa B) in inflammatory response, determines the fate of cells [8–10]. Organisms can identify, encode, and transmit different biological information, and perform different responses with different modulation methods through oscillatory signaling, including amplitude modulation or frequency modulation [11, 12]. The biological systems are nonlinear and quite complicated, and the dynamic behavior of oscillation in individual cells might be annihilated in population average dynamic behavior [9]. Thus, to accurately understand how biological oscillation controls biological functions is still a challenge.
Oscillations seem to be an important prerequisite for the processing of the cell death signaling [13–18]. The bistable, excitability, and oscillation are combined with spatial coupling mechanism like diffusion, which can propagate as trigger waves [19]. Recently, the spread pattern of self-regenerating trigger waves had been confirmed in the process of apoptosis [20]. Besides, reports have shown that the ferroptosis signal spreads stably in the cell population in a wave-like pattern [21, 22]. Necroptosis, a passive and irreversible inflammatory form of cell death, is quite different from apoptosis and ferroptosis. Its physiological manifestations are cell volume expansion, cell membrane rupture, intracellular material overflow, incomplete DNA degradation, and local severe inflammatory reaction. Necroptosis is involved in many diseases, such as acute pancreatitis ischemia, cardio-cerebrovascular disease, and so on [23, 24]. Whether and how the cellular necroptosis signaling (CNS) could spread and induce cell death in the form of oscillation-induced trigger waves remains unclear.
Mathematical modeling with qualitative or quantitative analysis has become an important approach for dissecting the complex regulatory mechanisms of biological system [25]. Numerous studies have explored the design principle of signaling circuits with various biological functions. The relationships between network motifs [26] (such as paradoxical components [27–29], feed-forward loop [30], and feedback loop [31–33]) and biochemical oscillator [34–36], adaptation [37], robustness [38–41], and noise attenuation [42–44] have been revealed successively. Designing and developing a signaling circuit system with regulatory function is of guiding significance for the further understanding of how oscillation signals regulate biological processes [13, 45]. For instance, the minimum free-energy cost of biological oscillation to overcome the large fluctuations from the environment and maintain coherence has been successively revealed [46–48]. The design principle of a biological oscillation network with high accuracy and sensitivity under limited energy cost was further explained [49, 50].
In our study, we propose a CNS circuit to systematically analyze the robust oscillation dynamics in the CNS pathway. The essential structure of the circuit for generating the occurrence of necroptotic oscillation is determined. Moreover, how each component in the network mediates the probability of oscillation occurrence is investigated. The two different incoherent dynamics, fast and slow dynamics within a unidirectional bias, are demonstrated to be the key mechanism for the high probability of oscillation occurrence. Ultimately, both the bifurcation analysis and potential landscape theory are performed to explore the switching strategies among different types of oscillation through regulating the interaction within the unidirectional bias.
Results
Overview of the Core Circuit in CNS Pathway
The diagram of TNF-induced necroptotic signaling is shown in Figure 1A. Upon TNF stimulation, TNF binds TNFR1 on cell membrane and promotes oligomerization of TNFR1 to form homotrimer. Oligomerization of TNFR1 induces the conformational changes in its intracellular domain, leading to the recruitment of TRADD (TNFR1 associated death domain protein) and RIP1 (Receptor-interacting protein kinase 1) to form Complex-Ⅰ [51]. TRADD and RIP1 compete for the binding sites on TNFR1 in complex I to mediate the downstream signaling [52]. Then, the modulated RIP1 dissociates from Complex Ⅰ and combines with the RIP3 through RHIM-domain to form a “Necrosome” complex [53]. RIP3 is phosphorylated by RIP1 in necrosome [54, 55]. Besides being activated by RIP1, RIP3 can also be autophosphorylated in the kinase domain of Ser227 (human)/Thr231-Ser232 (mouse) [54, 56, 57]. RIP1 also binds FADD through the death domain, and further recruit caspase-8 into necrosome [58–60]. TRADD can also drop from complex I to recruit FADD and caspase-8, which is an important process for the activation of caspase-8 [61]. Under normal circumstances, cleavage of RIP1 and RIP3 by caspase-8 limit the occurrence of necroptosis [62, 63]. Besides, a very recently study reported that phosphorylated RIP3 suppresses caspase-8 activity through the recruitment of RSK [64]. Necrosome subsequently recruits and phosphorylates the downstream protein MLKL [65], which will form oligomers and transfer from cytoplasm to the cell membrane, resulting in the induction of necroptosis.
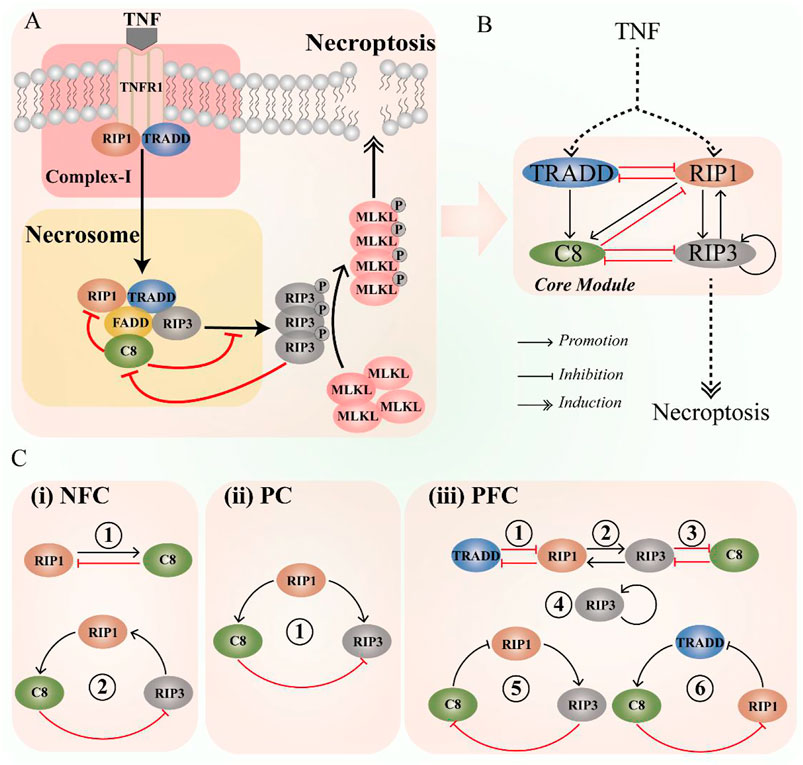
FIGURE 1. Schematic diagram of the CNS pathway, highlighting the key components and interaction. (A) The CNS signaling pathway. (B) The coarse-grained CNS circuit. (C) Three types of significant interaction among components in the circuit, i.e., negative feedback components (NFC, contradictory interaction and feedback loops), paradoxical components (PC, incoherent feedforward), and positive feedback components (PFC, self-activation, mutual activation or inhibition, and feedback loops).
To intuitively describe the interaction of the core module, coarse-grained method [66] is employed to simplify the CNS pathway into circuit, and the schematic diagram is shown in Figure 1B. The circuit includes four components, i.e., TRADD, RIP1, caspase-8, and RIP3. The necroptotic dynamics are mainly determined by these four components in necrosome, while MLKL is not considered in the CNS circuit. This is because MLKL mediates cell necroptosis as a downstream substrate of RIP3. Studies have shown that knocking down MLKL expression by RNA interference will not affect the RIP3 or the other upstream signaling [67, 68]. In the circuit, there are various interaction among the four proteins (Figure 1C), such as negative feedback components, positive feedback components, and the paradoxical components [27–29], which can produce abundant dynamic behaviors [36, 69–71].
Searching the Essential Structure for Oscillation Within the CNS Circuit
To discuss the oscillation dynamics in the CNS pathway, we construct a set of self-evolving ODEs model based on the circuit shown in Figure 1B. The model has four variables and ten interaction terms. ODEs and the detailed description of the parameters in the interaction terms can be found in Supplementary Information S1.1. In the model, the components are switched between active and inactive forms by phosphorylation, dephosphorylation, or cleavage. For systematically analysis, Latin Hypercube Sampling method [72] is employed to randomly scan the network parameters in the widely parameter space for evaluating the stable oscillation behavior of the CNS circuit (Supplementary Information S1.2). For sampling uniformity, the exponential sampling range of k_i is −1 to 1, and the exponential sampling range of j_i is −3 to 2. The Hill coefficient n_i is a random integer sampling with 1–4. All the parameters k_i, j_i, and the Hill coefficient n_i of the model are sampled within the proper ranges based the previous studies [31, 37]. We randomly select more than 30 million sets of parameter combinations, in other words, we analyze 30 million dynamic systems to test whether the system can produce robust oscillation. The probability of robust oscillation of pRIP3 (phosphorylated RIP3) is taken as the evaluation object and the analysis procedure is shown in Figure 2A.
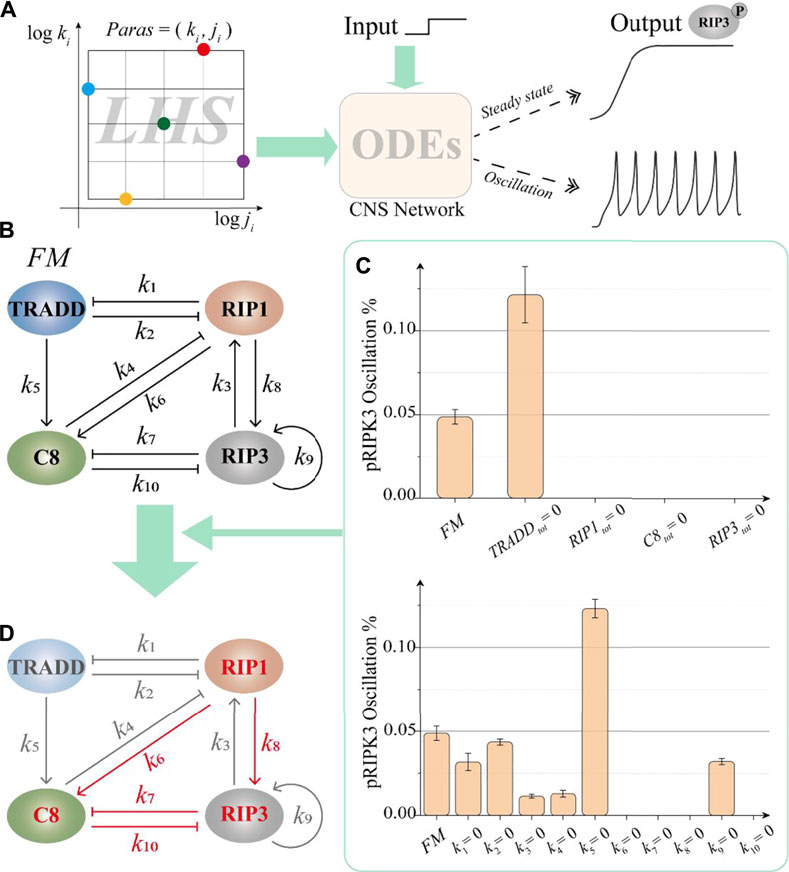
FIGURE 2. Identification of the essential structure in the CNS circuit. (A) The Latin Hypercube Sampling method analysis procedure for a set of given parameters. The dynamic behavior of pRIP3 is the object of investigation. (B) The full model (FM) contains four major proteins and ten interaction terms, in which each interaction is controlled by the corresponding parameters. (C) The statistical results of the circuit oscillation probability after removing one protein or one interaction, respectively. (D) The red mark highlights the essential structure of the CNS circuit for generating oscillation.
We firstly intend to identify the key protein nodes and essential interaction in the CNS circuit (Figure 2B) that required for oscillation generation. In the numerical simulation, 500,000 groups of random samples are taken for each simulation test, and each simulation test is repeated 5 times. For the four protein nodes, i.e., TRADD, RIP1, caspase-8 and RIP3, we respectively set their total amounts to 0 one by one and count the probability of oscillation behavior of pRIP3. This total amount is determined by the natural generation rate and degradation rate of protein, which is considered as unit 1 in the normalized model [9]. Thus, the steady states of the system could be regulated by the total amount of the proteins. As the result shown in the upper panel of Figure 2C, TRADD is not required and the probability of circuit oscillation without considering TRADD exhibits nearly 3-fold compared with the full model (FM). While RIP1, caspase-8, and RIP3 are essential for the circuit to oscillate. We next explore the key interaction for the generation of oscillation by limiting the corresponding parameters. There are 10 interaction terms among TRADD, RIP1, caspase-8, and RIP3 in the circuit, which are mainly described by the 10 parameters (k1–k10). The 10 parameters in these terms are in turn fixed at 0, respectively. As the result shown in the lower panel of Figure 2C, when the four parameters of k6, k7, k8, and k10 are limited, the probability of pRIP3 oscillation is zero, indicating that the interaction terms characterized by these four parameters are necessary for producing oscillation behavior. Moreover, two interaction parameters are simultaneously fixed to zero in turn in our further analysis (Supplementary Figure S2), supporting the results shown in Figure 2C. The statistical results of simultaneously fixing three or more parameters to zero are similar. Therefore, based on these statistical analysis, the essential structure for generating oscillation of the CNS circuit is determined and highlighted in Figure 2D. The structure is constituted by a paradoxical component embedded with a positive feedback among three protein nodes (i.e., RIP1, caspase-8, and RIP3). Despite the parameters of k3 and k4 are not necessary for the oscillation behavior, the probability of the system is only one-third of FM when k3 or k4 is set to 0 (Figure 2C, down panel), indicating these two interaction terms are also important for the oscillation induction.
Oscillation Determined by the Fast and Slow Dynamics Within a Unidirectional Bias
Having identified the essential structure for generating robust oscillation, we further explore the control mechanism of how the behavior is generated and regulated by the key protein nodes and essential interaction. Figure 3A presents how the network oscillation probability is regulated by the total amounts of the three key nodes, i.e., RIP1, caspase-8 and RIP3. As the results suggested, the oscillation probability increases with the increase of the total amount of RIP1 or caspase-8. A 10-fold increase of their total amounts will improve the oscillation probability by nearly 7-fold. However, variation of RIP3 amount has no significant effects on the probability. Therefore, high amount of RIP1 or caspase-8 will accelerate the occurrence of oscillation in the CNS circuit.
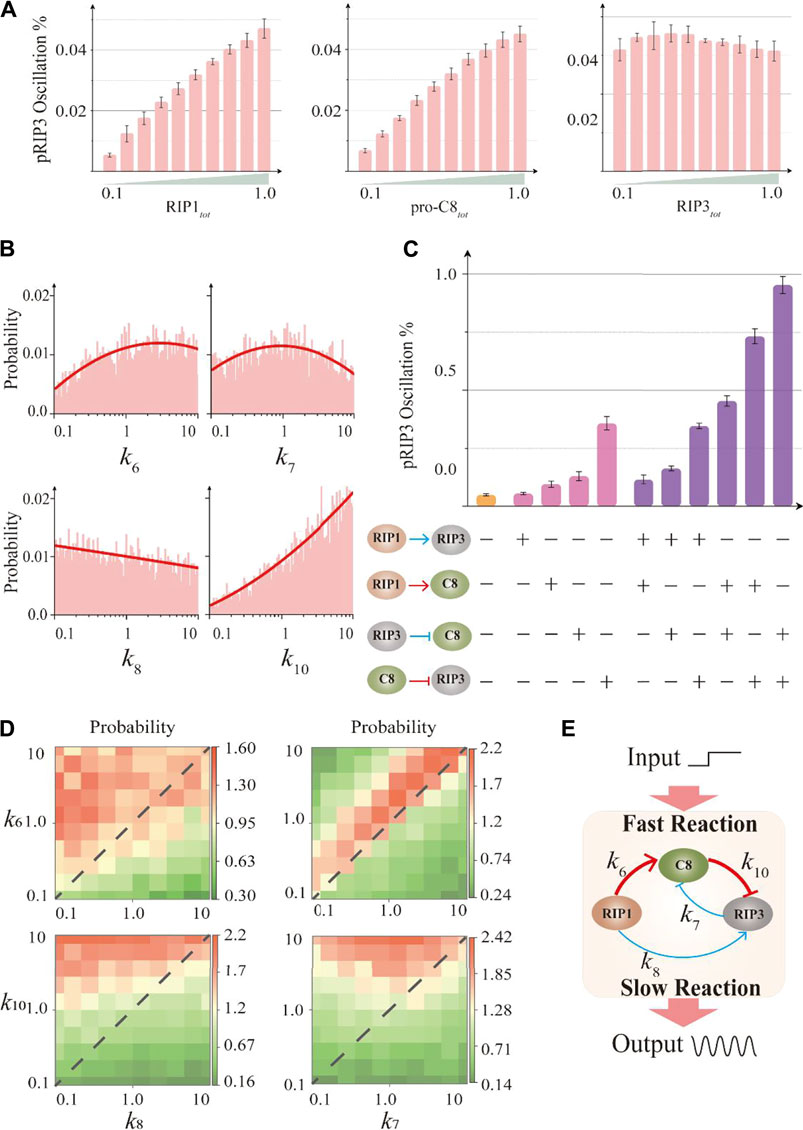
FIGURE 3. Effects of the components within the essential structure on the circuit oscillation probability. (A) Effects of the three key proteins total amount on the oscillation probability. (B) The parameter distributions with stable oscillation of the four parameters in the essential structure. (C) The probability of RIP3 oscillation is substantially improved when two interaction terms are constrained during the random parameter search. The “+” indicates that the term is constrained, and the “−” indicates that the term is unconstrained. (D) The heat maps that reflect the variation of probability when two-parameters are changed. (E) Schematic diagram of the fast and slow dynamics within the essential structure. Thick red lines indicate fast dynamics and thin blue lines indicate slow dynamics.
We next select more widely the parameter combinations that can generate oscillation. By collecting 33 million sets of parameters, we obtain 14,906 sets of oscillation parameter combinations that meet the appraisal standard (Supplementary Information S1.1). We cluster the 14,906 sets of parameters, however, no matter what clustering algorithm (such as k-means clustering, spectral clustering, etc.) is adopted, it is unable to distinguish their parameter features. The result of spectral clustering is shown in Supplementary Figure S3A, meaning that the parameter set that produces oscillation behavior of the system only follows one distribution characteristic. Thus, we could project the high-dimensional parameter space to each dimension to investigate the distribution characteristic of a single parameter. The distribution characteristics of the four identified essential interaction terms (Figure 2D) in the parameter space are investigated and the corresponding results are presented in Figure 3B, indicating that k6 or k10 should be large, k7 is at an intermediate value, and k8 trends to be small to promote the occurrence of oscillation.
If an interaction term is constrained to be beneficial to improve the oscillation probability of the system, then the term is functionally significant [35]. We constrain the interaction terms in most probable strength range according to the statistical results in Figure 3B. In numerical simulation, we first constrain a single interaction term, and then constrain two groups of interaction terms simultaneously (Figure 3C). The result shows that when the interaction term of RIP3 inhibition by caspase-8 (k10) is restrained alone, the oscillation probability is improved most significantly, and the probability is increased about 7.3-fold compared with all parameters randomly sampled (yellow bar in Figure 3C). While restricting the two interaction terms characterized by k10 and k7 (inhibition of caspase-8 by RIP3) at the same time significantly increases the oscillation probability 19.5-fold compared with all parameters randomly sampled.
We further systematically analyze the relationship between oscillation probability and two-parameters variations. As the four heat maps shown in Figure 3D, the high oscillation probability is always in the top left of the diagonal line, indicating the larger value of k6 or k10 compared to k7 or k8. Thus, the most probable dynamics of the essential structure are shown in Figure 3E, indicating that RIP1 activates caspase-8 with a fast dynamic (represented by k6), while RIP1 phosphorylates RIP3 with a relatively slow dynamic (represented by k8). Moreover, caspase-8 blocks RIP3 (represented by k10) with a relatively faster dynamics compared with the suppression of RIP3 by caspase-8 (represented by k7). Therefore, above analysis indicates that the fast and slow dynamics within the essential structure are functionally significant for the occurrence of oscillation.
Aside from the essential structure, how the rest interaction terms within the CNS circuit mediate the oscillation probability are studied as well to identify the most probable structure for robust oscillation. In addition to the distribution characteristics of four parameters shown in Figure 3B, the distribution characteristics of other parameters are shown in Figure 4A and Supplementary Figure S3B. As the results indicated, the strength of this interaction term of RIP1 activated by RIP3 (represented by k3) trends to be strong to promote the occurrence of oscillation, while the other terms prefer a weak or at an intermediate strength. Hence, the most probable structure for oscillation of the CNS circuit is proposed and presented in Figure 4B. Apparently within the structure, a unidirectional bias is captured by the two feedback loops formed by RIP1, caspase-8, and RIP3 (Figure 4C). That is, the negative feedback loop interaction formed by k3, k6, and k10, and the positive feedback loop interaction formed by k8, k4 and k7. The negative feedback loop presents fast dynamics, while the positive feedback loop presents slow dynamics, which provides a general underlying mechanism for the oscillation behavior of the CNS circuit.
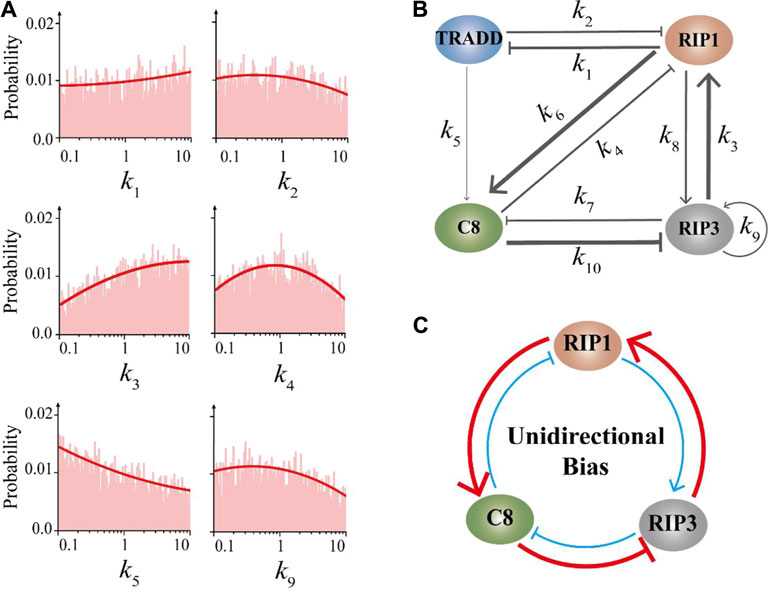
FIGURE 4. The unidirectional bias within the CNS circuit. (A) The parameter distributions of the other six parameters in the core module of the CNS circuit except that shown in Figure 3B. (B) Schematic diagram of the interaction strength within the CNS circuit for inducing the high probability of oscillation. The thickness of the line represents the optimal value in the parameter distribution. (C) The unidirectional bias captured by the feedback loops formed by RIP1, caspase-8, and RIP3. Thick red lines indicate strong fast interaction, while thin blue lines indicate weak slow interaction.
Classification of Oscillation Behaviors by Amplitude and Period
Our above analysis determines the essential structure and further reveals the unidirectional bias with fast and slow dynamics for oscillation of the CNS circuit. The distribution of various oscillation behaviors can be characterized by amplitude and period, as shown in Figure 5A. We thus divide the total oscillation groups in detail according to amplitude and period. As a fact, experimental data are lacking to set the boundary of amplitude and period of different oscillation behaviors. In our study, the boundary of period is set to 100 min based on the osicllation period of NF-κB, which is also an important cell death regulator [10, 73]. While the boundary of amplitude is set to 0.4, which is the median value of all the counted amplitudes. The boundary of amplitude divides the oscillation behavior into low amplitude and high amplitude. The boundary of the period divides the behavior into fast and slow oscillation. The results in Figure 5A show that the low amplitude accounts for about 37.74% and the slow period accounts for about 13.42% of the total oscillation groups. As shown in Figure 5B, there are four types of oscillation, i.e., Low-Fast (LF): fast low-amplitude oscillation (36.63%), Low-Slow (LS): slow low-amplitude oscillation (1.11%), High-Fast (HF): fast high-amplitude oscillation (49.95%), and High-Slow (HS): slow high-amplitude oscillation (12.31%). The representative time series of the four types oscillation behaviors are displayed in Figure 5C.
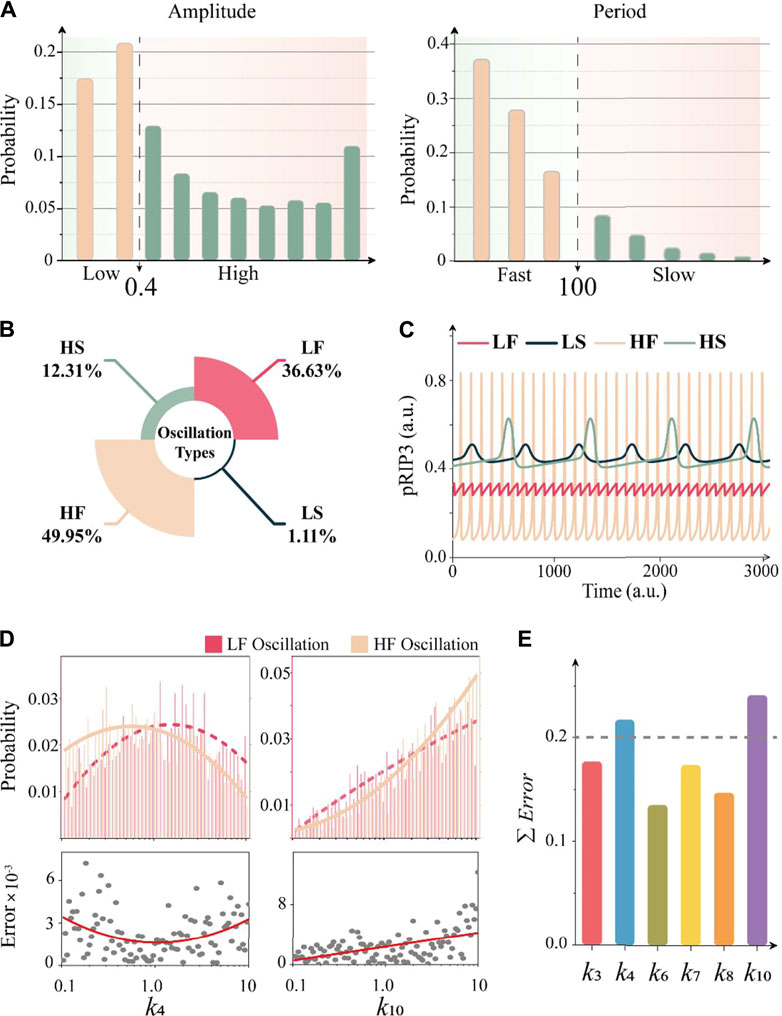
FIGURE 5. Four types of CNS circuit oscillation behaviors. (A) The probability distribution of amplitude and period of pRIP3 oscillation in total 14,906 groups. OSC = 0.4 and period = 100 min are set as the boundary for amplitude and period, respectively. (B) Four typical oscillation behaviors and their corresponding probabilities. Low-Fast (LF): fast low-amplitude oscillation, Low-Slow (LS): slow low-amplitude oscillation, High-Fast (HF): fast high-amplitude oscillation, and High-Slow (HS): slow high-amplitude oscillation. (C) Time series of the four typical oscillation behaviors. (D) Comparison of parameter distribution of k4 and k10 between LF and HF oscillation. The upper magenta and light brown histograms represent the parameter probabilities in the sub-range, and the curves fit the parameter distribution characteristics of the two oscillation behaviors respectively. The scatter diagram of the bottom panel shows the distribution error of the whole parameter space. (E) Total difference of distributions for the six parameters within the unidirectional bias between LF oscillation and HF oscillation. If the value exceeds 0.2, it is defined that there is a significant difference.
To investigate the discrepancy among different types of oscillation, the link between the parameter characteristics within the unidirectional bias (Figure 4C) and the four types of oscillation are further explored. We take the top two high probability of oscillation, LF and HF as an example. The spatial parameter distribution of the LF and HF are presented in the top panel of Figure 5D (k4 and k10) and Supplementary Figure S4. We further calculate the spatial distribution difference of parameters under the two oscillation forms (Supplementary Information S1.2). The results of the probability distribution difference between LF and HF for each subspace are shown in the bottom panel of Figure 5D. Then, the statistical diagram of the total difference of distributions for the six parameters within the unidirectional bias (Figure 4C) is shown in Figure 5E, indicating that parameters of k4 and k10 are the top two significant differences between LF and HF oscillation. Hence, from the point of dynamics mechanism, the suppression of RIP1 (represented by k4) and RIP3 (represented by k10) by caspase-8 are important for determining the amplitude behavior of fast oscillation.
Oscillation Behaviors Switching Controlled by the Unidirectional Bias
Having classified the four typical oscillation behaviors of the CNS circuit, we next seek to explore their switching dynamics. For simplification, we select a set of deterministic parameters in a reasonable biological range (Supplementary Information S2.1) as an example to investigate the switching of oscillation behaviors by tuning the interaction terms within the unidirectional bias. Dynamic behavior of the deterministic model upon TNF stimulation is shown by the bifurcation diagram in Figure 6A. The solid and dashed black lines respectively represent the stable and unstable equilibrium points of the system, and the colored lines represent the maximum and minimum amplitudes of the oscillations. A more detailed oscillation behavior (amplitude and period) is shown in the sub-figure, indicating that the stimulation strength of TNF for the deterministic system to oscillate ranges from 0.11 to 0.14.
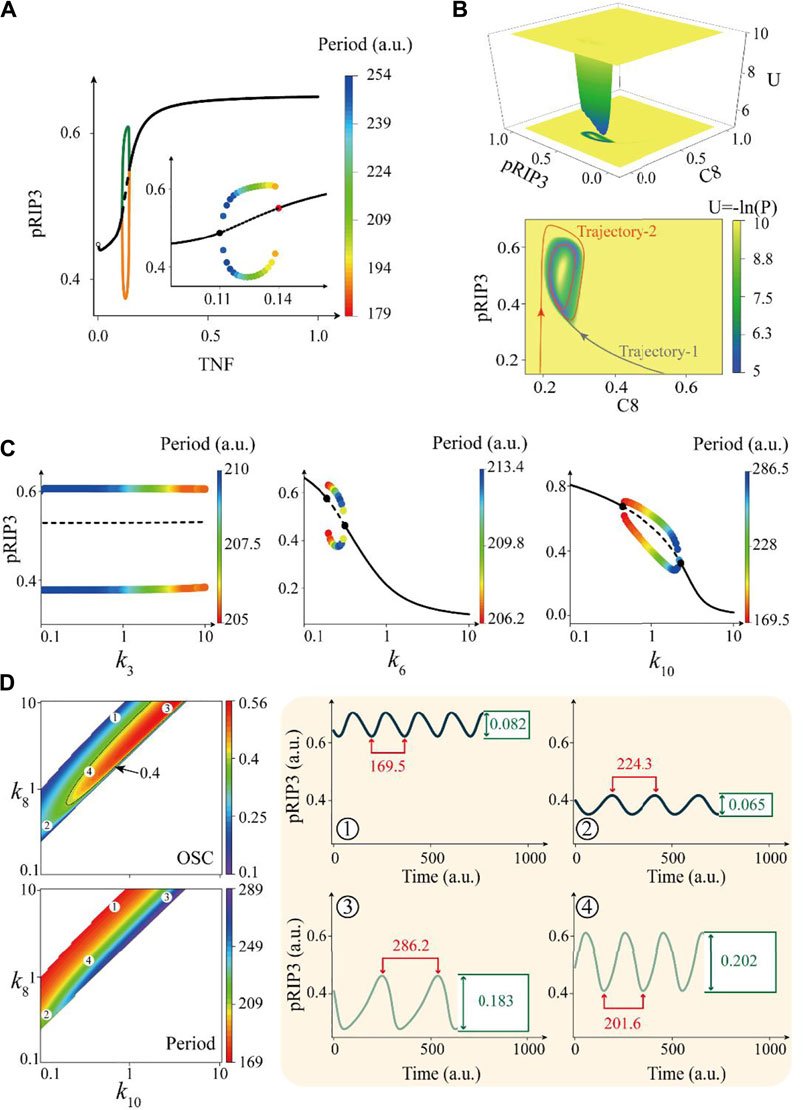
FIGURE 6. Oscillation dynamics and bifurcation behavior of an example of deterministic CNS circuit. (A) Bifurcation diagram of TNF stimulation strength in a deterministic circuit. The solid and dashed black lines respectively represent the stable and unstable equilibrium points of the system, the colored lines represent the extremes of the oscillations, and the colors of the dots in the sub-figure represent the periods. (B) Landscape of the CNS system with an annular potential well, and the two-dimensional phase diagram in the lower panel has two typical evolution trajectories. (C) Bifurcation diagrams of three representative parameters within the unidirectional bias of the circuit. (D) The phase diagram of k8-k10 two-dimensional parameter space, the upper and lower panels on the left respectively indicate amplitude and period, and the warm color indicates high amplitude and fast period oscillation behavior. The four typical time series on the right panel correspond to the four points in the phase diagram, where the values of (k8, k10) are (8.0, 0.68), (0.29, 0.12), (9.5, 3.5), and (1.5, 0.3) respectively.
To systematically study the stochastic properties of the CNS oscillations, we further employed the recently developed potential landscape theory [74–77] that describes the global dynamic behavior of the CNS system in phase space (Supplementary Information S1.2). The dimensionless potential function (U) and steady state probability distribution (P) of the system is given by the Boltzmann relation, that is, U = −log(P). The system exhibits HS oscillation upon TNF = 0.13 and the corresponding potential landscape of the system that mapped onto the caspase8-RIP3 phase space is shown in Figure 6B. As a result, the system evolves into a unique annular valley from any initial values, indicating that there is a unique limit cycle in the two-dimensional phase space. Taking two typical evolution trajectories as examples (Figure 6B, down panel), it is shown that the system will eventually evolve into the ring trap in any initial state. Similar results of potential landscapes that mapped onto other two-dimensional phase spaces are shown in Supplementary Figure S5.
Bifurcation analysis of all the six sets parameter within the unidirectional bias of the system is performed and the results shown in Figure 6C and Supplementary Figure S6, confirming that variations of these parameters can efficiently switch the oscillation behaviors besides k3. As an example presented in Figure 7A, the dynamic behavior of the deterministic system is switched from HS oscillation (green line) to LS oscillation (black line) by tuning the interaction term of caspase-8 activated by RIP1. However, no matter how single interaction term is tuned of the system, we could not realize the transition from fast to slow oscillation behavior, which is supported by the bifurcation diagram of all parameters shown in Figure 6C and Supplementary Figure S6. To further quantitative analysis the regulation mechanism of interaction parameter k_i in oscillation behavior, the phase diagrams in two-dimensional parameter space are shown in Figure 6D and Supplementary Figure S7. Two panels on the left of Figure 6D respectively show the phase diagrams of amplitude (upper panel) and period (lower panel) in the phase space of k8–k10, in which the amplitude is characterized by oscillation coefficient. The four typical representative time series of pRIP3 are displayed in the right panel, and they correspond to four parameter combinations in the left phase diagram. Here, the quantified values of amplitude and period of oscillation behavior are marked in the figure, also only indicating that oscillation has been switched between HS and LS.
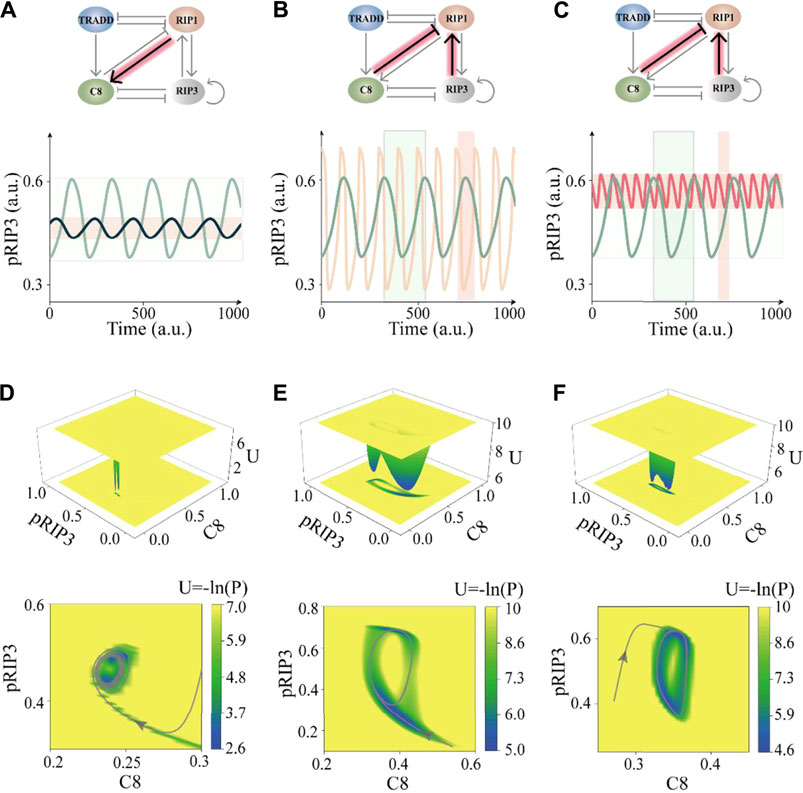
FIGURE 7. Parameters tuning in loop of the unidirectional bias leads to oscillation behavior changes. (A) The values of (k6, j6) from (0.24, 3.2) to (0.38, 3.55) switches the system behavior from HS oscillation (OSC = 0.46/period = 209.5) to LS oscillation (OSC = 0.12/period = 201.2). (B) The values of (k4, j3) from (0.2, 78.6) to (2.3, 0.005) switches the system behavior from HS oscillation (OSC = 0.46/period = 209.5) to HF oscillation (OSC = 0.83/period = 99.0). (C) The values of (k4, j3) from (0.2, 78.6) to (2.19, 0.22) switches the system behavior from HS oscillation (OSC = 0.46/period = 209.5) to LF oscillation (OSC = 0.20/period = 66.0). (D–F) Landscape of the system with switching oscillation behavior by tuning parameters. (D) The LS oscillation corresponds to sub-figure (A). (E) The HF oscillation corresponds to sub-figure (B). (F) The LF oscillation corresponds to sub-figure (C). The gray curve in the lower panel represents an evolution trajectory in the phase plane.
Next, we try to tune the interaction of two terms at the same time to obtain the switching of the system from HS oscillation to LF or HF oscillation. As the simulation results shown in Figures 7B,C, by simultaneously tuning the two interaction terms of RIP1 suppressed by caspase-8 and RIP1 phosphorylated by RIP3, the HS oscillation is converted into HF (yellow line) or LF oscillation (red line). We further perform the phase diagram of the system with these two terms (Supplementary Figure S8). There are two discontinuous oscillation regions, one slow oscillation region and one fast oscillation region, revealing that the CNS oscillation circuit has strong period robustness and relatively weak amplitude robustness. In addition, the landscapes of the system after corresponding switching are shown in Figures 7D–F. The characteristics of the oscillation behavior can be displayed globally by quantifying the landscape topography. The size of the potential well on the two-dimensional phase plane quantitatively characterizes the amplitude. While the depth and breadth of the potential well reflect the stability and attraction domain of the limit cycle attractor [78].
Strong Period and Weak Amplitude Robustness of the CNS Oscillation
In the previous section, we have explored the switch mechanism between different oscillation behaviors using a deterministic system, implying that the fast oscillation behavior of the system has strong robustness. We next comprehensively investigate the robustness of the CNS oscillation network. We randomly select 100 systems from each of the four types oscillation behaviors. The value of the parameters in the unidirectional bias are tuned sequentially and continuously in the whole range, and the maximum value of oscillation amplitude change and the maximum value of oscillation period change are recorded. The violin plots in Figure 8 show the effects of the six parameters within the unidirectional bias on the amplitude and period of the four types of oscillation. The wide area in the violin plot means that the data density in this region is higher, and the white dots in the box diagram embedded in the violin plot are the median of the data.
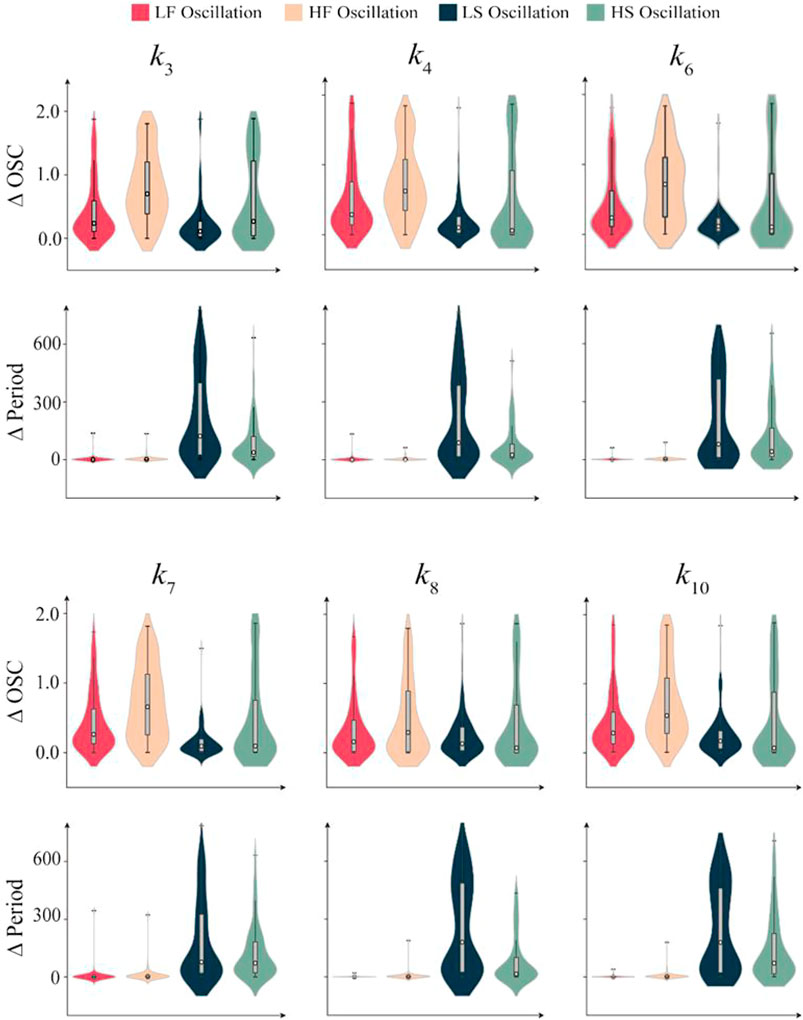
FIGURE 8. Parameter sensitivity analysis of the four types oscillation behaviors. The Magenta violin plots represent LF oscillation, the sallow violin plots represent HF oscillation, the navy violin plots represent LS oscillation and the turquoise violin plots represent HS oscillation. The box diagrams embedded in violin diagrams show the extreme and median values of the variations of OSC and period. 100 random systems corresponding to each biological oscillation behavior were considered. The box plots are embedded in each violin, and white dots represent the median of statistical data.
The statistical results indicate that the period robustness of the fast oscillation systems (LF and HF) is stronger than that of the slow oscillation systems (LS and HS), but the amplitude robustness is weaker. For HF oscillation system, the amplitude robustness is the weakest, especially for the statistical results of amplitude sensitivity of k3, k4, and k6, which present two obvious high-density regions. This suggests that most HF oscillation systems are easy to switch to LF oscillation by tuning these interactions. However, owing to the strong period robustness, it is difficult to switch HF oscillation to HS or LS. For LS oscillation system, the amplitude robustness is the strongest among the four types, but its period robustness is the weakest. Thus, we can switch LS oscillation to LF by tuning a single interaction term, but it is difficult to switch to HS or HF. The results of other relative parameters are shown in Supplementary Figure S9, supporting the conclusion that the robustness of fast oscillation systems (LF and HF) is stronger than that of the slow oscillation systems (LS and HS). Therefore, these results provide potential guidance for efficiently switching oscillation behaviors among various types.
Discussion
Oscillations are important characteristics for regulating many cellular physiological processes, which are conducive to stable diffusion of biological signals in vivo. In this study, we propose a circuit of the CNS pathway and further reveal the essential components and pivotal interaction terms for oscillation. Stochastic parameter analysis indicates that the essential structure for oscillation is constituted by a paradoxical component embedded with positive feedback among the three protein nodes, i.e., RIP1, caspase-8, and RIP3 (Figure 2D). The negative feedback of caspase-8 cleavage by pRIP3 could provide an indirect time delay effect within the paradoxical component, which is consistent with the previous study that a paradoxical component with time delay could induce oscillation [27]. Most recently, we have found that the paradoxical component is also necessary for the biphasic roles of RIP1 in necroptosis [66], indicating that the paradoxical component is a core module for the CNS pathway to induce various dynamic behaviors.
We also explore how each component and interaction term within the circuit mediate the oscillation occurrence probability. Our results suggest that high levels of RIP1 and caspase-8 accelerate the occurrence of oscillation, while high level of TRADD reduce the probability. Thus, the oscillation of CNS pathway likely occurs in the cell types with high expression levels of RIP1 and caspase-8, and low expression level of TRADD. For efficiently inducing the occurrence of oscillation, we show that a unidirectional bias with incoherent fast and slow dynamics is required. Actually, besides the cell death type of necroptosis, oscillation has been proved to be important for propagating the death signaling of apoptosis and ferroptosis. Our results provide a valuable guidance for the finding of oscillation behaviors in CNS pathway, which will further advance our knowledge of the mediation of various necroptotic signaling on cell death.
Biological oscillation signals contain the information of amplitude and period. Different types of oscillation signals selectively activate the downstream signaling and thus performing different biological functions. Our recent study has uncovered that the cytosolic calcium regulates apoptosis mainly through the oscillation amplitude, rather than period [14]. In this study, four types of oscillation behaviors have been classified within the CNS circuit. We have determined their probability distributions and discussed the robustness of these behaviors. The amplitude and period robustness of different oscillation behaviors are significantly different. We also evaluate the possible switching strategies among different oscillation behaviors. Our results of potential landscape provide a physical and quantitative explanation for the mechanism of mode-switching behavior of the CNS oscillation network. An urgent question is that how different oscillation behaviors can activate the downstream signaling, such as MLKL, thus determining the diverse cell fates. Salazar et al. proposed that oscillation signal is more effective than stabilization signal when kinase has a low affinity [79]. Hansen et al. found that the information transmitted via amplitude modulation signal is more reliable than that transmitted by frequency modulation signal in stress-responsive of yeast transcription factors Msn2 [80]. We suspect that RIP3 oscillation dynamics may transmit necrosis signals downstream more effectively, and MLKL can decode the information according to the amplitude and period of RIP3. However, modeling analysis of the effects of different oscillation behaviors on biological functions is still a challenge because of the lacking of effective experimental data. With the combination of further experimental observations, a more comprehensive model can be considered to dissect this urgent issue in the future. Moreover, emerging evidences have suggested the important role of oscillatory behavior in drug delivery [81, 82]. Our study provides clues for efficiently switching different oscillation behaviors, which is relevant to the development of more effective strategy for medical application.
The spatial structures of oscillation model might play important roles in the cell necroptosis signal pathway. In 2018, Ferrell et al. observed that apoptosis of Xenopus laevis eggs spread through trigger waves [20]. Specifically, intracellular caspase family proteins are activated and then come into contact with adjacent caspase by floating and activating them. The apoptotic trigger waves with the speed of ∼30 μm per minute or even faster, while the average diameter of the normal cell is 10–20 μm. Thus, the spatial spread time of the proteins signaling is quite fast compared with the time from the initiation of programmed cell death to the end of ∼12 h [83]. In our study, the necroptosis signal pathway is highly correlated with the apoptosis signal pathway [61, 84]. The occurrence time from the initiation to the end of necroptosis is about 6–10 h. Thus, the spatial structure of intracellular molecules can be approximated by the mean-field relative to the time scale of the cell death signaling. Actually, most protein-protein interaction network models were modeled in 2-dimensions, which can make great achievements in explaining experimental phenomena and predicting biological functions [9, 14]. This possibly due to the different time scales between proteins activation time and the spatial spread time. In our future work, we will decide to consider the spatial structures of the model and hope to find more important results.
Data Availability Statement
The original contributions presented in the study are included in the article/Supplementary Material, further inquiries can be directed to the corresponding author.
Author Contributions
FX and XL conceived the study. ZY, LZ, and JJ participated in the modeling and provided useful suggestions. FX performed numerical simulations and QH provided technical support. FX and XL wrote the manuscript. JS gave a lot of guidance and support. All authors discussed the results of the manuscript.
Funding
This work was supported by National Natural Science Foundation of China (Grants Nos. 12090052, 11874310, and 11704318), the China Postdoctoral Science Foundation (Grant No. 2016M602071), and Fujian Province Foundation (Grant Nos. 2020Y4001).
Conflict of Interest
The authors declare that the research was conducted in the absence of any commercial or financial relationships that could be construed as a potential conflict of interest.
Publisher’s Note
All claims expressed in this article are solely those of the authors and do not necessarily represent those of their affiliated organizations, or those of the publisher, the editors and the reviewers. Any product that may be evaluated in this article, or claim that may be made by its manufacturer, is not guaranteed or endorsed by the publisher.
Acknowledgments
The authors would like to acknowledge Professor Hong Qi and Professor Chenggui Yao for some kind suggestions.
Supplementary Material
The Supplementary Material for this article can be found online at: https://www.frontiersin.org/articles/10.3389/fphy.2021.726638/full#supplementary-material
References
1. Shuai JW, Jung P. Optimal Intracellular Calcium Signaling. Phys Rev Lett (2002) 88:068102. doi:10.1103/PhysRevLett.88.068102
2. Li Q, Cao X, Liu S, Li Z, Wang Y, Cheng L, et al. Dynamic Alterations of Amplitude of Low-Frequency Fluctuations in Patients with Drug-Naïve First-Episode Early Onset Schizophrenia. Front Neurosci (2020) 14:9. doi:10.3389/fnins.2020.00901
3. Zuo H, Ye M. Bifurcation and Numerical Simulations of Ca2+ Oscillatory Behavior in Astrocytes. Front Phys (2020) 8:8. doi:10.3389/fphy.2020.00258
4. Wang G, Peskin CS. Entrainment of a Cellular Circadian Oscillator by Light in the Presence of Molecular Noise. Phys Rev E (2018) 97:11. doi:10.1103/PhysRevE.97.062416
5. Yagita K, Horie K, Koinuma S, Nakamura W, Yamanaka I, Urasaki A, et al. Development of the Circadian Oscillator during Differentiation of Mouse Embryonic Stem Cells In Vitro. Proc Natl Acad Sci USA (2010) 107:3846–51. doi:10.1073/pnas.0913256107
6. Wu J, Xu Y, Ma J. Lévy Noise Improves the Electrical Activity in a Neuron under Electromagnetic Radiation. PLoS One (2017) 12:e0174330. doi:10.1371/journal.pone.0174330
7. Pomerening JR, Sontag ED, Ferrell JE. Building a Cell Cycle Oscillator: Hysteresis and Bistability in the Activation of Cdc2. Nat Cel Biol (2003) 5:346–51. doi:10.1038/ncb954
8. Yang R, Huang B, Zhu Y, Li Y, Liu F, Shi J. Cell Type-dependent Bimodal P53 Activation Engenders a Dynamic Mechanism of Chemoresistance. Sci Adv (2018) 4:eaat5077. doi:10.1126/sciadv.aat5077
9. Tomida T, Takekawa M, Saito H. Oscillation of P38 Activity Controls Efficient Pro-inflammatory Gene Expression. Nat Commun (2015) 6:1–9. doi:10.1038/ncomms9350
10. Nelson DE, Ihekwaba AEC, Elliott M, Johnson JR, Gibney CA, Foreman BE, et al. Oscillations in NF- B Signaling Control the Dynamics of Gene Expression. Science (2004) 306:704–8. doi:10.1126/science.1099962
11. Corrigan AM, Chubb JR. Regulation of Transcriptional Bursting by a Naturally Oscillating Signal. Curr Biol (2014) 24:205–11. doi:10.1016/j.cub.2013.12.011
12. Paszek P, Jackson DA, White MR. Oscillatory Control of Signalling Molecules. Curr Opin Genet Dev (2010) 20:670–6. doi:10.1016/j.gde.2010.08.004
13. Zhang Z-B, Wang Q-Y, Ke Y-X, Liu S-Y, Ju J-Q, Lim WA, et al. Design of Tunable Oscillatory Dynamics in a Synthetic NF-Κb Signaling Circuit. Cel Syst (2017) 5:460–70. doi:10.1016/j.cels.2017.09.016
14. Qi H, Li X, Jin Z, Simmen T, Shuai J. The Oscillation Amplitude, Not the Frequency of Cytosolic Calcium, Regulates Apoptosis Induction. Iscience (2020) 23:101671–12. doi:10.1016/j.isci.2020.101671
15. Liu P, Kevrekidis IG, Shvartsman SY. Substrate-Dependent Control of ERK Phosphorylation Can Lead to Oscillations. Biophysical J (2011) 101:2572–81. doi:10.1016/j.bpj.2011.10.025
16. Zhang X-P, Liu F, Wang W. Two-phase Dynamics of P53 in the DNA Damage Response. Proc Natl Acad Sci (2011) 108:8990–5. doi:10.1073/pnas.1100600108
17. Li X, Wu Y, Gao X, Cai M, Shuai J. Wave Failure at strong Coupling in intracellularCa2+signaling System with Clustered Channels. Phys Rev E (2018) 97:012406–8. doi:10.1103/PhysRevE.97.012406
18. Chen Y, Qi H, Li X, Cai M, Chen X, Liu W, et al. Suppressing Effect ofCa2+blips on Puff Amplitudes by Inhibiting Channels to Prevent Recovery. Phys Rev E (2016) 94:94. doi:10.1103/PhysRevE.94.022411
19. Gelens L, Anderson GA, Ferrell JE Spatial Trigger Waves: Positive Feedback Gets You a Long Way. MBoC (2014) 25:3486–93. doi:10.1091/mbc.E14-08-1306
20. Cheng X, Ferrell JE. Apoptosis Propagates through the Cytoplasm as Trigger Waves. Science (2018) 361:607–12. doi:10.1126/science.aah4065
21. Riegman M, Sagie L, Galed C, Levin T, Steinberg N, Dixon SJ, et al. Ferroptosis Occurs through an Osmotic Mechanism and Propagates Independently of Cell Rupture. Nat Cel Biol (2020) 22:1042–8. doi:10.1038/s41556-020-0565-1
22. Kim SE, Zhang L, Ma K, Riegman M, Chen F, Ingold I, et al. Ultrasmall Nanoparticles Induce Ferroptosis in Nutrient-Deprived Cancer Cells and Suppress Tumour Growth. Nat Nanotech (2016) 11:977–85. doi:10.1038/nnano.2016.164
23. Pasparakis M, Vandenabeele P. Necroptosis and its Role in Inflammation. Nature (2015) 517:311–20. doi:10.1038/nature14191
24. Martin SJ, Henry CM. Distinguishing between Apoptosis, Necrosis, Necroptosis and Other Cell Death Modalities. Methods (2013) 61:87–9. doi:10.1016/j.ymeth.2013.06.001
25. Li X, Zhong C-Q, Yin Z, Qi H, Xu F, He Q, et al. Data-Driven Modeling Identifies TIRAP-independent MyD88 Activation Complex and Myddosome Assembly Strategy in LPS/TLR4 Signaling. Ijms (2020) 21:3061–15. doi:10.3390/ijms21093061
26. Milo R, Shen-Orr S, Itzkovitz S, Kashtan N, Chklovskii D, Alon U. Network Motifs: Simple Building Blocks of Complex Networks. Science (2002) 298:824–7. doi:10.1126/science.298.5594.824
27. Hart Y, Alon U. The Utility of Paradoxical Components in Biological Circuits. Mol Cel (2013) 49:213–21. doi:10.1016/j.molcel.2013.01.004
28. Hart Y, Reich-Zeliger S, Antebi YE, Zaretsky I, Mayo AE, Alon U, et al. Paradoxical Signaling by a Secreted Molecule Leads to Homeostasis of Cell Levels. Cell (2014) 158:1022–32. doi:10.1016/j.cell.2014.07.033
29. de Ronde W, Tostevin F, ten Wolde PR. Multiplexing Biochemical Signals. Phys Rev Lett (2011) 107:107. doi:10.1103/PhysRevLett.107.048101
30. Mangan S, Alon U. Structure and Function of the Feed-Forward Loop Network Motif. Proc Natl Acad Sci (2003) 100:11980–5. doi:10.1073/pnas.2133841100
31. Tsai TY-C, Choi YS, Ma W, Pomerening JR, Tang C, Ferrell JE. Robust, Tunable Biological Oscillations from Interlinked Positive and Negative Feedback Loops. Science (2008) 321:126–9. doi:10.1126/science.1156951
32. Wang L-S, Li N-X, Chen J-J, Zhang X-P, Liu F, Wang W. Modulation of Dynamic Modes by Interplay between Positive and Negative Feedback Loops in Gene Regulatory Networks. Phys Rev E (2018) 97:8. doi:10.1103/PhysRevE.97.042412
33. De Martino D, Barato AC. Oscillations in Feedback-Driven Systems: Thermodynamics and Noise. Phys Rev E (2019) 100:100. doi:10.1103/PhysRevE.100.062123
34. Novák B, Tyson JJ. Design Principles of Biochemical Oscillators. Nat Rev Mol Cel Biol. (2008) 9:981–91. doi:10.1038/nrm2530
35. Jolley CC, Ode KL, Ueda HR. A Design Principle for a Posttranslational Biochemical Oscillator. Cel Rep (2012) 2:938–50. doi:10.1016/j.celrep.2012.09.006
36. Qi H, Xu G, Peng X-L, Li X, Shuai J, Xu R. Roles of Four Feedback Loops in Mitochondrial Permeability Transition Pore Opening Induced by Ca2+ and Reactive Oxygen Species. Phys Rev E (2020) 102:062421–10. doi:10.1103/PhysRevE.102.062422
37. Ma W, Trusina A, El-Samad H, Lim WA, Tang C. Defining Network Topologies that Can Achieve Biochemical Adaptation. Cell (2009) 138:760–73. doi:10.1016/j.cell.2009.06.013
38. Li Z, Liu S, Yang Q. Incoherent Inputs Enhance the Robustness of Biological Oscillators. Cel Syst (2017) 5:72–81. doi:10.1016/j.cels.2017.06.013
39. Potvin-Trottier L, Lord ND, Vinnicombe G, Paulsson J. Synchronous Long-Term Oscillations in a Synthetic Gene Circuit. Nature (2016) 538:514–7. doi:10.1038/nature19841
40. Zhao Y, Wang D, Zhang Z, Lu Y, Yang X, Ouyang Q, et al. Critical Slowing Down and Attractive Manifold: A Mechanism for Dynamic Robustness in the Yeast Cell-Cycle Process. Phys Rev E (2020) 101:042401–23. doi:10.1103/PhysRevE.101.042405
41. del Junco C, Vaikuntanathan S. High Chemical Affinity Increases the Robustness of Biochemical Oscillations. Phys Rev E (2020) 101:9. doi:10.1103/PhysRevE.101.012410
42. Qiao L, Zhao W, Tang C, Nie Q, Zhang L. Network Topologies that Can Achieve Dual Function of Adaptation and Noise Attenuation. Cel Syst (2019) 9:271–85. doi:10.1016/j.cels.2019.08.006
43. Bostani N, Kessler DA, Shnerb NM, Rappel W-J, Levine H. Noise Effects in Nonlinear Biochemical Signaling. Phys Rev E (2012) 85:85. doi:10.1103/PhysRevE.85.011901
44. Zhou P, Gao X, Li X, Li L, Niu C, Ouyang Q, et al. Stochasticity Triggers Activation of the S-phase Checkpoint Pathway in Budding Yeast. Phys Rev X (2021) 11:23. doi:10.1103/PhysRevX.11.011004
45. Hasty J, Dolnik M, Rottschäfer V, Collins JJ. Synthetic Gene Network for Entraining and Amplifying Cellular Oscillations. Phys Rev Lett (2002) 88:148101–4. doi:10.1103/PhysRevLett.88.148101
46. Cao Y, Wang H, Ouyang Q, Tu Y The Free-Energy Cost of Accurate Biochemical Oscillations. Nat Phys(2015) 11:772, 8. doi:10.1038/nphys3412
47. Yu Q, Zhang D, Tu Y. Inverse Power Law Scaling of Energy Dissipation Rate in Nonequilibrium Reaction Networks. Phys Rev Lett (2021) 126:126. doi:10.1103/PhysRevLett.126.080601
48. Barato AC, Seifert U. Coherence of Biochemical Oscillations Is Bounded by Driving Force and Network Topology. Phys Rev E (2017) 95:95. doi:10.1103/PhysRevE.95.062409
49. Fei C, Cao Y, Ouyang Q, Tu Y. Design Principles for Enhancing Phase Sensitivity and Suppressing Phase Fluctuations Simultaneously in Biochemical Oscillatory Systems. Nat Commun (2018) 9:10. doi:10.1038/s41467-018-03826-4
50. Cao Z, Jiang H, Hou ZJPRR Design Principles for Biochemical Oscillations with Limited Energy Resources. 2020) 2:043331. doi:10.1103/physrevresearch.2.043331
51. Wilson NS, Dixit V, Ashkenazi A. Death Receptor Signal Transducers: Nodes of Coordination in Immune Signaling Networks. Nat Immunol (2009) 10:348–55. doi:10.1038/ni.1714
52. Zheng L, Bidere N, Staudt D, Cubre A, Orenstein J, Chan FK, et al. Competitive Control of Independent Programs of Tumor Necrosis Factor Receptor-Induced Cell Death by TRADD and RIP1. Mol Cel Biol (2006) 26:3505–13. doi:10.1128/mcb.26.9.3505-3513.2006
53. Mompeán M, Li W, Li J, Laage S, Siemer AB, Bozkurt G, et al. The Structure of the Necrosome RIPK1-RIPK3 Core, a Human Hetero-Amyloid Signaling Complex. Cell (2018) 173:1244–53. doi:10.1016/j.cell.2018.03.032
54. He S, Wang L, Miao L, Wang T, Du F, Zhao L, et al. Receptor Interacting Protein Kinase-3 Determines Cellular Necrotic Response to TNF-α. Cell (2009) 137:1100–11. doi:10.1016/j.cell.2009.05.021
55. Han J, Zhong C-Q, Zhang D-W. Programmed Necrosis: Backup to and Competitor with Apoptosis in the Immune System. Nat Immunol (2011) 12:1143–9. doi:10.1038/ni.2159
56. Zhang D-W, Shao J, Lin J, Zhang N, Lu B-J, Lin S-C, et al. RIP3, an Energy Metabolism Regulator that Switches TNF-Induced Cell Death from Apoptosis to Necrosis. Science (2009) 325:332–6. doi:10.1126/science.1172308
57. Cho Y, Challa S, Moquin D, Genga R, Ray TD, Guildford M, et al. Phosphorylation-Driven Assembly of the RIP1-RIP3 Complex Regulates Programmed Necrosis and Virus-Induced Inflammation. Cell (2009) 137:1112–23. doi:10.1016/j.cell.2009.05.037
58. Nogusa S, Thapa RJ, Dillon CP, Liedmann S, Oguin TH, Ingram JP, et al. RIPK3 Activates Parallel Pathways of MLKL-Driven Necroptosis and FADD-Mediated Apoptosis to Protect against Influenza A Virus. Cell Host & Microbe (2016) 20:13–24. doi:10.1016/j.chom.2016.05.011
59. Kang T-B, Yang S-H, Toth B, Kovalenko A, Wallach D. Caspase-8 Blocks Kinase RIPK3-Mediated Activation of the NLRP3 Inflammasome. Immunity (2013) 38:27–40. doi:10.1016/j.immuni.2012.09.015
60. Oberst A, Dillon CP, Weinlich R, McCormick LL, Fitzgerald P, Pop C, et al. Catalytic Activity of the Caspase-8-FLIPL Complex Inhibits RIPK3-dependent Necrosis. Nature (2011) 471:363–7. doi:10.1038/nature09852
61. Vanlangenakker N, Bertrand MJM, Bogaert P, Vandenabeele P, Vanden Berghe T. TNF-induced Necroptosis in L929 Cells Is Tightly Regulated by Multiple TNFR1 Complex I and II Members. Cell Death Dis (2011) 2:e230. doi:10.1038/cddis.2011.111
62. Newton K. RIPK1 and RIPK3: Critical Regulators of Inflammation and Cell Death. Trends Cel Biol (2015) 25:347–53. doi:10.1016/j.tcb.2015.01.001
63. Newton K, Wickliffe KE, Dugger DL, Maltzman A, Roose-Girma M, Dohse M, et al. Cleavage of RIPK1 by Caspase-8 Is Crucial for Limiting Apoptosis and Necroptosis. Nature (2019) 574:428–31. doi:10.1038/s41586-019-1548-x
64. Yang Z-H, Wu X-N, He P, Wang X, Wu J, Ai T, et al. A Non-canonical PDK1-RSK Signal Diminishes Pro-caspase-8-mediated Necroptosis Blockade. Mol Cel (2020) 80:296–310. doi:10.1016/j.molcel.2020.09.004
65. Cai Z, Jitkaew S, Zhao J, Chiang H-C, Choksi S, Liu J, et al. Erratum: Plasma Membrane Translocation of Trimerized MLKL Protein Is Required for TNF-Induced Necroptosis. Nat Cel Biol (2014) 16:200. doi:10.1038/ncb2908
66. Li X, Zhong C-Q, Wu R, Xu X, Yang Z-H, Cai S, et al. RIP1-dependent Linear and Nonlinear Recruitments of Caspase-8 and RIP3 Respectively to Necrosome Specify Distinct Cell Death Outcomes. Protein Cell (2021) 1–19. doi:10.1007/s13238-020-00810-x
67. Sun L, Wang H, Wang Z, He S, Chen S, Liao D, et al. Mixed Lineage Kinase Domain-like Protein Mediates Necrosis Signaling Downstream of RIP3 Kinase. Cell (2012) 148:213–27. doi:10.1016/j.cell.2011.11.031
68. Zhao J, Jitkaew S, Cai Z, Choksi S, Li Q, Luo J, et al. Mixed Lineage Kinase Domain-like Is a Key Receptor Interacting Protein 3 Downstream Component of TNF-Induced Necrosis. Proc Natl Acad Sci (2012) 109:5322–7. doi:10.1073/pnas.1200012109
69. Brandman O, Ferrett JE, Li R, Meyer T. Interlinked Fast and Slow Positive Feedback Loops Drive Reliable Cell Decisions. Science (2005) 310:496–8. doi:10.1126/science.1113834
70. Kim J-R, Yoon Y, Cho K-H. Coupled Feedback Loops Form Dynamic Motifs of Cellular Networks. Biophysical J (2008) 94:359–65. doi:10.1529/biophysj.107.105106
71. Zhang X-P, Liu F, Cheng Z, Wang W. Cell Fate Decision Mediated by P53 Pulses. Proc Natl Acad Sci (2009) 106:12245–50. doi:10.1073/pnas.0813088106
72. Iman RL, Helton JC, Campbell JE. An Approach to Sensitivity Analysis of Computer Models: Part I-Introduction, Input Variable Selection and Preliminary Variable Assessment. J Qual Tech (1981) 13:174–83. doi:10.1080/00224065.1981.11978748
73. Hoffmann A, Levchenko A, Scott ML, Baltimore D. The Ikappa B-NF-Kappa B Signaling Module: Temporal Control and Selective Gene Activation. Science (2002) 298:1241–5. doi:10.1126/science.1071914
74. Shu J, Wu C, Wu Y, Li Z, Shao S, Zhao W, et al. Induction of Pluripotency in Mouse Somatic Cells with Lineage Specifiers. Cell (2013) 153:963–75. doi:10.1016/j.cell.2013.05.001
75. Wang J, Li C, Wang E. Potential and Flux Landscapes Quantify the Stability and Robustness of Budding Yeast Cell Cycle Network. Proc Natl Acad Sci (2010) 107:8195–200. doi:10.1073/pnas.0910331107
76. Li C, Wang J. Landscape and Flux Reveal a New Global View and Physical Quantification of Mammalian Cell Cycle. Proc Natl Acad Sci USA 111(2014). 14130–5. doi:10.1073/pnas.1408628111
77. Huang B, Lu M, Jia D, Ben-Jacob E, Levine H, Onuchic JN. Interrogating the Topological Robustness of Gene Regulatory Circuits by Randomization. Plos Comput Biol (2017) 13:e1005456. doi:10.1371/journal.pcbi.1005456
78. Li C, Ye L. Landscape and Flux Govern Cellular Mode-Hopping between Oscillations. J Chem Phys (2019) 151:175101. doi:10.1063/1.5125046
79. Salazar C, Zaccaria Politi A, Höfer T. Decoding of Calcium Oscillations by Phosphorylation Cycles: Analytic Results. Biophysical J (2008) 94:1203–15. doi:10.1529/biophysj.107.113084
80. Hansen AS, O'Shea EK. Limits on Information Transduction through Amplitude and Frequency Regulation of Transcription Factor Activity. Elife (2015) 4:4. doi:10.7554/eLife.06559
81. Danino T, Mondragón-Palomino O, Tsimring L, Hasty J. A Synchronized Quorum of Genetic Clocks. Nature (2010) 463:326–30. doi:10.1038/nature08753
82. Ichino T, Asahi T, Kitahata H, Magome N, Agladze K, Yoshikawa K. Microfreight Delivered by Chemical Waves. J Phys Chem C (2008) 112:3032–5. doi:10.1021/jp7097922
83. Taylor RC, Cullen SP, Martin SJ. Apoptosis: Controlled Demolition at the Cellular Level. Nat Rev Mol Cel Biol. (2008) 9:231–41. doi:10.1038/nrm2312
Keywords: oscillation behavior, paradoxical component, unidirectional bias, necroptosis, potential landscape
Citation: Xu F, Yin Z, Zhu L, Jin J, He Q, Li X and Shuai J (2021) Oscillations Governed by the Incoherent Dynamics in Necroptotic Signaling. Front. Phys. 9:726638. doi: 10.3389/fphy.2021.726638
Received: 17 June 2021; Accepted: 10 August 2021;
Published: 19 August 2021.
Edited by:
Yong Xu, Northwestern Polytechnical University, ChinaReviewed by:
Yu Wu, Zhejiang University, ChinaQing Yun Wang, Beihang University, China
Jianwei Shen, North China University of Water Conservancy and Electric Power, China
Copyright © 2021 Xu, Yin, Zhu, Jin, He, Li and Shuai. This is an open-access article distributed under the terms of the Creative Commons Attribution License (CC BY). The use, distribution or reproduction in other forums is permitted, provided the original author(s) and the copyright owner(s) are credited and that the original publication in this journal is cited, in accordance with accepted academic practice. No use, distribution or reproduction is permitted which does not comply with these terms.
*Correspondence: Xiang Li, xianglibp@xmu.edu.cn