Genetic interactions matter more in less-optimal environments: a Focused Review of “Phenotype uniformity in combined-stress environments has a different genetic architecture than in single-stress treatments” (Makumburage and Stapleton, 2011)
 G. Buddhika Makumburage1 Ann E. Stapleton2*
- 1 Department of Mathematics and Statistics, University of North Carolina Wilmington, Wilmington, NC, USA
- 2 Department of Biology and Marine Biology, University of North Carolina Wilmington, Wilmington, NC, USA
For crop production it is desirable for the mapping between genotype and phenotype to be consistent, such that an optimized genotype produces uniform sets of individual plants. Uniformity is strongly selected in breeding programs, usually automatically, as harvest equipment eliminates severely non-uniform individuals. Uniformity is genetically controlled, is known to be increased by interplant competition, and is predicted to increase upon abiotic stress. We mapped maize loci controlling genotype by environment interaction in plant height uniformity. These loci are different than the loci controlling mean plant height. Uniformity decreases upon combining two abiotic stresses, with alleles conferring greater uniformity in a single stress showing little improvement in a combined stress treatment. The maize B73 and Mo17 inbreds do not provide segregating alleles for improvement in plant height uniformity, suggesting that the genetic network specifying plant height has a past history of selection for robustness.
Introduction
The ability of one genotype to specify a phenotype consistently – the phenotype uniformity – is a key target for selective breeding in crops (Fasoula and Tollenaar, 2005). Yield losses associated with plant-to-plant variation within a genotype are detectable on small and large scales (Martin et al., 2005; Boomsma et al., 2010). High density of planting increases variation in fields (Tokatlidis et al., 2010), and this effect can be reduced in crowding-tolerant genotypes upon nitrogen fertilization (Rossini et al., 2011). High planting density and the associated increase in productivity was made possible by avoidance of biotic competitive responses (Duvick, 2005), but more improvement is needed. Efficient schemes for optimization of selection on uniformity have been designed (Fasoula and Fasoula, 2002).
Uniformity is also known as phenotype stability and robustness; these terms refer to the ability of a genotype to produce a specific phenotype rather than a phenotype that varies. To emphasize the resistance of biological systems to change in the extent of phenotype specification, terms such robustness, buffering, and canalization are used, with specific proteins or network structures that confer this feature referred to as capacitors (Masel and Siegal, 2009). Both genetic variation – epistasis and new mutations – and environmental variation contribute to varying phenotypes within one genotype (Zhang, 2008; Fraser and Schadt, 2010). Variation within a single experimental factor is termed micro-environmental variation, in contrast to macro-environmental variation across factors in an experiment. Genetic control of micro-environmental variation has been detected and loci mapped in yeast (Nogami et al., 2007), Drosophila melanogaster (Mackay and Lyman, 2005), Caenorhabditis elegans (Raj et al., 2010), Arabidopsis thaliana (Hall et al., 2007), maize (Ordas et al., 2008), and mouse (Fraser and Schadt, 2010). Genetic control of macro-environmental factor phenotype stability has been mapped in Arabidopsis as well (Hall et al., 2007).
The genetic control of environmental variation has been measured using alleles with a long evolutionary history by associating genotype variation with phenotype in the quantitative trait locus (QTL) and genome-wide association framework (Masel and Trotter, 2011). Micro-environmental buffers are sex specific and trans-acting in mouse gene expression (Fraser and Schadt, 2010), and in Arabidopsis stability QTL differing in different environments have been mapped. The alternative approach, rather than mapping, is construction of deletion or knock-down alleles, which has allowed large-scale tests of presence/absence gene effects in yeast (Nogami et al., 2007). In yeast environmental capacitors for morphological phenotypes are highly interconnected members of both physical and genetic networks and tend to have functions associated with response to stress (Levy and Siegal, 2008; Lehner, 2011). Essential yeast genes have less coupling between environmental plasticity of expression and noise, suggesting that uniformity has a fitness advantage (Lehner, 2010).
Adaptation to abiotic and biotic stress is the major breeding target today as we experience increasingly intense climate change. Future climate change scenarios suggest much larger swings in abiotic stresses such as temperature and precipitation than we see in today’s target breeding environments (Schneider et al., 2007). Thus, it is important to understand genetic control of phenotype stability in more typical field environments. Lab and controlled field experiments typically examine one environmental factor, which makes extrapolation to multiple-factor field environments difficult.
It is improbable that every stress has an entirely independent set of genes controlling adaptation and acclimation. Some stress responses will be unique and others in common in different stresses. As yet we have little understanding of how the overlap is configured (Des Marais and Juenger, 2010) and thus we have little ability to predict the effect of multiple stresses applied together (Mittler, 2006). Field environments vary in both temporal and abiotic axes, so to isolate factors or locate suitable test environments requires very large-scale experimentation.
There are a few examples of analysis of multiple environmental factors in combinatorial experiments (Mittler, 2006). Recent work on volatile organic compounds and on genotype and stress combinations in cowpea has provided two more examples of unpredictable multiple-stress-environment responses (Holopainen and Gershenzon, 2010; Singh et al., 2010). Better understanding of the specific genetic loci controlling multiple-stress responses is needed.
A schematic to illustrate detection of genetic control of uniformity in mapping populations is provided in Figure 1. The mean plant height is the same whether the B73 or Mo17 allele is present, but the uniformity within each genotype is different. In this hypothetical example, the B73 allele would confer low uniformity and the Mo17 allele confers maximum uniformity. If this approach is extended to multiple environments or treatments, genetic control of the environmental plasticity of the uniformity can be examined. To better connect field-scale experiments with laboratory-scale work, we have examined the genetic architecture of uniformity in single and combined stress. In combined stress environments new loci are found and some single-stress loci disappear – so even though there is no significant allelic difference at a locus for the second stress, the second stress still affects the phenotype indirectly. Alleles conferring high uniformity in single-stress environments no longer confer high uniformity when a second stress is added. Thus, this mapping population does not segregate for alleles that would improve uniformity in multiple-stress environments.
FIGURE 1
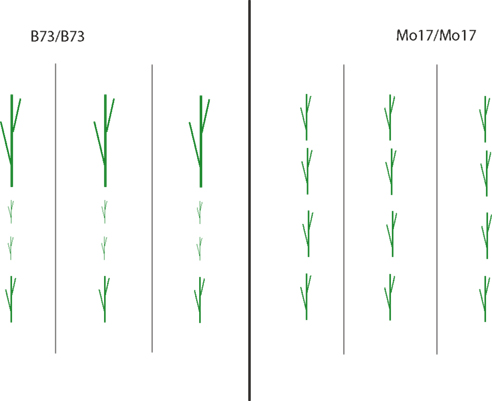
Figure 1. Schematic example of genetic control of uniformity. Three recombinant inbred lines for each parental type (B73 and Mo17) differing in a causal allele are shown on either side of the center line, with four plants of each genotype arranged vertically. The mean plant height is the same whether the B73 or Mo17 allele is present. However, the uniformity differs, with the B73 allele conferring low uniformity.
Materials and Methods
Seed Stocks
IBM94 Zea mays intermated recombinant inbred lines (RIL; Lee et al., 2002) were supplied by the Maize Co-op1. These lines were intermated four times before selfing, which increases the resolution of mapping (Lee et al., 2002). These are publically available stocks; these lines have been genotyped by several labs and genotype data are freely available2. Seed was increased in the field nursery at the North Carolina Central Crops Research Station Clayton, NC, USA3. Seed genotypes were verified using a set of 11 SSR markers that unambiguously distinguish each line (Lee et al., 2002). A subset of 50 lines was chosen using MapPop (Vision et al., 2000) to maximize the number of detectable recombinations in the subset. A list of all the markers used for data analysis is provided in File S3 in Supplementary Material; genotypes at each marker for each of the IBM94 RILs can be retrieved from http://www.maizegdb.org/map.php.
Experimental Design
The field experimental site was located at the North Carolina Central Crops Research Station, field G1D. This site is level and has a uniform soil type, Norfolk loamy sand. The field was divided into four sectors (Figure 2A), with two sectors fertilized using standard corn nursery treatments (before planting and side-dress at flowering) and two sectors treated with sulfur but no nitrogen, as sulfur supplementation was indicated from soil tests. Irrigation is standard for nursery and yield trials at this field site, so two perpendicular sectors were fitted with irrigation pipe to create a control sector, a low-nitrogen irrigated sector, a drought sector, and a drought plus low-nitrogen sector. Fifteen seeds of each recombinant inbred line were hand-planted in each sector in April 2008 at ∼0.25 m spacing, with one meter between each genotype. Hybrid commercial corn seed (Dekalb) was planted to fill in gaps, in eight rows between each sector, and bordering the entire field.
FIGURE 2
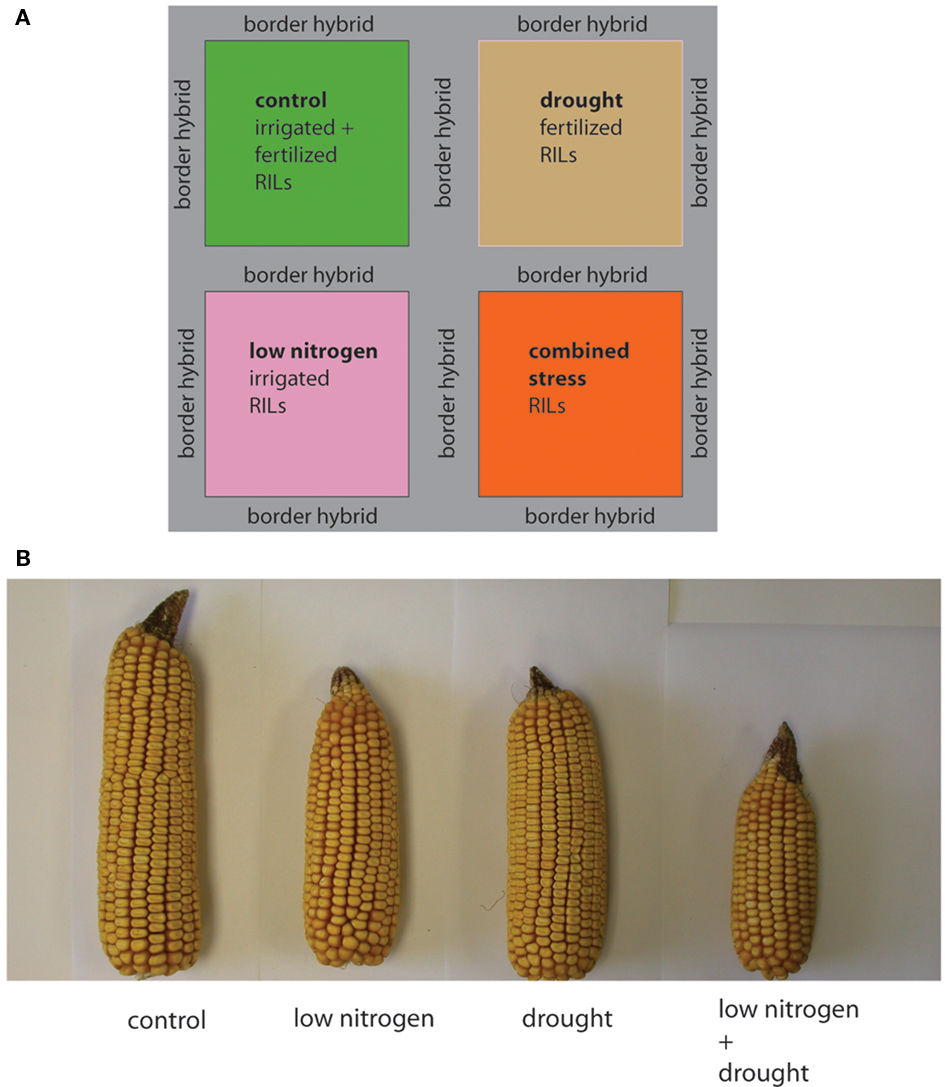
Figure 2. Experimental design and effect of field treatment blocks on hybrid maize. (A) Layout of field stress treatment blocks. Each field environment is color-coded, with control green, low N pink, drought tan, and combined low N and drought orange. (B) To illustrate the effect of the stress treatments one randomly chosen commercial hybrid ear from each treatment block is shown. Ear diameter, kernel number and ear length are affected by the stress treatments.
Plant Height Measurement
Individual plant heights were measured after pollination, when the plants had reached full height. Each plant in each genotype was measured from soil surface to tassel tip using a pole marked in 2.5 cm increments and a consistent procedure. Inter-rater coefficients of variation were less than 5% (data not shown). Complete phenotype data for each RIL and environment is provided in File S1 in Supplementary Material.
Data Analysis
Uniformity of the phenotype in each individual RIL was calculated using Levene’s mean ratio (LMR). LMR is obtained as the absolute value of each individual measurement minus the mean for that RIL genotype in that planting sector (the entry mean), divided by the entry mean. The LMR measure has a good balance between type I and type II error rate characteristics, though it is less conservative than the median version (Schultz, 1985). For plotting easy-to-read graphs with high numbers indicating high uniformity, we reversed the sign of the LMR so that uniformity had high values and higher variation (higher LMR value) had low uniformity values.
Genotype data for each recombinant inbred line was retrieved from MaizeGDB (Sen et al., 2010). Genetic map locations were updated to the IBM Neighbors 2005 coordinates to facilitate comparison with other mapping studies. Heritability of LMR was calculated by partitioning the variance in the trait with the QTL Network program (Yang et al., 2007; Yang et al., 2008). There are a large number of genotypic markers for these lines, which provides high resolution for QTL mapping. The marker order is error-prone, as the order was fit by genetic mapping methods and extrapolation (Cone et al., 2002). Publically available genomic sequence assemblies for maize are still in early stages, and there are large differences in order and content between maize inbreds (Gore et al., 2009; He and Dooner, 2009; Swanson-Wagner et al., 2010), so correcting map orders using the reference sequence is not yet possible. The dense map also means that adjacent markers along the chromosome are highly correlated. We designed a mapping method that is robust to errors in marker order and leverages the dense marker information. We located chromosomal regions important for LMR phenotype differences by mixed modeling using SAS Proc Mixed, v. 9.1 (Cary, NC, USA). We fit each marker and treatment environment and the interaction separately and then combined the P-values for correlated markers in chromosomal regions using the rank-adjusted truncated product method (Zaykin et al., 2002; Zaykin and Zhivotovsky, 2005), as implemented in SAS Proc PSMOOTH, with the Simes adjustment for multiple tests. Simulations for large and small recombinant inbred line sets show that this method has excellent power and avoids excessive false positives, at the cost of decreased QTL resolution along the chromosome (Balint-Kurti et al., 2010; Morrison et al., 2010). Effect sizes for each allele within each treatment were estimated by eBLUP. The estimated marker allele effects (for marker states A or B at each marker position) from each single-stress environment were summed to create a predicted value for the two-stress environment allele effect. Square root prediction error variance (equivalent to SE) of each estimate was used to determine if effects were different from the predicted amount. Our SAS code is provided in File S2 in Supplementary Material. Because the LMR can scale with the mean (Schultz, 1985; Dworkin, 2005) we also mapped mean trait values (plant heights) using the same procedure except for using the plant height rather than the LMR for each genotype in each environment. This allowed us to compare the identified uniformity loci to the mean height loci within this experiment. One locus that overlapped in the height and LMR maps was eliminated.
Results
The unfertilized and un-irrigated field sectors provided a less optimal growth environment, generating two different abiotic stresses. The stress treatment effects are illustrated in Figure 2B for cob characteristics in hybrids. Plant heights in a field setting are more difficult to photograph; plant heights of each recombinant inbred line (genotype) in each environment are given in File S1 in Supplementary Material. We chose to measure individual plant heights for this analysis as plant height is a less complex trait than overall yield (which includes yield components such as cob diameter, cob length, kernel size, and kernel number) and excess variation in plant height is a key factor in yield loss (Boomsma et al., 2010).
Genotype by environment effects on uniformity have approximately twice as much heritability as simple genetic effects (Table 1); these effects are the focus of our analysis. We identified nine QTL that have significant genotype by environment effects for uniformity of plant height. These loci were grouped into predictable and non-linear sets by the pattern of allele effects across the single and combined-stress environment factors. Predictable QTL are loci with an allele effect in the combined-stress condition similar to the sum of the allele effects from each individual stress. Six QTL had an additive-environment pattern of allele effects (Figure 3), with the predicted allele effects in the combined stress (gray bars) within the SE ranges for the experimental combined stress (orange bars). Loci with significant interacting effects can have a variety of allele differences in the stress and control environments. There can be an overall interaction, but with no significant differences when the control allele differences are considered, as in Figures 3A,B. In these two loci the B73 and Mo17 alleles are significantly different from each other in the low-nitrogen environment, but not different from the control allele effects (the error bars overlap). We also find stress-specific effects, such as the B73 allele conferring increased uniformity in the low-nitrogen environment as compared to the control environment (Figure 3), and B73 alleles conferring decreased uniformity under drought stress as compared to control B73 allele effects (Figures 3D,E). Finally, we can see dose-specific effects, as in Figure 3F, where the Mo17 allele has less uniformity in the combined-stress environment only.
TABLE 1
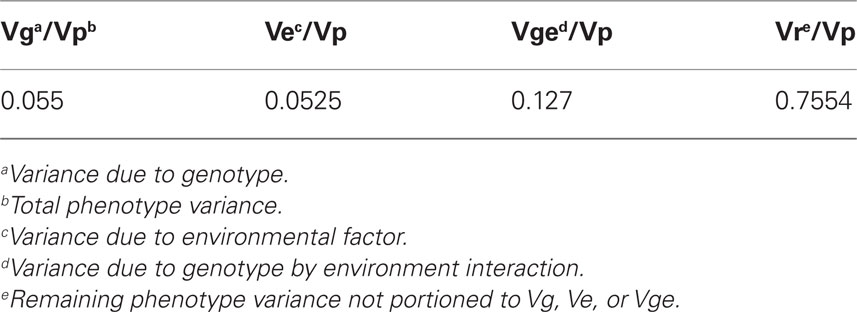
Table 1. Variance components for Levene mean ratio population mean was 0.0656.
FIGURE 3
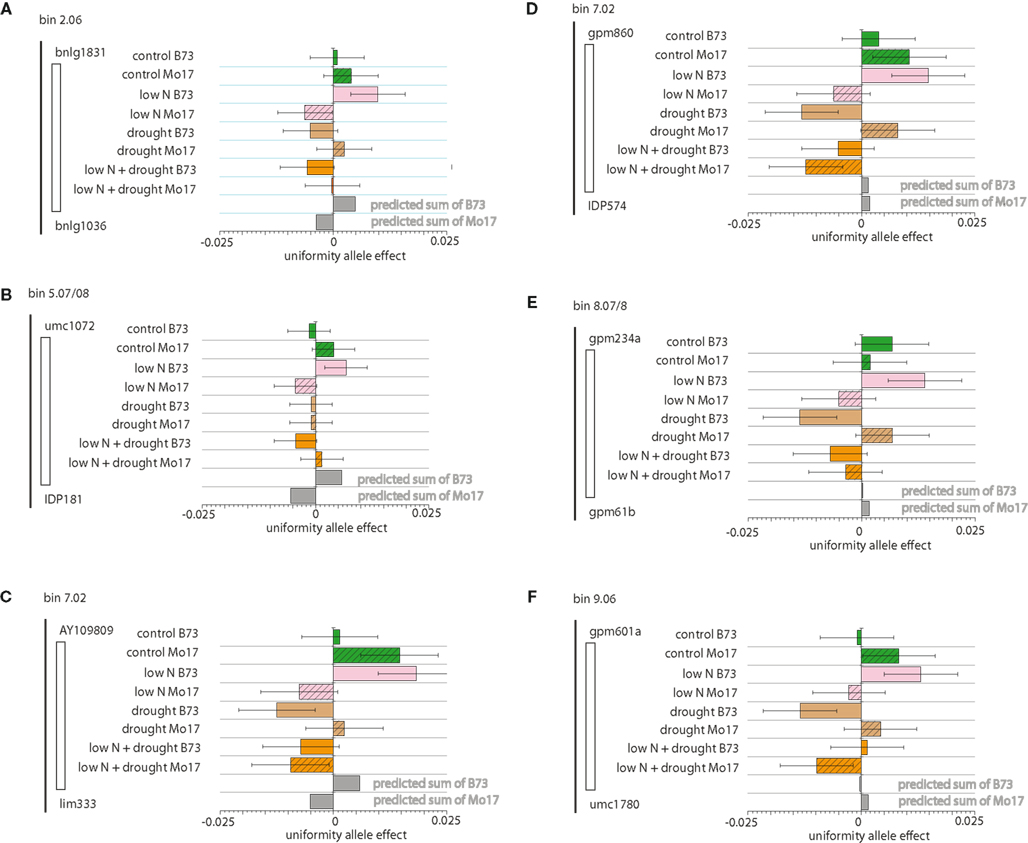
Figure 3. Additive Environmental Uniformity Effect Loci Allele effects for loci with significant genotype by environment interactions and measured combined-stress environment effects similar to effects predicted by simple addition of single-stress effects are shown. For each of the four field sectors (control, low nitrogen [N], drought, and low N plus drought) B73 allele effects are indicated in solid and Mo17 effects as hatched. Each field environment is color-coded, with control green, low N pink, drought tan, and combined low N and drought orange. Square root prediction error variance (equivalent to SE) bars are indicated for each estimate. Addition of effect size from low N and drought provides the predicted effect size at the bottom of each graph. Low allele effect numbers indicate more variation, as the X axis on each plot is – LMR. (A) Chromosome 2 locus, bin 2.06. (B) Chromosome 5.07/5.08 locus. (C) Chromosome 7 locus, bin 7.02. (D) Chromosome 7 locus, bin 7.02. (E) Chromosome 8 locus, bin 8.07/8.08. (F) Chromosome 9 locus, bin 9.06.
The second class of uniformity QTL are those with a combined-stress allele effect that is not predictable from the allele’s effect in the single-stress environment (Figure 4), which can be seen by comparison of the gray bars for the summed effect to the orange bars for the experimental effect of the alleles at these loci in the combined stress. We see patterns that may result from “ascendancy” of one signal, as in Figures 4A,C where the change in uniformity conferred by the B73 allele in low nitrogen is lost in the combined-stress environment, even though drought alone has no significant effect. The chromosome 6 QTL (Figure 4B) shows different allele effects in drought and combined stress; however, this QTL is large and inspection of the P-value distribution suggests that two linked QTL may be present.
FIGURE 4
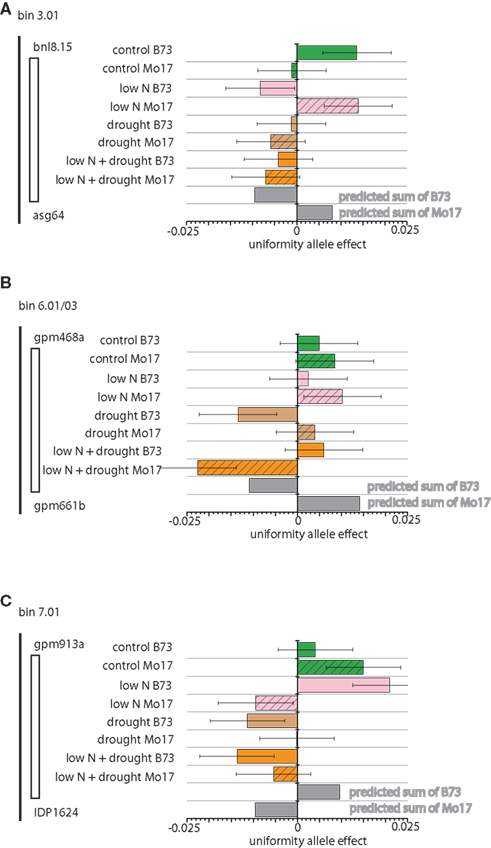
Figure 4. Non-additive Environmental Uniformity Effect Loci Allele effects for loci with significant genotype by environment interactions and measured two-stress environment effects different from effects predicted by simple addition of single-stress effects are shown. For each of the four field sectors (control, low nitrogen [N], drought, and low N plus drought) B73 allele effects are indicated in solid and Mo17 effects as hatched. Each field environment is color-coded, with control green, low N pink, drought tan, and combined low N and drought orange. Square root prediction error variance (equivalent to SE) bars are indicated for each estimate. Addition of effect size from low N and drought provides the predicted effect size at the bottom of each graph. Low allele effect numbers indicate more variation, as the X axis on each plot is – LMR. (A) Chromosome 3 locus, bin 3.01. (B) Chromosome 6 locus, bin 6.01/6.03. (C) Chromosome 7 locus, bin 7.01.
We found 20 QTL with effects on mean plant height in at least one of the treatments (Table 2). Some are stress-specific (italics in Table 2), some have an additive effect, where the allele effect for the combined-stress environment is similar to the expected amount from the allele effects in each separate stress, and some are non-linear (shaded boxes in Table 2). The non-linear allele effects are often higher than predicted, indicating that plant height is not decreased as much as expected with two combined stresses. We did not find any general stress-resistance alleles, where an allele conferred a difference in both drought and low-nitrogen single-stress environments. The 20 mean height QTL are in different places in the genome than the uniformity QTL (Figures 3 and 4; Table 2; File S3 in Supplementary Material).
TABLE 2
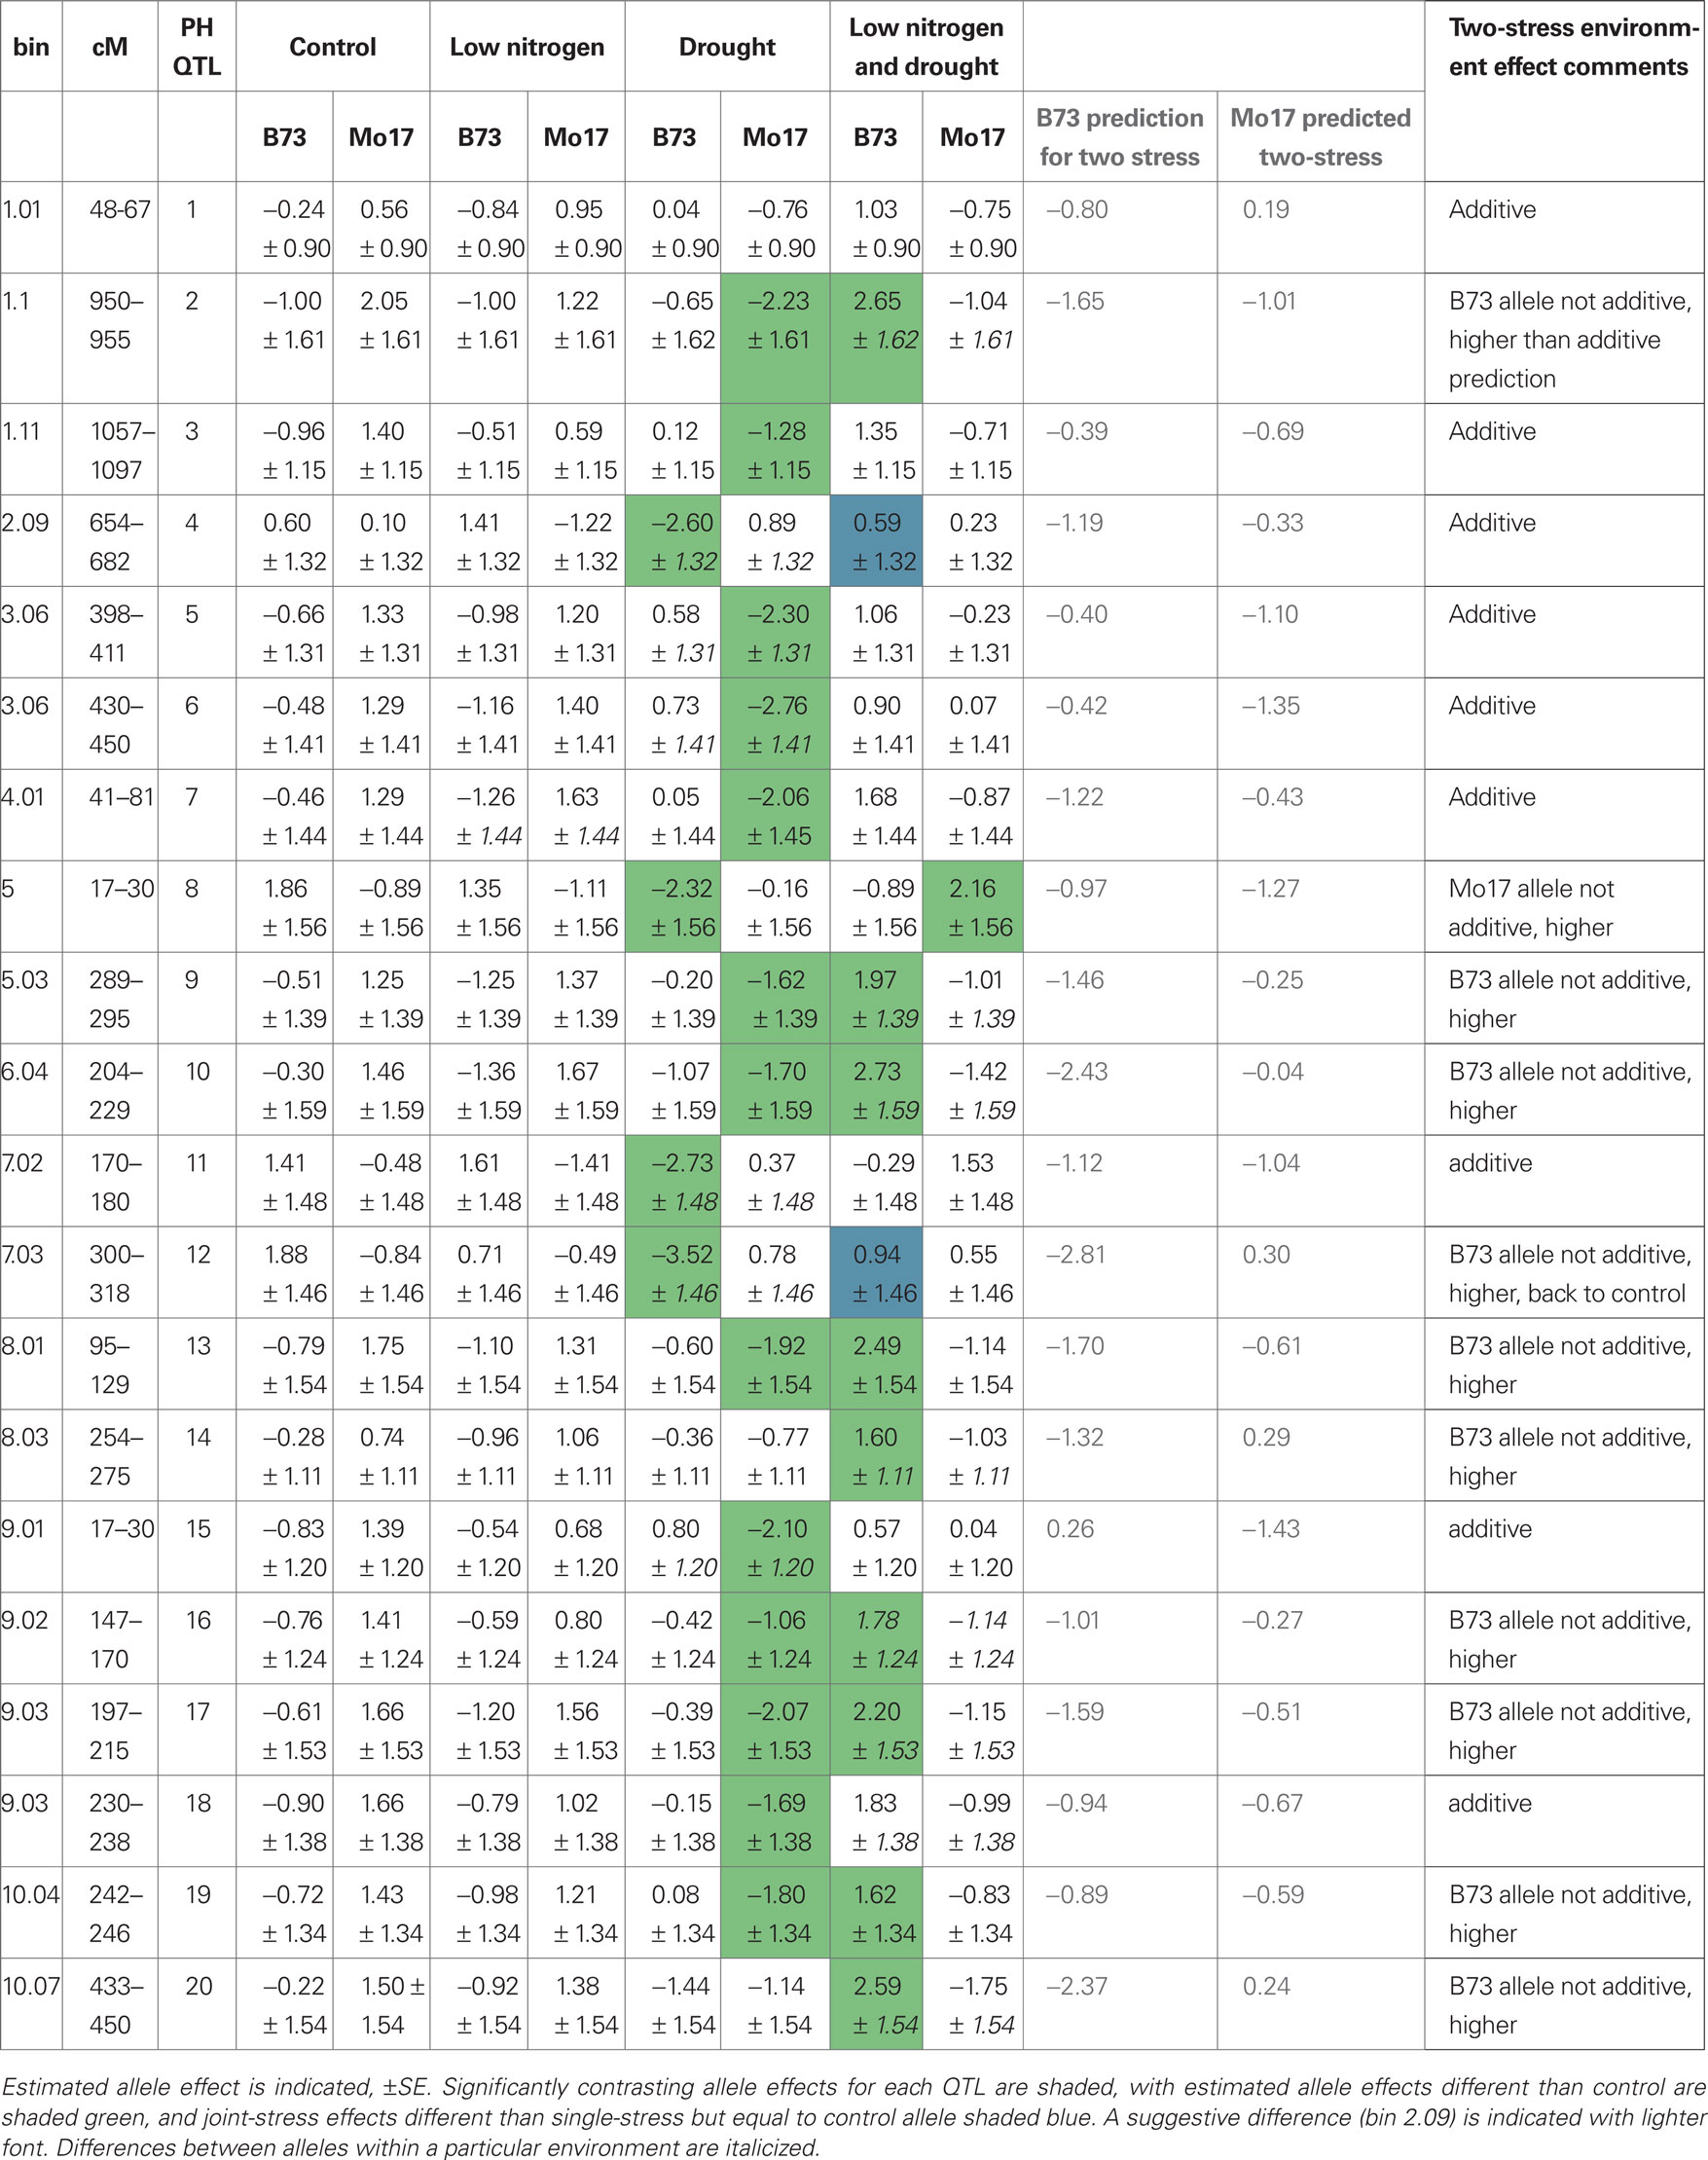
Table 2. Plant height loci – allele effects in each treatment environment.
Discussion
Plant height phenotype stability is important for yield in certain environments, such as no-till in maize (Boomsma et al., 2010). We show that height uniformity is genetically controlled, and that non-linear genotype by environment interactions results in some loci controlling uniformity only in combined-stress environments (Figure 3). We observe a decrease in uniformity with two combined stresses in all cases, both for additive uniformity loci and for non-linear response loci (Figures 3 and 4). This mapping population thus does not carry useful alleles for improvement in uniformity in abiotic stress environments, though it does segregate alleles for height difference per se (Table 2). B73 and Mo17 were derived from selective breeding programs (Zuber, 1973; Baker, 1984; Troyer, 1999) which typically include substantial selection for uniformity, and thus may already have fixed the some stress-uniformity enhancing alleles. Analysis of plant height uniformity in normal non-stress growth conditions using a Spanish maize mapping population localized one QTL on chromosome 10 (Ordas et al., 2008), while we observed no uniformity QTL on that chromosome. Broader surveys of maize germplasm, such as multiparent populations, may provide better sources for uniformity improvement for future selective breeding. One caveat to this strategy is that in models of transcriptional regulatory networks, environmental perturbation always increases variance, provided the network is already robust to mutational change (Espinosa-Soto et al., 2011). If this is the case for plant stress responses, then it may not be possible to select for improved alleles in adapted material, and wide crosses may be the best source of alleles for uniformity selection.
In contrast to loci important for uniformity control, both negative and positive alleles for height mean are seen, with the most common combined-stress pattern having height less affected than predicted (Table 2). Environment-specific QTL for mean height are found primarily in the drought treatment (Table 2), suggesting that there is more genetic variation for drought responses than for low-nitrogen adaptation in B73 and Mo17. Both inbreds are somewhat sensitive to drought (W. Xu, personal communication), but the mechanism of drought sensitivity is different in the two inbreds, and the F1 hybrid is drought tolerant (A. Hallauer, personal communication). We thus expected segregation of drought-response alleles in this population, as we observed.
We detect both stress-specific plasticity QTL and loci for phenotype stability, but these sets of loci do not significantly overlap. Differences in controlling loci for uniformity and mean suggest that there are separate evolutionary trajectories for these two aspects of plant height, as proposed for in yeast for gene expression (Lehner, 2010).
The loci we detected have additive effects, which are useful for selective breeding. To understand the genetic control of stability, it would also be useful to examine epistatic interactions, especially those interactions that are important only when both alleles are present (loci with no marginal effect). This may be especially important if good additive alleles were already fixed. Our mapping experiment is underpowered to detect epistasis, so in future work larger populations could be used to address this point. Phenotype stability to temporal variation in stress as well as to factorial combinations would also be informative for future analysis.
Conflict of Interest Statement
The authors declare that the research was conducted in the absence of any commercial or financial relationships that could be construed as a potential conflict of interest.
Acknowledgments
We are grateful for superb experimental field support by C. Herring and the Central Crops staff. We appreciate field measurement assistance from A. Michenfelder, R. L. Bryden, and C. T. Smitherman and statistical advice from J. Holland and L. McIntyre. D. Kliebenstein and Kliebenstein lab members provided editorial advice that greatly improved the clarity of the manuscript. This project was partially supported by the National Research Initiative Competitive Grant no. 2009-35100-05028 from the USDA National Institute of Food and Agriculture.
Supplementary Material
The Supplementary Material for this article can be found online at http://www.frontiersin.org/Plant_Genetics_and_Genomics/10.3389/fpls.2011.00012/abstract
File S1. Excel file containing phenotype measurements for each recombinant inbred line in each environment.
File S2. Word file containing detailed description and SAS code used for data analysis.
File S3. Excel file with all 3240 genetic markers, map positions, and positions of LMR and plant height QTL.
Footnotes
References
Baker, R. (1984). “Some of the open pollinated varieties that contributed the most to modern hybrid corn,” in Illinois Corn Breeders School. University of Illinois, Urbana, IL.
Balint-Kurti, P., Simmons, S. J., Blum, J. E., Ballare, C. L., and Stapleton, A. E. (2010). Maize leaf epiphytic bacteria diversity patterns are genetically correlated with resistance to fungal pathogen infection. Mol. Plant Microbe Interact. 23, 473–484.
Boomsma, C. R., Santini, J. B., West, T. D., Brewer, J. C., McIntyre, L. M., and Vyn, T. J. (2010). Maize grain yield responses to plant height variability resulting from crop rotation and tillage system in a long-term experiment. Soil Tillage Res. 106, 227–240.
Cone, K. C., McMullen, M. D., Bi, I. V., Davis, G. L., Yim, Y.-S., Gardiner, J. M., Polacco, M. L., Sanchez-Villeda, H., Fang, Z., Schroeder, S. G., Havermann, S. A., Bowers, J. E., Paterson, A. H., Soderlund, C. A., Engler, F. W., Wing, R. A., and Coe, E. H. (2002). Genetic, physical, and informatics resources for maize. On the road to an integrated map. Plant Physiol. 130, 1598–1605.
Des Marais, D. L., and Juenger, T. E. (2010). Pleiotropy, plasticity, and the evolution of plant abiotic stress tolerance. Ann. N. Y. Acad. Sci. 1206, 56–79. doi: 10.1111/j.1749-6632.2010.05703.x
Duvick, D. N. (2005). The contribution of breeding to yield advances in maize (Zea mays L.). Adv. Agron. 86, 83–145.
Dworkin, I. (2005). “Canalization, cryptic variation and developmental buffering: a critical examination and analytical perspective,” in: Variation, eds B. Hallgrimsson and B. K. Hall (Waltham, MA: Academic Press) 131–158.
Espinosa-Soto, C., Martin, O. C., and Wagner, A. (2011). Phenotypic robustness can increase phenotypic variability after nongenetic perturbations in gene regulatory circuits. J. Evol. Biol. 24, doi: 10.1111/j.1420-9101.2011.02261.x
Fasoula, V. A., and Fasoula, D. A. (2002). Principles underlying genetic improvement for high and stable crop yield potential. Field Crops Res. 75, 191–209.
Fasoula, V. A., and Tollenaar, M. (2005). The impact of plant population density on crop yield and response to selection in maize. Maydica 50, 39–48.
Fraser, H. B., and Schadt, E. E. (2010). The quantitative genetics of phenotypic robustness. PLoS ONE 5, e8635. doi: 10.1371/journal.pone.0008635
Gore, M. A., Chia, J.-M., Elshire, R. J., Sun, Q., Ersoz, E. S., Hurwitz, B. L., Peiffer, J. A., McMullen, M. D., Grills, G. S., Ross-Ibarra, J., Ware, D. H., and Buckler, E. S. (2009). A first-generation haplotype map of maize. Science 326, 1115–1117.
Hall, M. C., Dworkin, I., Ungerer, M. C., and Purugganan, M. (2007). Genetics of microenvironmental canalization in Arabidopsis thaliana. Proc. Natl. Acad. Sci. U.S.A. 104, 13717–13722.
He, L., and Dooner, H. K. (2009). Haplotype structure strongly affects recombination in a maize genetic interval polymorphic for Helitron and retrotransposon insertions. Proc. Natl. Acad. Sci. U.S.A. 106, 8410–8416.
Holopainen, J. K., and Gershenzon, J. (2010). Multiple stress factors and the emission of plant VOCs. Trends Plant Sci. 15, 176–184.
Lee, M.-L. T., Sharopova, N., Beavis, W. D., Grant, D., Katt, M., Blair, D., and Hallauer, A. (2002). Expanding the genetic map of maize with the intermated B73 x Mo17 (IBM) population. Plant Mol. Biol. 48, 453–461.
Lehner, B. (2010). Conflict between noise and plasticity in yeast. PLoS Genet. 6, e1001185. doi: 10.1371/journal.pgen.1001185
Lehner, B. (2011). Genes confer similar robustness to environmental, stochastic, and genetic perturbations in yeast. PLoS ONE 5, e9035. doi: 10.1371/journal.pone.0009035
Levy, S. F., and Siegal, M. L. (2008). Network hubs buffer environmental variation in Saccharomyces cerevisiae. PLoS Biol. 6, e264. doi: 10.1371/journal.pbio.0060264
Mackay, T. F. C., and Lyman, R. F. (2005). Drosophila bristles and the nature of quantitative genetic variation. Philos. Trans. R. Soc. Lond. B. Biol. Sci. 360, 1513–1527.
Martin, K. L., Hodgen, P. J., Freeman, K. W., Melchiori, R., Arnall, D. B., Teal, R. K., Mullen, R. W., Desta, K., Phillips, S. B., Solie, J. B., Stone, M. L., Caviglia, O., Solari, F., Bianchini, A., Francis, D. D., Schepers, J. S., Hatfield, J. L., and Raun, W. R. (2005). Plant-to-plant variability in corn production. Agron. J. 97, 1603–1611.
Masel, J., and Siegal, M. L. (2009). Robustness: mechanisms and consequences. Trends Genet. 25, 395–403.
Mittler, R. (2006). Abiotic stress, the field environment and stress combination. Trends Plant Sci. 11, 15–19.
Morrison, K. M., Simmons, S. J., and Stapleton, A. E. (2010). Loci controlling nitrate reductase activity in maize: ultraviolet-B signaling in aerial tissues increases nitrate reductase activity in leaf and root when responsive alleles are present. Physiol Plant 140, 334–341.
Nogami, S., Ohya, Y., and Yvert, G. L. (2007). Genetic complexity and quantitative trait loci mapping of yeast morphological traits. PLoS Genet. 3, e31. doi: 10.1371/journal.pgen.0030031
Ordas, B., Malvar, R. A., and Hill, W. G. (2008). Genetic variation and quantitative trait loci associated with developmental stability and the environmental correlation between traits in maize. Genet. Res. (Camb.) 90, 385–395.
Raj, A., Rifkin, S. A., Andersen, E., and van Oudenaarden, A. (2010). Variability in gene expression underlies incomplete penetrance. Nature 463, 913–918.
Rossini, M. A., Maddonni, G. A., and Otegui, M. E. (2011). Inter-plant competition for resources in maize crops grown under contrasting nitrogen supply and density: variability in plant and ear growth. Field Crops Res. 121, 373–380.
Schneider, S. H., Semenov, S., Patwardhan, S. A., Burton, I., Magadza, C. H. D., Oppenheimer, M., Pittock, B., Rahman, A., Smith, J. B., Suarez, A., and Yamin, F. (2007). “Assessing key vulnerabilities and the risk from climate change,” in Climate Change 2007: Impacts, Adaptation and Vulnerability. Contribution of Working Group II to the Fourth Assessment Report of the Intergovernmental Panel on Climate Change, eds M. L. Parry, O. F. Canziani, J. P. Palutikof, P. J. van der Linden and C. E. Hanson (Cambridge: Cambridge University Press).
Sen, T. Z., Harper, L. C., Schaeffer, M. L., Andorf, C. M., Seigfried, T. E., Campbell, D. A., and Lawrence, C. J. (2010). Choosing a genome browser for a model organism database: surveying the maize community. Database doi: 10.1093/database/baq007
Singh, S. K., Kakani, V. G., Surabhi, G.-K., and Reddy, K. R. (2010). Cowpea (Vigna unguiculata [L.] Walp.) genotypes response to multiple abiotic stresses. J. Photochem. Photobiol. B Biol. 100, 135–146.
Swanson-Wagner, R. A., Eichten, S. R., Kumari, S., Tiffin, P., Stein, J. C., Ware, D., and Springer, N. M. (2010). Pervasive gene content variation and copy number variation in maize and its undomesticated progenitor. Genome Res. 20, 1689–1699.
Tokatlidis, I., Haş, V., Mylonas, I., Haş, I., Evgenidis, G., Melidis, V., Copandean, A., and Ninou, E. (2010). Density effects on environmental variance and expected response to selection in maize (Zea mays L.). Euphytica 174, 283–291.
Vision, T. J., Brown, D. G., Shmoys, D. B., Durrett, R. T., and Tanksley, S. D. (2000). Selective mapping: a strategy for optimizing the construction of high-density linkage maps. Genetics 155, 407–420.
Yang, J., Hu, C., Hu, H., Yu, R., Xia, Z., Ye, X., and Zhu, J. (2008). QTLNetwork: mapping and visualizing genetic architecture of complex traits in experimental populations. Bioinformatics 24, 721–723.
Yang, J., Zhu, J., and Williams, R. W. (2007). Mapping the genetic architecture of complex traits in experimental populations. Bioinformatics 23, 1527–1536.
Zaykin, D., and Zhivotovsky, L. (2005). Ranks of genuine associations in whole genome scans. Genetics 171, 813–823.
Zaykin, D. V., Zhivotovsky, L., Wesfall, P. H., and Weir, B. S. (2002). Truncated product method for combining P-values. Genet. Epidemiol. 22, 170–185.
Zhang, X. S. (2008). Increase in quantitative variation after exposure to environmental stresses and/or introduction of a major mutation: G × E interaction and epistasis or canalization? Genetics 180, 687–695.
Keywords: QTL, maize, Zea mays L., multiple stress, combined stress, abiotic, phenotype stability, uniformity
Citation: Makumburage GB and Stapleton AE (2011) Phenotype uniformity in combined-stress environments has a different genetic architecture than in single-stress treatments. Front. Plant Sci. 2:12. doi: 10.3389/fpls.2011.00012
Received: 07 March 2011; Accepted: 15 April 2011;
Published online: 04 May 2011.
Edited by:
Qifa Zhang, Huazhong Agricultural University, ChinaReviewed by:
Nathan M. Springer, University of Minnesota, USAXingyi Guo, Albert Einstein College of Medicine, USA
Copyright: © 2011 Makumburage and Stapleton. This is an open-access article subject to a non-exclusive license between the authors and Frontiers Media SA, which permits use, distribution and reproduction in other forums, provided the original authors and source are credited and other Frontiers conditions are complied with.
*Correspondence: Ann E. Stapleton, Department of Biology and Marine Biology, University of North Carolina Wilmington, 601 S. College Road, Wilmington, NC 28403, USA. e-mail: stapletona@uncw.edu