 Kumud Saini1
 Marios N. Markakis1,2
 Malgorzata Zdanio1
 Daria M. Balcerowicz1
 Tom Beeckman3,4Lieven De Veylder3Els Prinsen1
 Gerrit T. S. Beemster1
 Kris Vissenberg1,5*
- 1Integrated Molecular Plant Physiology Research, University of Antwerp, Antwerp, Belgium
- 2Faculty of Health and Medical Sciences, Copenhagen, Denmark
- 3Center for Plant Systems Biology, VIB, Ghent, Belgium
- 4Department of Plant Biotechnology and Bioinformatics, Ghent University, Ghent, Belgium
- 5Plant Biochemistry and Biotechnology Lab, Department Of Agriculture, School of Agriculture, Food and Nutrition, University of Applied Sciences Crete – Technological Educational Institute (UASC-TEI), Heraklion, Greece
In plants many developmental processes are regulated by auxin and its directional transport. PINOID (PID) kinase helps to regulate this transport by influencing polar recruitment of PIN efflux proteins on the cellular membranes. We investigated how altered auxin levels affect leaf growth in Arabidopsis thaliana. Arabidopsis mutants and transgenic plants with altered PID expression levels were used to study the effect on auxin distribution and leaf development. Single knockouts showed small pleiotropic growth defects. Contrastingly, several leaf phenotypes related to changes in auxin concentrations and transcriptional activity were observed in PID overexpression (PIDOE) lines. Unlike in the knockout lines, the leaves of PIDOE lines showed an elevation in total indole-3-acetic acid (IAA). Accordingly, enhanced DR5-visualized auxin responses were detected, especially along the leaf margins. Kinematic analysis revealed that ectopic expression of PID negatively affects cell proliferation and expansion rates, yielding reduced cell numbers and small-sized cells in the PIDOE leaves. We used PIDOE lines as a tool to study auxin dose effects on leaf development and demonstrate that auxin, above a certain threshold, has a negative affect on leaf growth. RNA sequencing further showed how subtle PIDOE-related changes in auxin levels lead to transcriptional reprogramming of cellular processes.
Introduction
For agronomical reasons and to improve our knowledge of organ size control in multicellular organisms it is important to understand the genetic basis and the encoded molecular circuitry regulating the growth of organs such as leaves (Powell and Lenhard, 2012; Nelissen et al., 2014; Czesnick and Lenhard, 2015; Vanhaeren et al., 2015). Leaf initiation occurs at the periphery of the shoot apical meristem (SAM) where a few stem cells start to proliferate and develop into a primordium, which subsequently grows out to form a leaf. These latter stages of growth are solely defined by two distinct but overlapping processes: cell proliferation that results from cell division (cell cycle activity), and subsequent cell expansion, driven by vacuolar expansion and cell wall extension through the activity of numerous cell wall modifying proteins (Green, 1976; Green and Bauer, 1977; Beemster and Baskin, 1998; Donnelly et al., 1999; Cosgrove, 2000, 2001; De Veylder et al., 2001; Breuninger and Lenhard, 2010; Wolf et al., 2012; Kalve et al., 2014; Szymanski, 2014). Though overlapping, these two processes are separated in time, allowing kinematic growth analysis to calculate average rates of cell division and expansion. Such studies provide insights into the variation in cellular processes and help to understand how the activity of individual cells defines the fate of a mature leaf (Silk and Erickson, 1979; De Veylder et al., 2001).
The plant growth hormone auxin regulates leaf growth and development by controlling leaf positioning, initiation, differentiation and venation patterning (Reinhardt et al., 2000, 2003; Benkova et al., 2003; Scarpella et al., 2006). Local auxin accumulation mediated by PIN-FORMED1 (PIN1) efflux proteins specifies the site of leaf primordium initiation, while its depletion from the proximity inhibits the formation of additional primordia (Reinhardt et al., 2003; Heisler et al., 2005; Vernoux et al., 2010). Basipetal transport of auxin through the subepidermal layers of a developing primordium leads to the formation of a midvein and lateral veins (Scarpella et al., 2006). Auxin also influences formation of leaf serrations by generating PIN1 localization-driven auxin maxima in the lobes at the leaf margin (Hay et al., 2006; Bilsborough et al., 2011). In brief, auxin transport not only plays a pivotal role in early leaf initiation, but also in the later phases sculpting mature leaf shape and form.
Directional flow of auxin occurs by active polar transport with the help of AUXIN1/LIKE AUX1 (AUX/LAX) influx carriers and efflux carriers such as PINs and ABC transporters (Křečk et al., 2009; Kang et al., 2011; Swarup and Péret, 2012). Disruption of this auxin transport causes defects in many developmental and growth-related processes (Friml, 2003). PINOID (PID) is an early auxin-inducible gene belonging to the AGC VIII group of protein-serine/threonine kinases (Robert and Offringa, 2008) that plays a major role in the control of polar auxin transport (PAT; Bennett, 1995; Christensen et al., 2000; Benjamins et al., 2001). PID plays a controlling role in PINs’ subcellular distribution, since changes in PIN1, PIN2, and PIN4 localization in the plasma membrane switches from the basal to the apical side of the cell when PID abundance passes above a certain threshold (Friml et al., 2004).
Here, we show the effect of altered PID expression on auxin and we study the effect of these changes on Arabidopsis leaf growth. While pid knockouts had no significant changes in total auxin levels, PIDOE contrastingly, accumulated auxin in the leaves. Previous reports showed that allelic mutants of pid show pleiotropic growth defects (Bennett, 1995) and PIDOE lines display an agravitropic root phenotype and reduced number of lateral roots (Benjamins et al., 2001). However, leaf phenotyping, especially with cellular resolution, has not received much attention. In our study, PIDOE lines showed a strikingly reduced rosette growth, encouraging us to study the cellular and genetic basis of this interesting phenotype.
Materials and Methods
Plant Material and Growth Conditions
Seedlings of Arabidopsis thaliana Col-0 ecotype were grown in half strength Murashige and Skoog (MS) medium including vitamins (Duchefa, The Netherlands), containing 1% sugar, 0.5 g/L MES buffer and 0.7% agar at 21°C with a light intensity of 70–90 μmol m-2s-1 in long day conditions. Prior to sowing, seeds were sterilized with 70% ethanol for 30 s, subsequently with 5% bleach and sterile water. Knockout T-DNA insertion lines were obtained from NASC. The pid-14 mutant was the SALK_049736 line as reported by Haga et al. (2014). The two PIDOE lines, P10 and P21, were developed by Benjamins et al. (2001) by cloning the PID cDNA in sense orientation behind the strong Cauliflower Mosaic Virus 35S promoter (35S::PID) and introducing it into A. thaliana ecotype Columbia (Col).
Microscopic Morphological Analysis and Kinematic Growth Analysis
Rosette pictures were taken from three replicate plates using a Cannon EOS 40D camera. Leaves were cleared overnight with 70% ethanol, followed by 100% lactic acid. Cleared leaves were then pictured under a Nikon AZ-100 macroscope equipped with a Nikon DS-Ri1 digital camera. Pictures of young leaves and epidermal cells were taken with a Nikon C1 confocal microscope (Nikon, Belgium) using 20–60× lenses depending on the age. Three leaves, with an area close to the average, were chosen for drawing cells in ImageJ1. The drawn cell pictures were saved as eight bit and 2556 × 2045 size, in jpeg format and later analyzed in a linux-based software and used for further calculations as in Andriankaja et al. (2012). Cell measurements for the petiole were made by staining petioles in propidium iodide as mentioned in Wuyts et al. (2010) followed by visualization using a Nikon C1 confocal microscope.
Transverse Sectioning
In brief, fixed leaves were dehydrated by sequential incubation in different concentrations of ethanol and embedded in Technovit 7100 resin (Kalve et al., 2015). Using a rotary microtome, 5 μm thick sections of the middle part of leaves were made, stained and mounted on slides before visualization.
GUS Staining
Whole plants were cleared in acetone for 10 min followed by a 10 min treatment with GUS solution (Phosphate buffer (pH 7), 0.1% Triton X-100, 0.5 mM K4[Fe(CN)6].3H20, 0.5 mM K3[Fe(CN)6]) without X-gluc before being kept at 37°C in GUS staining solution with X-gluc (958 μM X-gluc dissolved in 1% DMSO). Samples were fixed with ethanol:acetic acid (3:1) after 3–5 h and cleared with 8 M NaOH before mounting on slides.
Auxin Quantification
To measure concentrations of free and conjugated IAA, leaves 1 and 2 were harvested every day from 9 to 25 DAS. The analyses were repeated twice as independent experiments and from multiple plates in each experiment. Dissected samples were collected, frozen in liquid nitrogen, and ground using a MagNALyser (Roche) with 2 mm glass beads. IAA was extracted based on Prinsen et al. (2000). Homogenized leaves were extracted overnight in 80% methanol (10 ml/g fresh weight). C613-phenyl-IAA (150 pmol, Cambridge Isotope Laboratories Inc., Andover, MA, United States) was added as internal standard. After centrifugation (20000 g, 15 min, 4°C, 5810R, rotor FA-45-30-11 Eppendorf, Hamburg, Germany), part of the supernatant was passed over a C18 cartridge (500 mg, Varian, Middelburg, The Netherlands) to retain pigments. The effluent was then diluted to 50% methanol and concentrated on a DEAE-Sephadex (2 ml, GE Healthcare Bio-Sciences AB, Uppsala, Sweden) anion exchange column for the analysis of free IAA. The DEAE cartridge was eluted with 10 ml 6% formic acid and IAA was concentrated on a C18 cartridge coupled underneath. This C18 cartridge was then eluted with 2 × 0.5 ml diethylether and the ether was evaporated (Turbovap), dissolved in acidified methanol and methylated with diazomethane. The samples were subsequently dried under a nitrogen stream and dissolved in 50 μl 10% MeOH. For small biomasses, samples were diluted in 6% formic acid and immediately concentrated on a C18 cartridge omitting the DEAE anion exchange cartridge. The remaining part of the supernatant was diluted ½ with 14 N NaOH and hydrolysed at 100°C for 3 h under a water saturated nitrogen stream. After hydrolysis, samples were titrated to pH-3 with 1 M HCl, diluted 1/10 with water and concentrated on a C18 cartridge as described above for free IAA (Prinsen et al., 2000).
Indole-3-acetic acid was analyzed by UPLC-MS/MS (Acquity TQD, Waters, Manchester, United Kingdom) (6 μl injection by partial loop, column temp. 30°C, solvent gradient 0–2 min: 95/5; 10% MeOH in NH4OAc 1 mM/MeOH; 2–4 min linear gradient until 10/90 10% MeOH in NH4OAc, 1 mM/MeOH; 4–6 min, isocratic 10/90 10% MeOH in NH4OAc 1 mM/MeOH; MS conditions: Polarity MS ES(++), capillary 2 kV, cone 20 V, collision energy: 20 eV, source temperature: 120°C, desolvation Temperature: 450°C, Cone gas flow 50l/h, desolvation gas flow: 750 l/h, collision gas flow: 0.19 ml/h). For quantification we selected the diagnostic transitions 190 > 130 m/z for Me-IAA and 196 > 136 m/z for Me-C13-IAA (dwell time 0.020 s) using Masslynx and Quanlynx software (V4.1, Waters). Methanol and water used for MS were UPLC grade (Biosolve, Valkenswaard, The Netherlands). Data are expressed in pmol per gram fresh weight (pmol.g-1FW).
Flow Cytometry
Leaves were harvested as for auxin quantification. Prior to analysis the frozen leaves (kept on dry ice) were chopped with a single edge razor blade in 200 μl Crystain UV precise P Nuclei extraction buffer (Partec) and 800 μl Cystain fluorescent buffer (Partec). The mix was filtered through a 50 μm CellTrics filter and transferred to a glass tube. At least 10,000 nuclei were analyzed with a CyFlow flow cytometer and the FloMax software (Partec) in six independent biological replicates for each genotype. Endoreduplication index was calculated as
Confocal Imaging
Seedlings of DR5rev::GFP and crossed with PIDOE lines were stained with propidium iodide (0.1 mg ml-1) for visualization of cell walls. A Nikon C1 confocal microscope (Nikon, Brussels, Belgium) was used for GFP visualization.
Expression Profiling
For expression analysis RNA was isolated using Purelink Plant RNA reagent (Ambion Life Technologies) and quantified with a nanodrop NZ 1000 (Thermo scientific). An average of 1 μg of RNA was used for first strand cDNA synthesis using RQ1 RNase-Free DNase treatment and the GoScriptTM Reverse Transcription System (Promega). A PCR of 30 cycles, using ACT 8 primers and gene specific primers spanning the intron region, was performed with 54°C as annealing temperature (primers in Supplementary Table 1). The time course SyBr green assay for qPCR was accomplished as per the developer’s protocol using ROX SYBR Mastermix blue dTTP (Takyon) and a Step one plus thermocycler (Life technologies). This was done as three biological and technical repetitions using ACT8 as the reference gene. The results were analyzed as ΔΔCT comparison with the StepOnePlusTM Real-Time PCR System (Life TechnologiesTM) software with a confidence level set at 95%.
RNA Sequencing
Eighteen RNA samples, originating from the first pair of leaves at 9 and 16 DAS and from WT and PIDOE lines were commercially sequenced using the IlluminaTM platform. Prior to library preparation the RNA quality and integrity was assessed per IlluminaTM guidelines. Library preparation was done using the TruSeq® Stranded mRNA sample preparation 96-reaction kit (IlluminaTM) following the low sample protocol according to manufacturer’s recommendations. In brief, approximately 2.5 μg of total RNA was diluted and purified using RNA purification beads targeting the poly-A tail of the mRNA and this was subsequently fragmented by means of the enzymes provided in the kit. After the cDNA synthesis adenylation of 3′ ends and ligation of the adaptors were performed. Adaptors were ligated in 12-plex formations, allowing the pooling of 12 samples. Subsequently, the library was quantified using PicoGreen® dye (Life TechnologiesTM) as described in the manufacturer’s protocol. To accurately quantify the concentration in nM of the sample, the Kapa SYBR® FAST universal qPCR kit (Kapa BiosystemsTM) for IlluminaTM sequencing was used to quantify the number of the amplifiable molecules in the library and the Bioanalyzer® machine (Agilent TechnologiesTM) to determine the average fragment size. These measurements allowed optimizing the flow cell clustering prior to the Run. The library was 50 bp pair-end sequenced in one lane of an IlluminaTM HiSeq1500 sequencer.
Data Analysis
Resulting sequence data was preliminary analyzed by CLC Genomics Workbench v.6 using Arabidopsis thaliana (Col-0 TAIR10) sequence database2 as reference genome. The RNA-Seq analysis was carried out for sequence reads obtained from the three genotypes. Throughout the analysis with CLC default settings were used. Briefly, after the trimming of the sequences they were mapped against the reference genome with the default settings. The expression values were calculated based on “reads per kilo base of exon model per million mapped reads” (RPKM) values (Mortazavi et al., 2008). The RNA-seq data was grouped accordingly and two group comparisons (unpaired) were performed. The expression values were normalized by scaling to the default setting of 10 million reads, and the proportions were compared using Baggerley’s test (Baggerly et al., 2003). All significantly induced or repressed genes with known functions were classified into groups based on gene ontology (GO) information obtained from the TAIR Database2 by using MapMan (Thimm et al., 2004) and overrepresented functions and gene enrichment studies were carried out by PageMan (Usadel et al., 2006) and Cytoscape (using the BiNGO plugin) software.
Statistics
All the measurements were analyzed by t-test (P < 0.05) using the R statistical package3. Conditions of normality of distribution and homogeneity of variance were checked and met.
Accession Number
The Arabidopsis Genome Initiative locus identifier for the PID gene is AT2G34650.
Results
Spatiotemporal Expression Pattern of PID
To better understand the role of PID-directed auxin transport in leaf development, we first studied PID-expression during the development of the Arabidopsis leaf. pPID::GUS lines showed high levels of PID expression in the shoot apical meristem and in the newly formed primordia. Later during leaf development, expression became restricted to the vasculature of expanding leaves (Figure 1A). The spatial and temporal activity of the PID promoter pointed toward a stage-specific role in leaf development.
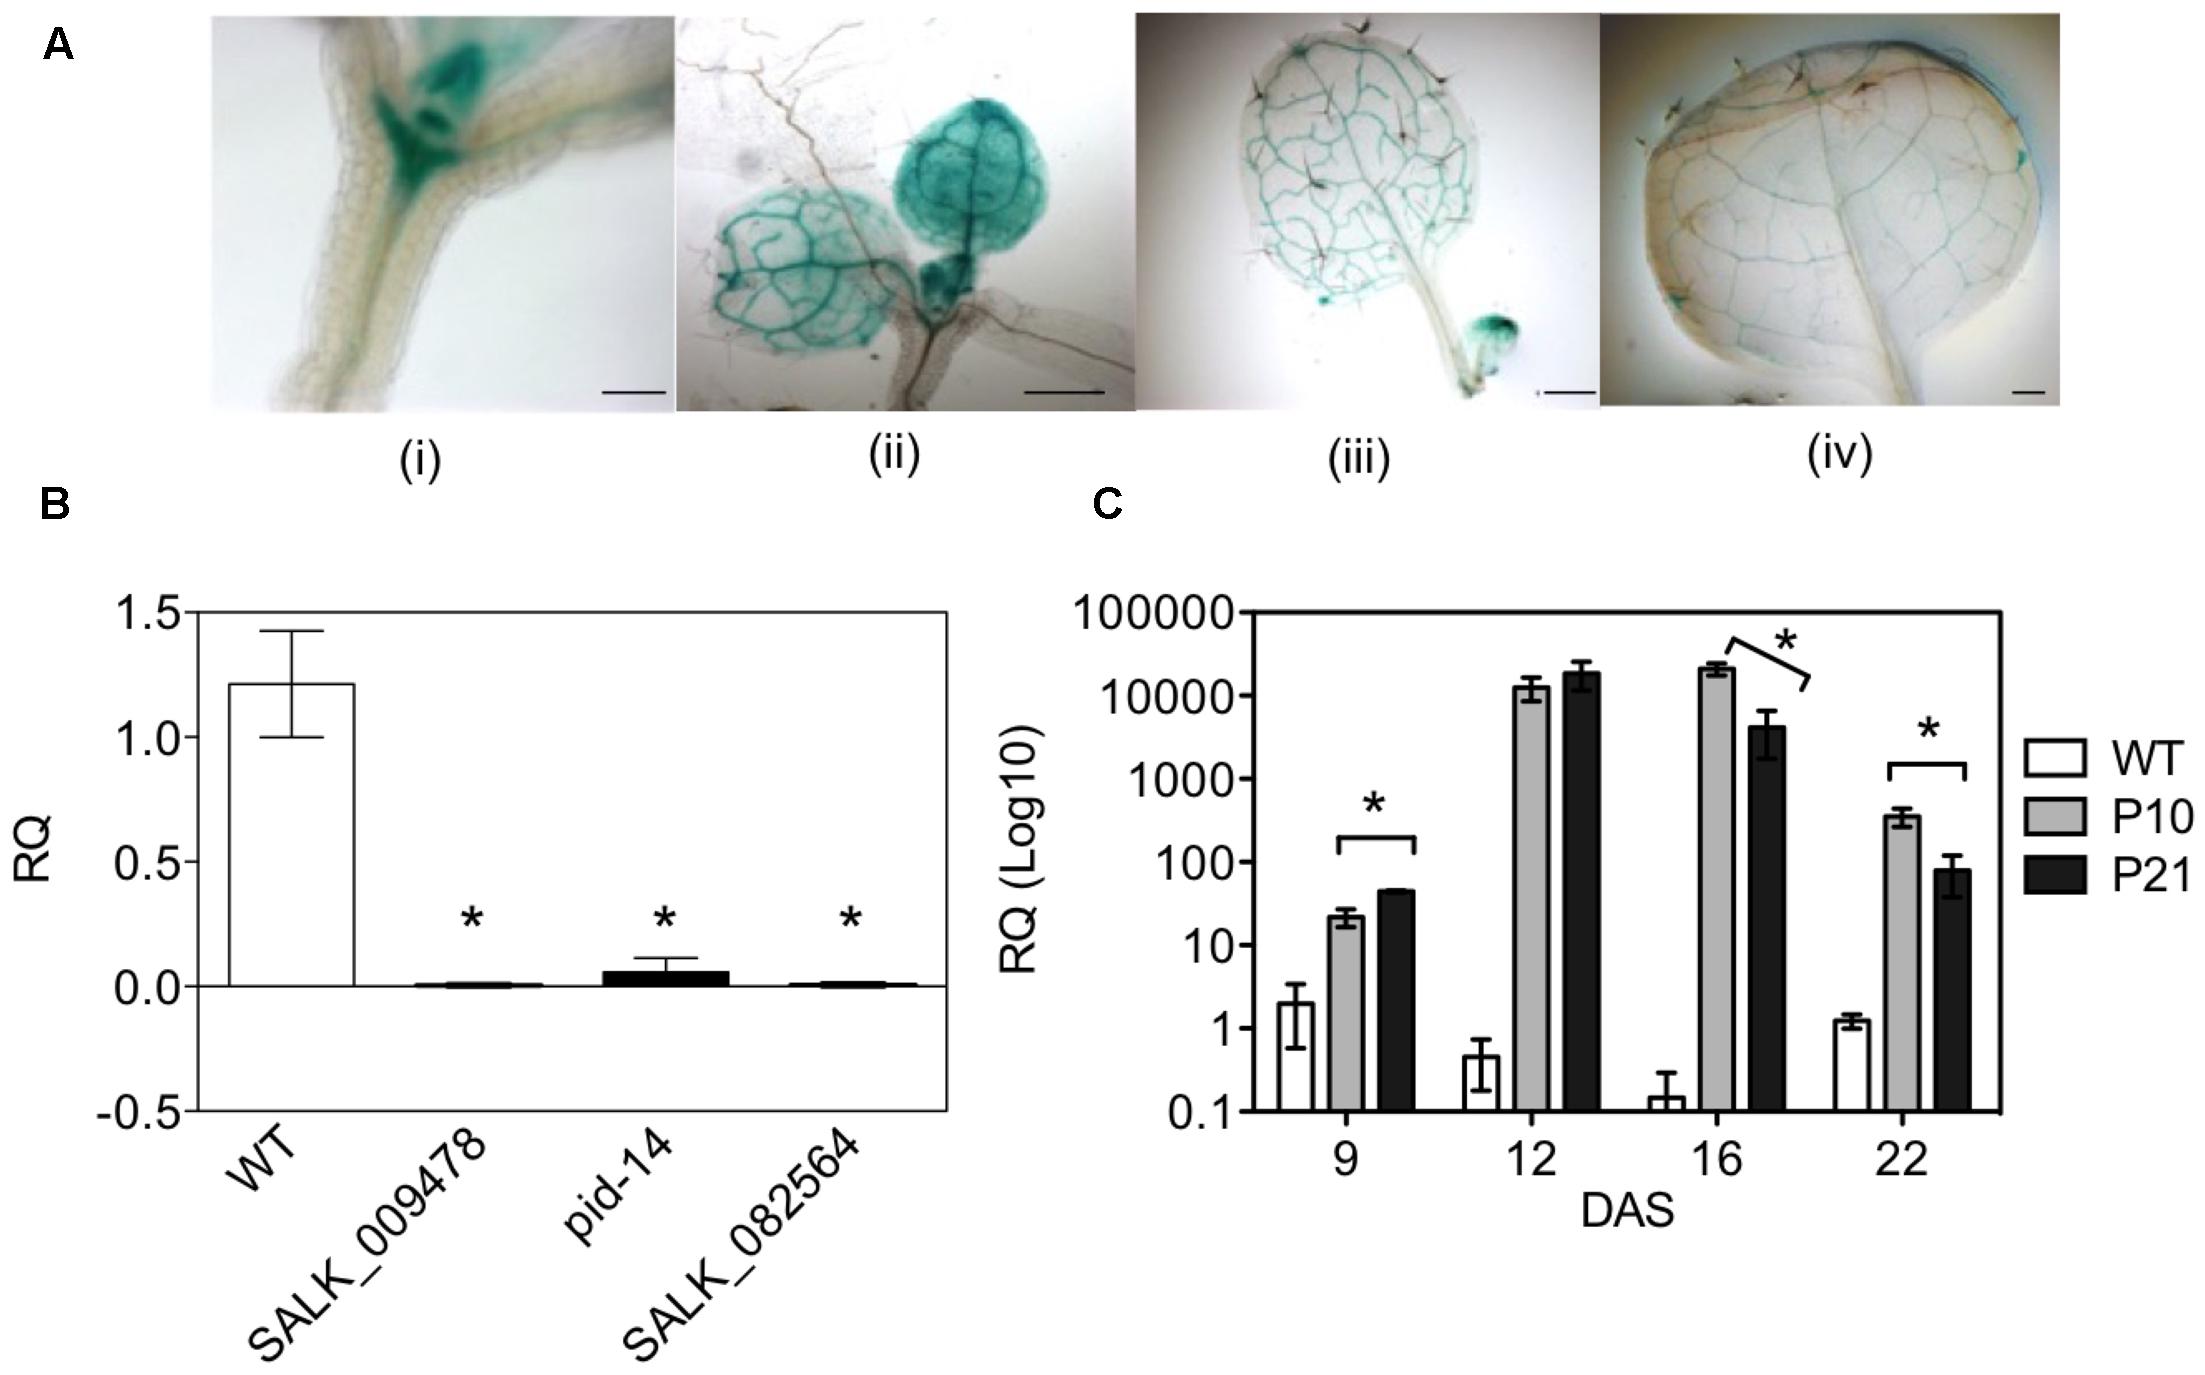
FIGURE 1. Spatio-temporal expression of PID in Arabidopsis plants. pPID::GUS line with expression in shoot apical meristem and the proliferating leaves at 9 DAS (i, ii); and at 14 and 17 DAS in the expanding leaves (iii, iv) (A). Expression profiling of T-DNA insertion mutants and overexpression lines of PID. SyBr green qPCR assay using the seedlings of pid mutants at 7 DAS (B) and leaves of PID overexpression lines at different time points (C). Asterisks mark the difference between WT and mutants (B). Data are averages ± SE (t-test, P < 0.05); n = 3; Scale bar 100 μm (i) and 500 μm (iii, ii, iv).
Characterization of PID Mutants
Semi-quantitative RT-PCR at 9 DAS (days after stratification) on the leaves of wild type (WT) and two PID overexpression (PIDOE) lines, P10 and P21, showed a clear increase in PID expression in both lines (Supplementary Figure 1). qPCR analysis on single pid mutants (pid-14, SALK_082564, SALK_009478) detected a decreased to nearly absent PID expression in the seedlings at 7 DAS (Figure 1B). A time series of qPCR analyses confirmed the overexpression in both PIDOE lines and revealed that in early growth stages (9 and 12 DAS) overexpression was highest in P21. Interestingly, in expanding and mature tissues (16 and 22 DAS) PID transcript level was highest in P10 (Figure 1C).
IAA Measurements
Since PID is an auxin transport regulator we measured IAA (indole-3-acetic acid) concentrations throughout the development of the first pair of leaves from 9 to 25 DAS in PIDOE lines and at two time points in pid knockout lines (due to comparatively weaker phenotypes; see later). pid knockouts had no significant difference in free or conjugated IAA levels in the leaves compared to the WT at 16 DAS, while both knockouts (pid-14 and SALK_009478) showed elevated free IAA levels at 22 DAS. However, the total IAA pool (free IAA + conjugates) remained unchanged compared to the WT (Figures 2A,B). PID overexpression, on the other hand, led to increased free IAA and IAA-conjugate levels in the leaves. Over time, free IAA levels dropped in the WT, whereas this was not obvious in both PIDOE lines (Figure 2C). After D16, the free IAA levels also started to drop in the PID lines, in P21 almost to WT levels, whereas they remained significantly higher in P10. In the early days, P21 had comparatively higher IAA-conjugate levels and interestingly, later on, it was intermediate to P10 and WT (Figure 2D).
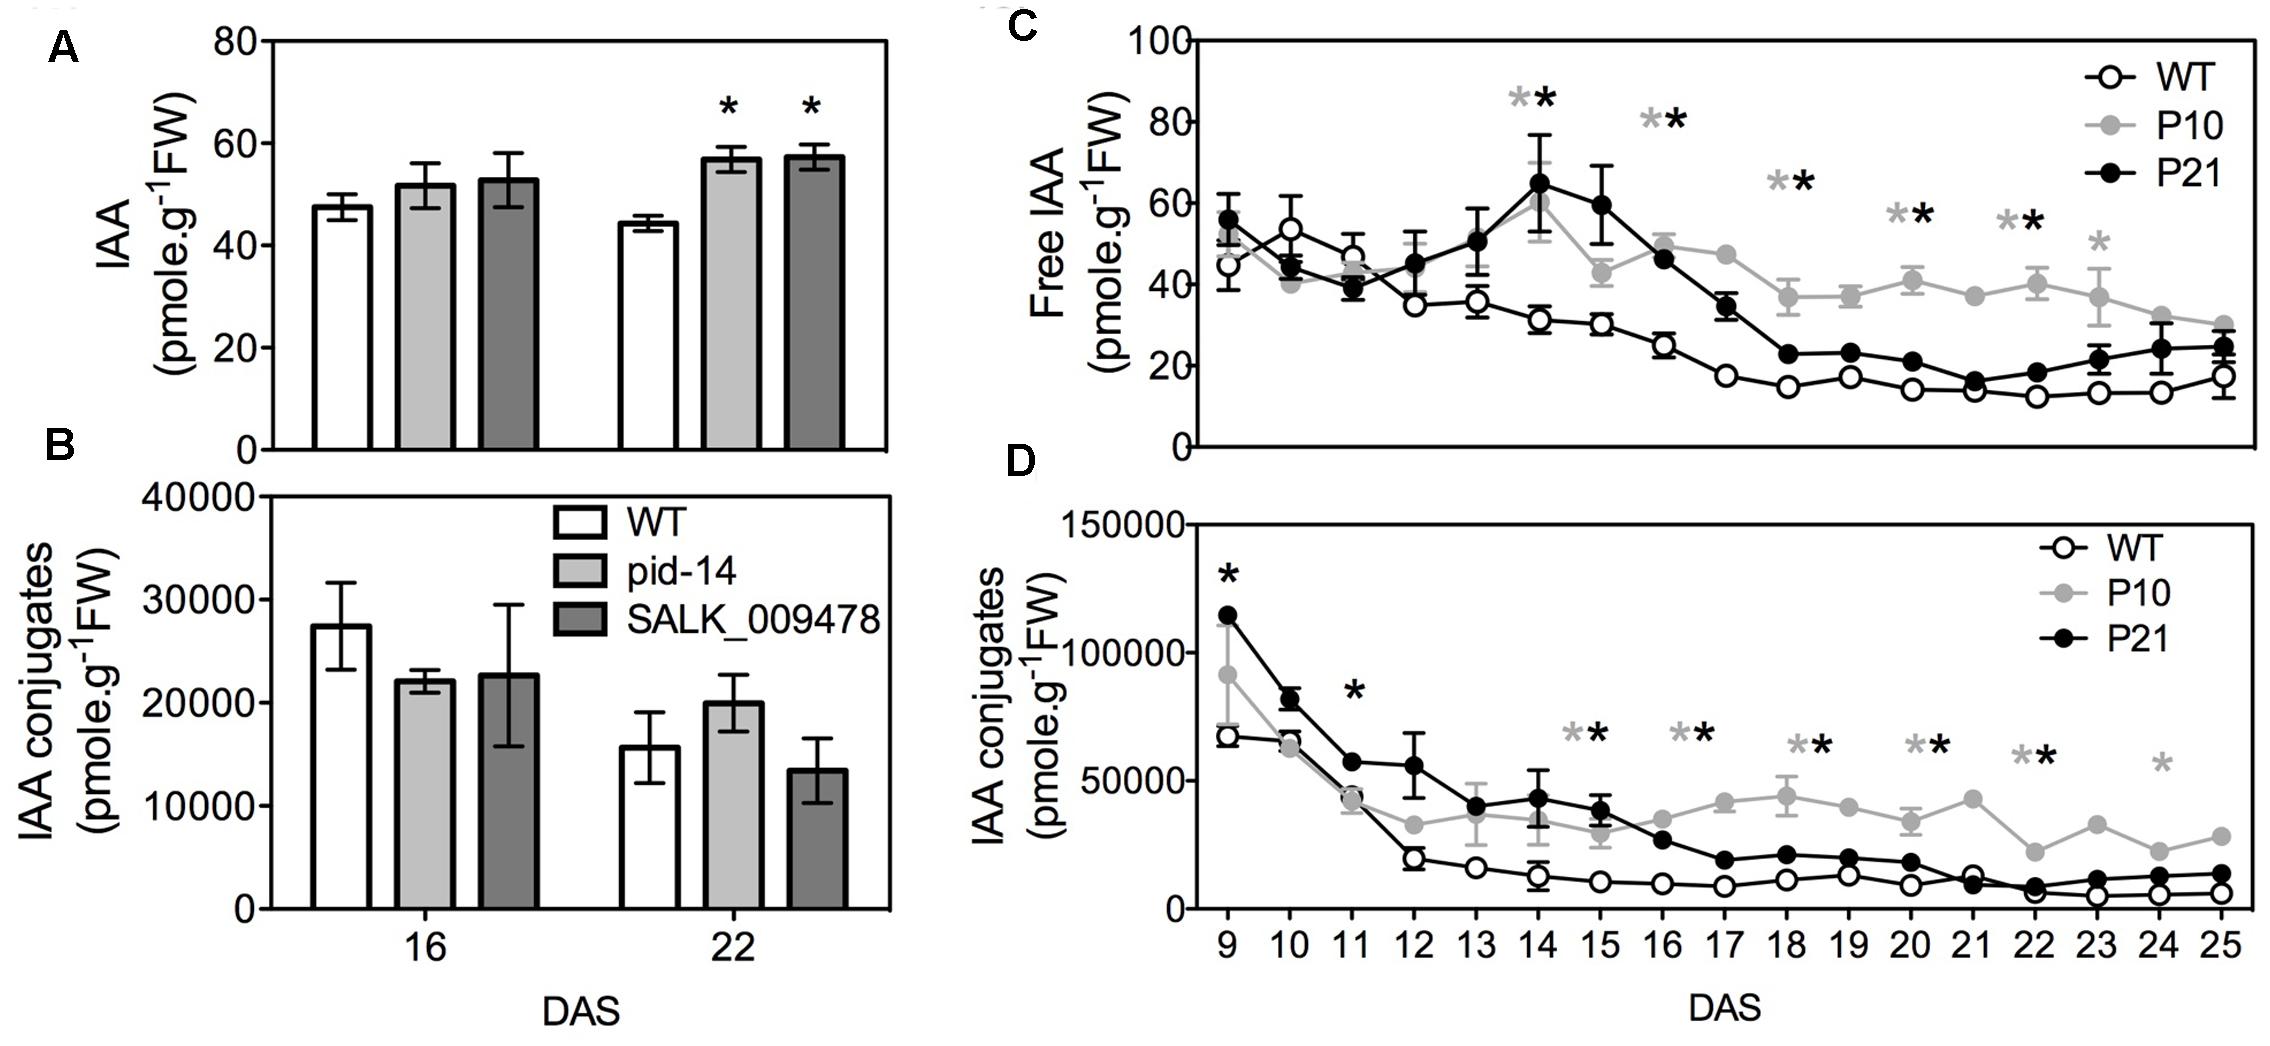
FIGURE 2. Indole-3-acetic acid (IAA) measurements. Analysis of free (A) and conjugated IAA (B) in wild type and pid mutants. Analysis of free (C) and conjugated IAA (D) in PIDOE, P10 and P21 from proliferating, expanding and mature first pair of leaves. Error bars represent averages ± SE (t-test, P < 0.05). Asterisks mark significant differences between different lines and the wild type (gray: WT vs. P10, black: WT vs. P21 in C,D).
Auxin Response and Transport in the Leaves of WT and PID Overexpression Lines
Since PID overexpression has a positive effect on auxin levels, this could consequently alter auxin signaling across the leaf. To investigate the effects of PIDOE on auxin signaling we compared the DR5::GUS and DR5rev::GFP sensors in the wild type and PID overexpression backgrounds. Analysis of the leaves clearly showed that PIDOE resulted in a more pronounced accumulation of GUS and GFP signal in the top of the leaf blade and around the leaf margins, compared to WT plants (Figures 3A,C,E,G,I,K). In addition, the signal was clearly visible in the root apex of the WT, but was lower to nearly absent in the collapsed roots of both P10 and P21 lines (Figures 3B,D,F,H,J,L). Quantification of signal intensity from the leaves of DR5rev::GFP lines proved the increased GFP signal in the PID overexpression background (Figures 3M,N).
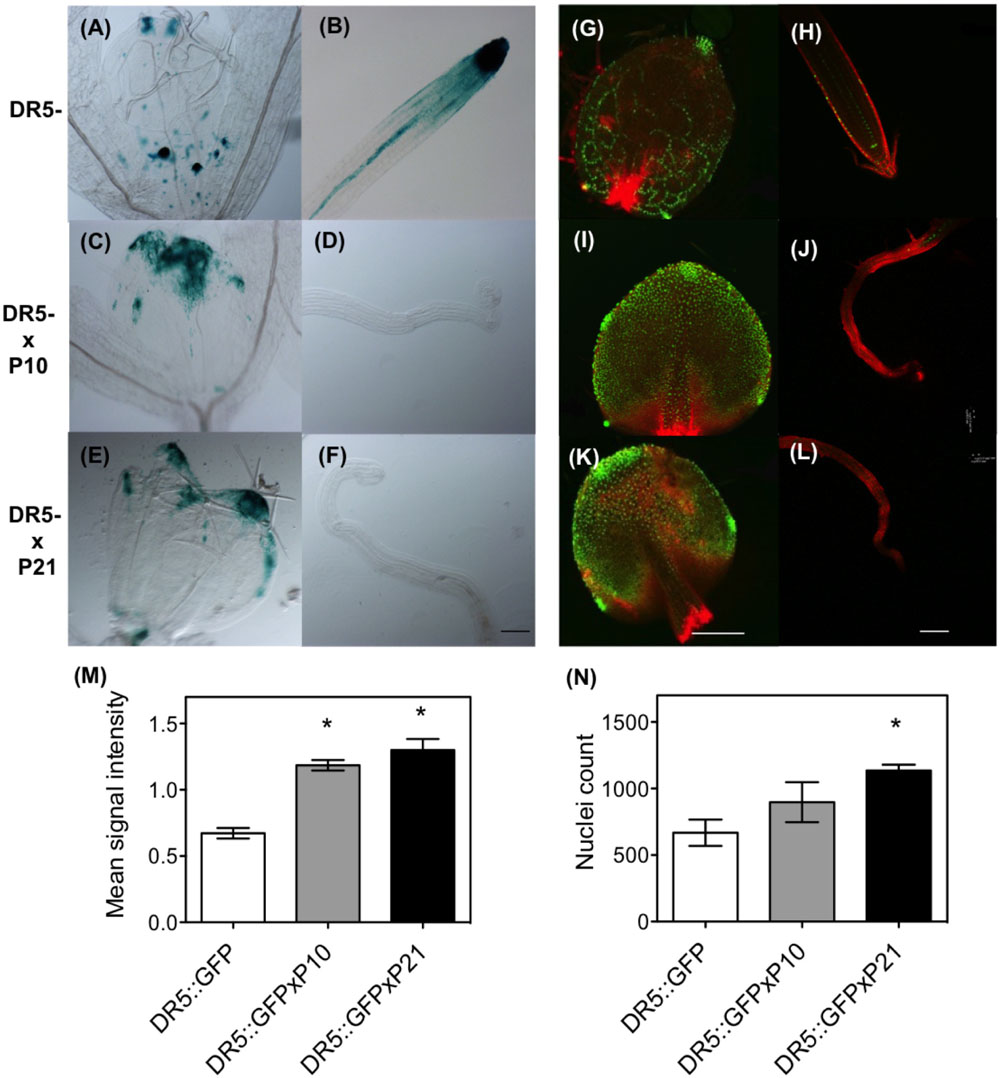
FIGURE 3. Effect of PID overexpression on auxin signaling in Arabidopsis. GUS assay with DR5::GUS (A,B); DR5::GUS in PIDOE P10 (C,D) and P21 background (E,F) at 9 DAS in the leaves and roots. Confocal images with DR5rev::GFP signal in control (G,H) and DR5rev::GFP × PIDOE P10 (I,J) and DR5rev::GFP × PIDOE P21 (K,L). Measurements of intensity of GFP signal (M) and count of nuclei expressing GFP using the leaves from various mutant lines (N). Asterisks indicate significant differences between the transgenic lines and the wild type. Error bars represent ± SE (t-test, P < 0.05). Scale bar 100 μm for GUS assay and 50 μm for confocal images.
Pleiotropic Growth Defects of PID Overexpression Lines and PID Mutants
Rosettes and leaves of knockouts showed distinct morphological changes (Figures 4A–C) including a slightly bigger rosette area (15% in SALK_009478; Figure 4A and Supplementary Figure 2A) and the presence of one or two additional leaves compared to wild type as previously reported by Bennett (1995) in the allelic pid mutant lines (Figure 4B). The blade areas of the first pair of leaves of the knockout mutants were similar to the WT (Figure 4C). Cellular image analysis showed no significant differences between WT and the knockouts in terms of cell number per leaf and average cell area (Figures 4D,E). pid-14, SALK_082564 and SALK_009478 occasionally showed three cotyledons (Supplementary Figure 2B). In the mutants with three cotyledons, the first leaf pair developed alternate to cotyledons instead of opposite as in the normal phyllotaxy (Supplementary Figure 2C). Homozygous lines of pid-14 (Bennett, 1995; Haga et al., 2014) and SALK_082564 were sterile and had a pin-like inflorescence (Supplementary Figures 2D,E). However, as leaf growth was not drastically affected in these knockout lines, they were not included in the subsequent detailed leaf development studies.
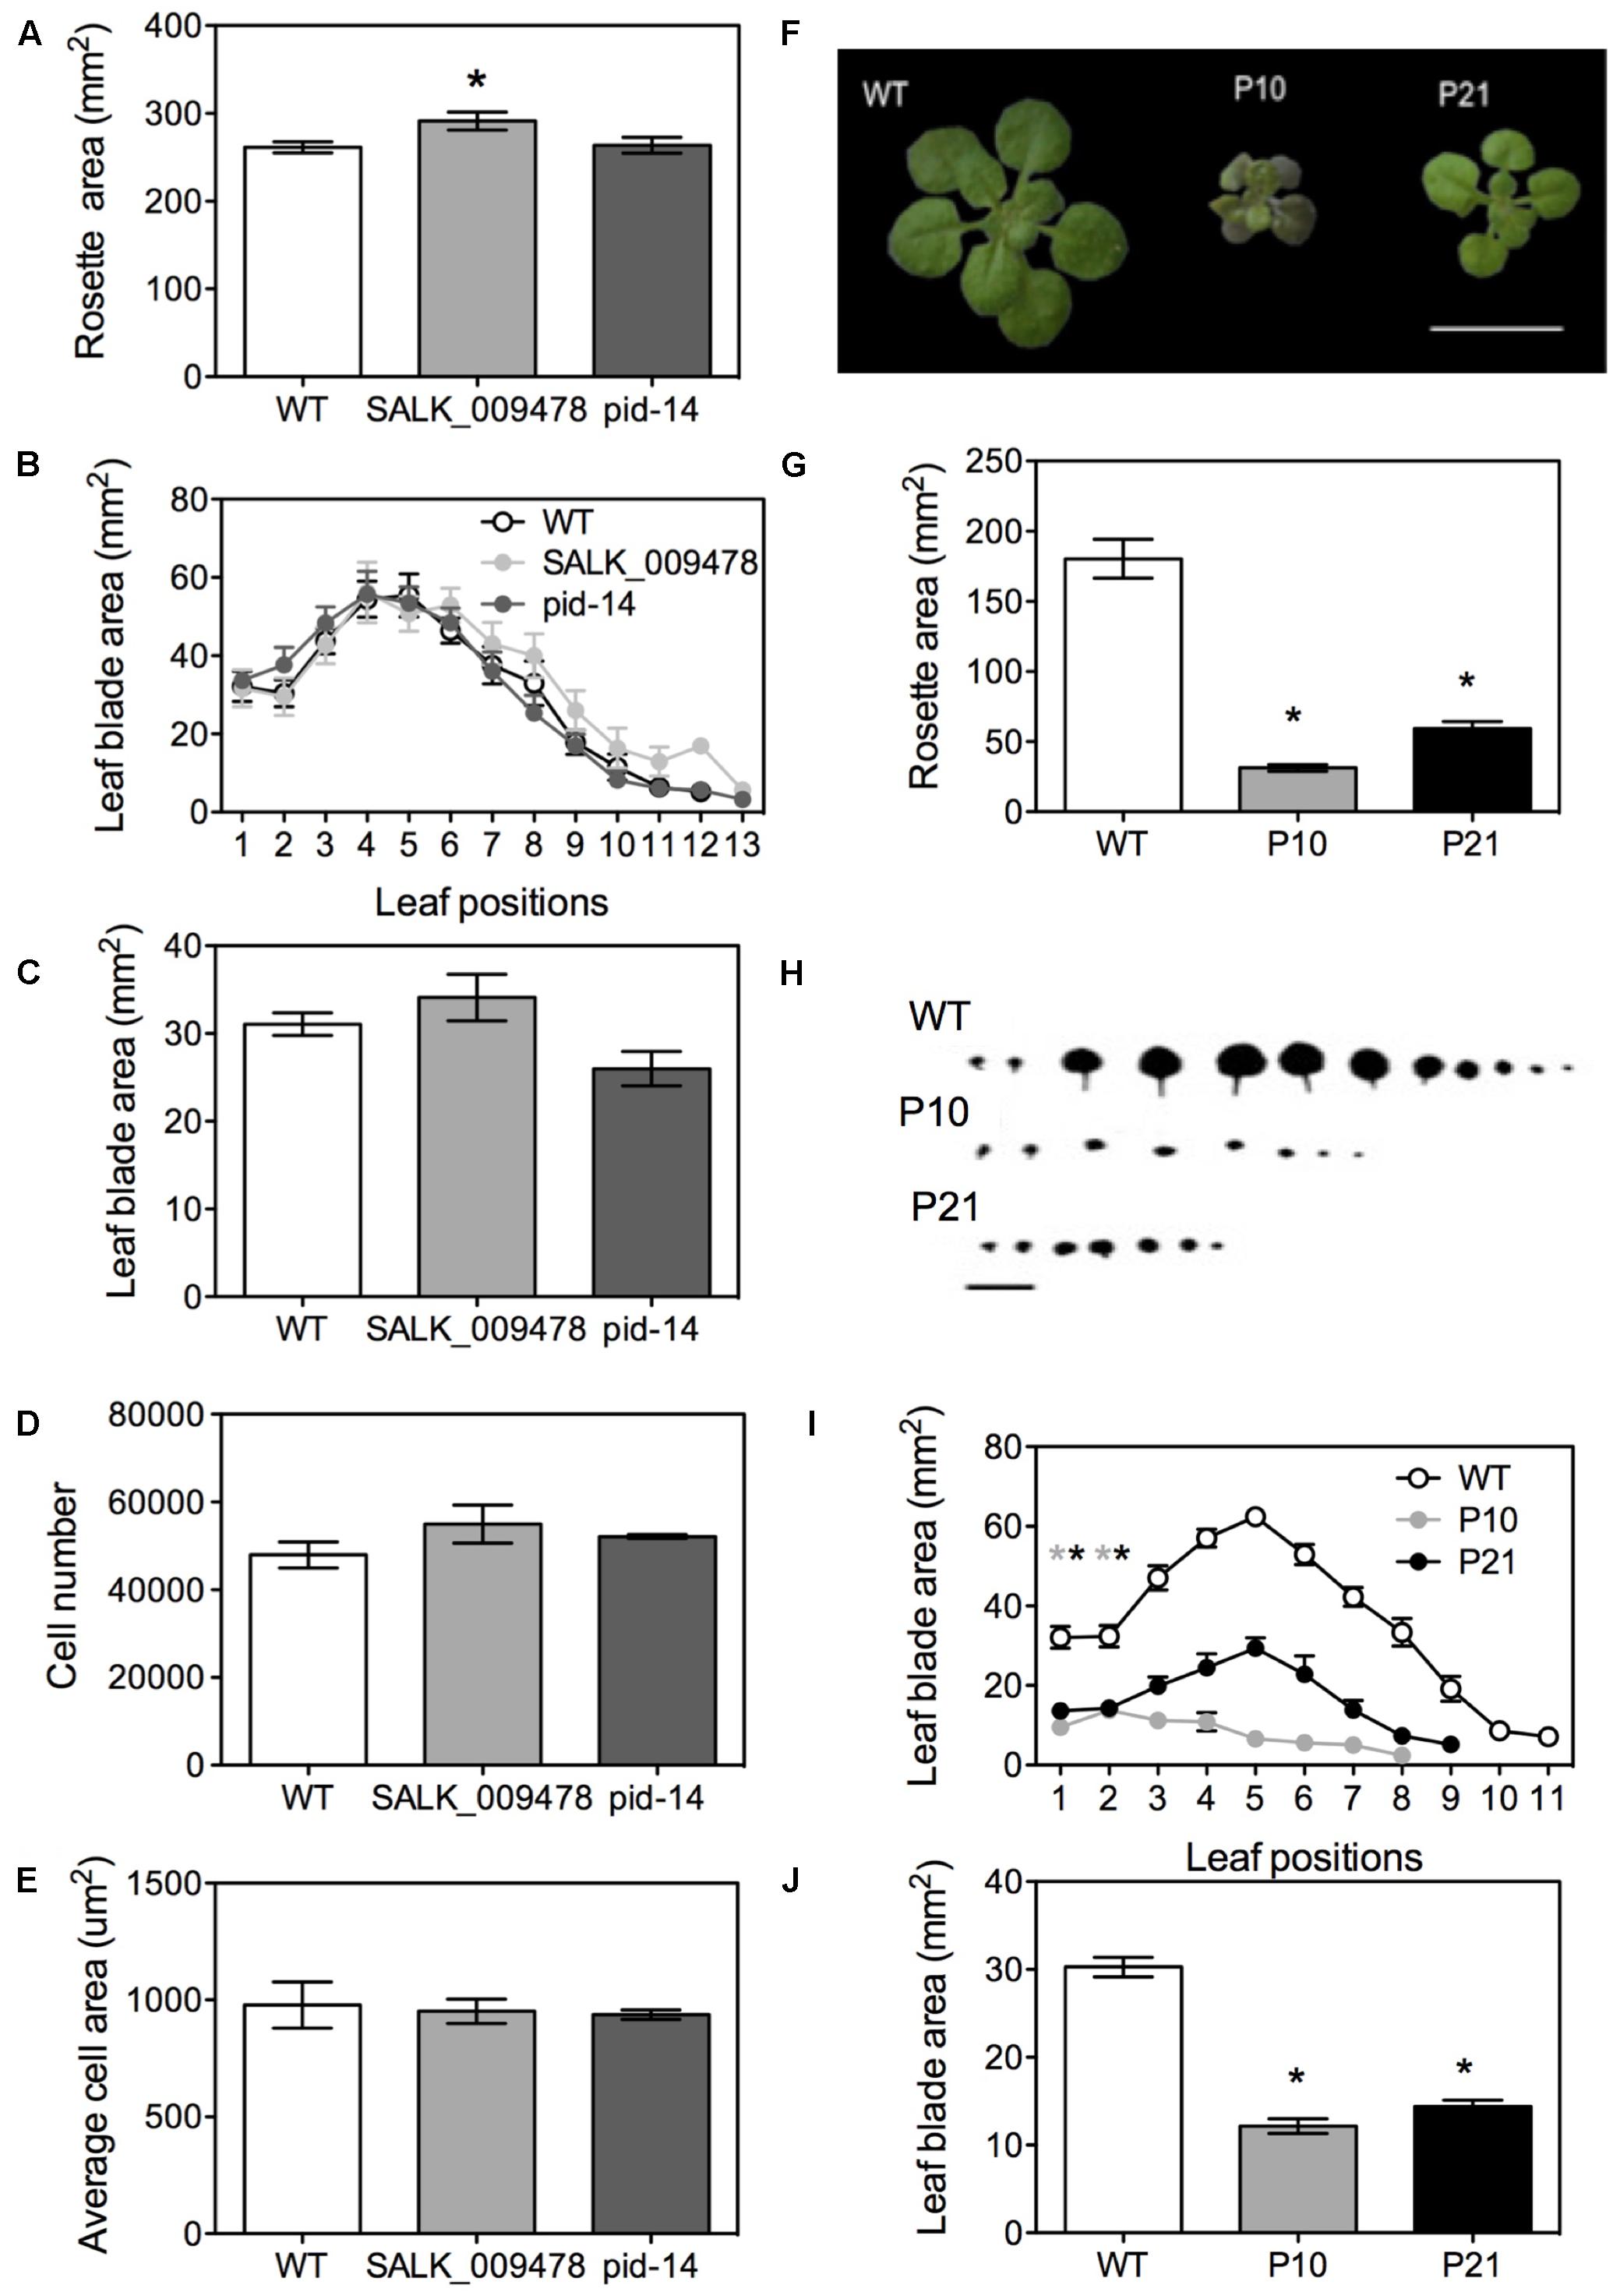
FIGURE 4. Phenotypes of PID overexpression lines and pid mutants in Arabidopsis. Rosette area of pid knockouts at 22 DAS (A). Leaf series at 25 DAS (B). Leaf blade area in pid knockouts (C). Cell number (D) and average cell area (E) in first pair of leaves in pid knockouts. Figure showing mature rosettes at 22 DAS in WT and PID overexpression lines (F). Rosette area measurements at 22 DAS (G). Leaf series (H) and leaf series measurements at 25 DAS starting from oldest (first L1, L2) to youngest leaves (L9-L11; I). Leaf area measurements for the first leaf pair (J). Asterisks indicate significant differences with the wild type. Error bars represent ± SE (t-test, P < 0.05). Scale bar = 10 mm.
In contrast, both PIDOE lines, P10 and P21, had significantly smaller rosettes (82 and 67%, respectively) than the WT at 22 DAS, (Figures 4F,G). Leaf series of the three lines also indicated that fewer leaves were formed on the individual rosettes, 10 ± 2 in WT and 6 ± 1 in PIDOE lines (Figures 4H,I). In addition, using leaves 1 and 2, which are indistinguishable in their morphology and have synchronized growth, we showed that P10 and P21 had 60 and 52% smaller mature leaf blade areas than the WT (Figure 4J). Petioles were small in PIDOE lines, mainly due to fewer cells and not to their sizes (Supplementary Figures 3A–C). Transverse sections of leaves in the expansion phase revealed that increased PID levels not only affected leaf growth in the horizontal plane of the blade, but also in the dorsoventral direction. Transverse sections showed a clear increase in thickness of the leaf in P10 and a slighter increase in P21, compared to the WT (Supplementary Figures 3D–F). While the number of layers remained unchanged, spongy palisade cells were clearly enlarged in the dorsoventral direction (Supplementary Figures 3G,H). Consistent with earlier observations (Kleine-Vehn et al., 2009) both overexpression lines showed a thick vasculature system (Supplementary Figures 3I–L).
Kinematic Growth Analysis
To understand the cellular basis of the leaf phenotype due to the altered auxin levels, we performed a kinematic analysis of the first leaf pair. From 6 to 28 DAS, we measured rosette area of WT and the two PIDOE lines from approximately 100 seedlings (performed in duplicates). P10 had a 20% larger rosette than WT in the early growth phases (Figure 5A), most likely due to its bigger seed size (Supplementary Figure 4). At 28 DAS, however, P10 (60.0 ± 5.5 mm2) and P21 (110.1 ± 6.5 mm2) rosettes were smaller than those of the WT (406.8 ± 25.7 mm2). From the same seedlings that were used for the rosette measurements, six average sized leaves were harvested daily for measurement of leaf blade area (Figure 5B) and calculation of leaf expansion rate (Figure 5E). At 28 DAS, there was a 55 and 52% reduction in the size of mature leaves in P10 and P21 compared to the WT, respectively. Differences in leaf expansion rates were most prominent between 10 and 15 DAS, where the WT exhibits higher expansion rates than both PIDOE lines, resulting in the larger leaf area (cf. Figures 5B,E).
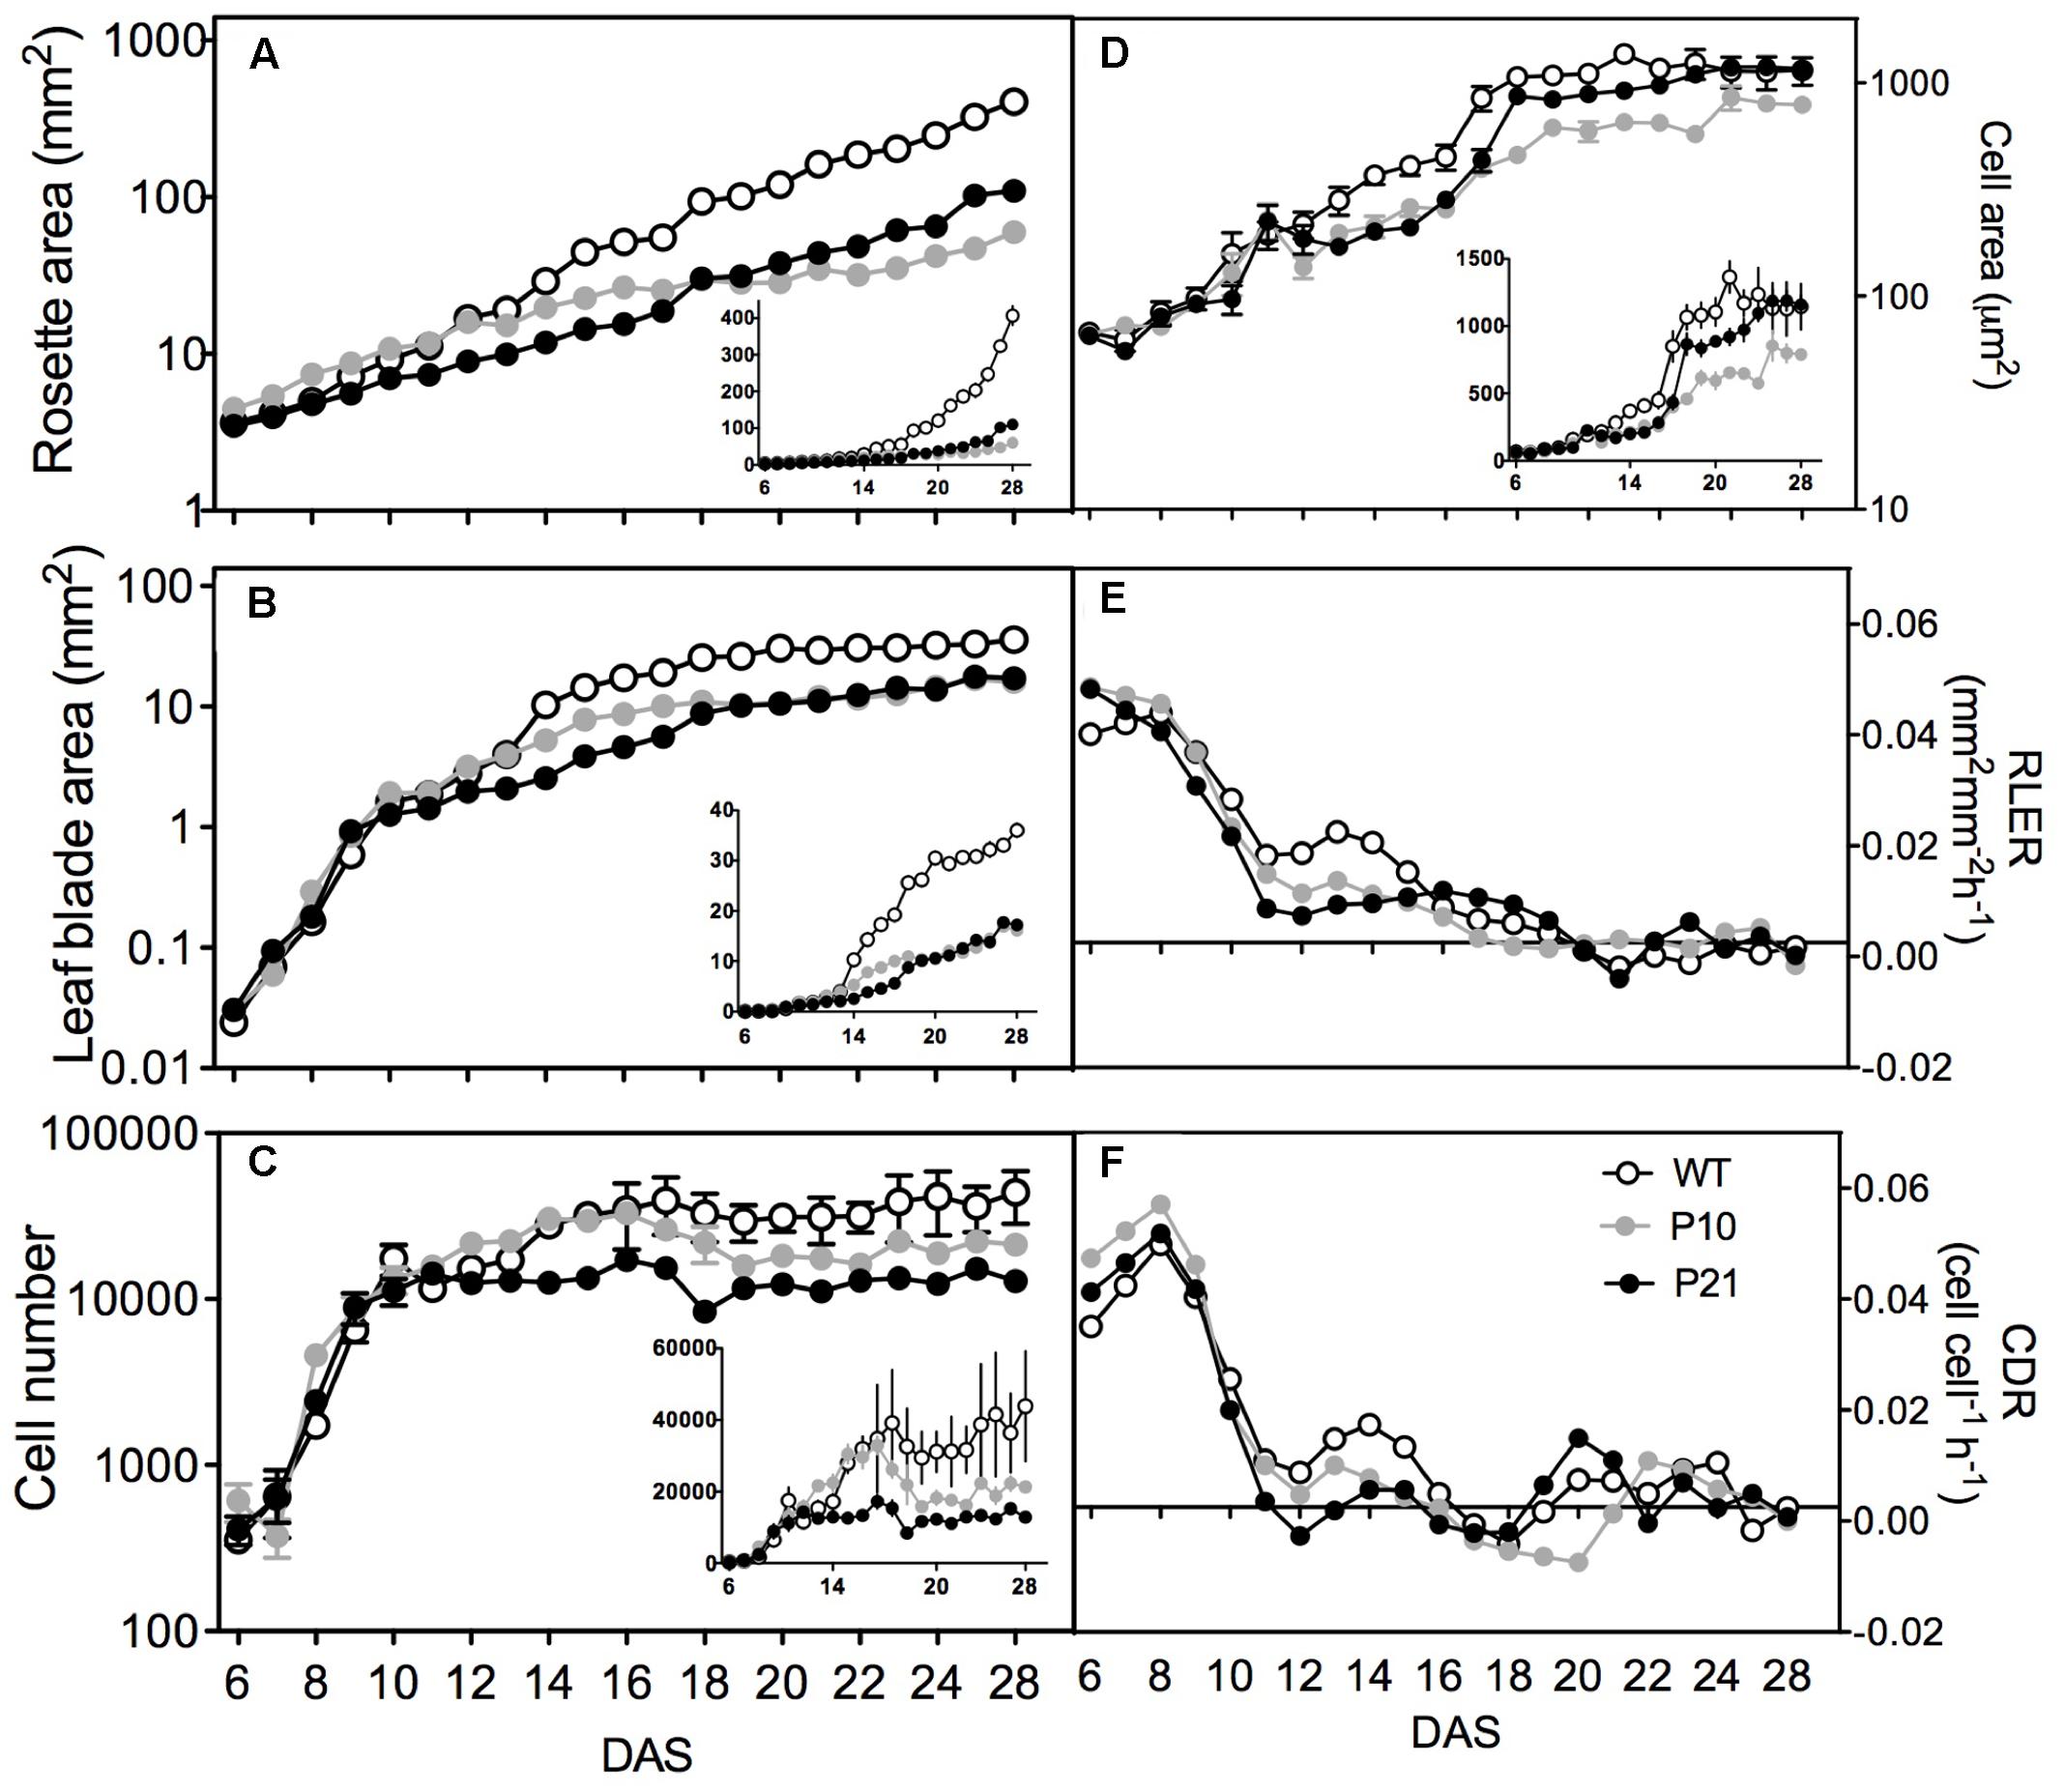
FIGURE 5. Kinematic growth analysis of the first leaf pair of Arabidopsis wild type and PID overexpression lines. Rosette area, n = 40–50 (A). Leaf blade area, n = 24–26 (B). Average cell number in a leaf, n = 6 (C). Average cell area, n = 6 (D). Relative leaf expansion rate (E). Cell division rates (F). Insets show the same on a linear scale. Error bars represent averages ± SE of two replicate experiments.
The detailed cellular analysis showed that during the early stages of leaf development, cell proliferation was fairly similar in the three lines. The differences lay in the duration of cell formation, as P21 stopped to proliferate from 10 DAS onward (Figure 5C), cell formation in P10 was arrested around 12 DAS, whereas the WT still produced new cells until 15 DAS, resulting in more pavement cells in mature WT leaves compared to the two PIDOE lines. This difference was also reflected in the cell division rate where between 10 and 17 DAS the WT still exhibited a significant division rate, whereas the rates in the PIDOE lines were close to zero in this period (Figure 5F). Surprisingly we observed an overall reduction in the stomatal index, i.e., the ratio of guard cells and the total number of epidermal cells, in the PIDOE lines, suggesting an affected meristemoid cell division process (Supplementary Figure 5). From 12 DAS on, cell size of PIDOE lines lagged behind those of the wild type. The difference in cell area between WT and P10 extended to the mature phase. The pavement cell area of P21 leaves, however, catched up from 16 to 17 DAS onward (Figure 5D).
In addition, the convexity of epidermal pavement cells differed between the WT and the two PIDOE lines between 12 and 22 DAS (Figure 6A). As defined by Hectors et al. (2010) convexity is the cell area in relation to the area of its convex hull. More complex cell shapes have lower convexity values and it approaches 1 for spherical cells. We used CellP software for calculating cell convexity for the jigsaw-shaped adaxial pavement cells. Epidermal cells in PIDOE leaves were less complex, but this could be associated with a smaller average size rather than the effect of PID overexpression on cell shape differentiation. Indeed, the relationship between cell area and convexity appears to be unaffected in both PIDOE lines (Figure 6B).
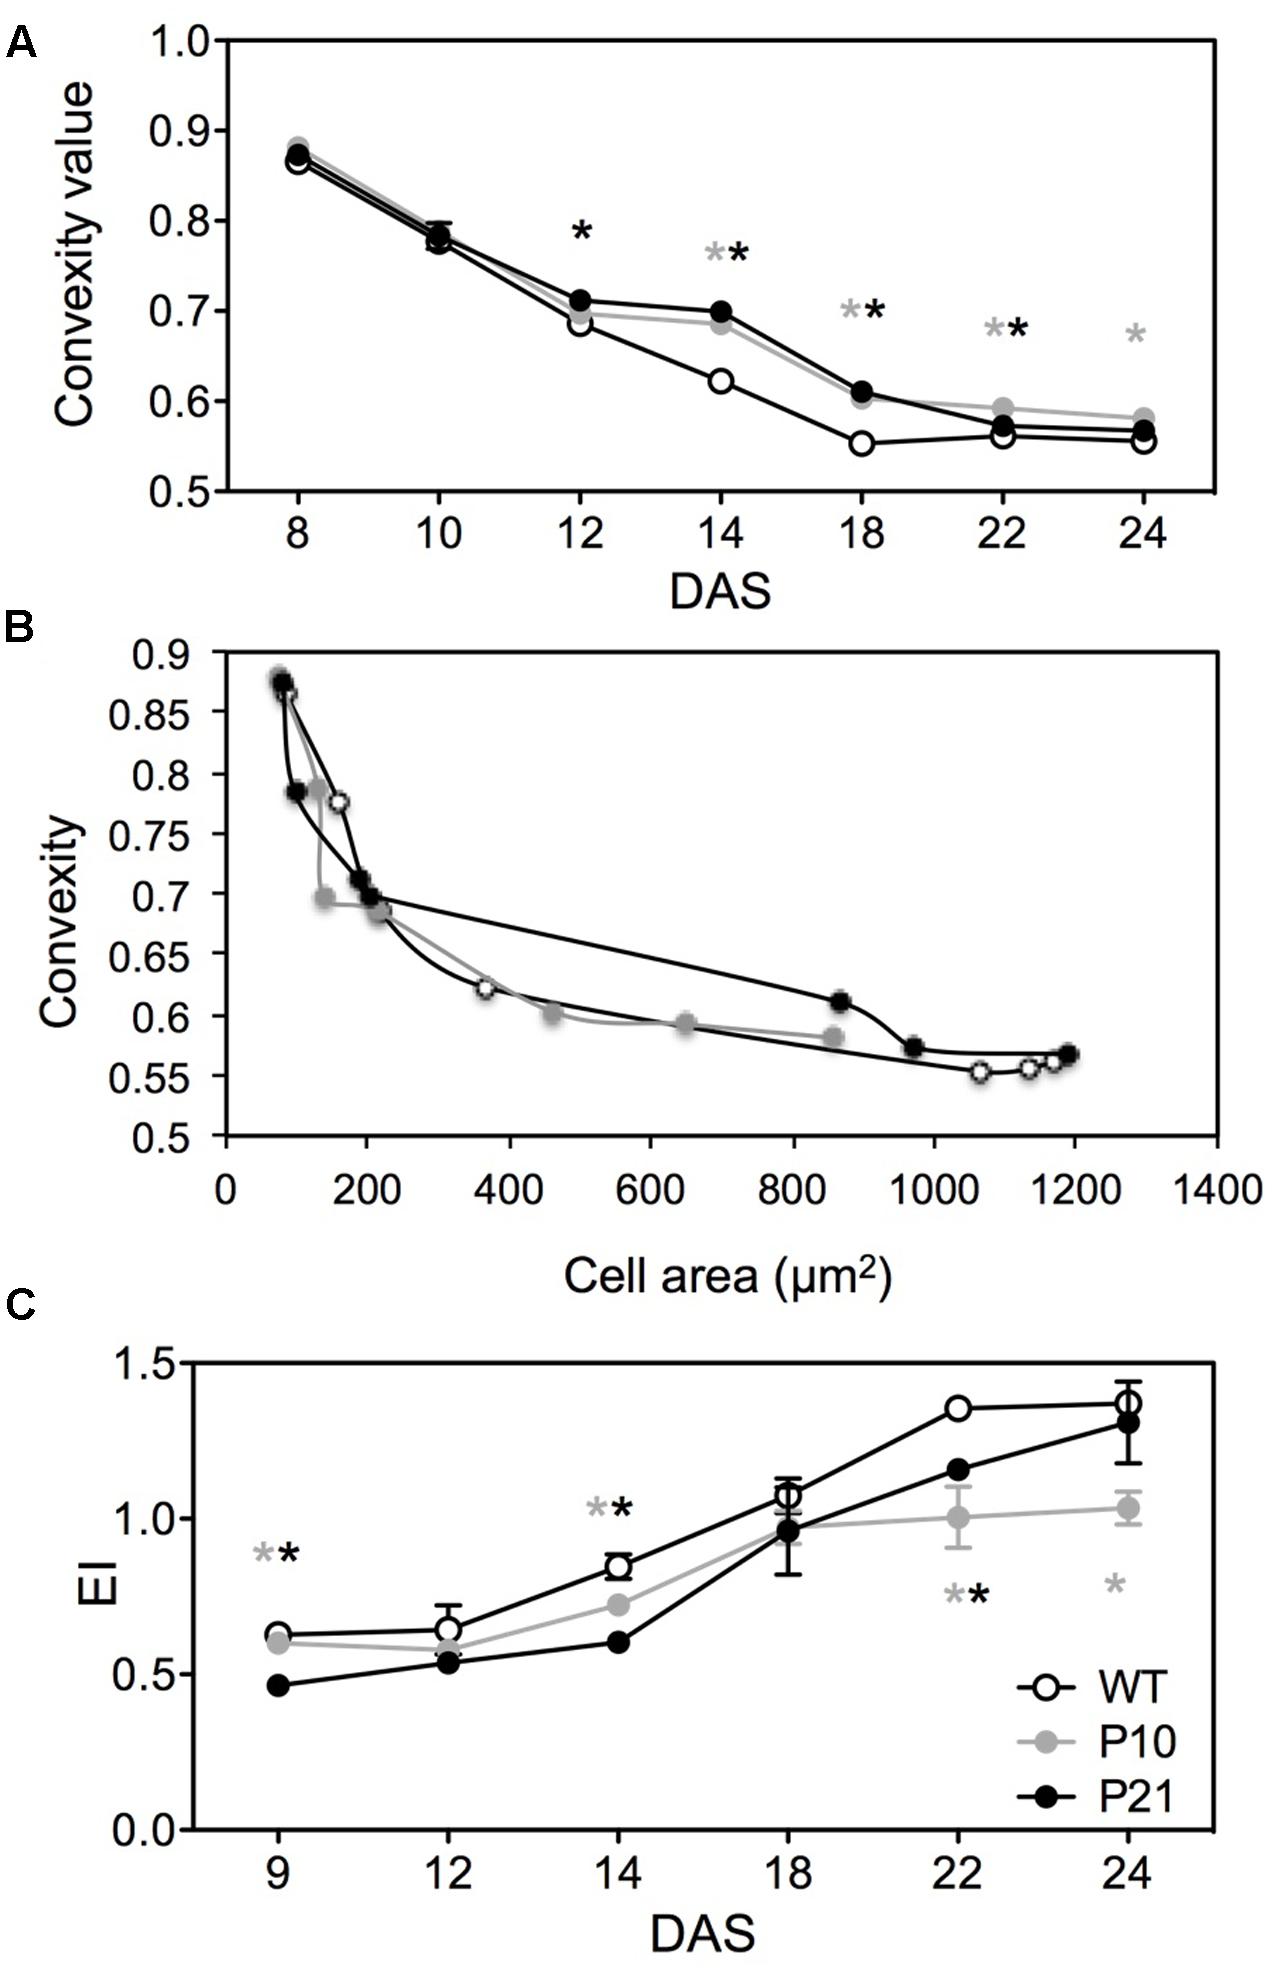
FIGURE 6. Cell shape and endoreduplication in wild type and PID overexpression lines. Comparison of pavement cell convexity in the abaxial epidermal layer at different time points between WT, P10 and P21 (A). Convexity and cell area correlation between different genotypes over time (B). Comparison of ploidy status (EI = 0∗2C+1∗4C+2∗8C+3∗16C) of various lines by means of number of endocycles undergone by nuclei (C). Error bar ± SE (t-test, P < 0.05). Gray and black asterisks represent significant difference of P10 and P21 compared to the WT, respectively.
Endoreduplication Index
In Arabidopsis, the size of pavement cells shows a positive correlation with DNA-ploidy levels, determined by the number of endocycles (successive rounds of DNA replication in the absence of mitosis) they have undergone (Melaragno et al., 1993). Therefore, we measured ploidy levels and the number of endoreduplication cycles using flow cytometry at different time points during development. Consistently, the endoreduplication index was reduced in PIDOE lines compared to WT throughout development (Figure 6C). In contrast, in P21, ploidy levels were initially lowest, but increased to wild type levels from the expanding stage onward, paralleling the development of cell size (Figure 5D) and reflecting the PID expression and IAA levels in P21 at that stage (Figures 1C, 2C,D).
Transcriptome Analysis by RNA Sequencing
To understand the transcriptional changes induced by increased auxin levels that led to reduced cell division and expansion, we performed RNA sequencing on proliferating (9 DAS) and expanding (16 DAS) leaves of PIDOE and WT (Supplementary Data 1). Collectively, 3805 genes were differentially expressed at least in one condition using FDR-corrected p-value < 0.05 and log2 fold change > 0.75, between PIDOE and WT (Supplementary Data 2). There was only little overlap in number of genes differentially expressed between P10 and P21 (Figure 7A). Clustering of differentially expressed genes was done by QT-Clust analysis (Pearson correlation; cluster diameter-0.8, minimum cluster size-15). Clusters 1, 2, 4, 5, and 6 show that the effect of P21 was strongest in proliferating tissues (at 9 DAS) and Clusters 1 and 2 reflect the prominent effect of P10 in the expanding tissues (at 16 DAS) (Figure 7B). These patterns therefore closely correlate with PID expression (Figure 1C) and IAA accumulation (Figures 2C,D) at these stages.
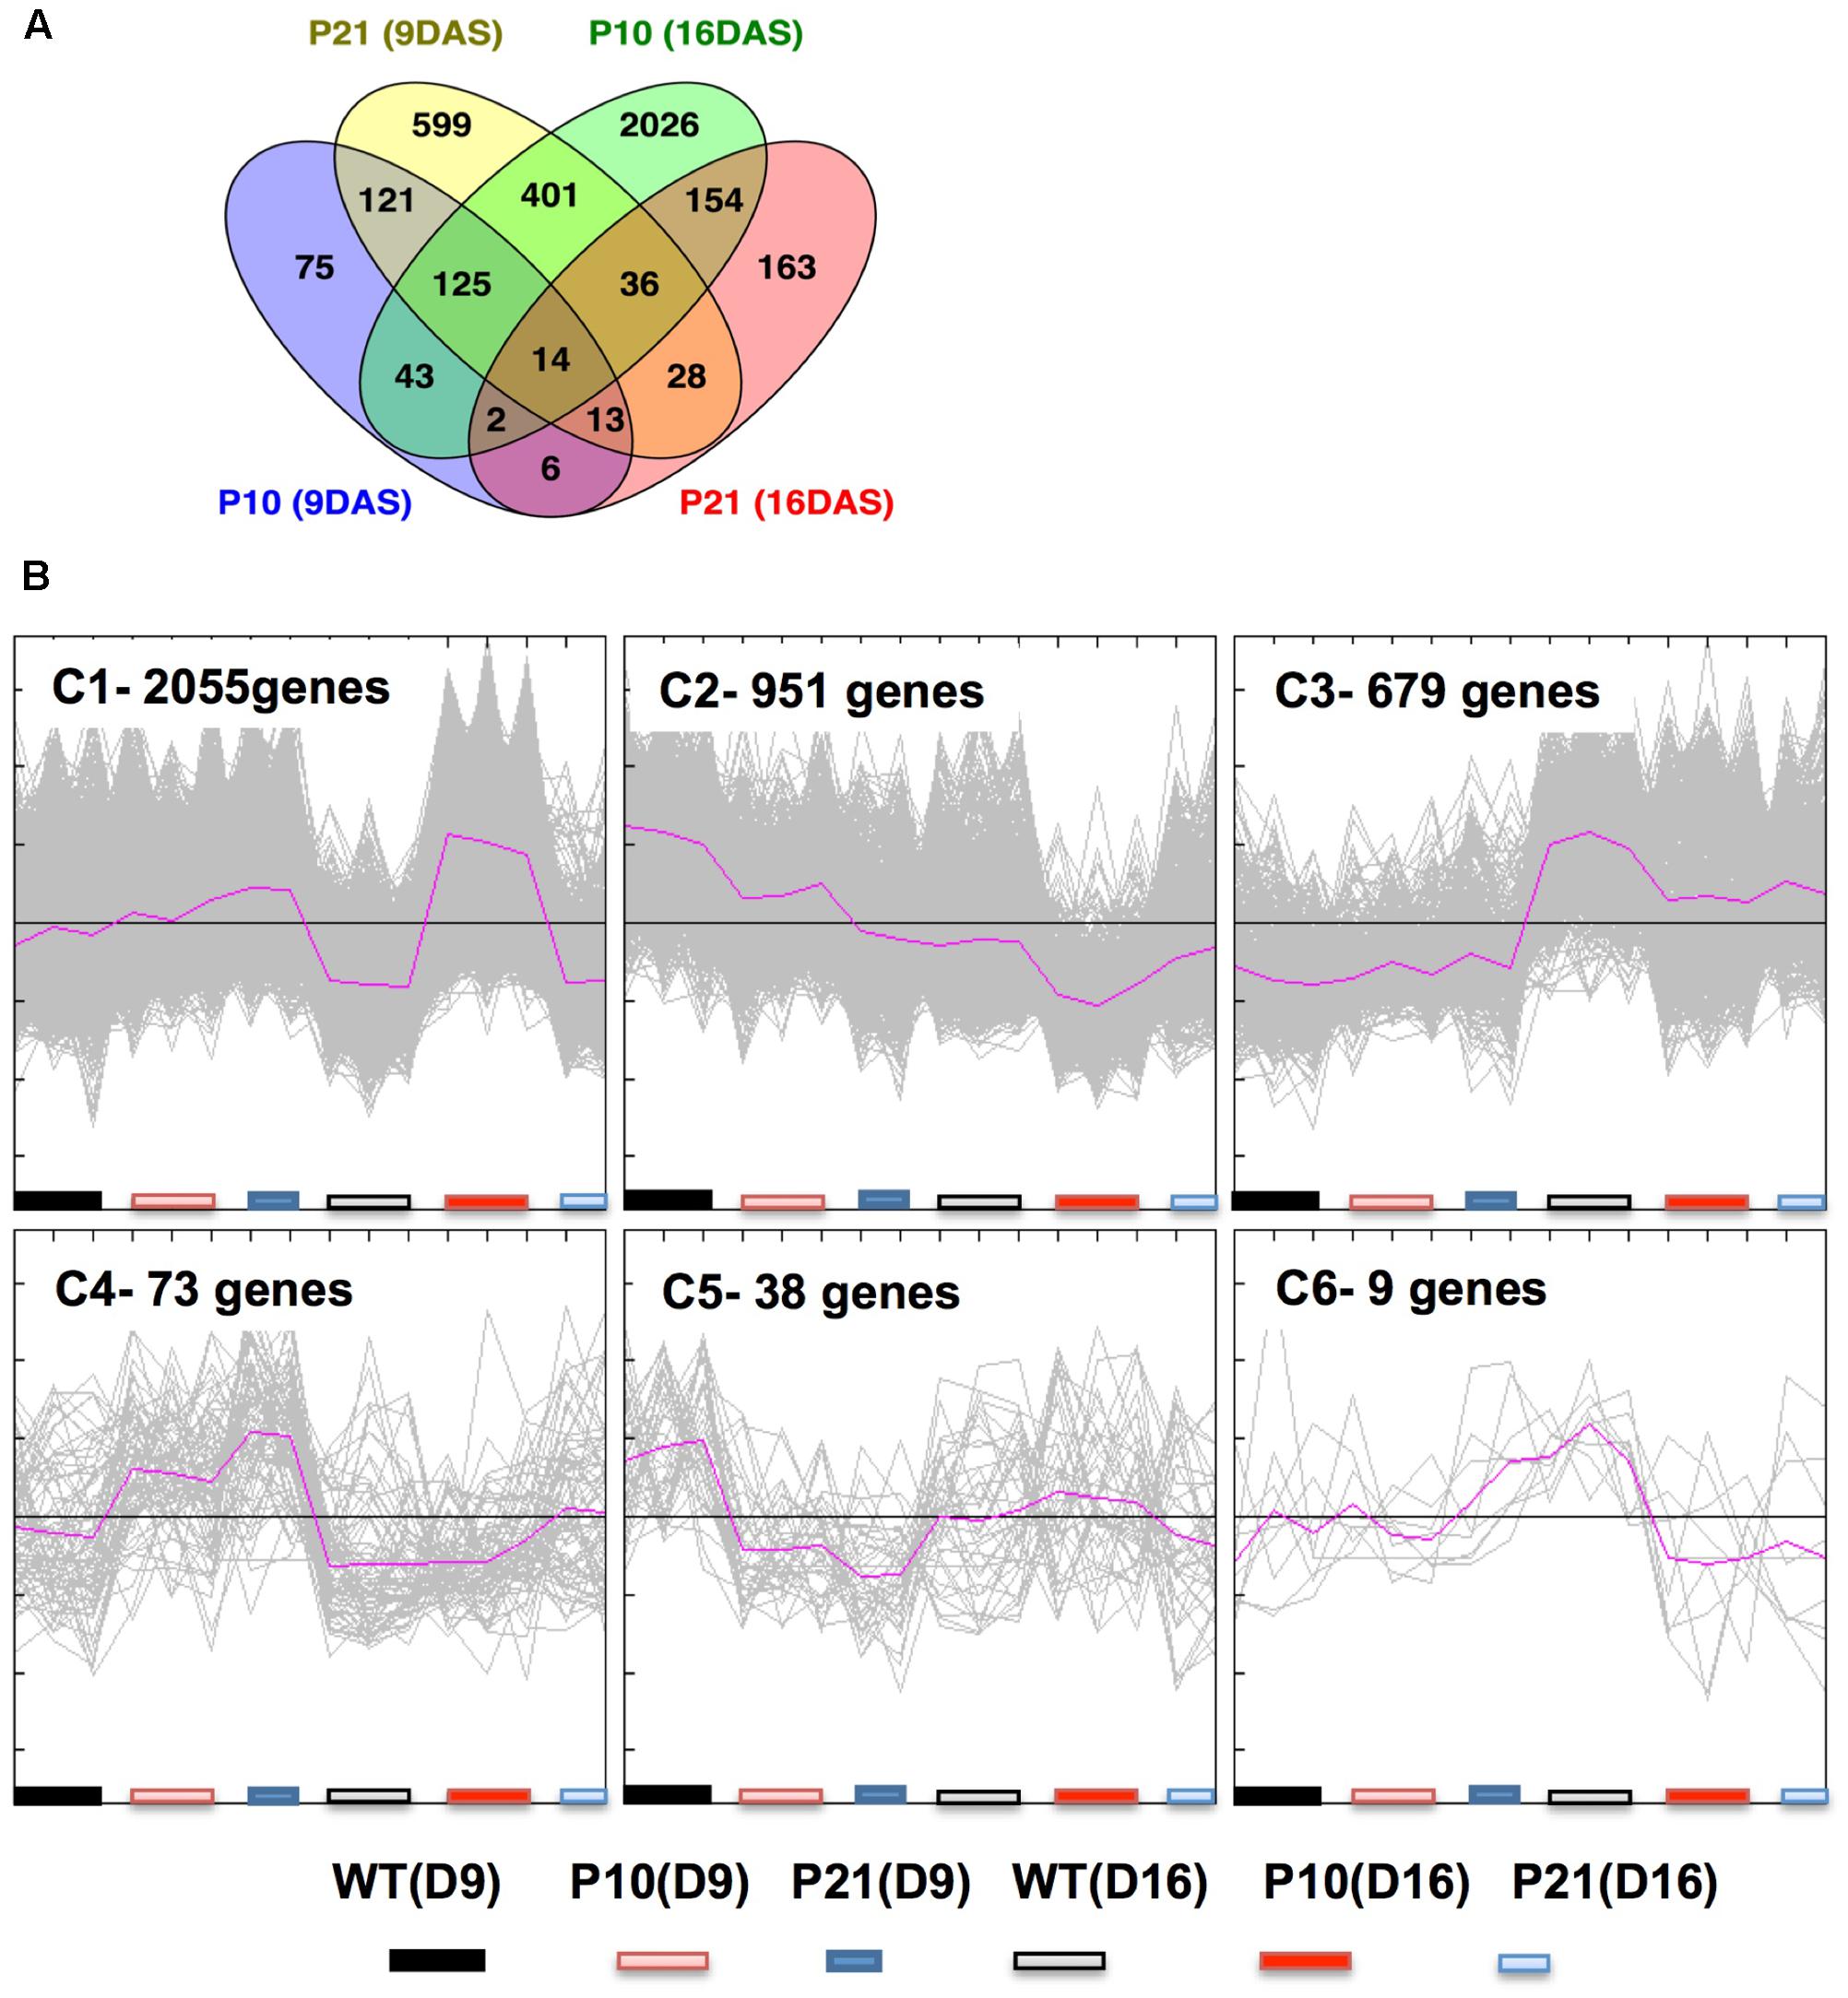
FIGURE 7. Transcriptome analysis of wild type and PID overexpression lines at 9 and 16 DAS. Overlap between differentially expressed genes as a result of PID overexpression in P10 and P21 at two time points as shown by Venn diagram (A). Clustering of gene expression patterns by QT-Cluster analysis of significantly changed genes. The number of genes in each cluster and cluster numbers are mentioned at the upper left corner (B).
PageMan gene enrichment analysis for significantly induced and repressed genes showed that upregulated biological categories included carbohydrate metabolism and glycolysis, photorespiration, cell wall modifications (cellulose and hemicellulose synthesis etc.), secondary metabolite synthesis, biotic-abiotic stress, signaling and transport. Pathways that were enriched among downregulated genes included the TCA cycle, redox, nucleotide and amino acid metabolism (Figure 8). In general, hormone metabolism-related genes indicated upregulation of jasmonic acid, gibberellins and ABA metabolism (Supplementary Data 2; Saini et al., submitted results).
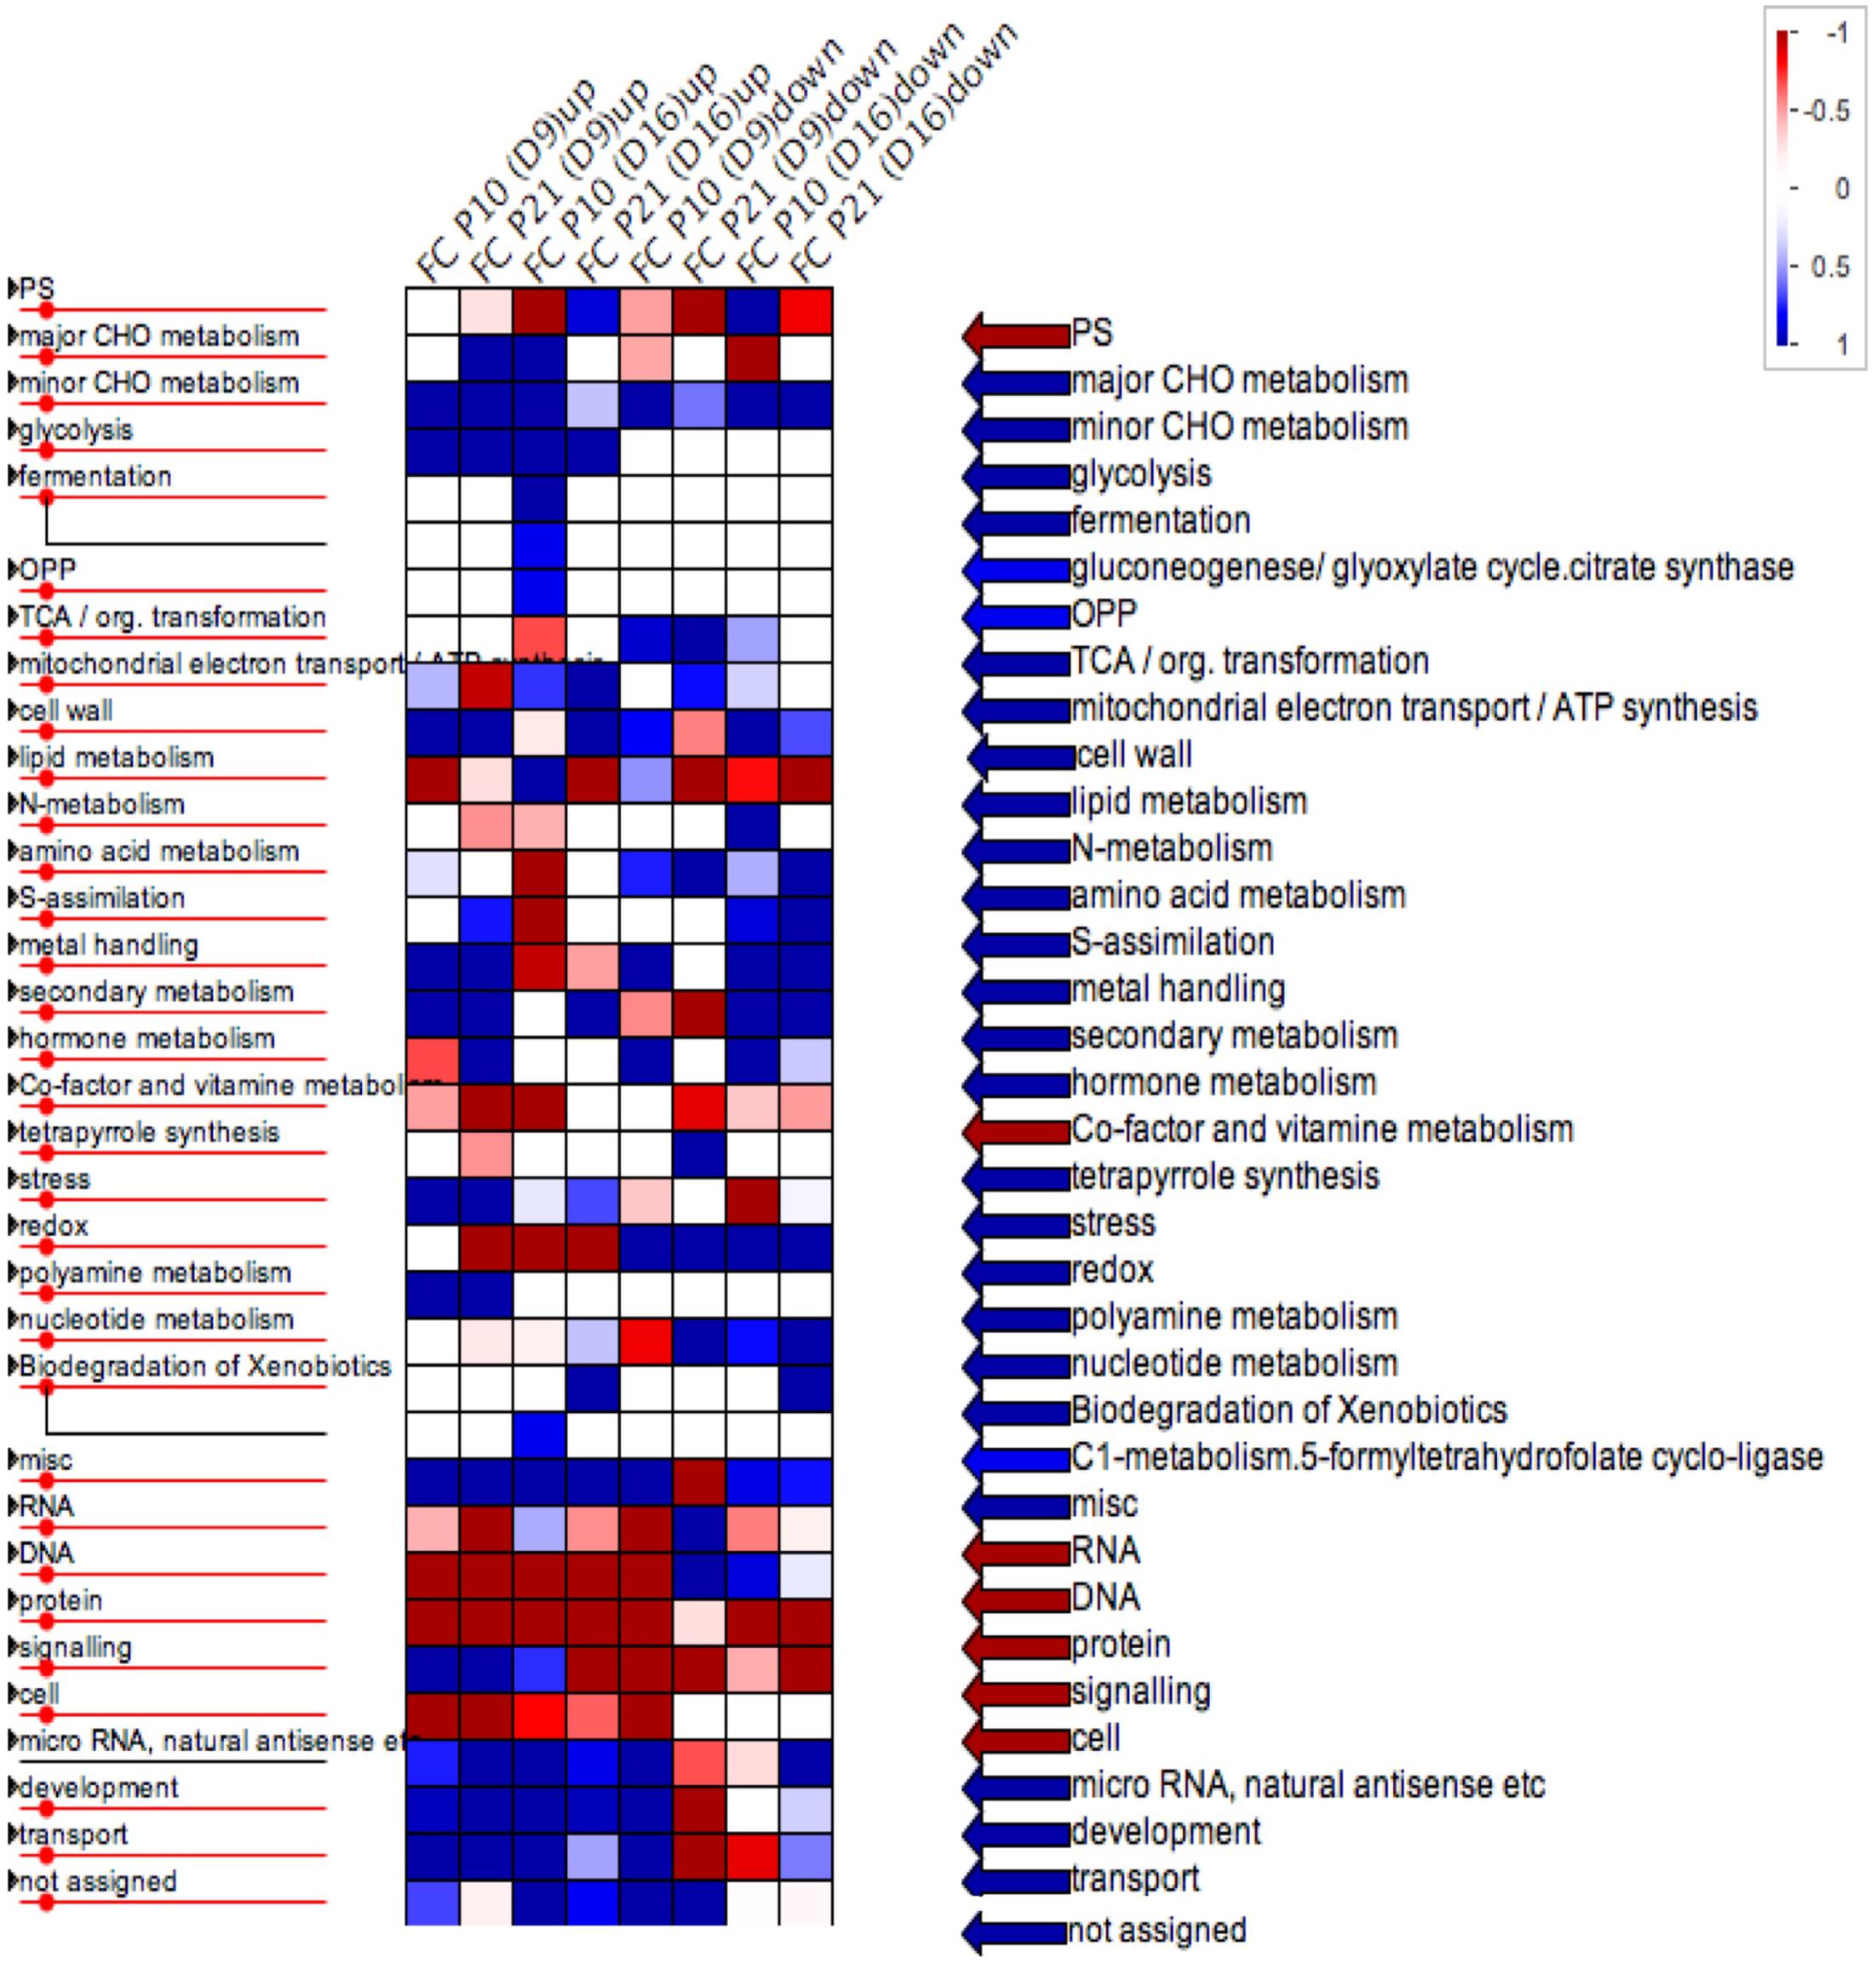
FIGURE 8. PageMan representation of differentially expressed genes in two PID overexpression lines. Overrepresented biological pathways in PIDOE lines at different time points are highlighted in blue. Upregulation and downregulation is as indicated in the legend above.
Auxin Related Transcriptional Changes in the PID Overexpression Lines
To understand the reason for high auxin levels and response in PIDOE lines, we studied the transcriptional changes of genes related to auxin homeostasis and signaling in more detail using the first leaf pair. None of the auxin biosynthesis genes (based on the review, Woodward and Bartel, 2005) showed changes in their expression levels except YUC8, which was downregulated at 16 DAS in both PIDOE lines, whereas genes related to conjugation pathways varied over time and between the lines (Figure 9). An IAA deconjugating gene, IAA-LEUCINE CONJUGATE HYDROLASE (ILR1), showed upregulation in P10 at 16 DAS. The auxin-inducible GRETCHEN HAGEN3 (GH3) class of genes encodes IAA-amido synthetases, which convert excess free IAA to IAA-amino acid conjugates, and therefore controls endogenous auxin levels (Staswick et al., 2005). Downregulation of GH3.6 at 9 DAS and upregulation of GH3.9 at 16 DAS (∼2-fold in P10 and ∼4-fold in P21) indicated that the shift between deconjugation and conjugation between the two time points could have contributed to the gradually increasing and then decreasing levels of free IAA. Also, INDOLE-3-BUTYRIC ACID RESPONSE (IBR1 and IBR3) genes, required for conversion of IBA to IAA (Korasick et al., 2013), were upregulated in P10 at 16 DAS. The differences in upregulation of conjugation and deconjugation genes between the two lines could account for differences in their IAA pool in later stages, as shown in Figures 2C,D.
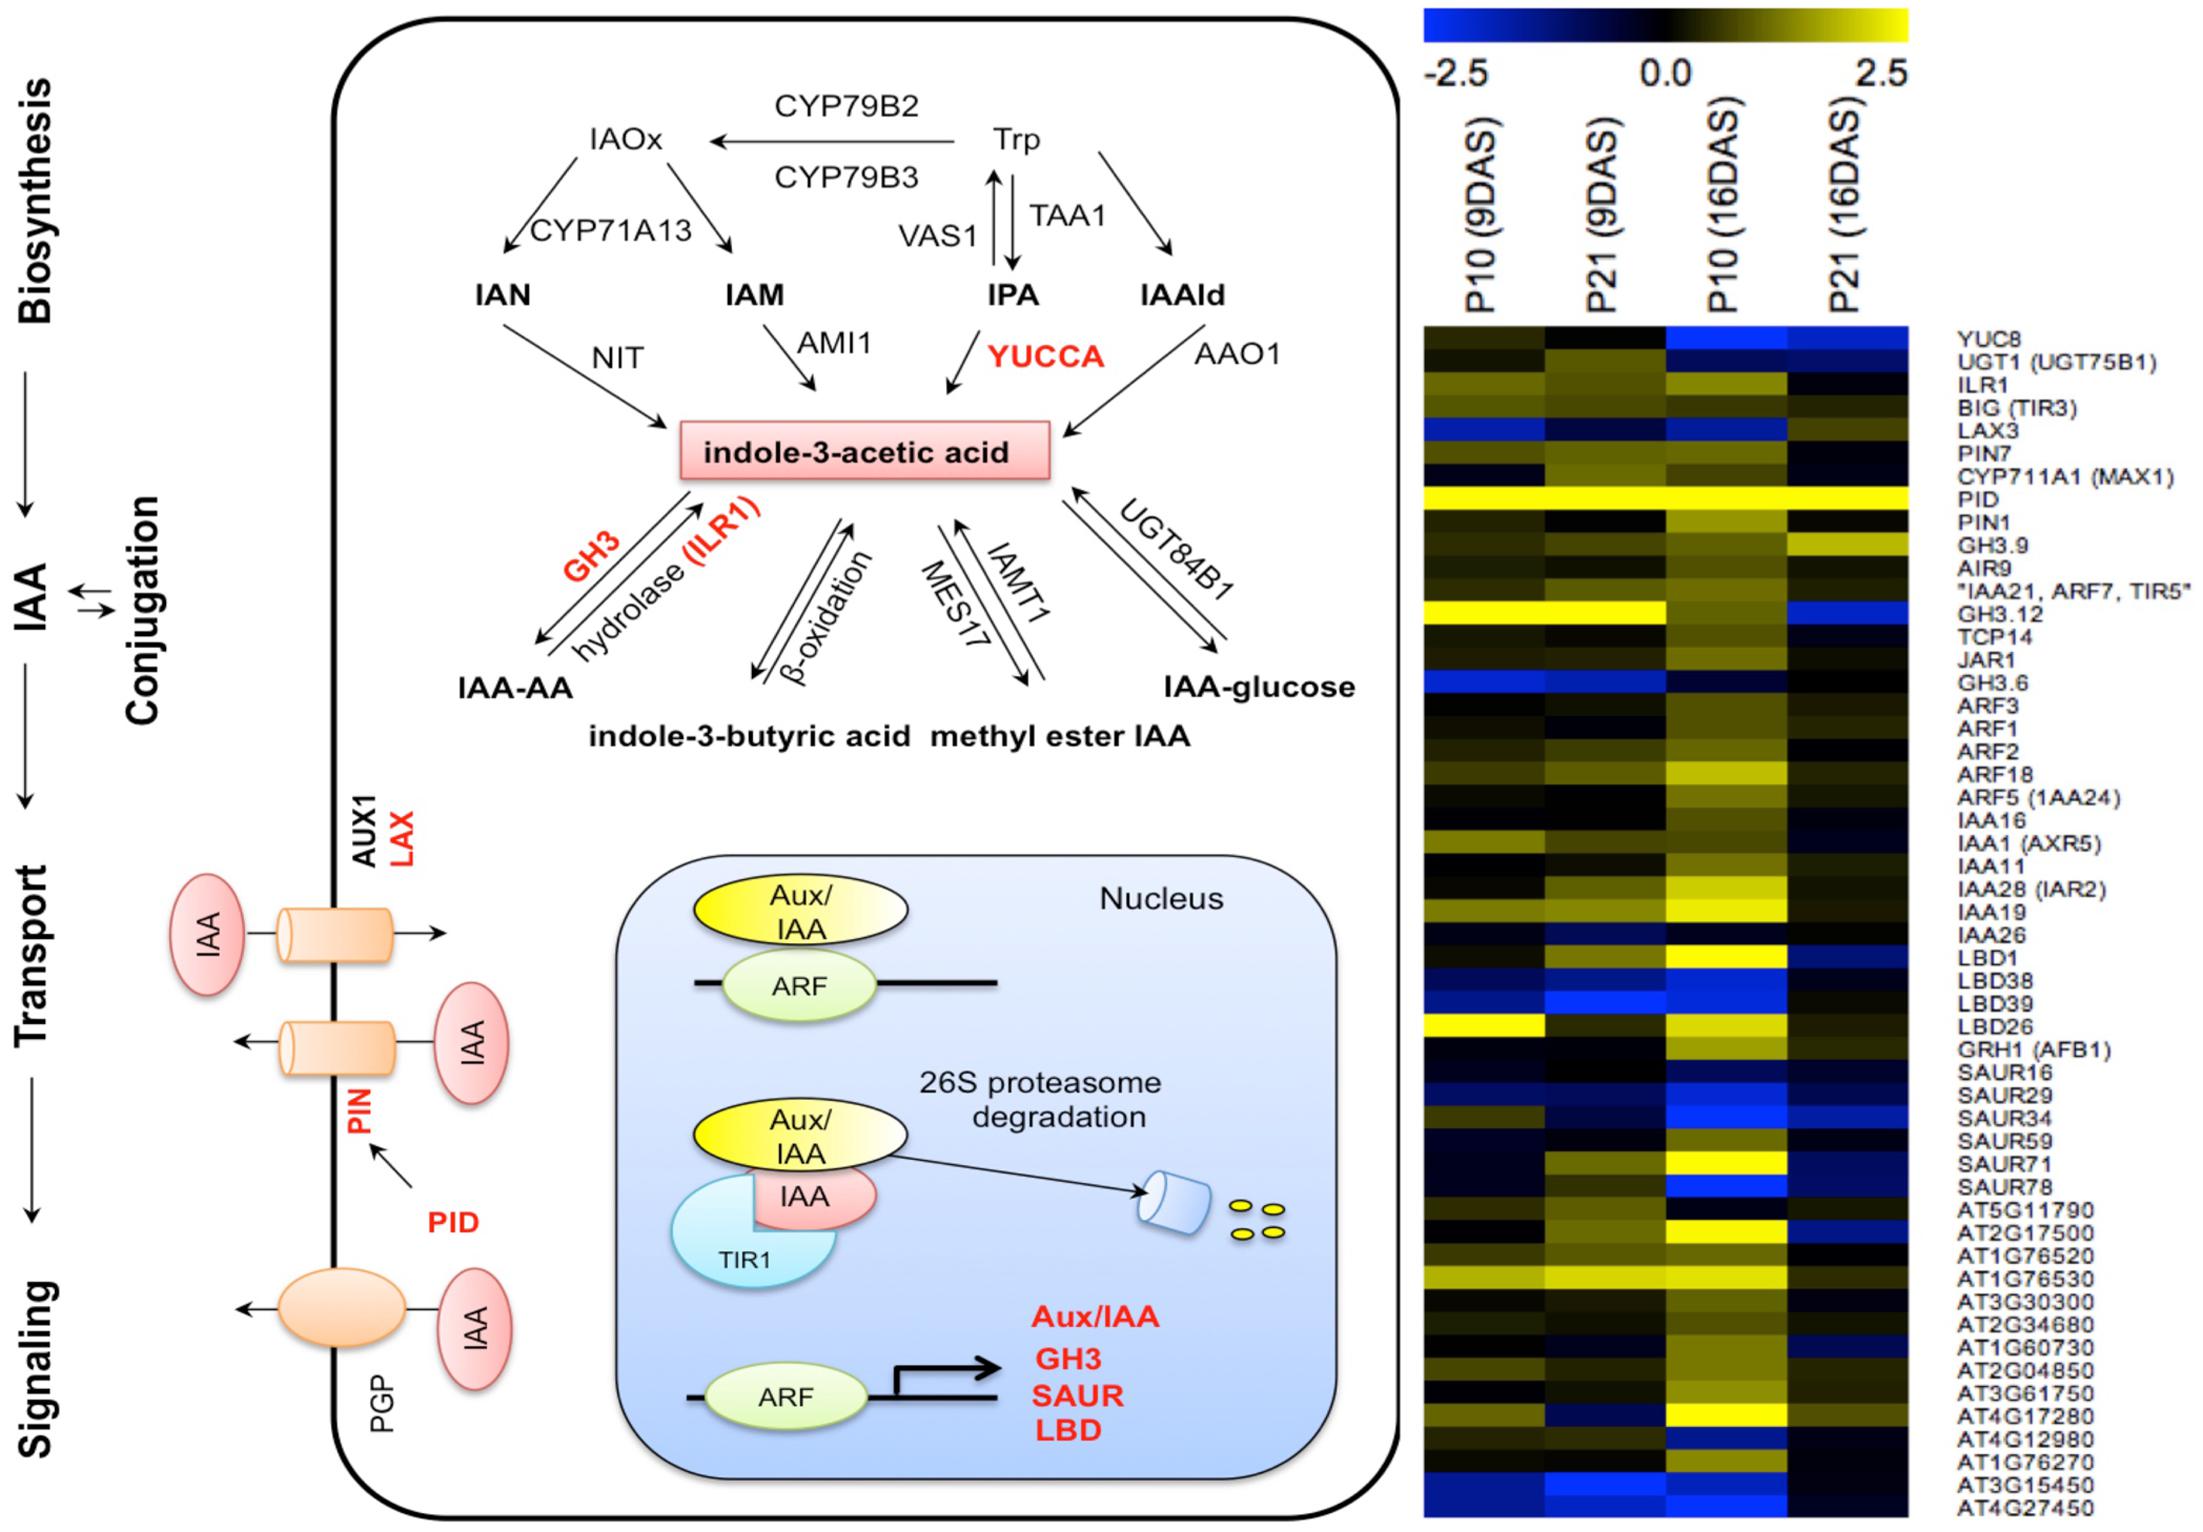
FIGURE 9. Effect of PID overexpression on the expression of genes involved in various auxin-related pathways. Schematic representation of auxin related pathways, on which affected genes are indicated in red, based on RNA-seq data from both PIDOE lines. Heat map shows auxin-related genes affected by PID overexpression. Abbreviations: Trp, tryptophan; IAOx, indole-3-acetaldoxime; IAN, indole-3-acetonitrile; IPA, indole-3-pyruvate; IAM, indole-3-acetamide; IAAld, indole-3-acetaldehyde. Yellow and blue colors in the heat map represent up- and downregulation of genes, respectively.
Among the genes related to polar auxin transport, PIN1 showed a threefold increase in P10, PIN7 showed a twofold increase in P21 at 9 DAS and in P10 at 16 DAS, whereas the influx protein LAX3 showed a threefold decrease in P10. This could be interpreted as a potential change in influx and efflux of auxin from cells in PIDOE leaves.
AUXIN/INDOLE-3-ACETIC ACID (Aux/IAA), GH3, SMALL AUXIN UP RNAs (SAUR), LATERAL ORGAN BOUNDARIES-DOMAIN (LBD) are known as primary auxin responsive genes and are directly regulated by Auxin Responsive Factors (ARFs; Okushima et al., 2007; Paponov et al., 2008, 2009; Lee et al., 2009). All the significantly changed ARFs (ARF1, ARF2, ARF3, ARF18, and ARF5) and IAAs (IAA1, IAA11, IAA16, IAA19, IAA24, IAA28, except IAA26) showed upregulation at different time points in at least one of the genotypes. LBD1 and LBD26 showed a strong upregulation, while LBD38 and LBD39 showed strong downregulation in both PIDOE lines (Figure 9). The general upregulation of auxin response genes correlates with the elevated auxin levels and observed increased DR5 activity (Figures 2, 3).
Transcriptional Changes in Cell Division and Expansion-Related Genes
To understand the effect of PID-induced auxin accumulation on cell division and expansion at the transcriptional level, changes in the expression levels of core cell cycle and cell wall-related genes were investigated. The RNA sequencing data showed modulations of many core cell cycle genes (based on Vandepoele et al., 2002; De Almeida Engler et al., 2009), including the downregulation of major cyclins (CYCA2;4, CYCB2;2, CYCD5;1, and CYCH;1), Cyclin Dependent Kinase subunit 2 (CKS2), ANAPHASE-PROMOTING COMPLEX (APC10 and APC8), the E2F pathway genes, and KIP RELATED PROTEIN KRP3 and KRP7, with the exception of upregulation of KRP1 and KRP2 (Supplementary Table 2). Together these results suggest that PID-induced alterations in auxin levels could have affected the cell cycle through these genes, which could be interpreted as the reason for suppressed proliferation during development.
In plants, the extent of cell expansion largely depends on the biomechanical properties of their cell walls. The expression levels of numerous cell wall-related genes (based on Mapman notation; bin 11; Thimm et al., 2004) were affected in the same sense in both PIDOE lines, though with a different magnitude (Supplementary Table 3). Genes related to cellulose and hemicellulose were upregulated in both lines. One of the cellulose synthase genes involved in secondary wall formation, CesA4 (IRX5) (Taylor et al., 2003), was upregulated in P10 at 16 DAS. Some cellulose synthase-like gene family (Csl) were also among upregulated genes such as CslA, CslC, CslE, and CslG family members in P21 at 9 DAS and P10 at 16 DAS. Dynamic changes in cell area of PIDOE lines, especially in P21 after 16 DAS, and the thicker leaves in P10 could also be due to the changes in the cell wall modification proteins such as xyloglucan endotransglucosylase/hydrolases (XTHs) and expansins (Cosgrove, 2000; Nishitani and Vissenberg, 2007; Van Sandt et al., 2007). Indeed, changes in alpha and beta expansins and XTHs were observed in our transcriptome data (Supplementary Table 3).
Transcriptional Regulation of Leaf Development in PID Overexpression Lines
According to a proposed model, MONOPTEROS (MP) and PIN regulate vein formation under the influence of auxin, where MP acts upstream of PIN and could also be regulating PIN expression directly or indirectly (Wenzel et al., 2007). MP and NONPHOTOTROPIC HYPOCOTYL 4 (NPH4) work synergistically in development of the midvein and differentiation of secondary and tertiary veins. HOMEOBOX GENE 8 (ATHB8) controls preprocambial development and procambium differentiation required for vascularization (Hardtke et al., 2004; Wenzel et al., 2007; Donner et al., 2010). Both PIDOE lines, and especially P10, showed a thick vasculature (Supplementary Figure 3) that could be explained by the upregulation of PIN1, MP, NPH4, and ATHB8 at 16 DAS. Transcription factors KANADI, YABBY family members, and ETTIN/ARF3, are required for the identity of the abaxial domain of the leaf (Pekker et al., 2005; Stahle et al., 2009; Bonaccorso et al., 2012) while ASYMMETRIC1 (AS1) and a kinase ERECTA are required for adaxialization in the leaf (Xu et al., 2003). All these gene families are upregulated in PIDOE lines, with exception of the downregulation of YAB1/FILAMENTOUS FLOWER (FIL1), which suggests that PID might influence leaf lamina growth either directly or indirectly (Figure 4).
Discussion
PIDOE lines showed severe shoot growth phenotypes (Christensen et al., 2000) leading us to hypothesize that the cause and severity of the leaf phenotypes were due to affected auxin transport in the leaves, causing auxin retention in the top leaf blade because of changed polarity of PINs in the epidermal cells in the leaves. Previously, Zhao et al. (2001) reported elevated endogenous auxin levels and downward curled narrower leaves in the yucca mutants. Here we showed similar responses in PIDOE lines and exploited the role of PIDOE as auxin modulator. In our opinion these PIDOE lines proved to be a good tool to study auxin dose-dependent processes. Such subtle changes in auxin levels are not easily achieved, and this provides a good opportunity to study their effect on development.
PID Overexpression Lines Show Alterations in Auxin Homeostasis and Signaling
To validate our hypothesis of auxin involvement in growth defects in PIDOE lines, we studied four different auxin related pathways; biosynthesis, conjugation, transport, and signaling. Since transport of auxin in the leaves can’t be assayed easily we relied on other indirect means/interpretations. IAA is the most abundant form of auxin in vascular plants including Arabidopsis. Free IAA is the active form of auxin and represents only a small percent of the total IAA, which mostly includes IAA conjugated to sugars, amino acids and peptides. PIDOE lines showed high levels of both free and conjugated forms of IAA in the first pair of leaves compared to the WT leaves (Figure 2). Auxin regulates leaf blade and cell expansion in a dose-dependent manner, where supraoptimal concentrations are inhibitory (Thimann, 1939; Evans et al., 1994; Keller et al., 2004). High auxin levels in PIDOE lines could also affect growth in a similar manner. RNA-seq data showed downregulation of a YUC8 gene involved in auxin biosynthesis, while the expressions of other biosynthesis genes were unchanged. Both PIDOE lines lack the characteristic auxin overproducing phenotypes, like the presence of plentiful lateral and adventitious roots, elongated hypocotyl and petioles, and epinastic cotyledons (Boerjan et al., 1995; Benjamins et al., 2001; Zhao et al., 2001). However, leaves were curled downward and the PIDOE lines also show a lack of apical dominance, a phenotype often related to auxin homeostasis mutants (Estelle and Somerville, 1987; Christensen et al., 2000; Benjamins et al., 2001). Therefore, downregulation of auxin biosynthesis and upregulation of conjugation and deconjugation-related genes in the RNA-seq data indicate a feedback mechanism to maintain homeostasis between overloaded free IAA and conjugated forms. Overall, the total IAA concentration of P10 remained significantly higher than that of the WT, whereas in P21 the higher IAA concentration dropped to nearly WT levels when the tissues were mature. This result is consistent with the changes in the expression levels of PID in the P21 line similar to qPCR transcript abundance data, suggesting that a certain level of PID is required to maintain high auxin levels.
PIN localization determines the direction of auxin flow in plants (Wisniewska et al., 2006). Extensive research proves that PID regulates auxin fluxes by regulating subcellular localization of PIN proteins, where PID overexpression causes apicalization of PIN protein at the cellular membranes in various cells in Arabidopsis, including the leaf epidermal cells (Friml et al., 2004; Kaplinsky and Barton, 2004). This apical polarity bias causes upward (shootward) auxin flow, compromising the auxin maxima at the root tip, which causes root meristem collapse (Benjamins et al., 2001; Friml et al., 2004; Armengot et al., 2016). Partial rescue of root phenotypes in PIDOE lines after application of an auxin transport inhibitor, NPA (N-1-Naphthylphthalamic Acid) further supports this statement (Benjamins et al., 2001). Here, we propose that apical PIN polarity in the leaves causes auxin retention, especially in the top leaf region (Figures 2, 3), which could have disturbed the source to sink relationship between shoot and root causing various developmental defects. This problem of drainage or efflux caused by PINs provides a reason for the accumulation of auxin in the top marginal parts of the leaves, at least partially, if not entirely, since PID only transiently phosphorylates PINs, and the proportion of PID co-localize with PIN at the plasma membrane is inversely related to the PID concentration (Barbosa et al., 2014; Fozard et al., 2013). Additionally, PID also phosphorylates ABCB1 and thus affects its auxin efflux function as well (Henrichs et al., 2012), so its not clear to what extent the leaf phenotypes reported in PIDOE lines can be directly attributed to PIN proteins alone. Nevertheless, IAA measurements and visualization of auxin signaling point to a failure of auxin export from the leaves in the PIDOE lines. Wild type plants treated with NPA mimicked this genetic effect by blocking the auxin transport and similarly also showed a clear reduction in rosette growth with increasing concentrations (Supplementary Figure 6). As mentioned earlier increased efflux from the root tips causes root meristem collapse since PID enhances efflux of auxin from the cells (Benjamins et al., 2001; Friml et al., 2004; Lee and Cho, 2006; Zourelidou et al., 2014). According to Benjamins et al. (2001), effect of the primary root meristem collapse by PID overexpression is later compensated by the formation of lateral roots, that start to act as new auxin sinks. This is plausible especially in P21 where the formation of lateral roots (Benjamins et al., 2001) may have resulted in changes in auxin distribution between the shoot and roots. This could additionally explain the lowering of auxin levels in the leaves in later developmental stages in P21. P10, on the other hand, showed very few lateral roots (Benjamins et al., 2001) and thus, accordingly, maintained high auxin in the leaves. From these experiments, it can be concluded that PID altered the auxin flow in the PID overexpressing plants.
Auxin signaling reporters in the PIDOE lines (DR5::GUS and DR5rev::GFP) support the accumulation of auxin (Figure 2) and changes in auxin response in the leaves (Figure 3). Since DR5 reporter and thus auxin response is different between leaves and roots, it cannot be said if PID is a negative or positive regulator of auxin signaling or if perhaps the effect is tissue-specific. Moreover, PID is previously implicated to affect auxin signaling based on the presence of overlapping phenotypes between pid mutants and mutants of MP (ARF5), ETTIN (ARF3), and SHORT HYPOCOTYL 2 (IAA3) (Christensen et al., 2000). Upregulation of MP, and ARF3 in PIDOE lines besides other ARFs and Aux/IAAs in our RNA-sequencing data also suggest a link.
PID Overexpression May Affect Leaf Growth by Perturbing Cellular Processes
Single pid knockout mutants showed only marginal phenotypic alterations in their leaves (Bennett, 1995: this work). This may be due to functional redundancy between PID and its homologs (Cheng et al., 2008). On the other hand, kinematic growth analysis showed that the growth in PIDOE was restricted throughout development and due to inhibited cell division and cell expansion. Six different processes occurring during leaf development influence its final size: the number of cells recruited from the shoot apical meristem at the time of primordium initiation, duration of cell division and expansion, the rate of cell division and expansion, and finally meristemoid division in the cells of the stomatal lineage (Gonzalez et al., 2012). PIDOE also displayed a shorter cell proliferation phase (more so in P21), however, the duration of the expansion phase seems not to be affected, as all three genotypes reached cell size maturity from 24 DAS onward. Reduction in stomatal index points toward problems in meristemoid division as well. On top of this, cell division and expansion rates are clearly affected in both PIDOE. Since PIDOE affected multiple processes, contributions of individual cellular process underlying the phenotype become difficult to pinpoint. Since (1) P21 had a more drastic reduction in cell number than P10 due to the higher PID overexpression at that time and (2) P10 showed a smaller cell area at maturity compared to P21, when a decrease in the PID transcript levels were noticed in P21, it can be said that the severity to both processes is dependent on PID-dosage and its resulting effects on auxin levels.
Transcription Data Present Insights into Cellular and Organ Level Phenotype
RNA sequencing provided insights into the mechanisms behind the phenotype. However, there was little overlap between the two-overexpression lines (Figure 7A). This could be partially due to the differences in PID expression levels and thus auxin levels at the mentioned time points of the sampling for the RNA-sequencing and partly to the fact that even transient changes in auxin affect a plethora of events at the cellular and molecular level. This is evidenced by the affected functional categories in PageMan ontology tool in our data (Figure 8) and in previous reports (Nemhauser et al., 2006; Paponov et al., 2008). This being superimposed on changes on developmental rates of the organ, involving large transcriptional reprogramming (Beemster et al., 2005), can explain the observed differences between the two lines.
Variations in transcript levels of several leaf growth and development-related genes were detected in PIDOE lines and they correlatively suggest a role of PID in defining leaf form and size. Cell sizes and leaf growth are often correlated with cellular DNA content (Donnelly et al., 1999; Massonnet et al., 2011). The P21 line showed changes in endoreduplication index (EI) over time, and this can also be coupled/related to changes in leaf (and cell size) growth and the PID expression levels at that time. High auxin levels suppress the progression of endocycles, and is also coupled to the progression of cell differentiation, which is marked by a sudden increase in cell size (De Veylder et al., 2007; Ishida et al., 2010). This is also vividly evident in P10 since it has a reduced endoreduplication index and cell area. P21, on the other hand, showed the opposite scenario because of the lower auxin levels compared to P10 when approaching maturity.
Conclusion
Our results provide an insight into the influence of PID on auxin levels and distribution. PID is known as positive regulator of PAT. Here we showed that PID via its effect on auxin accumulation and distribution might also indirectly influence auxin metabolism and signaling and thus indirectly have a regulatory effect on leaf development as well.
Author Contributions
KS planned and performed most of the experiments, analyzed the data, and wrote the article with contribution from EP, GB, TB, LV, and KV. MM performed next generation sequencing. MZ and DB provided assistance with crossing and genotyping experiments. EP, GB, and KV conceived the project and KV supervised the research.
Funding
This work was supported by a concerted research activity (GOA) research grant, ‘A Systems Biology Approach of Leaf Morphogenesis’ from the research council of the University of Antwerp. This work was supported by the Research Foundation Flanders (G.0656.13N, G.0.602.11.N.10 and 1.5.091.11.N.00).
Conflict of Interest Statement
The authors declare that the research was conducted in the absence of any commercial or financial relationships that could be construed as a potential conflict of interest.
Acknowledgments
We thank several people for providing us with seeds, especially Remko Offringa (Leiden University) for pPID::GUS and DR5::GUSx35S::PID, Eva Benkova (IST Austria) for PIDOE, P10 and P21, Malcolm Bennett (CPIB, Nottingham) for DR5revGFP and Tatsuya Sakai (Graduate School of Science and Technology, Japan) for pid-14. We would also like to thank Isabel Pintelon and Dirk Andriaensen (Cell and histology department, UA) for using CellP software, and most importantly to Öden Sevgi and Tim Willems (Biology department, UA) for performing the auxin measurements.
Supplementary Material
The Supplementary Material for this article can be found online at: http://journal.frontiersin.org/article/10.3389/fpls.2017.01009/full#supplementary-material
Footnotes
References
Andriankaja, M., Dhondt, S., DeBodt, S., Vanhaeren, H., Coppens, F., DeMilde, L., et al. (2012). Exit from proliferation during leaf development in Arabidopsis thaliana: a not-so-gradual process. Dev. Cell 22, 64–78. doi: 10.1016/j.devcel.2011.11.011
Armengot, L., Marquès-Bueno, M. M., and Jaillais, Y. (2016). Regulation of polar auxin transport by protein and lipid kinases. J. Exp. Bot. 67, 4015–4037. doi: 10.1093/jxb/erw216
Baggerly, K. A., Deng, L., Morris, J. S., and Aldaz, C. M. (2003). Differential expression in SAGE: accounting for normal between-library variation. Bioinformatics 19, 1477–1483. doi: 10.1093/bioinformatics/btg173
Barbosa, I. C. R., Zourelidou, M., Willige, B. C., Weller, B., and Schwechheimer, C. (2014). D6 PROTEIN KINASE activates auxin transport-dependent growth and PIN-FORMED phosphorylation at the plasma membrane. Dev. Cell 29, 674–685. doi: 10.1016/j.devcel.2014.05.006
Beemster, G. T., and Baskin, T. I. (1998). Analysis of cell division and elongation underlying the developmental acceleration of root growth in Arabidopsis thaliana. Plant Physiol. 116, 1515–1526. doi: 10.1104/pp.116.4.1515
Beemster, G. T. S., De Veylder, L., Vercruysse, S., West, G., Rombaut, D., Van Hummelen, P., et al. (2005). Genome-wide analysis of gene expression profiles associated with cell cycle transitions in growing organs of Arabidopsis. Plant Physiol. 138, 734–743. doi: 10.1104/pp.104.053884
Benjamins, R., Quint, A., Weijers, D., Hooykaas, P., and Offringa, R. (2001). The PINOID protein kinase regulates organ development in Arabidopsis by enhancing polar auxin transport. Development 128, 4057–4067.
Benkova, E., Michniewicz, M., Sauer, M., Teichmann, T., Seifertova, D., Jürgens, G., et al. (2003). Local, efflux-dependent auxin gradients as a common module for plant organ formation. Cell 115, 591–602. doi: 10.1016/S0092-8674(03)00924-3
Bennett, R. M. S. (1995). Morphogenesis in pinoid mutants of Arabidopsis thaliana. Plant J. 8, 505–520. doi: 10.1046/j.1365-313X.1995.8040505.x
Bilsborough, G. D., Runions, A., Barkoulas, M., Jenkins, H. W., Hasson, A., Galinha, C., et al. (2011). Model for the regulation of Arabidopsis thaliana leaf margin development. Proc. Natl. Acad. Sci. U.S.A. 108, 3424–3429. doi: 10.1073/pnas.1015162108
Boerjan, W., Cervera, M. T., Delarue, M., Beeckman, T., Dewitte, W., Bellini, C., et al. (1995). Superroot, a recessive mutation in Arabidopsis, confers auxin overproduction. Plant Cell 7, 1405–1419. doi: 10.1105/tpc.7.9.1405
Bonaccorso, O., Lee, J. E., Puah, L., Scutt, C. P., and Golz, J. F. (2012). FILAMENTOUS FLOWER controls lateral organ development by acting as both an activator and a repressor. BMC Plant Biol. 12:176. doi: 10.1186/1471-2229-12-176
Breuninger, H., and Lenhard, M. (2010). Control of tissue and organ growth in plants. Curr. Top. Dev. Biol. 91, 185–220. doi: 10.1016/S0070-2153(10)91007-7
Cheng, Y., Qin, G., Dai, X., and Zhao, Y. (2008). NPY genes and AGC kinases define two key steps in auxin-mediated organogenesis in Arabidopsis. Proc. Natl. Acad. Sci. U.S.A. 105, 21017–21022. doi: 10.1073/pnas.0809761106
Christensen, S. K., Dagenais, N., Chory, J., and Weigel, D. (2000). Regulation of auxin response by the protein kinase PINOID. Cell 100, 469–478. doi: 10.1016/S0092-8674(00)80682-0
Cosgrove, D. J. (2000). Loosening of plant cell walls by expansins. Nature 407, 321–326. doi: 10.1038/35030000
Cosgrove, D. J. (2001). Plant cell walls: wall-associated kinases and cell expansion. Curr. Biol. 11, R558–R559. doi: 10.1016/S0960-9822(01)00342-6
Czesnick, H., and Lenhard, M. (2015). Size control in plants — lessons from leaves and flowers. Cold Spring Harb. Perspect. Biol. 7:a019190. doi: 10.1101/cshperspect.a019190
De Almeida Engler, J., De Veylder, L., De Groodt, R., Rombauts, S., Boudolf, V., De Meyer, B., et al. (2009). Systematic analysis of cell-cycle gene expression during Arabidopsis development. Plant J. 59, 645–660. doi: 10.1111/j.1365-313X.2009.03893.x
De Veylder, L., Beeckman, T., Beemster, G. T., Krols, L., Terras, F., Landrieu, I., et al. (2001). Functional analysis of cyclin-dependent kinase inhibitors of Arabidopsis. Plant Cell 13, 1653–1668. doi: 10.1105/tpc.13.7.1653
De Veylder, L., Beeckman, T., and Inzé, D. (2007). The ins and outs of the plant cell cycle. Nat. Rev. Mol. Cell Biol. 8, 655–665. doi: 10.1038/nrm2227
Donnelly, P. M., Bonetta, D., Tsukaya, H., Dengler, R. E., and Dengler, N. G. (1999). Cell cycling and cell enlargement in developing leaves of Arabidopsis. Dev. Biol. 215, 407–419. doi: 10.1006/dbio.1999.9443
Donner, T. J., Sherr, I., and Scarpella, E. (2010). Auxin signal transduction in Arabidopsis vein formation. Plant Signal. Behav. 5, 70–72. doi: 10.4161/psb.5.1.10233
Estelle, M. A., and Somerville, C. (1987). Auxin-resistant mutants of Arabidopsis thaliana with an altered morphology. Mol. Gen. Genet. 206, 200–206. doi: 10.1007/BF00333575
Evans, M., Ishikawa, H., and Estelle, M. (1994). Responses of Arabidopsis roots to auxin studied with high temporal resolution: comparison of wild type and auxin-response mutants. Planta 194, 215–222. doi: 10.1007/BF00196390
Fozard, J. A., King, J. R., and Bennett, M. J. (2013). Modelling auxin efflux carrier phosphorylation and localization. J. Theor. Biol. 319, 34–49. doi: 10.1016/j.jtbi.2012.11.011
Friml, J. (2003). Auxin transport - shaping the plant. Curr. Opin. Plant Biol. 6, 7–12. doi: 10.1016/S1369526602000031
Friml, J., Yang, X., Michniewicz, M., Weijers, D., Quint, A., Tietz, O., et al. (2004). A PINOID-dependent binary switch in apical-basal PIN polar targeting directs auxin efflux. Science 306, 862–865. doi: 10.1126/science.1100618
Gonzalez, N., Vanhaeren, H., and Inzé, D. (2012). Leaf size control: complex coordination of cell division and expansion. Trends Plant Sci. 17, 332–340. doi: 10.1016/j.tplants.2012.02.003
Green, P. (1976). Growth and cell pattern formation on an axis: critique of concepts, terminology, and modes of study. Bot. Gaz. 137, 187–202. doi: 10.1086/336858
Green, P. B., and Bauer, K. (1977). Analysing the changing cell cycle. J. Theor. Biol. 68, 299–315. doi: 10.1016/0022-5193(77)90167-9
Haga, K., Hayashi, K.-I., and Sakai, T. (2014). PINOID AGC kinases are necessary for phytochrome-mediated enhancement of hypocotyl phototropism in Arabidopsis. Plant Physiol. 166, 1535–1545. doi: 10.1104/pp.114.244434
Hardtke, C. S., Ckurshumova, W., Vidaurre, D. P., Singh, S. A., Stamatiou, G., Tiwari, S. B., et al. (2004). Overlapping and non-redundant functions of the Arabidopsis auxin response factors MONOPTEROS and NONPHOTOTROPIC HYPOCOTYL 4. Development 131, 1089–1100. doi: 10.1242/dev.00925
Hay, A., Barkoulas, M., and Tsiantis, M. (2006). ASYMMETRIC LEAVES1 and auxin activities converge to repress BREVIPEDICELLUS expression and promote leaf development in Arabidopsis. Development 133, 3955–3961. doi: 10.1242/dev.02545
Hectors, K., Jacques, E., Prinsen, E., Guisez, Y., Verbelen, J. P., Jansen, M. A. K., et al. (2010). UV radiation reduces epidermal cell expansion in leaves of Arabidopsis thaliana. J. Exp. Bot. 61, 4339–4349. doi: 10.1093/jxb/erq235
Heisler, M. G., Ohno, C., Das, P., Sieber, P., Reddy, G. V., Long, J. A., et al. (2005). Patterns of auxin transport and gene expression during primordium development revealed by live imaging of the Arabidopsis inflorescence meristem. Curr. Biol. 15, 1899–1911. doi: 10.1016/j.cub.2005.09.052
Henrichs, S., Wang, B., Fukao, Y., Zhu, J., Charrier, L., Bailly, A., et al. (2012). Regulation of ABCB1/PGP1-catalysed auxin transport by linker phosphorylation. EMBO J. 31, 2965–2980. doi: 10.1038/emboj.2012.120
Ishida, T., Adachi, S., Yoshimura, M., Shimizu, K., Umeda, M., and Sugimoto, K. (2010). Auxin modulates the transition from the mitotic cycle to the endocycle in Arabidopsis. Development 137, 63–71. doi: 10.1242/dev.035840
Kalve, S., De Vos, D., and Beemster, G. T. S. (2014). Leaf development: a cellular perspective. Front. Plant Sci. 5:362. doi: 10.3389/fpls.2014.00362
Kalve, S., Saini, K., Vissenberg, K., Beeckman, T., and Beemster, G. T. S. (2015). Transverse sectioning of Arabidopsis thaliana leaves using resin embedding. Bio Protoc. 5:e1592.
Kang, J., Park, J., Choi, H., Burla, B., Kretzschmar, T., Lee, Y., et al. (2011). Plant ABC transporters. Arabidopsis Book 9:e0153. doi: 10.1199/tab.0153
Kaplinsky, N. J., and Barton, M. K. (2004). Plant biology. Plant acupuncture: sticking PINs in the right places. Science 306, 822–823. doi: 10.1126/science.1105534
Keller, C. P., Stahlberg, R., Barkawi, L. S., and Cohen, J. D. (2004). Long-term inhibition by auxin of leaf blade expansion in bean and Arabidopsis. Plant Physiol. 134, 1217–1226. doi: 10.1104/pp.103.032300
Kleine-Vehn, J., Huang, F., Naramoto, S., Zhang, J., Michniewicz, M., Offringa, R., et al. (2009). PIN auxin efflux carrier polarity is regulated by PINOID kinase-mediated recruitment into GNOM-independent trafficking in Arabidopsis. Plant Cell 21, 3839–3849. doi: 10.1105/tpc.109.071639
Korasick, D. A., Enders, T. A., and Strader, L. C. (2013). Auxin biosynthesis and storage forms. J. Exp. Bot. 64, 2541–2555. doi: 10.1093/jxb/ert080
Křeček, P., Skůpa, P., Libus, J., Naramoto, S., Tejos, R., Friml, J., et al. (2009). The PIN-FORMED (PIN) protein family of auxin transporters. Genome Biol. 10:249. doi: 10.1186/gb-2009-10-12-249
Lee, H. W., Kim, N. Y., Lee, D. J., and Kim, J. (2009). LBD18/ASL20 regulates lateral root formation in combination with LBD16/ASL18 downstream of ARF7 and ARF19 in Arabidopsis. Plant Physiol. 151, 1377–1389. doi: 10.1104/pp.109.143685
Lee, S. H., and Cho, H. (2006). PINOID positively regulates auxin efflux in Arabidopsis root hair cells and tobacco cells. Society 18, 1604–1616. doi: 10.1105/tpc.105.035972.great
Massonnet, C., Tisne, S., Radziejwoski, A., Vile, D., De Veylder, L., Dauzat, M., et al. (2011). New insights into the control of endoreduplication: endoreduplication could be driven by organ growth in Arabidopsis leaves. Plant Physiol. 157, 2044–2055. doi: 10.1104/pp.111.179382
Melaragno, J., Mehrotra, B., and Coleman, A. (1993). Relationship between endopolyploidy and cell size in epidermal tissue of Arabidopsis. Plant Cell 5, 1661–1668. doi: 10.1105/tpc.5.11.1661
Mortazavi, A., Williams, B. A., McCue, K., Schaeffer, L., and Wold, B. (2008). Mapping and quantifying mammalian transcriptomes by RNA-Seq. Nat. Methods 5, 621–628. doi: 10.1038/nmeth.1226
Nelissen, H., Moloney, M., and Inzé, D. (2014). Translational research: from pot to plot. Plant Biotechnol. J. 12, 277–285. doi: 10.1111/pbi.12176
Nemhauser, J. L., Hong, F., and Chory, J. (2006). Different plant hormones regulate similar processes through largely nonoverlapping transcriptional responses. Cell 126, 467–475. doi: 10.1016/j.cell.2006.05.050
Nishitani, K., and Vissenberg, K. (2007). “Roles of the XTH protein family in the expanding cell,” in The Expanding Cell Plant Cell Monographs, eds J.-P. Verbelen and K. Vissenberg (Berlin: Springer), 89–116. doi: 10.1007/11536338
Okushima, Y., Fukaki, H., Onoda, M., Theologis, A., and Tasaka, M. (2007). ARF7 and ARF19 regulate lateral root formation via direct activation of LBD/ASL genes in Arabidopsis. Plant Cell 19, 118–130. doi: 10.1105/tpc.106.047761
Paponov, I. A., Paponov, M., Teale, W., Menges, M., Chakrabortee, S., Murray, J. A. H., et al. (2008). Comprehensive transcriptome analysis of auxin responses in Arabidopsis. Mol. Plant 1, 321–337. doi: 10.1093/mp/ssm021
Paponov, I. A., Teale, W., Lang, D., Paponov, M., Reski, R., Rensing, S. A., et al. (2009). The evolution of nuclear auxin signalling. BMC Evol. Biol. 9:126. doi: 10.1186/1471-2148-9-126
Pekker, I., Alvarez, J. P., and Eshed, Y. (2005). Auxin response factors mediate Arabidopsis organ asymmetry via modulation of KANADI activity. Plant Cell 17, 2899–2910. doi: 10.1105/tpc.105.034876
Powell, A. E., and Lenhard, M. (2012). Control of organ size in plants. Curr. Biol. 22, R360–R367. doi: 10.1016/j.cub.2012.02.010
Prinsen, E., Van Laer, S., Öden, S., and Van Onckelen, H. (2000). Auxin analysis. Methods Mol. Biol. 141, 49–65. doi: 10.1385/1-59259-067-5:49
Reinhardt, D., Mandel, T., and Kuhlemeier, C. (2000). Auxin regulates the initiation and radial position of plant lateral organs. Plant Cell 12, 507–518. doi: 10.1105/tpc.12.4.507
Reinhardt, D., Pesce, E. R., Stieger, P., Mandel, T., Baltensperger, K., Bennett, M., et al. (2003). Regulation of phyllotaxis by polar auxin transport. Nature 426, 255–260. doi: 10.1038/nature02081
Robert, H. S., and Offringa, R. (2008). Regulation of auxin transport polarity by AGC kinases. Curr. Opin. Plant Biol. 11, 495–502. doi: 10.1016/j.pbi.2008.06.004
Scarpella, E., Marcos, D., Friml, J., and Berleth, T. (2006). Control of leaf vascular patterning by polar auxin transport. Genes Dev. 20, 1015–1027. doi: 10.1101/gad.1402406
Silk, W. K., and Erickson, R. O. (1979). Kinematics of plant growth. J. Theor. Biol. 76, 481–501. doi: 10.1016/0022-5193(79)90014-6
Stahle, M. I., Kuehlich, J., Staron, L., von Arnim, A. G., and Golz, J. F. (2009). YABBYs and the transcriptional corepressors LEUNIG and LEUNIG_HOMOLOG maintain leaf polarity and meristem activity in Arabidopsis. Plant Cell 21, 3105–3118. doi: 10.1105/tpc.109.070458
Staswick, P. E., Serban, B., Rowe, M., and Tiryaki, I. (2005). Characterization of an Arabidopsis enzyme family that conjugates amino acids to indole-3-acetic acid. Plant Cell 17, 616–627. doi: 10.1105/tpc.104.026690.1
Swarup, R., and Péret, B. (2012). AUX/LAX family of auxin influx carriers-an overview. Front. Plant Sci. 3:225. doi: 10.3389/fpls.2012.00225
Szymanski, D. B. (2014). The kinematics and mechanics of leaf expansion: new pieces to the Arabidopsis puzzle. Curr. Opin. Plant Biol. 22, 141–148. doi: 10.1016/j.pbi.2014.11.005
Taylor, N. G., Howells, R. M., Huttly, A. K., Vickers, K., and Turner, S. R. (2003). Interactions among three distinct CesA proteins essential for cellulose synthesis. Proc. Natl. Acad. Sci. U.S.A. 100, 1450–1455. doi: 10.1073/pnas.0337628100
Thimann, K. V. (1939). Auxins and the inhibition of plant growth. Biol. Rev. 14, 314–337. doi: 10.1111/j.1469-185X.1939.tb00937.x
Thimm, O., Bläsing, O., Gibon, Y., Nagel, A., Meyer, S., Krüger, P., et al. (2004). MAPMAN: a user-driven tool to display genomics data sets onto diagrams of metabolic pathways and other biological processes. Plant J. 37, 914–939. doi: 10.1111/j.1365-313X.2004.02016.x
Usadel, B., Nagel, A., Steinhauser, D., Gibon, Y., Bläsing, O. E., Redestig, H., et al. (2006). PageMan: an interactive ontology tool to generate, display, and annotate overview graphs for profiling experiments. BMC Bioinformatics 7:535. doi: 10.1186/1471-2105-7-535
Van Sandt, V. S. T., Suslov, D., Verbelen, J. P., and Vissenberg, K. (2007). Xyloglucan endotransglucosylase activity loosens a plant cell wall. Ann. Bot. 100, 1467–1473. doi: 10.1093/aob/mcm248
Vandepoele, K., Raes, J., De Veylder, L., Rouze, P., Rombauts, S., and Inzé, D. (2002). Genome-wide analysis of core cell cycle genes in Arabidopsis. Plant Cell 14, 903–916. doi: 10.1105/tpc.010445.primary
Vanhaeren, H., Gonzalez, N., and Inzé, D. (2015). A journey through a leaf: phenomics analysis of leaf growth in Arabidopsis thaliana. Arabidopsis Book 13:e0181. doi: 10.1199/tab.0181
Vernoux, T., Besnard, F., and Traas, J. (2010). Auxin at the shoot apical meristem. Cold Spring Harb. Perspect. Biol. 2:a001487. doi: 10.1101/cshperspect.a001487
Wenzel, C. L., Schuetz, M., Yu, Q., and Mattsson, J. (2007). Dynamics of MONOPTEROS and PIN-FORMED1 expression during leaf vein pattern formation in Arabidopsis thaliana. Plant J. 49, 387–398. doi: 10.1111/j.1365-313X.2006.02977.x
Wisniewska, J., Xu, J., Seifertova, D., Brewer, P. B., Ruzicka, K., Blilou, I., et al. (2006). Polar PIN localization directs auxin flow in plants. Science 312, 883. doi: 10.1126/science.1121356
Wolf, S., Hématy, K., and Höfte, H. (2012). Growth control and cell wall signaling in plants. Annu. Rev. Plant Biol. 63, 381–407. doi: 10.1146/annurev-arplant-042811-105449
Woodward, A. W., and Bartel, B. (2005). Auxin: regulation, action, and interaction. Ann. Bot. 95, 707–735. doi: 10.1093/aob/mci083
Wuyts, N., Palauqui, J.-C., Conejero, G., Verdeil, J.-L., Granier, C., and Massonnet, C. (2010). High-contrast three-dimensional imaging of the Arabidopsis leaf enables the analysis of cell dimensions in the epidermis and mesophyll. Plant Methods 6:17. doi: 10.1186/1746-4811-6-17
Xu, L., Xu, Y., Dong, A., Sun, Y., Pi, L., Xu, Y., et al. (2003). Novel as1 and as2 defects in leaf adaxial-abaxial polarity reveal the requirement for ASYMMETRIC LEAVES1 and 2 and ERECTA functions in specifying leaf adaxial identity. Development 130, 4097–4107. doi: 10.1242/dev.00622
Zhao, Y., Christensen, S. K., Fankhauser, C., Cashman, J. R., Cohen, J. D., Weigel, D., et al. (2001). A role for flavin monooxygenase-like enzymes in auxin biosynthesis. Science 291, 306–309. doi: 10.1126/science.291.5502.306
Keywords: auxin, cell division, cell expansion, kinematic analysis, leaf growth and development, PINOID (PID), RNA-sequencing
Citation: Saini K, Markakis MN, Zdanio M, Balcerowicz DM, Beeckman T, De Veylder L, Prinsen E, Beemster GTS and Vissenberg K (2017) Alteration in Auxin Homeostasis and Signaling by Overexpression Of PINOID Kinase Causes Leaf Growth Defects in Arabidopsis thaliana. Front. Plant Sci. 8:1009. doi: 10.3389/fpls.2017.01009
Received: 07 April 2017; Accepted: 26 May 2017;
Published: 14 June 2017.
Edited by:
Juan Francisco Jimenez Bremont, Instituto Potosino de Investigacion Cientifica y Tecnologica (IPICYT), MexicoReviewed by:
Jianwei Pan, Zhejiang Normal University, ChinaSerena Varotto, University of Padua, Italy
Randy Ortiz-Castro, Institute of Ecology (INECOL), Mexico
Copyright © 2017 Saini, Markakis, Zdanio, Balcerowicz, Beeckman, De Veylder, Prinsen, Beemster and Vissenberg. This is an open-access article distributed under the terms of the Creative Commons Attribution License (CC BY). The use, distribution or reproduction in other forums is permitted, provided the original author(s) or licensor are credited and that the original publication in this journal is cited, in accordance with accepted academic practice. No use, distribution or reproduction is permitted which does not comply with these terms.
*Correspondence: Kris Vissenberg, kris.vissenberg@uantwerpen.be; kris.vissenberg@uantwerp.be