
- Institute of Psychology, Erasmus University Rotterdam, Rotterdam, Netherlands
Several psychological theories assume that there are two basic brain mechanisms that guide behavior: an avoidance or inhibition system, which is responsive to signals of punishment, and an approach or activation system, which is sensitive to signals of reward. Several self-report scales have been developed to assess the sensitivity to punishment and reward, and these instruments have been shown to be useful in research on personality, psychopathology, and underlying biological substrates. However, it is also true that in particular scales for measuring reward responsiveness (RR) suffer from various inadequacies. Therefore, a new RR scale was developed and subjected to an extensive psychometric evaluation. The results show that this scale measures a single factor, RR that is clearly independent of punishment sensitivity. Further, the data indicated that the internal consistency, convergent validity, discriminant validity, test–retest reliability, and predictive properties of the new scale were all adequate. It can be concluded that the RR scale is a psychometrically sound instrument that may be useful for researchers with interest in the personality construct of RR.
Introduction
Gray’s (1976, 1987) original reinforcement sensitivity theory (RST) of personality proposes two main neurobiological systems that guide human motivation, emotion, and behavior. These are the behavioral inhibition system (BIS) and the behavioral approach system (BAS). The BIS is sensitive to conditioned cues which signal the greater than chance probability of punishment or omission and termination of expected reward. The BAS is sensitive to conditioned cues which signal the greater than chance probability of reward or omission and termination of expected punishment. A recent version of the RST (Gray and McNaughton, 2000) discusses the relation between BIS, BAS, and the fight-flight-freezing system (FFFS) in which the configuration of the systems is altered. The BAS system remains related to approach-related behaviors and stimuli, the FFFS is associated with avoidance-related behaviors and stimuli, while the BIS mediates conflicts between approach and avoidance motivations. Other researchers have used different concepts to investigate approach and avoidance motivations (Elliot and Thrash, 2002, 2010). In their view approach temperament is defined as a general neurobiological sensitivity toward positive stimuli, which is associated with perceptual vigilance, affective reactivity, and a behavioral disposition toward such stimuli. Avoidance temperament is defined as a general neurobiological sensitivity toward negative stimuli, which is accompanied by perceptual vigilance, affective reactivity, and a behavioral disposition toward such stimuli. Despite the presence of various different models describing approach and avoidance behavior (see also Cloninger, 1986; Depue and Collins, 1999), they all seem to have in common that responsiveness to reward and punishment are important elements of respectively approach and avoidance systems. Several authors (e.g., Smillie, 2008; DeYoung and Gray, 2009) have stressed the importance of developing more direct measures of approach and avoidance behavior and experiences.
Various studies have shown the value of the approach/avoidance systems in the prediction of human behavior and psychopathology, and demonstrated meaningful associations with underlying biological systems. As for normal behavior, for example, persons with an increased BAS reactivity displayed improved performance on the IOWA gambling task (Franken and Muris, 2005). Another study (Gray and Braver, 2002) showed that individuals scoring high on BAS were more accurate in a working memory task than those who scored low on BAS. Decision making was found to be related to subfactors of BAS in a study using the Ultimatum Game and the Dictator Game (Scheres and Sanfey, 2006). Furthermore, high BIS sensitivity and low BAS sensitivity were linked to avoidance goals in comparison to approach goals (Elliot and Thrash, 2002). Within the context of psychopathology, several studies have shown relations between BIS and BAS and various disorders, including anxiety (Johnson et al., 2003), depression (Henriques et al., 1994; Johnson et al., 2003), psychopathy (Newman et al., 1997), drug addiction (Johnson et al., 2003; Franken et al., 2006), and alcohol craving (Franken, 2002). Further, meaningful associations between biological systems and the BIS and BAS as originally proposed by Gray have been reported in a number of studies (e.g., Beaver et al., 2006; Lee et al., 2007). As such the conclusion seems warranted that approach and avoidance systems have an impact on human behavior both normal and abnormal.
In order to measure the sensitivity to punishment and reward constructs, several questionnaires have been developed. One of the most frequently used instruments for this purpose are the BIS/BAS scales developed by Carver and White (1994). Although there is certainly evidence supporting their utility for assessing individual differences in reward and punishment sensitivity, the BIS/BAS scales have met with various points of conceptual and psychometric critique. To begin with, while both Gray’s original and revised theories posit one neurobiological system referring to reward responsiveness (RR), the BAS scale does not appear to consist of a single factor, but rather seems to be composed of two or three separate components (Leone et al., 2001; Ross et al., 2002; Jackson and Smillie, 2004; Cogswell et al., 2006). Several studies have indicated that two of the components (RR and Drive) are indeed associated with RR, whereas the other component (Fun Seeking) is more related to impulsive sensation seeking (Franken et al., 2006; Smillie and Jackson, 2006), and hence should be treated as a conceptually separate construct from RR (Dawe and Loxton, 2004; Quilty and Oakman, 2004). Further, several studies have reported that the BIS and BAS scales are intercorrelated (Carver and White, 1994; Heubeck et al., 1998 Cogswell et al., 2006), which is not in keeping with Gray’s notion of the original RST that the reward and punishment responsiveness systems are independent of each other.
An alternative measure for assessing responsiveness to reward and punishment is the Sensitivity to Punishment and Sensitivity to Reward Questionnaire (SPSRQ) developed by Torrubia et al. (1995). With regard to this questionnaire, a number of psychometric problems have been noted. Firstly, factor analysis of this scale has revealed various poorly loading items (Torrubia et al., 1995; O’Connor et al., 2004; Cogswell et al., 2006; Cooper et al., 2008). Moreover, when using all items, the hypothesized two-factor structure of the scale did not provide an adequate fit. Even after the removal of problematic items, this model only yielded a moderate fit (Cogswell et al., 2006).
Thus, while the BIS/BAS scales and the SPSRQ both have been developed to measure individual differences in the responsiveness to reward and punishment, there are several conceptual and psychometric reasons for being cautious when using these measures. The main problem of these scales concerns the assessment of RR, which probably has to do with the fact that reward are more individually determined than punishments. That is, what may be rewarding for one individual may be aversive for another person (e.g., certain kinds of food, popular music, or erotica). For punishment responsiveness such inter-individual variation seems less prominent, as most people seem wary for the same types of threatening social and physical events (Lovibond and Rapee, 1993). The more subjective nature of RR is also reflected in the overall lower reliability levels of scales measuring this construct as compared to scales measuring punishment responsiveness (e.g., Franken et al., 2005).
With these issues in mind, the present article describes the development of a psychometrically sound questionnaire for measuring the construct of RR. The widely employed BIS/BAS Scales of Carver and White (1994) were taken as a starting point of this enterprise. The BIS scale was considered to be adequate and was therefore left intact, but being the main goal of the current study the BAS scale was substantially revised in order to establish a scale measuring one single construct: RR. However, since we were interested in developing a scale measuring a construct distinct from responsiveness to punishment or BIS we incorporated the original BIS scale in the factor analyses to examine the independence of these factors and to check whether items of the RR scale do not load on the BIS factor and vice versa. A series of studies was conducted to investigate various aspects of reliability and validity of the new RR scale. Study 1 examined the factor structure of the RR scale in combination with the BIS scale (of the BIS/BAS scales) as well as its internal consistency and convergent validity (by computing correlations with other indices of personality). In Study 2, the factor structure of the RR scale and the BIS scale was further tested by means of a confirmatory factor analysis. In addition, this study further examined aspects of convergent and discriminant validity as participants completed various other relevant questionnaires. Study 3 investigated the test–retest reliability of the RR scale. Finally, since the construct of RR implies that people who score high on this scale have an enhanced brain response when presented with reward, Study 4 examined the predictive power of both the RR scale and the BAS scale of the BIS/BAS scales on a psychophysiological index (Event-Related Potentials) of RR.
Study 1: Factor Structure, Reliability, and Validity
Participants and Procedure
A sample of 198 students (55% female) from Erasmus University Rotterdam volunteered to participate in this study. The mean age of the sample was 21.4 years (SD = 5.5; range 17–60 years). All participants received course credit or a small financial remuneration for completing the set of questionnaires (see below). This study, as well as the other studies reported in this paper, was approved by the Ethical Committee of the Institute of Psychology. All participants provided written informed consent.
Scale Development
A large pool of items was created which were thought to reflect RR, including BAS items from the BIS/BAS scales. The RR item pool was reduced by means of factor analysis in which we also included the BIS items. More precisely, items with low or ambiguous factor loadings were discarded. This process was repetitively employed in order to obtain a brief single factor questionnaire for measuring RR. The response scale of the RR scale was similar to that of the BIS/BAS scales. That is, items are scored on a four-point scale with 1 indicating “strong disagreement,” 2 indicating “mild disagreement,” 3 indicating “mild agreement,” and 4 indicating “strong agreement.”
Instruments
The RR scale consists of 8 items, which are shown in Table 2. Items 1, 2, 3, and 4 are new; items 5, 6, 7, and 8 were already present in the BAS Scale. A total RR score is obtained by summing across relevant items.
Various other questionnaires were administered in order to cross-validate the RR scale. First of all, a Dutch version (Franken et al., 2005) of the original BIS/BAS Scales (Carver and White, 1994) was included. The scales can be divided into two factors, one being the BIS scale measured by seven items, the other being the behavioral activation system (BAS) scale measured by 13 items. The BAS scale is further divided into three subscales: RR measured by five items, Fun Seeking measured by four items and Drive measured by four items. Franken et al. (2005) found moderate to good reliability for the Dutch BIS/BAS scales with Cronbach’s alphas ranging from 0.59 to 0.79.
A Dutch translation (Franken et al., 2007) of the Snaith–Hamilton Pleasure Scale (SHAPS; Snaith et al., 1995) was employed to measure hedonic tone (i.e., anhedonia). The scale consists of 14 items all loading on a single underlying factor. Cronbach’s alpha has been shown to be good, with a value of 0.94 (Franken et al., 2007).
The positive and negative affect schedule (PANAS; Watson et al., 1988) was used to assess positive affect (PA) and negative affect (NA). This questionnaire consists of 20 items that can be allocated to two factors: PA and NA. The first reflects active, alert, and enthusiastic feelings, while the latter reflects perceived distress and unpleasurable mood states (Watson et al., 1988). Psychometric properties for the Dutch version are satisfactory with Cronbach’s alphas of 0.89 for the PA scale and 0.86 for the NA scale (Boon and Peeters, 1999).
The Dickman impulsivity inventory (DII; Dickman, 1990) was included to measure impulsivity. The questionnaire consists of 23 items that can be divided into two factors: functional impulsivity measured by 11 items and dysfunctional impulsivity indexed by 12 items. Psychometric properties of the Dutch version are satisfactory with Cronbach’s alphas of 0.76 for Functional Impulsivity and 0.84 for Dysfunctional Impulsivity (Claes et al., 2000).
The Dutch short version (Sanderman et al., 1991) of the Eysenck Personality Questionnaire (EPQ; Eysenck and Eysenck, 1975) was used to measure the three main personality traits: extraversion, neuroticism, and psychoticism. The psychometric properties of the Dutch EPQ are satisfactory with alphas ranging between 0.51 and 0.83 (Sanderman et al., 1991).
Results
Descriptive statistics
Descriptive statistics of the RR scale can be found in Table 1. Gender differences were tested using independent samples t-tests. No differences were found between males and females on RR.
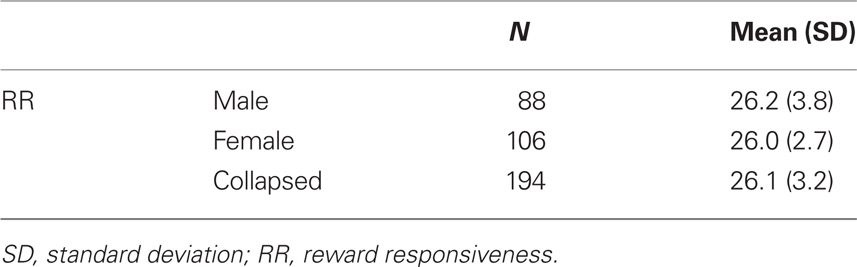
Table 1. Descriptive statistics of the RR scale divided by gender (Study 1).
Factor structure and internal consistency
An exploratory factor analysis was performed on the 15-item version of the RR and the BIS scale. A varimax rotation was employed as RR and BIS are considered to be independent factors. Investigation of the scree plot clearly pointed in the direction of a two-factor solution (eigenvalues of these two factors were 3.5 and 3.1, explaining respectively 23.4 and 20.9% of the variance). All RR scale and BIS items and their factor loadings are reported in Table 2. As expected, items representing RR convincingly loaded on the first factor, whereas items referring to BIS clearly loaded on the second factor. The Cronbach’s alpha of the RR Scale was 0.80, indicating adequate internal consistency.
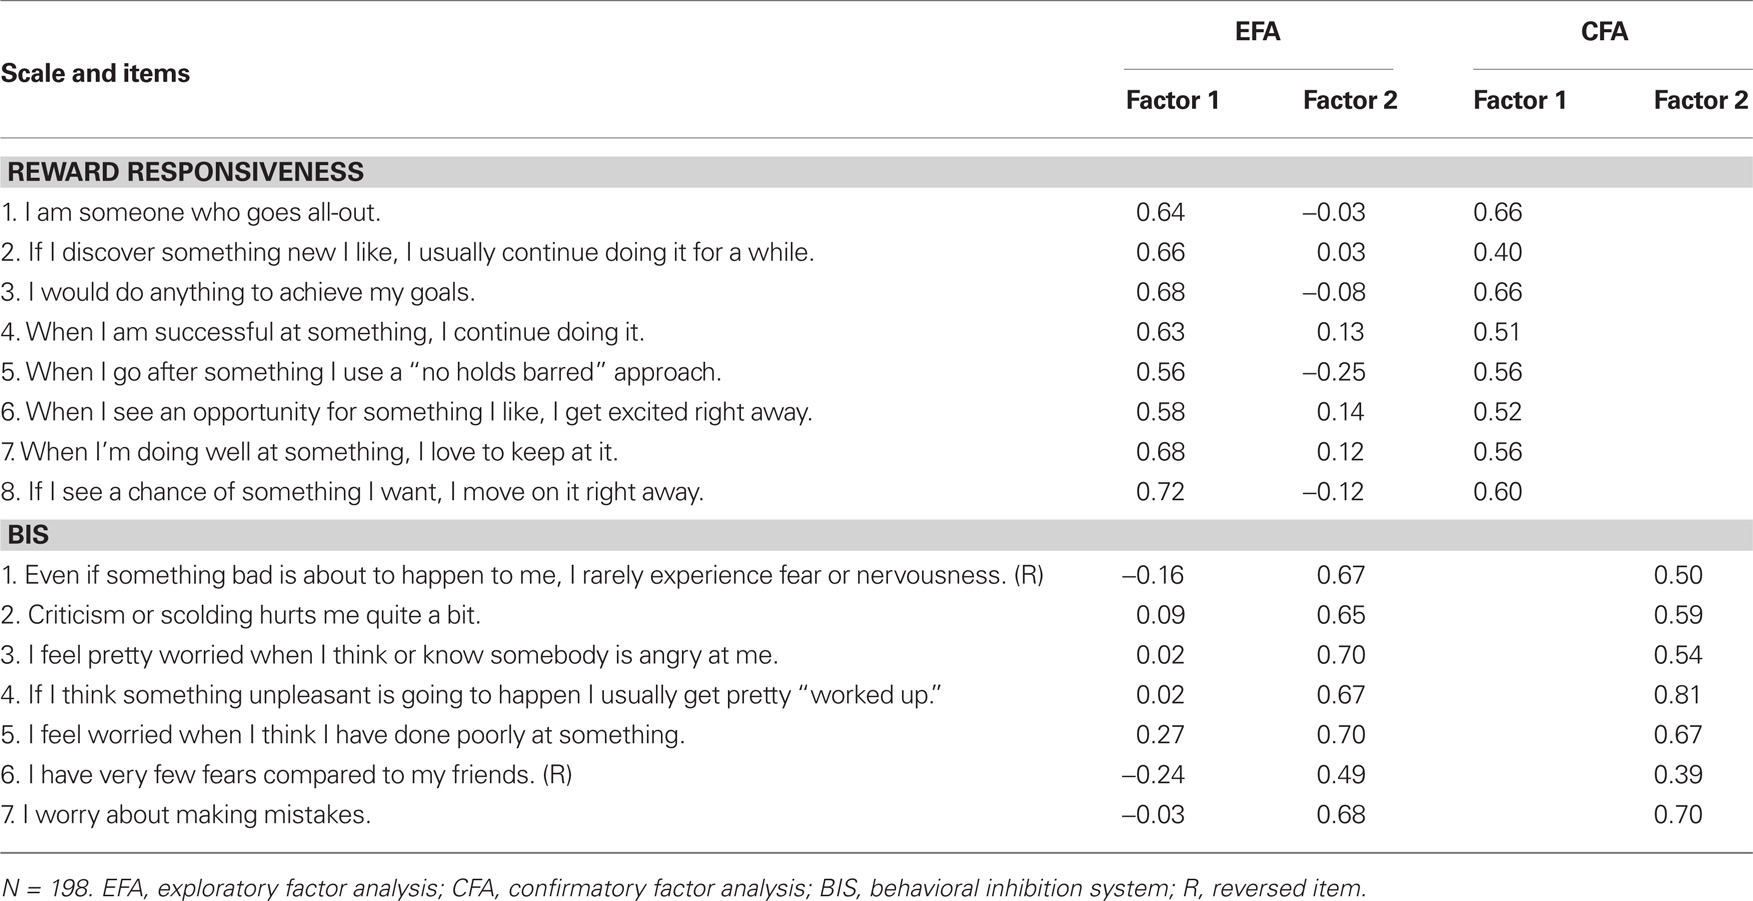
Table 2. Reward responsiveness and BIS scale items and factor loadings obtained with a joint exploratory factor analysis (Study 1) and confirmatory factor analysis (Study 2).
Convergent and discriminant validity
Pearson correlation coefficients between the RR scale and other questionnaires tapping similar or different constructs are reported in Table 3. To begin with, it should be noted that there was no significant correlation between RR and BIS (r = −0.03, p = 0.71). In line with expectations the RR scale correlated positively with BAS Reward (r = 0.68, p < 0.001), BAS Drive (r = 0.70, p < 0.001) and, although to a lesser degree, with BAS Fun (r = 0.35, p < 0.001) of the BIS/BAS scales. No significant correlations were observed between the RR scale and indices of functional and dysfunctional impulsivity and extraversion. As predicted, a positive correlation was observed between RR and PA (r = 0.35, p < 0.001), whereas a negative correlation was found between RR and anhedonia (SHAPS; r = −0.26, p < 0.001).
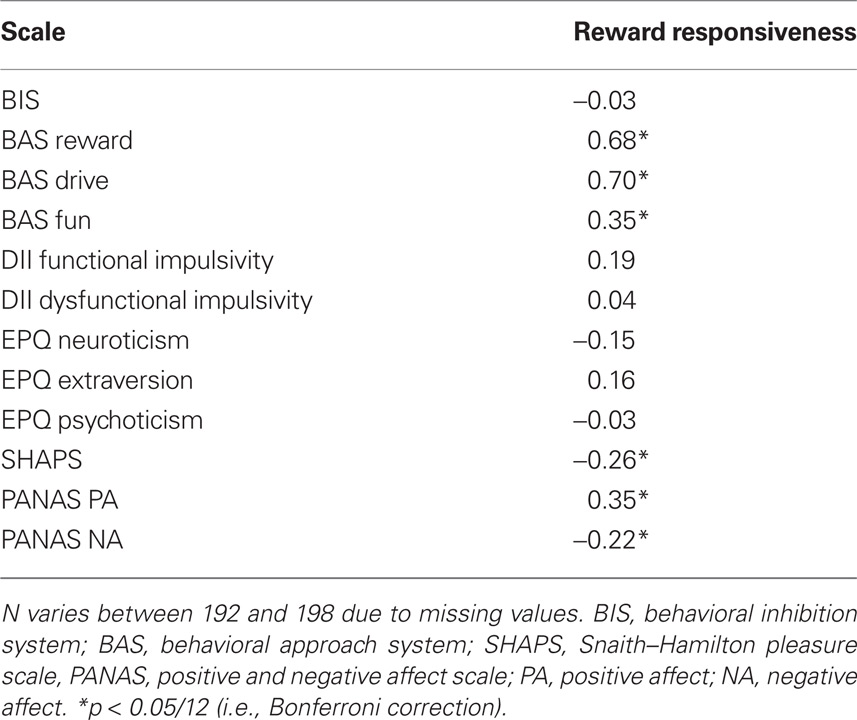
Table 3. Pearson correlation coefficients between the RR scale and various other questionnaires (Study 1).
Discussion
A joint exploratory factor analysis of the RR scale with the BIS scale revealed the expected two-factor structure with one factor representing RR and the other factor referring to BIS, which indicates that these factors are indeed independent. The RR scale was shown to possess good internal consistency. A correlational analysis confirmed that the RR and BIS are unrelated, which provides further support for their desired distinctness. Furthermore, evidence was found showing that the RR scale taps a concept that is strongly associated with BAS as measured by the original BIS/BAS scales. This link was primarily carried by the correlations between RR and BAS drive and BAS RR, which is not surprising as these scales share a number of similar items. RR displayed no or very small correlations with BAS fun seeking and impulsivity, which are supposed to reflect different constructs (see also Dawe and Loxton, 2004; Quilty and Oakman, 2004). The expected relation between extraversion and RR was not found. Since extraversion is usually associated with approach behavior (Elliot and Thrash, 2002), it was hypothesized that this construct would be positively related to RR. The content of the items in the RR scale seems more general and deviates from the content of the fun seeking items in the original scales. Therefore it is likely that the correlation with extraversion is reduced. This is supported by the fact that RR had the smallest correlation with the Fun Seeking subscale, which is more a measure of impulsivity rather than reward sensitivity and normally shows a fairly large correlation with extraversion (e.g., Carver and White, 1994; Heubeck et al., 1998). Finally, earlier findings of a positive relation between RR and PA were replicated (e.g., Carver and White, 1994; Quilty and Oakman, 2004), and this was also true for the negative relation between RR and anhedonia, which refers to the inability to experience pleasure (e.g., Franken and Muris, 2006).
To summarize, Study 1 demonstrated that the RR scale seems to reflect a single factor structure and that the internal consistency of the scale, as indexed by Cronbach’s alpha, was satisfactory. Furthermore, a theoretically meaningful pattern of relations was found with other personality and psychological constructs, suggesting adequate convergent validity. In addition, no correlations were found with constructs measuring different concepts, which provides support for the discriminant validity of the RR scale.
Study 2: Confirmatory Factor Analysis and Validity
Participants and Procedure
A second sample of 251 participants (78% females) was recruited among psychology students from Erasmus University Rotterdam. Mean age of these participants was 22.2 years (SD = 6.9; range 17–61 years). All participants received course credits or a small financial compensation for completing a set of questionnaires (see below).
Instruments
Besides the RR and BIS scale, participants were asked to complete the SPSRQ (Torrubia et al., 1995), a 48-item self-report scale also measuring sensitivity to reward and sensitivity to punishment. Despite the limitations noted in the introduction, this measure was included due to its frequent use in research. It has some psychometric limitations (Cogswell et al., 2006), although a previous study by Franken and Muris (2006) obtained adequate Cronbach’s alphas of 0.70 for the SR-Scale and 0.84 for the SP-Scale.
A Dutch translation of the Brief Sensation Seeking Scale (BSSS; Hoyle et al., 2002) was administered to assess individual differences in sensation seeking. The scale consists of eight items that measure four aspects of sensation seeking: experience seeking, boredom susceptibility, thrill and adventure seeking, and disinhibition. Hoyle et al. (2002) reported a Cronbach’s alpha of 0.76, which indicates adequate internal consistency.
A Dutch version (Arrindell et al., 1991) of the Satisfaction With Life Scale (SWLS; Diener et al., 1985) was employed to measure how satisfied participants were with their life. The SWLS is a five-item scale representing a single factor. The Dutch version has shown satisfactory internal consistency with a Cronbach’s alpha of 0.87 (Arrindell et al., 1991).
Statistical Analysis
A maximum likelihood confirmatory factor analysis using Amos 6.0 (Arbuckle, 2005) was conducted to test the hypothesized two-factor model of the RR and BIS scale. Model fit was evaluated using the following goodness-of-fit indexes (GFI): the chi-square per degree of freedom (χ2/df) ratio, the comparative fit index (CFI), the GFI, the root mean square error of approximation (RMSEA), and the standardized root mean square residual (RMR). Concerning the χ2/df index, a value of less than 3 indicates good fit (Byrne, 2001). CFI and GFI values range between 0 and 1, where values approaching 1 indicate an excellent fit. Models with a value of 0.90 can be considered as adequately fitting. A RMSEA value of 0.08 or lower also indicates that a model which can be considered as adequately fitting. It is favored, however, to obtain lower values (≤0.05). A RMR value of 0.05 or lower indicates close model fit (Byrne, 2001; Hu and Bentler, 1999). These criteria can be considered as quite stringent when using small samples (N < 250) and values approximating the above described can therefore be considered as satisfactory in such cases (Marsh et al., 2004).
Results
Factor structure and internal consistency
Confirmatory factor analysis revealed a moderate fit for the RR and BIS scale. That is, a χ2 value of 250.17 (df = 90, p < 0.001) was obtained. Other fit indices were: χ2/df = 2.78, CFI = 0.84, GFI = 0.88, RMSEA = 0.08, and RMR = 0.04. The model significantly improved when the two reversed items (i.e., items 2 and 12) were allowed to correlate. The χ2 value was 206.66 (df = 89, p < 0.001). Values of the other indices were: χ2/df = 2.32, CFI = 0.88, GFI = 0.90, RMSEA = 0.07, and RMR = 0.04. These indices indicate a reasonably satisfactory fit, when applying the criteria for small sample sizes (Marsh et al., 2004). Internal consistency coefficients were similar to those obtained in Study 1 with Cronbach’s alphas of 0.78 for the RR scale and 0.81 for the RP scale.
Convergent and discriminant validity
Correlations between the RR scale and other questionnaires are reported in Table 4. Firstly, no correlation was found between RR and RP. Secondly, as could be expected the RR scale correlated positively with the sensitivity to reward scale of the SPSRQ (r = 0.28) and the SWLS (r = 0.27). Importantly, the RR scale was not correlated with sensation seeking. Finally, the RR scale correlated negatively with the sensitivity to punishment scale of the SPSRQ (r = −0.38).
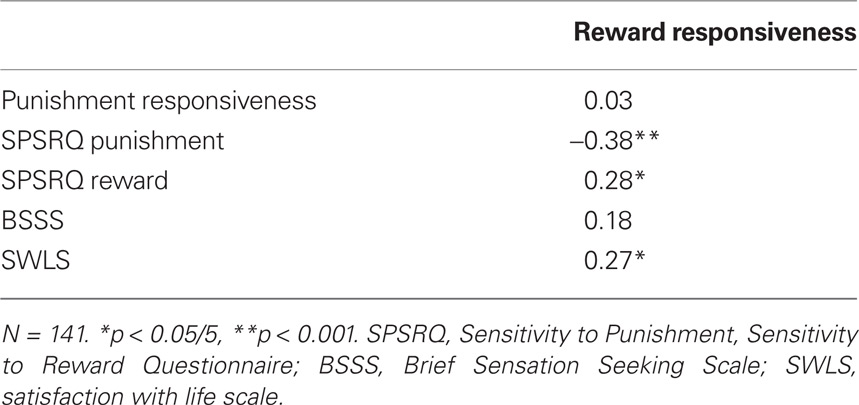
Table 4. Pearson correlation coefficients between the RR scale and other scales (Study 2).
Discussion
Results of the confirmatory factor analysis indicated that the hypothesized two-factor model for the RR and BIS scale provided an adequate fit for the data, thereby extending the findings of Study 1. Furthermore, results again showed that the RR scale had good internal consistency. Thus altogether, it can be concluded that the proposed two-factor structure and their independence is corroborated by the results of Study 1 and 2.
The RR factor was related to the sensitivity to reward scale of the SPSRQ, suggesting overlap between these constructs, which should not be surprising. The RR scale was also associated with the SWLS, suggesting that individuals with higher levels of RR display higher levels of life satisfaction. This is in concordance with earlier findings showing that higher levels of reward sensitivity are associated with high levels of PA (Carver and White, 1994; Heubeck et al., 1998; Jorm et al., 1999). Further, the results suggest that our RR scale is independent of impulsive sensation seeking as measured with the BSSS which can be expected if one assumes that RR is different from impulsive sensation seeking (Dawe and Loxton, 2004). A significant negative correlation was observed between RR and Sensitivity to Punishment, indicating that the independence of RR and RP is not fully guaranteed, when the SPSRQ is utilized.
In sum, it can be concluded that independence of RR and BIS was confirmed and that the internal consistency of the RR scale was good. The convergent and discriminant validity was further supported by the observed correlations with related measures, and the absence of links with scales measuring other constructs.
Study 3: Test–Retest Reliability
Participants and Procedure
A separate sample of 36 participants (undergraduate psychology students from Erasmus University Rotterdam, 89% female) was asked to complete the RR scale twice with an interval of 5 weeks. Participation was voluntary; all participants received a snack after completing the RR scale on both occasions.
Results
Mean RR scores on the first and second occasion were 27.2 (SD = 2.7) and 26.9 (SD = 3.0) [t(35) = 1.32, p > 0.20]. This implies that the RR scale scores did not change significantly over the 5-week period. The intraclass correlation coefficient (ICC) was 0.88 (p < 0.001), indicating good test–retest stability. Cronbach’s alphas were 0.71 on the first occasion and 0.81 on the second occasion.
Discussion
Results of the test–retest analysis revealed a high ICC value for the RR scale, indicating good test–retest reliability. The results provide further support for the psychometric properties of this scale.
Study 4: Association between RR, BAS, and Event-Related Brain Potentials
Participants and Procedure
The P3 (or P300) is an electrophysiological (ERP) index of reward, which can be seen in response to monetary reward (e.g., Goldstein et al., 2006). Data from a previous study (Van den Berg et al., in press) were re-analyzed to investigate the relation between the RR scale and the original BAS scale of the BIS/BAS scales as self-report measures of approach and an ERP index of cortical RR. In that study, a sample of 42 participants was asked to complete a bogus gambling task in which an environment with equally occurring reward and punishments was created. During each trial five doors were presented and participants were instructed to open one of those doors to see which monetary outcome was behind it. The different outcomes were winning a small amount (+5 cents), winning a large amount (+25 cents), losing a small amount (−5 cents), losing a large amount (−25 cents), or breaking even (0 cents). Upon making a choice, participants received feedback on the outcome. These positive outcomes generate a P3 response (Van den Berg et al., in press), reflecting the cortical responsiveness to reward. A total of four blocks of 40 trials were presented, after a practice phase of five trials. Subjects started with €5 in their bank and were informed that the trial outcomes of their choices were added or deducted from their bank. However, unbeknown to the participants, their choice had no influence on the outcome, since outcomes occurred equally often in a pseudo-random fashion. To examine the psychophysiological correlates of the RR scale, a regression analysis was carried out, in which the RR scale score and the original BAS scale score were examined as predictors of the average P3-component in response to win outcomes. Then in subsequent regression analyses the RR scale was compared to the BAS-subscales.
Results
The regression analyses predicting the P3 amplitude to reward outcomes revealed that only the RR score accounted for a unique significant proportion of the variance to rewarding trials (β = 0.49; t = 2.54; p < 0.05; 33.5%), whereas the BAS-total score did not (β = 0.11; t = 0.56; p > 0.05). The subscales BAS Drive and BAS Fun did not have predictive value for the P3 amplitude. However, in the regression analysis with RR and BAS Reward as predictors both scales predicted P3 amplitude (β = 0.37; t = 2.35; p < 0.05 and β = 0.34; t = 2.16; p < 0.05 respectively). To investigate which scale was the best predictor of the P3 amplitude, a stepwise regression was performed with RR and BAS Reward as predictors of P3 amplitude to win outcomes. The results showed that RR was the best predictor variable (β = 0.56; t = 4.26; p < 0.01).
Discussion
The results of the regression analysis show that the RR scale to some extent predicted ERP responses to reward. Note also that the original BAS scale made no significant contribution and that the predictive power of the BAS Reward subscale was not as good as that of the RR scale. This leads to the conclusion that the RR scale is better in predicting ERP responding to reward, and as such seems to be a useful tool for measuring the brain’s RR.
General Discussion
The present study investigated the psychometric properties the RR scale for measuring the construct of RR. Results of exploratory and confirmatory factor analyses supported the hypothesized single factor structure of the questionnaire and the distinctness from BIS. Importantly, the RR scale seems to tap a one-dimensional construct, which is distinct from rash impulsivity (Dawe and Loxton, 2004). In our opinion this is an advancement as compared to other questionnaires measuring BAS or RR, which generally appear to have multiple components. Furthermore, no correlations were found between RR and BIS, suggesting that these concepts are unrelated. Further, theoretically meaningful correlations were found with various other scales of interest, which mostly supported the convergent and discriminant validity of the scale. The test–retest reliability of the new scale also proved to be satisfactory. Scores hardly changed over time, which is consistent with the trait-like nature of RR. Cronbach’s alpha of the scale was also satisfactory, indicating that the scale has good internal consistency. Finally, the predictive power of the RR scale was superior to that of the original BAS scale when validating this measure against a cortical index of RR. Thus, on the whole the RR scale shows somewhat more advantageous psychometric properties in comparison to earlier questionnaires for measuring BAS and RR constructs.
One of the limitations of the current study is that a Dutch questionnaire was used since all samples were tested in the Netherlands. The questionnaire therefore has to be validated in an English-speaking sample as well. However, it is unlikely that these results deviate substantially from the current findings because other translations of punishment and reward sensitivity questionnaires show similar psychometric results as their original versions (e.g., Franken et al., 2005).
To summarize, the RR scale seems to have some advantages as compared to the BAS Scale of the BIS/BAS scales (Carver and White, 1994) and the SPSRQ (Torrubia et al., 1995). Concerning the factor structure of the questionnaire, the hypothesized single factor structure is present in the RR scale, while this is not the case for the original BIS/BAS Scales. Although the SPSRQ also contains one single factor measuring reward sensitivity, this scale contains various poorly loading items and even when these are removed the model fit is still at best moderate (Cogswell et al., 2006). When looking at internal consistency no large differences in results between the three scales emerge (i.e., all alphas generally are in the 0.70–0.80 range). Finally, the predictive power of the RR scale is superior to that of the BAS scale concerning the cortical responses to win outcomes during a gambling task. It therefore can be concluded that the RR scale is an adequate questionnaire for measuring levels of responsivity to reward with a fairly favorable pattern of psychometric qualities. The RR scale seems to be an improvement as compared to other questionnaires measuring reward-related traits.
Conflict of Interest Statement
The authors declare that the research was conducted in the absence of any commercial or financial relationships that could be construed as a potential conflict of interest.
References
Arrindell, W. A., Meeuwesen, L., and Huyse, F. J. (1991). The satisfaction with life scale (SWLS): psychometric properties in a non-psychiatric medical outpatients sample. Pers. Individ. Dif. 12, 117–123.
Beaver, J. D., Lawrence, A. D., Van Ditzhuijzen, J., Davis, M. H., Woods, A., and Calder, A. J. (2006). Individual differences in reward drive predict neural responses to images of food. J. Neurosci. 26, 5160–5166.
Boon, M. T. G., and Peeters, F. P. M. L. (1999). Dimensions of affectivity in depression and anxiety. Tijdschr. Psychiatr. 41, 109–113.
Byrne, B. M. (2001). Structural Equation Modeling with Amos. Basic concepts, applications, and programming. Mahwah, NJ: Lawrence Erlbaum Associates.
Carver, C. S., and White, T. L. (1994). Behavioral inhibition, behavioral activation, and affective responses to impending reward and punishment: the BIS/BAS scales. J. Pers. Soc. Psychol. 67, 319–333.
Claes, L., Vertommen, H., and Braspenning, N. (2000). Psychometric properties of the Dickman impulsivity inventory. Pers. Individ. Dif. 29, 27–35.
Cloninger, C. R. (1986). A unified biosocial theory of personality and its role in the development of anxiety states. Psychiatr. Dev. 4, 167–226.
Cogswell, A., Alloy, L. B., van Dulmen, M. H. M., and Fresco, D. M. (2006). A psychometric evaluation of behavioral inhibition and approach self-report measures. Pers. Individ. Dif. 40, 1649–1658.
Cooper, A. J., Smillie, L. D., and Jackson, C. J. (2008). A trait conceptualization of reward-reactivity: psychometric properties of the appetitive motivation scale (AMS). J. Individ. Differ. 29, 168–180.
Dawe, S., and Loxton, N. J. (2004). The role of impulsivity in the development of substance use and eating disorders. Neurosci. Biobehav. Rev. 28, 343–351.
Depue, R. A., and Collins, P. F. (1999). Neurobiology of the structure of personality: dopamine, facilitation of incentive motivation, and extraversion. Behav. Brain Sci. 22, 491–517.
DeYoung, C. G., and Gray, J. R. (2009). “Personality neuroscience: explaining individual differences in affect, behavior, and cognition,” in The Cambridge Handbook of Personality Psychology, eds P. J. Corr and G. Matthews (New York: Cambridge University Press).
Dickman, S. J. (1990). Functional and dysfunctional impulsivity: personality and cognitive correlates. J. Pers. Soc. Psychol. 58, 95–102.
Diener, E., Emmons, R. A., Larsen, R. J., and Griffin, S. (1985). The satisfaction with life scale. J. Pers. Assess. 49, 71–75.
Elliot, A. J., and Thrash, T. M. (2002). Approach-avoidance motivation in personality: approach and avoidance temperaments and goals. J. Pers. Soc. Psychol. 82, 804–818.
Elliot, A. J., and Thrash, T. M. (2010). Approach and avoidance temperament as basic dimensions of personality. J. Pers. 78, 865–906.
Eysenck, H. J., and Eysenck, S. B. G. (1975). The Manual of the Eysenck Personality Questionnaire. London: Hodder and Stoughton.
Franken, I. H. A. (2002). Behavioral approach system (BAS) sensitivity predicts alcohol craving. Pers. Individ. Dif. 32, 349–355.
Franken, I. H. A., and Muris, P. (2005). Individual differences in decision-making. Pers. Individ. Dif. 39, 991–998.
Franken, I. H. A., and Muris, P. (2006). Gray’s impulsivity dimension: a distinction between reward sensitivity versus rash impulsiveness. Pers. Individ. Dif. 40, 1337–1347.
Franken, I. H. A., Muris, P., and Georgieva, I. (2006). Gray’s model of personality and addiction. Addict. Behav. 31, 399–403.
Franken, I. H. A., Muris, P., and Rassin, E. (2005). Psychometric properties of the Dutch BIS/BAS scales. J. Psychopathol. Behav. Assess. 27, 25–30.
Franken, I. H. A., Rassin, E., and Muris, P. (2007). The assessment of anhedonia in clinical and non-clinical populations: further validation of the Snaith–Hamilton pleasure scale (SHAPS). J. Affect. Disord. 99, 83–89.
Franken, I. H. A., Van Strien, J. W., and Nijs, I. M. T. (2006). Effect of hedonic tone on event-related potential measures of cognitive processing. Psychiatry Res. 142, 233–239.
Goldstein, R. Z., Cottone, L. A., Jia, Z., Maloney, T., Volkow, N. D., and Squires, N. K. (2006). The effect of graded monetary reward on cognitive event-related potentials and behavior in young adults. Int. J. Psychophysiol. 62, 272–279.
Gray, J. A. (1976). “The behavioral inhibition system: a possible substrate for anxiety,” in Theoretical and Experimental Bases of Behavior Modification, eds M. P. Feldman and A. M. Broadhurst (London: Wiley), 3–41.
Gray, J. A., and McNaughton, N. (2000). The Neuropsychology of Anxiety: An Enquiry into Functions of the Septo-hippocampal System. Oxford: Oxford University Press.
Gray, J. R., and Braver, T. S. (2002). Personality predicts working-memory-related activation in the caudal anterior cingulate cortex. Cogn. Affect. Behav. Neurosci. 2, 64–75.
Henriques, J. B., Glowacki, J. M., and Davidson, R. J. (1994). Reward fails to alter response bias in depression. J. Abnorm. Psychol. 103, 460–464.
Heubeck, B. G., Wilkinson, R. B., and Cologon, J. (1998). A second look at Carver and White’s (1994) BIS/BAS scales. Pers. Individ. Dif. 25, 785–800.
Hoyle, R. H., Stephenson, M. T., Palmgreen, P., Lorch, E. P., and Donohew, R. L. (2002). Reliability and validity of a brief measure of sensation seeking. Pers. Individ. Dif. 32, 401–414.
Hu, L. T., and Bentler, P. M. (1999). Cutoff criteria for fit indices in covariance structure analysis: conventional criteria versus new alternatives. Struct. Equ. Modeling 6, 1–55.
Jackson, C. J., and Smillie, L. D. (2004). Appetitive motivation predicts the majority of personality and an ability measure: a comparison of BAS measures and a re-evaluation of the importance of RST. Pers. Individ. Dif. 36, 1627–1636.
Johnson, S. L., Turner, R. J., and Iwata, N. (2003). BIS/BAS levels and psychiatric disorder: an epidemiological study. J. Psychopathol. Behav. Assess. 25, 25–36.
Jorm, A. F., Christensen, H., Henderson, A. S., Jacomb, P. A., Korten, A. E., and Rodgers, B. (1999). Using the BIS/BAS scales to measure behavioural inhibition and behavioural activation: factor structure, validity and norms in a large community sample. Pers. Individ. Dif. 26, 49–58.
Lee, S. H., Ham, B. J., Cho, Y. H., Lee, S. M., and Shim, S. H. (2007). Association study of dopamine receptor D2TaqI A polymorphism and reward-related personality traits in healthy Korean young females. Neuropsychobiology 56, 146–151.
Leone, L., Perugini, M., Bagozzi, R. P., Pierro, A., and Mannetti, L. (2001). Construct validity and generalizability of the Carver–White behavioural inhibition system/behavioural activation system scales. Eur. J. Pers. 15, 373–390.
Lovibond, P. F., and Rapee, R. M. (1993). The representation of feared outcomes. Behav. Res. Ther. 31, 595–608.
Marsh, H. W., Hau, K. T., and Zhonglin, W. (2004). In search of golden rules: comment on hypothesis-testing approaches to setting cutoff values for fit indexes and dangers in overgeneralizing Hu and Bentler’s (1999) findings. Struct. Equ. Modeling 11, 320–341.
Newman, J. P., Wallace, J. F., Schmitt, W. A., and Arnett, P. A. (1997). Behavioral inhibition system functioning in anxious, impulsive and psychopathic individuals. Pers. Individ. Dif. 23, 583–592.
O’Connor, R. M., Colder, C. R., and Hawk, L. W. Jr. (2004). Confirmatory factor analysis of the sensitivity to punishment and sensitivity to reward Questionnaire. Pers. Individ. Dif. 37, 985–1002.
Quilty, L. C., and Oakman, J. M. (2004). The assessment of behavioural activation – the relationship between positive emotionality and the behavioural activation system. Eur. J. Pers. 18, 557–571.
Ross, S. R., Millis, S. R., Bonebright, T. L., and Bailley, S. E. (2002). Confirmatory factor analysis of the behavioral inhibition and activation scales. Pers. Individ. Dif. 33, 861–865.
Sanderman, R., Arrindell, W. A., Ranchor, A. V., Eysenck, H. J., and Eysenck, S. B. G. (1991). Eysenck Personality Questionnaire (EPQ). Groningen: Noordelijk Centrum voor Gezondheidsvraagstukken.
Scheres, A., and Sanfey, A. G. (2006). Individual differences in decision making: drive and reward responsiveness affect strategic bargaining in economic games. Behav. Brain Funct. 2, 35.
Smillie, L. D. (2008). What is reinforcement sensitivity? Neuroscience paradigms for approach-avoidance process theories of personality. Eur. J. Pers. 22, 359–384.
Smillie, L. D., and Jackson, C. J. (2006). Functional impulsivity and reinforcement sensitivity theory. J. Pers. 74, 47–83.
Snaith, R. P., Hamilton, M., Morley, S., Humayan, A., Hargreaves, D., and Trigwell, P. (1995). A scale for the assessment of hedonic tone the Snaith–Hamilton pleasure scale. Br. J. Psychiatry 167, 99–103.
Torrubia, R., Avila, C., Molto, J., and Grande, I. (1995). “Testing for stress and happiness: the role of the behavioral inhibition system,” in In Stress and Emotion: Anxiety, Anger and Curiosity, Vol. 15, eds C. D. Spielberg, I. G. Sarason, J. Brebner, E. Greenglass, P. Langani, and A. M. O’Roark (Washington, DC: Taylor and Francis), 189–211.
Van den Berg, I., Franken, I. H. A., and Muris, P. (in press). Individual differences in sensitivity to reward are associated with electrophysiological responses to monetary gains and losses. J. Psychophysiol.
Keywords: reward responsiveness scale, approach and activation, validity, reliability
Citation: Van den Berg I, Franken IHA and Muris P (2010) A new scale for measuring reward responsiveness. Front. Psychology 1:239. doi: 10.3389/fpsyg.2010.00239
Received: 18 May 2010;
Accepted: 20 December 2010;
Published online: 31 December 2010.
Edited by:
Colin G. Deyoung, University of Minnesota, USACopyright: © 2010 Van den Berg, Franken and Muris. This is an open-access article subject to an exclusive license agreement between the authors and the Frontiers Research Foundation, which permits unrestricted use, distribution, and reproduction in any medium, provided the original authors and source are credited.
*Correspondence: Ivo Van den Berg, Institute of Psychology, Erasmus University Rotterdam, P.O. Box 1738, 3000 DR Rotterdam, Netherlands.e-mail: i.vandenberg@fsw.eur.nl