 Danielle A. Baribeau
 Evdokia Anagnostou
- 1Department of Psychiatry, University of Toronto, Toronto, ON, Canada
- 2Autism Research Centre, Bloorview Research Institute, University of Toronto, Toronto, ON, Canada
Background: Autism spectrum disorder (ASD) and childhood onset schizophrenia (COS) are pediatric neurodevelopmental disorders associated with significant morbidity. Both conditions are thought to share an underlying genetic architecture. A comparison of neuroimaging findings across ASD and COS with a focus on altered neurodevelopmental trajectories can shed light on potential clinical biomarkers and may highlight an underlying etiopathogenesis.
Methods: A comprehensive review of the medical literature was conducted to summarize neuroimaging data with respect to both conditions in terms of structural imaging (including volumetric analysis, cortical thickness and morphology, and region of interest studies), white matter analysis (include volumetric analysis and diffusion tensor imaging) and functional connectivity.
Results: In ASD, a pattern of early brain overgrowth in the first few years of life is followed by dysmaturation in adolescence. Functional analyses have suggested impaired long-range connectivity as well as increased local and/or subcortical connectivity in this condition. In COS, deficits in cerebral volume, cortical thickness, and white matter maturation seem most pronounced in childhood and adolescence, and may level off in adulthood. Deficits in local connectivity, with increased long-range connectivity have been proposed, in keeping with exaggerated cortical thinning.
Conclusion: The neuroimaging literature supports a neurodevelopmental origin of both ASD and COS and provides evidence for dynamic changes in both conditions that vary across space and time in the developing brain. Looking forward, imaging studies which capture the early post natal period, which are longitudinal and prospective, and which maximize the signal to noise ratio across heterogeneous conditions will be required to translate research findings into a clinical environment.
Introduction
Autism spectrum disorder (ASD) is a neurodevelopmental disorder of increasing prevalence in the modern era. Presently, this condition is reported to affect 1 in 88 individuals (1). Manifested by social communication deficits and restricted or repetitive interests and behaviors, children with ASD present along a wide spectrum of clinical severity, from mild social difficulties to severe functional impairment. This condition typically presents in the first 3 years of life, manifested by a failure to gain, or a loss of, social communication milestones.
Childhood onset schizophrenia (COS), on the other hand, is a relatively rare disorder, affecting 1 in 10,000–30,000 children (2). The diagnostic criteria are the same as in adult onset schizophrenia, including the presence of positive and/or negative symptoms (3), but with onset occurring prior to the 13th birthday (4). Despite clinical heterogeneity, COS typically presents with psychotic symptoms after age seven, and is associated with a more severe course and poorer outcomes as compared to adult onset schizophrenia (2).
Although presently considered to separate clinical entities, prior to the twentieth century, catatonia, social withdrawal, bizarre behavior, and/or psychosis in children were considered undifferentiated conditions, labeled as “hereditary insanity,” “dementia praecox,” or “developmental idiocy” (5). With the onset of contemporary nosology, “autistic behavior and social withdrawal” were initially specified as features of “childhood schizophrenia” in the first and second editions of the Diagnostic and Statistical Manual of Mental Disorder (DSM-I and -II). Although formally defined as separate entities in DSM-III (6), at present the DSM-5 permits concurrent diagnosis of both conditions, should an individual with ASD subsequently develop prominent delusions or hallucinations (3).
In the current review, a comparison between ASD and COS was chosen for several reasons. Firstly, children with co-occurring and overlapping symptoms complicate a diagnosis (2, 4). At times, a period of medication washout and inpatient observation is required to achieve a diagnostic consensus (7), further supporting a need for brain based biomarkers of disease state and treatment response. Indeed, over one quarter of patients diagnosed with COS display prodromal neurodevelopmental disturbances, meeting criteria for pervasive developmental disorder, or ASD (8, 9). Children diagnosed with ASD are more likely to report psychotic symptoms in adolescence and adulthood (10, 11), although the exact incidence of a subsequent diagnosis of schizophrenia varies by study, ranging from 0 to 7% (12–14). From a neuroimaging perspective, analysis of atypical brain “growth curves” may afford an opportunity for early identification and risk stratification; consistent with the present goal of moving toward biologically based diagnostic categories in neuropsychiatric disease.
Secondly, a growing body of literature supports a neurodevelopmental origin of both schizophrenia and autism, with a shared genetic architecture contributing to, or precipitating, the development of both conditions (15, 16). Some have hypothesized that ASD and schizophrenia are diametrically opposed with respect to underlying pathology (17). While adult onset schizophrenia and ASD have been compared in previous reviews [see Ref. (18)], a focus on COS specifically permits a more in-depth analysis of aberrant neurodevelopmental trajectories across comparable age ranges, which may provide insight into disease pathogenesis.
This review intends to translate several decades of neuroimaging research for a clinical audience, to highlight our current understanding of similarities and differences in the clinicopathogenesis of ASD and COS from a neuroimaging perspective. To our knowledge, this is the first focused review of neuroimaging findings in ASD and COS.
Structural MRI Studies (Volumetric Analysis, Cortical Thickness and Morphology, and Region of Interest Studies)
Volumetric Analysis
Structural magnetic resonance imaging (MRI) analysis for neuropsychiatric diseases began to emerge in the 1990s. Early trials employed manual delineation of gray and white matter to investigate specific regions of interest. With advancement in high resolution MRI technology and automated analysis, voxel-based morphometry (VBM) made it possible to quantify the specific gray matter content of each voxel (a volumetric pixel) in an image, allowing large data sets to be processed more efficiently (19). For statistical comparisons between case and control populations, images are “warped” onto a common template, and the degree of transposition of each voxel can be quantified. Inferences must be heeded with the consideration that the relative volumetric differences by region can vary by age, gender, whole brain volume, and by IQ, thus the degree to which these factors have been controlled for must be kept in mind.
Volumetric analysis in COS
Initial trials conducted by the National Institute of Mental Health (NIMH) on a cohort of children with COS, identified a pattern of reduced cerebral volumes and larger ventricles, consistent with findings in the adult onset schizophrenia population (20). With expansion and longitudinal analysis of this patient sample, investigators were able to localize and describe patterns of change in brain structure and volume over time. While typically developing children were found to have a small decrease in cortical gray matter (~2%) in the frontal and parietal regions throughout adolescence, children with COS displayed exaggerated gray matter losses (~8%), involving the frontal, parietal, and temporal lobes. Of note, baseline IQ varied significantly between case and control groups in this data set (70 vs. 124) (21).
Subsequent analysis on the same NIMH sample (n = 60 patients), suggested that this pattern took on a “back to front” trajectory, with losses originating in the parietal lobes and spreading anteriorly over time (22). This pattern persisted after controlling for IQ and medication administration (23). Despite significant differences at an early age, the rate of gray matter loss was shown to level off in early adulthood, implicating adolescent neurodevelopment as a key window in disease pathogenesis (22, 24). This data is consistent with hypotheses pertaining to exaggerated synaptic pruning as a feature of schizophrenia (25).
Later work by the same group demonstrated that the above-described pattern was specific for COS. Using VBM, 23 COS patients were compared to 38 age and gender matched healthy control subjects and 19 patients with other psychotic symptoms but not meeting criteria for COS, defined as “multidimensionally impaired” (MDI). MRI scans were conducted at study intake, and at 2.5 years follow up. The MDI group had equal exposure to neuroleptics at study intake, and had a similar degree of cognitive impairment. Total gray matter loss between the two time points demonstrated 5.1% loss for COS patients, 0.5% loss for MDI patients, and 1.5% loss for healthy control subjects. Thus, exaggerated gray matter loss during adolescence was considered to be a potential biomarker of COS (26).
There is very little literature looking at infants or toddlers who subsequently develop schizophrenia, given the methodological complexities of such a study. That being said, offspring of mothers with schizophrenia were found on average to have larger intracranial volumes, greater volumes of CSF, and greater gray matter volume on structural MRI in male neonates, compared to controls, although controlling for total intracranial volume resulted in all differences being non-significant (27).
Volumetric analysis in ASD
In ASD, earlier studies suggested a pattern of increased total brain volume, as well as increased ventricle size (28–30). Analyses across age ranges helped to further elucidate the chronology of this brain overgrowth picture. Indeed, exaggerated gray and white matter volumes seemed most pronounced in younger children, while older children with ASD had more typically appearing brains, when compared to their peers (31, 32) (see Figure 1). The hypothesis of brain overgrowth correlated with the measureable increase in rate of growth of head circumference during the first few years of life as well in this population (33, 34).
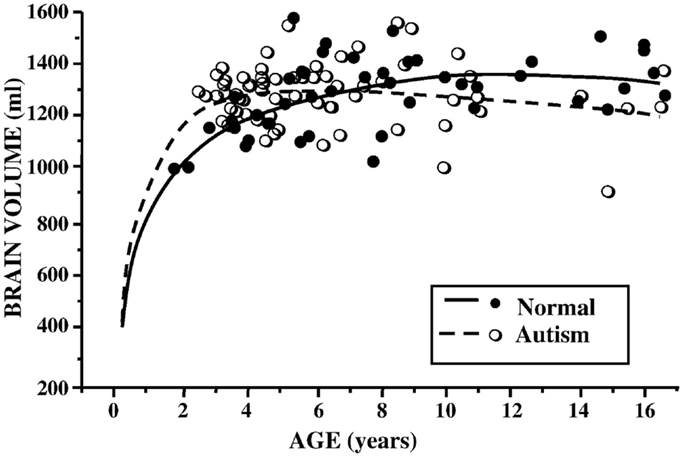
Figure 1. Brain volume (milliliters) by age (years) in children with ASD and controls. Reproduced with permission from Courchesne et al. (37), adapted from Courchesne et al. (32).
In 2005, a meta-analysis of published data on brain volume, head circumference, and post-mortem brain weight in ASD, further described the effect of age, with most marked differences occurring in the first few years of life. In adulthood, however, brain sizes did not vary from controls (35). Subsequent longitudinal and cross-sectional data from hundreds of children and adults with ASD documented volume enlargement during preschool years, most prominently in the anterior regions, followed by possible growth arrest or exaggerated losses later in childhood (36–38). Using cross-sectional age-adjusted data, Schumann et al. (36), for example, showed that children with ASD had 10% greater white matter volume, 6% greater frontal gray matter volume, and 9% greater temporal gray matter volume at 2 years of age. Longitudinal data showed altered growth trajectories at follow up scans (36).
Volumetric differences did not hold true in all ASD studies however, for example, when structural MRI from children with ASD were compared to children with other developmental delays (39, 40). Similarly, a recent systematic review of published data on head circumference overgrowth in children with ASD suggests differences may be much more subtle than previously thought. The authors attribute exaggerated differences to biased normative data in the CDC head circumference growth curves, to the selection of control groups from non-local communities, as well as to a failure to control for head circumference confounders such as weight and ethnicity (41).
Recently, a small study looked at whether volumetric MRI might be predictive of a subsequent diagnosis of ASD, prior to the development of clinical symptoms. A group of 55 infants (33 of which were considered high risk given that they had a sibling with ASD) were scanned prospectively at three time points prior to 24 months of age. At 24 and 36 months, they underwent detailed developmental assessments, at which point 10 infants were identified as having a diagnosis of ASD, and 11 were noted to have other developmental delays. The authors found increased extra-axial fluid volume in infants who developed ASD, and quantified the difference through manual delineation of CSF compartments. They were able to show that a ratio of fluid:brain volume of >0.14 yielded 79% specificity and 78% sensitivity in 12–15 month old infants regarding a subsequent diagnosis of ASD (42) (see Figure 2). The finding remains to be replicated.
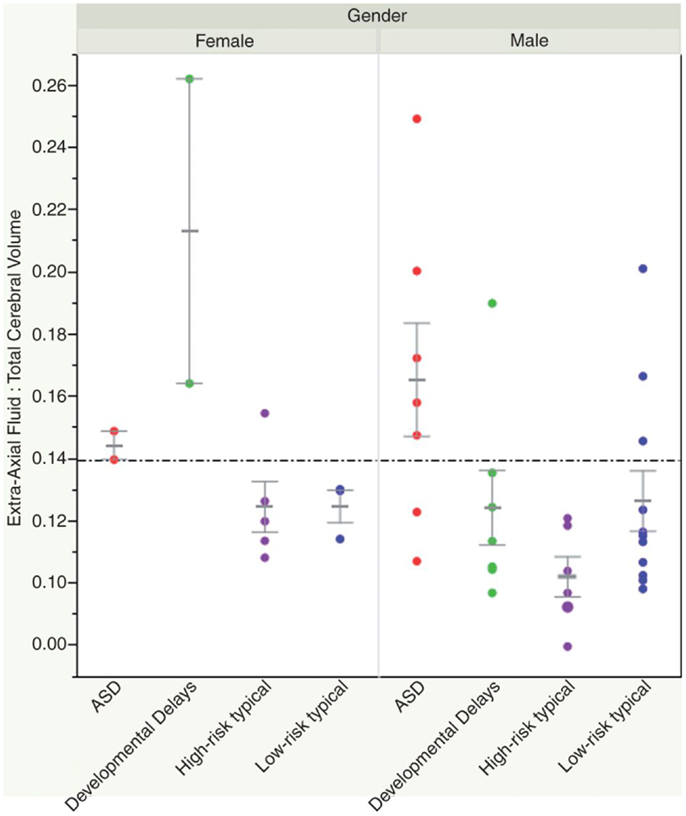
Figure 2. Shen et al. (42) showed how an elevated ratio of fluid:brain volume (above 0.14) at 12–15 months of age was predictive of a subsequent diagnosis of ASD, with 78% sensitivity and 79% specificity in their sample. Reproduced with permission from Shen et al. (42).
Summary and comparison. In summary, volumetric analyses in ASD describe early brain overgrowth in the first few years of life, a finding that is difficult to contrast to COS, given the methodological complexity of acquiring neuroimaging data in very young children or neonates who subsequently develop this condition. During childhood and adolescence, volumetric data suggests that individuals with ASD may have attenuated brain growth or exaggerated volume loss, since adults with ASD have comparable brain volumes to their typically developing peers. Some similarities emerge with the COS population, given findings of exaggerated gray matter loss during adolescent years.
Cortical Thickness and Morphology
With advancements in computational statistics, it became possible extract a more detailed analysis of the cortical gray matter with respect to surface morphology. Specifically, the transposition of cortical imaging data onto a common surface template allowed cortical gray matter volume to be further quantified in terms of cortical thickness, surface area, and gyrification. More recently, complex statistical approaches employing mathematical algorithms and machine-learning models have manipulated neuroimaging data collected from both volumetric and cortical thickness measurements, in efforts to generate diagnostic classifiers of ASD/COS.
Cortical measurements are of interest for neurodevelopmental disorders as they are thought to represent distinct embryological processes under tight regulatory control (43). Cortical surface area, for example, reflects to the process of neural stem cell proliferation and migration early in embryologic development (44). Cortical thickness, on the other hand, reflects axon and dendrite remodeling, myelination, and synaptic pruning, in a dynamic process lasting from birth into adulthood (45).
Cortical thickness and morphology in COS
In the NIMH-COS sample (46), a combination of cross-sectional and longitudinal data from 70 patients compared to controls revealed diffuse decreases in mean cortical thickness in childhood (~7.5% smaller), which became localized specifically to the frontal and temporal lobes with increasing age. Statistical significance survived correction for covariates such as sex, socioeconomic status, and IQ. Accordingly, while individuals with COS displayed global gray matter and cortical thickness losses in childhood, with age these losses became similar to those observed in adult onset schizophrenia, with deficits localizing more anteriorly (see Figure 3).
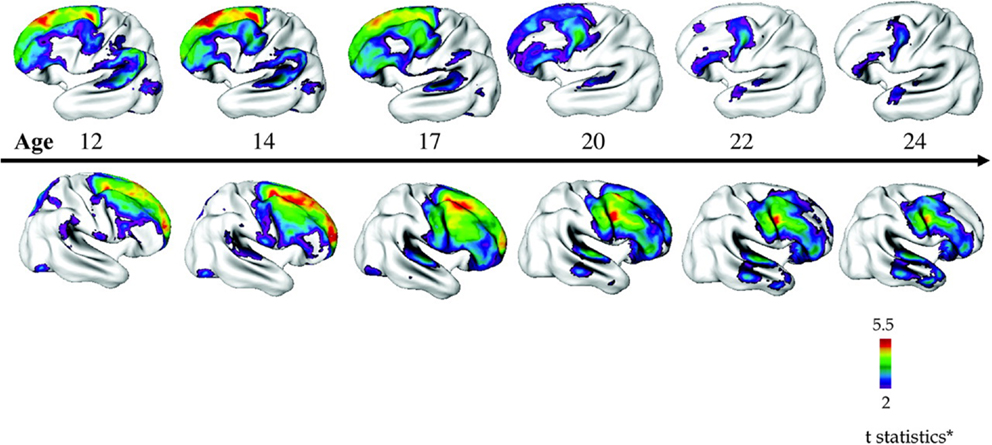
Figure 3. Progressive loss of cortical thickness in a “front to back” pattern observed through longitudinal imaging of 70 children with COS compared to 72 control participants. Reproduced with permission from Gogtay (160), adapted from Greenstein et al. (46).
Interestingly, in two separate samples, non-affected siblings of COS probands also demonstrated a pattern of decreased cortical thickness in the frontal, temporal and parietal lobes during childhood and adolescence, which then normalized in early adulthood, implicating some sort of compensatory mechanism despite underlying genetic risk (47, 48).
With hospitalization and medication management, symptom remission correlated with localized increases in cortical thickness measurable in specific subregions of the cortex (49), irrespective of choice of antipsychotic (50). Children who had other psychiatric conditions with comorbid psychotic symptoms but not meeting full criteria for COS demonstrated cortical deficits in prefrontal/temporal pattern as well, but deficits were smaller and less striking than in COS patients (51).
As mentioned in the introduction to this section, complex algorithms and mathematical protocols have been designed to identify and combine measurements that may be predictive of disease state. A multivariate machine-learning algorithm applied to cortical thickness data from the NIMH cohort was able to correctly classify 73.7% of patients with COS and controls. Through this method, 74 “important” regions were identified. Areas with the most predictive power clustered in frontal regions (primarily the superior and middle frontal gyris), and the left temporoparietal region (52). Given the rarity of COS in the general population, and the case-control study design, these results were not validated in a separate study population, precluding any calculation of positive or negative predictive value, and thus limiting any inferences regarding clinical utility.
Cortical thickness and morphology in ASD
There is significant heterogeneity in the literature with respect to cortical thickness and morphology in ASD, with at times seemingly contradictory results depending on the age, IQ, and clinical severity of the study population.
In a very young group of patients with ASD, cortical volume, and surface area (but not thickness) were found to be increased compared to controls at the age of 2 years. The rate of cortical growth between ages 2 and 5 years did not differ between groups, further implicating the prenatal and early postnatal periods as central to disease pathogenesis (53).
In slightly older age groups, many authors have observed evidence of exaggerated cortical thinning in ASD. For example, Hardan et al. (54) demonstrated that children with ASD ages 8–13 years had increased cortical thickness, particularly in the temporal lobe, as compared to aged matched controls. The small sample size (n = 17 cases), however, precluded co-variation for IQ, or analysis of age-related interactions (54). Longitudinal imaging 2-years later on seemingly the same cohort, showed that those with a diagnosis of ASD underwent exaggerated cortical thinning compared to controls, and that the degree of thinning correlated with the severity of symptoms. Differences, however, were mostly non-significant after controlling for multiple comparisons and variation in IQ (55). In a comparable age group (6–15 years). Mak-Fan et al. (56) showed a similar pattern of increased cortical thickness, surface area, and gray matter volume in children with ASD at earlier ages (6–10 years), that then underwent exaggerated losses compared to controls, such that by 12–13 years of age, controls surpassed patients on all three measures (56). Wallace et al. (57), on the other hand, found baseline deficits in cortical thickness for adolescents with ASD, but also observed exaggerated rates of cortical thinning during adolescence and early adulthood (57). In the same study population, no differences in overall surface area were noted, but more overall gyrification in the ASD group, particularly in the occipital and parietal regions was observed. Both groups showed a decline in gyrification overtime (58).
On the other hand, several authors have noted deficits in cortical thinning in ASD. Looking over a wide age range, Raznahan et al. (59) used cross-sectional MRI data from 76 patients with ASD (primarily Asperger’s syndrome) and 51 controls from ages 10 to 60 years to study the effects of age on cortical thickness and surface area. While surface area was relatively stable and comparable between both groups, they found significant differences with respect to cortical thickness. Typically developing individuals had greater cortical thickness in adolescence, which thinned steadily overtime. Individuals with ASD had reduced cortical thickness early in life, which underwent relatively little cortical thinning overtime, such that by middle age, they had surpassed their typically developing peers (59). ASD associated deficits in expected age-related cortical thinning during adolescence and adulthood has been shown in several other studies as well, both diffusely and in specific subregions (60, 61).
Recently, Ecker et al. (62) sought to tease apart the relative contributions of cortical thickness and cortical surface area to overall differences in cortical volume in a group of adult males (mean age of 26 years) with ASD compared to controls. While total brain volume and mean cortical thickness measurements were not significantly different between the two groups, several regional clusters emerged with both increased and decreased cortical volumes. The authors found that these relative differences were accounted for by variability primarily in cortical surface area, and less so from cortical thickness. As well, differences in cortical thickness/surface area were largely non-overlapping, and were deemed to be spatially independent from each other (62).
As in COS, several groups have aimed to combine the predictive power of multiple measurements by applying mathematical algorithms to neuroimaging data. Ecker et al. (63), for example, included five parameters (cortical convexity, curvature, folding, thickness and surface area) in their support vector machine analytic approach. These combined measurements were able to correctly classify patients with ASD (n = 20) and controls (n = 20) with 80–90% specificity and sensitivity, with cortical thickness being the most predictive measurement. This approach also demonstrated proof of principle in separating patients with ASD from patients with ADHD, despite the small sample size, and lack of reproduction in a separate group of patients with ASD from which the algorithm was generated (63). Similarly, Jiao et al. (64) incorporated cortical thickness and volume data from children with ASD and controls (ages 7–13) into a machine-learning model with the aims of predicting presence or absence of ASD. One algorithm was able to predict diagnostic stratification with 87% accuracy based on cortical thickness measurements. The most predictive regions included both areas of decreased cortical thickness (in the left pars triangularis, orbital frontal gyrus, parahippocampalgyrus, and left frontal pole) and increased cortical thickness (left anterior cingulate and left precuneus) (64). Again, the case control design was not representative of true population prevalence, precluding calculation of positive predictive values.
Summary and comparison. In ASD, a small number of studies support a pattern of very early overgrowth in cortical surface area and volume (<2 years of age), which is immediately followed by cortical dysmaturation throughout childhood and adolescence, with evidence suggesting both exaggerated and impaired cortical thinning, depending on the study. Changes in cortical thickness and surface area seem to occur in non-overlapping regions. In COS on the other hand, cortical thickness is reduced diffusely in childhood, although data from very young patients (<8 years) are lacking. During adolescence, reductions in cortical thickness become more localized to frontal regions, although less has been written about the specific rates of cortical thinning in this patient group.
Regions of Interest
Studies seeking out and investigating specific regions of interest in both COS and ASD have employed several different approaches. On the one hand, a general approach simultaneously comparing dozens of regions of interest or thousands of specific points in the absence of an a priori defined hypothesis has been used to survey for areas associated with the greatest differences between patient and control samples, and can help guide future areas of research. On the other hand, a predefined hypothesis regarding volumetric differences in a particular region allows optimization of statistical power, to more precisely elucidate candidate regions.
Regions of interest in COS
A meta-analysis of studies conducted in adult onset schizophrenia patients describes global deficits in volume, most consistently in the left superior temporal gyrus and the left medial temporal lobe (65). Looking specifically at COS, in the NIMH cohort, an automated and longitudinal analysis of over 40,000 points across the cortical surface found that the superior and middle frontal gyris showed the greatest overall reduction in cortical thickness compared to controls (46). In a different sample COS population from UCLA, specific analysis of the right posterior superior temporal gyrus (Wernicke’s area, involved in verbal comprehension), found volume to be increased in this region (66). Investigations conducted by the same group on the anterior cingulate gyrus, a central and highly connected structure in the prefrontal cortex involved in many functions including error monitoring, yielded volume reductions (67).
Hypothesis driven approaches in the NIMH-COS cohort have been able to identify specific regional volume deficits as well. The insular cortex, for example, has been implicated in schizophrenia, given its role in distinguishing self from non-self, in visceral somatosensory interpretation, in processing of emotional experiences, and in salience. Patients with COS were found to have smaller insular volumes, whereas COS-siblings and controls were not statistically different, suggesting reduced insular size as an indicator of disease state. Additionally, level of functioning and severity of symptoms correlated with insular volume (68).
The cerebellum, classically understood to be involved in motor coordination and planning, has been implicated in schizophrenia given its association with learning and cognition. In longitudinal data from the NIMH cohort, smaller overall and regional cerebellar volumes were detected in affected individuals, with siblings falling between patients and controls on various measures (69).
Regarding subcortical structures, enlargement of the caudate (70) has been shown. In the limbic system, increased amygdala volume (71), but volume loss in the hippocampus and fornix (72, 73) has also been found in COS.
Regions of interest in ASD
Brain regions proposed to play a role in social cognition, communication, and “theory of mind” have been a focus of investigation in ASD. The region of the temporoparietal junction in particular, is thought to be central to the integration of social information and empathy, as well as selective attention to salient stimuli (74). Thinning of several areas in the temporoparietal region, particularly on the left side, has been shown in children, adolescents, and adults with ASD (38, 57, 59, 61, 75).
The orbital frontal cortex, in the ventromedial prefrontal region, is thought to play a role in sensory processing, goal directed behavior, adaptive learning, and attachment formation (76). Patients with autism, despite increased overall cortical thickness in the frontal region, have been shown to have specific deficits in cortical thickness (38), volume, and surface area (62) in the orbital frontal cortex, which correlated with symptoms severity (62). Other frontal lobe structures showing reduced cortical thickness in ASD include the inferior and middle frontal gyri, and the prefrontal cortex, depending on the study (38, 64, 77).
The anterior cingulate is a highly connected part of the social brain network situated along the medial aspect of the frontal cortex. Its role in self-perception, social processing, error monitoring, and reward based learning has been described (78). Relative increases (60, 64) and decreases (62, 75, 77) in volume and thickness of the anterior cingulate have been shown in ASD. Given that different regions may grow at different rates in individuals with ASD vs. controls (60, 61), variation in the age and distribution of study populations may account for some inconsistencies.
Volume deficits in the insular cortex have been demonstrated in young adults with pervasive developmental disorders (79). In adults with ASD, those who had a history of psychotic symptoms also demonstrated reduced insular volumes, particularly on the right side, as well as reduced cerebellar volumes (80).
Looking at subcortical structures, the caudate has been shown to be enlarged in ASD, across whole brain volumetric meta-analyses (81–83), and in targeted ROI analysis, even after controlling for confounding medication administration (84). Volume loss in the putamen has been shown across whole brain meta-analyses in adults with ASD (81, 83, 85), but enlargement of the putamen has also been observed in younger populations (86). In the amygdala, volume losses emerge across whole brain meta-analytic approaches (83, 85, 87), but volume gains are noted in younger patient groups as well (88). From a functional perspective, enlargement of the caudate may be associated with repetitive or self-injurious behavior (89–92), while volume loss in the amygdala may pertain to impaired emotional perception and regulation (93).
Summary and comparison. Volume losses have been noted in some overlapping prefrontal regions in both ASD and COS, particularly along the middle frontal gyrus. The anterior cingulate is also implicated in both conditions, although bidirectional changes in volume have been noted in ASD, depending on age of study participants. The area of the temporal-parietal junction shows volume loss in ASD, and was an area strongly predictive of diagnosis in group of individuals with COS (discussed in see Cortical Thickness and Morphology in COS). The insula is implicated in patients with COS, and in those with ASD who have comorbid psychotic symptoms. Looking at deep structures, both conditions are associated with volume gains in the caudate, which may pertain to repetitive behaviors, or concomitant neuroleptic treatment.
Structural White Matter Analysis (Volumetric Analysis and Diffusion Tensor Imaging)
Magnetic resonance imaging analyses that incorporate diffusion measurements allow for further sub-characterization of white matter microstructure, above volumetric differences. The diffusion of water molecules is measurable with MRI technology, and the magnitude and direction of diffusion within each individual voxel can be modeled mathematically with vector algebra. Axial diffusivity (AD) is the measurement of diffusion occurring parallel to white matter fibers; increased AD occurs in diseases involving axonal degeneration, and is thought to reflect both the integrity and density of axon structures. Radial diffusivity (RD) on the other hand, is a measurement of diffusion occurring perpendicular to the white matter fibers; it is used as a measure of myelination, and is increased in demyelinating diseases. Mean diffusivity (MD) (also known as the apparent diffusion coefficient, ADC) is a measure of average diffusion in absence of a directional gradient (94).
A summary ellipsoid vector incorporating the overall spherical nature of the combined vectors is termed “fractional anisotropy” (FA). A perfectly “isotropic” solution (FA = 0), such as free water, contains molecules that diffuse freely in all directions, whereas an anisotropic solution (i.e., a white matter fiber bundle) would restrict diffusion in one direction resulting in an elongated ellipsoid and FA values closer to 1. In white matter tract analysis, increased FA is thought to be a sensitive but not specific measure of fiber myelination, the integrity of cell membranes as well as the diameter of the fibers (95). Typically developing individuals show age related increases in FA and decreases in MD throughout development, in keeping with increasing white matter maturation (96). As in gray matter analyses, DTI can be applied to the whole brain in a voxel-based approach, or alternatively, specific regions of interest can be investigated with this method. Along these lines, specific anatomic white matter tracts can be reconstructed and analyzed from DTI data, in a method known as tractography. DTI data can also be transposed onto a common FA template, in tract-based spatial statistics (TBSS) (97).
Magnetic resonance imaging data collected in the absence of diffusion measurements can still be utilized in studying white matter integrity and growth. Similar to gray matter analysis, simple volumetric studies on white matter structures have been employed. Alternatively, 3D mapping of volumetric changes in white matter tracts via tensor-based morphometry (TBM) has been validated as a method of studying white matter development over time. In brief, TBM applies initial and follow up scans to a standardized brain template to ensure precise anatomical alignment. Next, an elastic-deformation algorithm is used to calculate the specific degree of volume expansion in a set area, represented by an expansion factor called the “Jacobian determinant.” Growth rates are calculated by comparing the Jacobian determinant measures across patient and control samples.
White Matter Analysis in COS
The corpus callosum is the largest white matter structure in the human brain, and is central for connectivity and relay of information between hemispheres. Deficits in the corpus callosum have been inconsistently demonstrated in adult onset schizophrenia populations (95). In a longitudinal analysis of children and young adults with COS, differences in the midsagittal area of the splenium of the corpus callosum emerged around age 22, with patients having significantly smaller structures (98). Later analysis looking at volumetric differences in subsections of the corpus callosum revealed no differences between NIMH-COS patients, their siblings and controls with respect to overall volume, and/or volume change over time (99).
Comparison of whole brain TBM data between 12 patients with COS and 12 age matched controls followed over a 5-year interval revealed aberrant white matter development between ages 13 and 19 years. Specifically, at baseline MRI, patients had a 15% deficit in white matter volume in the frontal regions. At follow up, control patients showed an average of 2.6% growth in white matter per year, while COS patient had only 0.4% white matter growth per year. The white matter deficits in the COS sample seemed to progress in a front to back pattern, opposite to previous findings regarding gray-matter deficits, but consistent with expected growth patterns in healthy adolescent brains (100). Unaffected siblings of children with COS showed delayed white matter growth at younger ages (<14 years) but not at older ages (14–18 years) as measured by TBM. Delayed white matter growth was most significant in the parietal regions for siblings, but normalized by age 18 (101).
There are relatively few DTI studies in specific COS populations. Clark et al. (102) found no significant differences in FA diffusely between 18 children and adolescents with COS, and 25 controls. Of note, five COS patients had a comorbid diagnosis of ASD, of which four were tested as having a linguistic impairment. Increased RD and AD was noted for patient vs. control groups in several white matter tracts (see Table 1). Increases in RD and AD in these regions were explained primarily by the presence of a linguistic impairment, and not the diagnosis COS, however (102).
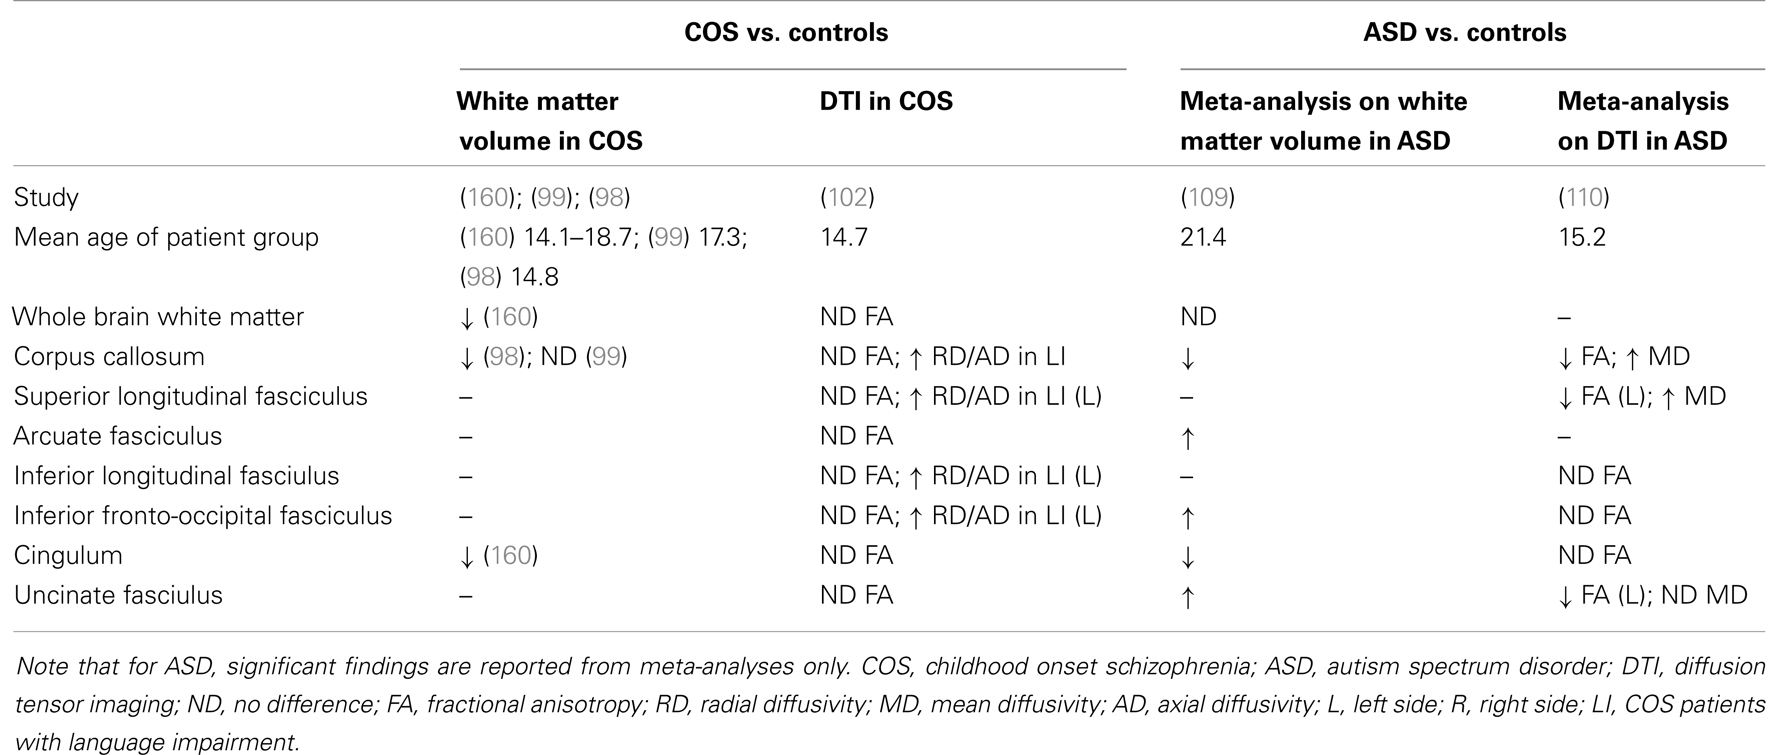
Table 1. Summary of white matter findings in ASD and COS.
There is a growing body of literature, however, on diffusion tensor imaging in adult onset schizophrenia and early-onset schizophrenia (EOS: defined as symptom onset prior to age 18 years). Findings investigating these patient groups are summarized in several reviews (103, 104). Given the paucity of literature applying DTI in COS, some conclusions may be extrapolated from the early-onset schizophrenia literature; therefore they will be discussed briefly.
In general, while results have varied, the corpus callosum, superior and inferior longitudinal fasciculus, cingulum, and the uncinate fasciculus have been suggested as areas most affected with respect to white matter integrity as measured by decreases in FA (103, 104). Some studies have attempted to correlate DTI findings with symptomatology. Ashtari et al. (105), for example, found decreased FA in the left inferior longitudinal fasciculus was more pronounced for EOS patients with a history of visual hallucinations (105). As in volumetric imaging, studies that incorporate analyses for age effects provide evidence of dynamic white matter abnormalities as well, in EOS. For example, FA in the anterior cingulate region increased with age in the healthy control population, but decreased with age in the early onset psychosis population (106). Similarly, patients with EOS showed decreased FA in parietal regions, while patients with adult onset schizophrenia had findings localizing to the frontal, temporal, and cerebellar regions (107).
White Matter Analysis in ASD
Earlier volumetric analyses suggested a pattern of accelerated of white matter volume and growth in younger children, particularly in the frontal regions, but that adolescents with ASD had similar or reduced white matter volume compared to controls (108). Meta-analysis of 13 VBM studies on white matter volume found no differences globally in white matter volume, and no differences between child/adolescent groups and adults groups, although no studies included very young children (<6 years). Some regional differences emerged, however (109) (see Table 1).
With respect to diffusion tensor imaging, a recent systematic review and meta-analysis, combining DTI data from 14 studies, including both children and adults with ASD, summarized some areas of consensus and heterogeneity in the literature. In summary, decreased FA was most consistently demonstrated in the corpus callosum, left uncinate fasciculus, and left superior longitudinal fasciculus of individuals with ASD. Mean diffusivity was increased in the corpus callosum, and bilaterally in the superior longitudinal fasciculus (110). This meta-analysis included data from ROI and tractography studies only, however, excluding whole brain TBSS and voxel-based analyses. A recent literature review on DTI in ASD by Travers et al. (97), identified decreased FA, increased MD, and RD as the most common finding across methods, with the corpus callosum, cingulum, arcuate fasciculus, superior longitudinal, and uncinate fasciculus showing the greatest differences (97).
Most imaging studies in autism to date, as well as those included in the above-described meta-analyses, have been conducted in older children, adolescents, or adults. In these age groups, decreased FA and increased MD have been repeatedly documented in many white matter regions. The specific rate of change in white matter markers, as well as the effect of age on white matter maturation seems to vary by study, however. For example, Mak-Fan et al. (56) showed RD and MD measurements stayed stable between the ages 6 and 14 years in subjects with ASD, while control subjects showed expected decreases with age (111). Ameis et al. (112) found the between group differences in RD, AD, and MD, but not FA, which were more pronounced in childhood than in adolescence (112).
Few studies have been conducted in very young children, however, and less consistency emerges in the data from this age range. Contrary to literature in older populations, Weinstein et al. (113), reported that FA was greater for children ages 1.5–6 years with ASD compared to controls in the areas of the corpus callosum, superior longitudinal fasciculus, and cingulum. Differences in FA were attributable to decreased RD, while AD was the same between cases and controls (113). Similarly, Ben Bashat et al. (114), found evidence of accelerated white matter maturation marked by increased FA and reduced displacement values in a small sample of children with ASD ages 1.8–3.3 years, most prominently in frontal regions (114). Abdel Razek and colleagues (115), found ADC scores to be greater for preschool children with ASD in several regions, which correlated with severity of autistic symptoms as measured by the childhood autism rating scale (115). Walker et al. (116) on the other hand, found that 39 children between ages 2 and 8 years with ASD had decreased MD and FA compared to controls, accompanied by an attenuated rate of increase in FA, as well an accelerated rate of decreased MD compared to controls (116). Longitudinal data looking at high risk infants found evidence of higher FA at 6 months in children who were subsequently diagnosed with ASD, but that they had then had a slower rate of change such that by 24 months typically developing children had surpassed them in this measure (117).
For most studies, although differences have been statistically significant for certain regions, the magnitude of these differences has been quite small, on the range of 1–2%, thus limiting the predictive ability of any individual measurement. Lange et al. (118) generated a discriminant function that was able to distinguish between individuals with and without ASD with 94% sensitivity, 90% specificity, and 92% accuracy, by combining the predictive ability of DTI data points centered primarily around the superior temporal gyrus and the temporal stem. The sensitivity and specificity was reproduced in a replicate sample as well, however the case-control design was not reflective of true population prevalence, again precluding inferences regarding predictive ability in a real life clinical setting (118).
Emerging efforts have tried to correlate neuroimaing findings to functional and behavioral outcomes. For example, increased MD in the superior longitudinal fasciculus correlated with degree of language impairment in children and adolescents (119). Increase FA and decreased RD in the arcuate fasciculus correlated with greater language abilities in another group of children with ASD (120). Similarly, lower FA in the dorsal lateral prefrontal region was associated with increased social impairment in a group of children with ASD in Japan (121). Attempts to identify structural deficits in areas involved socio-emotional processing have yielded mixed results as well. Further focus on understanding the functional connectivity between distant regions is described in the next section.
Summary and comparison. White matter development in COS patients compared to controls appears marked by global deficits in white matter volume and decreased rates of white matter growth/integrity in adolescence, although the specific chronology, most affected regions and the relation to symptoms continues to be explored. In ASD, meta-analyses suggest no differences overall in white matter volume in adults, although early white matter volumetric overgrowth may occur in younger patient samples. Looking at specific white matter regions, volume losses have been noted in both ASD and COS in the corpus callosum and cingulum. In both conditions, decreased white matter integrity as measured though DTI has been observed in the superior longitudinal fasciculus, which may pertain to comorbid language impairments.
Functional Connectivity
While imaging of white matter tracts through techniques like DTI permits the quantification of structural connectivity between regions, functional connectivity requires in vivo analysis of brain activation. Functional magnetic resonance imaging (fMRI) measures regional changes in blood oxygen level dependent (BOLD) signaling, given the subtle differences in magnetic field strength between oxygenated and deoxygenated blood. Brain activation patterns may be analyzed in subjects at rest (termed resting state) or during a specific cognitive or behavioral task performed in an MRI scanner. Data can be analyzed with respect to a specific region of interest (seed technique), where connections to and from an a priori defined region are studied. Alternatively, independent component analysis (ICA), or similar techniques, look at overall activation patterns across all regions, and can comment on patterns in functional networks (i.e., default mode network, salience network). Data from functional neuroimaging studies are often analyzed using graph theory. In this approach, the relationship between certain areas of central activation (termed “nodes”) and the vectors of connectivity between nodes (termed “edges”) are described using discrete mathematics (122). Short-range connectivity (i.e., within a specific lobe, or to a neighboring lobe) and long-range connectivity between remote regions can be quantified in this manner.
Functional Connectivity in COS
Two separate analyses in the NIMH cohort of COS have suggested exaggerated long-range connectivity, and impaired short-range connectivity, in keeping with a hypothesis of exaggerated synaptic pruning. Resting state fMRI data was used to graph the connectivity between 100 regional nodes for 13 patients and 19 controls. Data showed that patients with COS had signals that were less clustered with more disrupted modularity marked by fewer edges between nodes of the same module. On the other hand, they showed greater global connectedness and greater global efficiency (123). Subsequent analyses with a slightly larger sample again found reduced connectivity at short distances and increased connectivity at long distances for patients with COS compared to controls on resting state fMRI. Relative to healthy controls, patients with COS had several regions in the frontal and parietal lobes that were “nodes” of over-connectedness with respect to long-range associations (124). White et al. (125) on the other hand, interpreted an opposite pattern from a study using a visual stimulus to analyze connectivity in the occipital lobe of children and adolescents with early onset schizophrenia (125). Similarly, structural connectivity analysis in neonates at high risk for schizophrenia found decreased global efficiency, increased local efficiency, and fewer nodes and edges overall compared to control infants (126).
Functional Connectivity in ASD
In ASD on the other hand, there is an abundance of recent literature on functional connectivity. An emerging hypothesis suggests that frontoparietal under connectivity in ASD results in reduced “bandwidth” in long-range circuits [reviewed by Just et al. (127)]. Some propose that this coincides with local increases in connectivity within a specific lobe, resulting in a failure to integrate and regulate multiple sources of information (128). This hypothesis is consistent with structural white matter deficits in long-range association fibers, as well as structural patterns in gray matter showing increased local, but deficits in global modularity (129).
With respect to functional analyses, impaired synchronization, and under connectivity between large-scale networks has been shown in fMRI studies incorporating various task-based assessments, including those pertaining to language comprehension and auditory stimuli (130–132), executive functioning (133), visual spatial processing (134), and response to emotional cues (135, 136). Under connectivity has not been the only finding however, with many functional MRI studies showing evidence of increased connectivity or altered developmental trajectories with respect to integrated neural networks (137–139). For example, a recent meta-analysis of fMRI studies found greater activation in children with ASD in response to a social task in certain specific regions (i.e., in the left-precentral gyrus) but relative under activation compared to controls in other areas (superior temporal gyrus, parahippocampal gyrus, amygdala, and fusiform gyrus). In adults with ASD, activation was greater in the superior temporal gyrus, but less in the anterior cingulate during social processing (140).
The literature is also divided with respect to functional neuroimaging in resting state MRI, in the absence of any particular stimulus or task. Some have proposed that methodological issues may be contributing to observed inconsistencies (141). While hypoconnectivity seems most prevalent in the literature, [Ref. (142, 143); reviewed by Uddin et al. (144)], Uddin et al. (144) observed long-range hyperconnectivity via ICA across remote regions in 20 children ages 7–12 years with autism compared to controls. Hyperconnectivity was noted to involve the default mode network, frontotemporal, motor, visual, and salience networks. Hyperconnectivity of the salience network (which involves the anterior cingulate and insula) was most predictive of the diagnosis of ASD and was able to discriminate between cases and controls with 83% accuracy, a finding that was reproduced in a separate image dataset (145). Other resting state fMRI studies have also observed mixed patterns, which vary by region, network, and by age of the sample (146, 147).
The literature in very young patients with ASD is relatively sparse but seems to suggest altered developmental trajectories for affected children beginning at very young ages. A recent publication observed increased functional connectivity at 3 months, which disappeared by 12 months in high risk infants (148). Alternatively, Redcay and Courchesne (139) found increased connectivity between hemispheres in 2–3 year old children with ASD compared to chronological age matched controls, however the opposite pattern emerged when they were compared to mental age matched controls (139). Dinstein et al. (132) observed hypoconnectivity between hemispheres and in language regions in toddlers with ASD in response to auditory stimuli (132).
A recent review article by Uddin et al. (144) summarizes the literature to date with respect to resting state functional connectivity analyses. While intrinsic connectivity and seed-based analyses across 17 published studies suggest both hyper- and hypo-connectivity, Uddin and colleagues propose that the developmental age of the sample may be one explanatory factor with respect to variability in results. They describe a hypothesis in which increased functional connectivity in prepubescent children with ASD as compared to their peers is then met with altered maturational trajectories such that adults with ASD seem to have reduced connectivity compared to controls (144).
A recent publication put forth by a data sharing initiative entitled “autism brain imaging data exchange” (ABIDE) proposes to remedy disagreement in the literature through a large-scale international collaboration combining 1112 resting state fMRI scans. Analysis of 360 male subjects with ASD compared to controls found hypo connectivity in cortical networks but hyper connectivity in subcortical networks. They also identified localized differences in connectivity in certain regions, including the insula, cingulate, and thalamus. They did not perform specific analyses looking for age-associated differences, however, given that the majority of included participants were adolescents or adults (146).
Summary and comparison. There are only a handful of studies looking at functional connectivity in COS, but data from fMRI suggest a pattern of increased long-range connectivity, with disrupted short-range connectivity, in keeping with pathology of exaggerated synaptic pruning. In comparison, data from fMRI in ASD suggest to some extent an opposite pattern, with increased local but decreased global connectivity. fMRI data sharing between research centers reveal hyperconnectivity in subcortical networks, and hypoconnectivity in cortical networks in adult males with ASD. Smaller studies in younger age groups suggest important age effects regarding the connectivity hypothesis as well, with younger children with ASD seemingly showing more “over-connectedness” than adults.
Discussion
This review compares and contrasts neuroimaging findings in ASD and COS. Overall, across volumetric, structural, and functional neuroimaging data, there arises evidence for a dynamic changes in both conditions. In ASD, a pattern of early brain overgrowth is seemingly met with dysmaturation in adolescence, although the literature in this regard is far from certain. Functional analyses have suggested impaired long-range connectivity as well as increased local and/or subcortical connectivity, which may also progress with age. In COS, global deficits in cerebral volume, cortical thickness, and white matter maturation seem most pronounced in childhood and adolescence, and may level off in early adulthood. Deficits in local connectivity, with increased long-range connectivity have been proposed, in keeping with exaggerated cortical pruning; however the opposite has also been shown. Symptom and neuroimaging overlap across conditions was illustrated via a meta-analysis of fMRI data in both schizophrenia and ASD, which identified shared deficits in regions involved in social cognition (149).
The significance of these findings is tempered, however, by heterogeneity in results across other pediatric onset neurodevelopmental disorders. In ADHD for example, longitudinal MRI analyses in children suggest overall reduced cortical thickness prior to the onset of puberty (158) with peak cortical thickness and onset of cortical thinning occurring at later ages (159). In the future, clinical neuroimaging must be able to identify not only the presence of aberrant neurodevelopment, but also be able to discern across overlapping conditions.
While there is heterogeneity in the literature in both conditions, findings regarding COS at times appear more consistent. It is important to note that, given the rarity of this condition, these findings emerge from relatively few research samples, and are derived primarily from data collected from the same population of individuals. In ASD on the other hand, there has been an international explosion of investigation at numerous institutions, across ages, IQ ranges, and diagnostic severity, which has resulted in at times seemingly contradictory results. A call for collaboration (150) has been met with a first international compilation of neuroimaging datasets, which has helped to clarify some discrepancies in the literature with respect to fMRI (146). Going forward, ongoing collaboration to facilitate large scale, prospective, longitudinal neuroimaging studies, will be necessary to separate signals from noise in these complex and heterogeneous diseases. A focus on genetic subtypes may help to unite synapse pathology with neuroimaging findings and network dysfunction, to permit some degree of hypothesis generation with respect to molecular pathogenesis.
In ASD, for example, a loss of inhibitory control leading to exaggerated growth, premature cortical thinning, and then early stabilization of cortical structures has led some to suggest that overall the developmental curve has been “shifted to the left” along the time axis in this condition, with respect to brain maturation (75, 151). Current genetic investigations suggest alterations in structural scaffolding at the excitatory synapse could be contributory in ASD (152). Single gene disorders associated with autism may shed light on underlying final common pathways (153). Fragile X syndrome (FXS), for example, is a genetic condition comorbid with ASD in 20–30% of cases (154). Individuals afflicted with this condition have dysfunction or absence of the fragile X mental retardation protein (FMRP). FMRP is now understood to play a critical role in regulation of protein synthesis at the excitatory synapse, and without it, exaggerated receptor cycling and dysfunctional neuroplasticity can results (153). A similar mechanism in idiopathic ASD would hypothetically results in a loss of inhibitory control on expected maturational changes, uncoupling the structural and temporal timeline of synaptic neurodevelopment.
In schizophrenia, exaggerated synaptic pruning has been a long held hypothesis with respect to an etiology (25), which is consistent with aspects of the neuroimaging literature in COS. On the other hand, a small study in high risk infants suggests enlarged cerebral volumes may exist early in life, implying that some type of early dysregulated growth may be at play in this condition as well, similar to the process occurring in ASD (27). Investigations in 22q11.2 deletion syndrome (DS), a genetic disorder associated with schizophrenia in 20–25% of cases (155), permits longitudinal and prospective analysis of children at high risk for schizophrenia. Interestingly, MRI data collected in children as young as 6 years old with 22q11.2 DS found early increases in cortical thickness and deficits in cortical thinning in preadolescence, which are then met with exaggerated cortical thinning during adolescent years. Patients who subsequently developed schizophrenia indeed had more exaggerated deficits in cortical thickness (156).
In studies recruiting adolescents, it is difficult to tease out the possible influence of confounders such as substance abuse on both clinical and radiologic findings. While comorbid substance abuse is common in adult onset schizophrenia populations (occurring in 50–80% cases), the rate of substance abuse in COS, while presumed lower, has not been described (157). Ongoing study of clinical, environmental, and cultural confounding factors in both ASD and COS is needed.
Many investigators have sought to use neuroimaging protocols as predictors of diagnosis in case-control studies. The accuracy, sensitivity, and specificity of these analyses have on average ranged between 60 and 90%, and some groups have been able to reproduce high levels of diagnostic accuracy in separate patient samples. The clinical utility of these algorithms, however, remains uncertain in the absence of their application to populations reflecting realistic disease prevalence (i.e., positive predictive values are low or not reported). The development of clinically useful, cost-effective wide scale diagnostic tests for neurodevelopment conditions remains a common goal, and several groups have initiated prospective trials on high risk patient populations which may perhaps yield some hopeful results in the next decade.
Authors Contribution
Danielle A. Baribeau authored the manuscript. Evdokia Anagnostou developed the research topic, provided guidance, editing, and supervision.
Conflict of Interest Statement
Danielle A. Baribeau has no financial conflicts to disclose. Evdokia Anagnostou has consulted to Seaside Therapeutics and Novartis. She has received grant funding from Sanofi Canada. The Guest Associate Editor – Stephanie Ameis – declares that, in spite of her adjunct affiliation with the same institution as authors Danielle A. Baribeau and Evdokia Anagnostou, the review process was handled objectively and no conflict of interest exists.
Acknowledgments
Funding for this research was provided by the Province of Ontario Neurodevelopmental Disorders Network (POND), supported by the Ontario Brain Institute.
References
1. Centre for Disease Control and Prevention. Prevalence of autism spectrum disorders – autism and developmental disabilities monitoring network, 14 sites, United States, 2008. MMWR Surveill Summ (2012) 61(3):1–19.
2. Clemmensen L, Vernal DL, Steinhausen HC. A systematic review of the long-term outcome of early onset schizophrenia. BMC Psychiatry (2012) 12:150. doi: 10.1186/1471-244X-12-150
3. American Psychiatric Association. Diagnostic and Statistical Manual of Mental Disorders. 5th ed. Arlington, VA: American Psychiatric Publishing (2013).
4. McKenna K, Gordon CT, Lenane M, Kaysen D, Fahey K, Rapoport JL. Looking for childhood-onset schizophrenia: the first 71 cases screened. J Am Acad Child Adolesc Psychiatry (1994) 33(5):636–44. doi:10.1097/00004583-199406000-00003
5. Shorter E, Wachtel LE. Childhood catatonia, autism and psychosis past and present: is there an “iron triangle”? Acta Psychiatr Scand (2013) 128(1):21–33. doi:10.1111/acps.12082
6. American Psychiatric Association. Diagnostic and Statistical Manual of Mental Disorders. 3rd ed. Washington, DC: American Psychiatric Publishing (1980).
7. Gochman P, Miller R, Rapoport JL. Childhood-onset schizophrenia: the challenge of diagnosis. Curr Psychiatry Rep (2011) 13(5):321–2. doi:10.1007/s11920-011-0212-4
8. Sporn AL, Addington AM, Gogtay N, Ordonez AE, Gornick M, Clasen L, et al. Pervasive developmental disorder and childhood-onset schizophrenia: comorbid disorder or a phenotypic variant of a very early onset illness? Biol Psychiatry (2004) 55(10):989–94. doi:10.1016/j.biopsych.2004.01.019
9. Rapoport J, Chavez A, Greenstein D, Addington A, Gogtay N. Autism spectrum disorders and childhood-onset schizophrenia: clinical and biological contributions to a relation revisited. J Am Acad Child Adolesc Psychiatry (2009) 48(1):10–8. doi:10.1097/CHI.0b013e31818b1c63
10. Sullivan S, Rai D, Golding J, Zammit S, Steer C. The association between autism spectrum disorder and psychotic experiences in the Avon longitudinal study of parents and children (ALSPAC) birth cohort. J Am Acad Child Adolesc Psychiatry (2013) 52(8):806–14.e2. doi:10.1016/j.jaac.2013.05.010
11. Joshi G, Wozniak J, Petty C, Martelon MK, Fried R, Bolfek A, et al. Psychiatric comorbidity and functioning in a clinically referred population of adults with autism spectrum disorders: a comparative study. J Autism Dev Disord (2013) 43(6):1314–25. doi:10.1007/s10803-012-1679-5
12. Stahlberg O, Soderstrom H, Rastam M, Gillberg C. Bipolar disorder, schizophrenia, and other psychotic disorders in adults with childhood onset AD/HD and/or autism spectrum disorders. J Neural Transm (2004) 111(7):891–902. doi:10.1007/s00702-004-0115-1
13. Abdallah MW, Greaves-Lord K, Grove J, Norgaard-Pedersen B, Hougaard DM, Mortensen EL. Psychiatric comorbidities in autism spectrum disorders: findings from a Danish Historic Birth Cohort. Eur Child Adolesc Psychiatry (2011) 20(11–12):599–601. doi:10.1007/s00787-011-0220-2
14. Hutton J, Goode S, Murphy M, Le Couteur A, Rutter M. New-onset psychiatric disorders in individuals with autism. Autism (2008) 12(4):373–90. doi:10.1177/1362361308091650
15. Lionel AC, Vaags AK, Sato D, Gazzellone MJ, Mitchell EB, Chen HY, et al. Rare exonic deletions implicate the synaptic organizer gephyrin (GPHN) in risk for autism, schizophrenia and seizures. Hum Mol Genet (2013) 22(10):2055–66. doi:10.1093/hmg/ddt056
16. Lee SH, Ripke S, Neale BM, Faraone SV, Purcell SM, Perlis RH, et al. Genetic relationship between five psychiatric disorders estimated from genome-wide SNPs. Nat Genet (2013) 45(9):984–94. doi:10.1038/ng.2711
17. Crespi B, Stead P, Elliot M. Evolution in health and medicine Sackler colloquium: comparative genomics of autism and schizophrenia. Proc Natl Acad Sci U S A (2010) 107(Suppl 1):1736–41. doi:10.1073/pnas.0906080106
18. de Lacy N, King BH. Revisiting the relationship between autism and schizophrenia: toward an integrated neurobiology. Annu Rev Clin Psychol (2013) 9:555–87. doi:10.1146/annurev-clinpsy-050212-185627
19. Hernandez-Garcia L, Buschkuehl M. Advances in longitudinal MRI diagnostic tests. Expert Opin Med Diagn (2012) 6(4):309–21. doi:10.1517/17530059.2012.686995
20. Frazier JA, Giedd JN, Hamburger SD, Albus KE, Kaysen D, Vaituzis AC, et al. Brain anatomic magnetic resonance imaging in childhood-onset schizophrenia. Arch Gen Psychiatry (1996) 53(7):617–24.
21. Rapoport JL, Giedd JN, Blumenthal J, Hamburger S, Jeffries N, Fernandez T, et al. Progressive cortical change during adolescence in childhood-onset schizophrenia. A longitudinal magnetic resonance imaging study. Arch Gen Psychiatry (1999) 56(7):649–54. doi:10.1001/archpsyc.56.7.649
22. Sporn AL, Greenstein DK, Gogtay N, Jeffries NO, Lenane M, Gochman P, et al. Progressive brain volume loss during adolescence in childhood-onset schizophrenia. Am J Psychiatry (2003) 160(12):2181–9. doi:10.1176/appi.ajp.160.12.2181
23. Thompson PM, Vidal C, Giedd JN, Gochman P, Blumenthal J, Nicolson R, et al. Mapping adolescent brain change reveals dynamic wave of accelerated gray matter loss in very early-onset schizophrenia. Proc Natl Acad Sci U S A (2001) 98(20):11650–5. doi:10.1073/pnas.201243998
24. Giedd JN, Jeffries NO, Blumenthal J, Castellanos FX, Vaituzis AC, Fernandez T, et al. Childhood-onset schizophrenia: progressive brain changes during adolescence. Biol Psychiatry (1999) 46(7):892–8. doi:10.1016/S0006-3223(99)00072-4
25. Boksa P. Abnormal synaptic pruning in schizophrenia: Urban myth or reality? J Psychiatry Neurosci (2012) 37(2):75–7. doi:10.1503/jpn.120007
26. Gogtay N, Sporn A, Clasen LS, Nugent TF III, Greenstein D, Nicolson R, et al. Comparison of progressive cortical gray matter loss in childhood-onset schizophrenia with that in childhood-onset atypical psychoses. Arch Gen Psychiatry (2004) 61(1):17–22. doi:10.1001/archpsyc.61.1.17
27. Gilmore JH, Kang C, Evans DD, Wolfe HM, Smith JK, Lieberman JA, et al. Prenatal and neonatal brain structure and white matter maturation in children at high risk for schizophrenia. Am J Psychiatry (2010) 167(9):1083–91. doi:10.1176/appi.ajp.2010.09101492
28. Piven J, Arndt S, Bailey J, Havercamp S, Andreasen NC, Palmer P. An MRI study of brain size in autism. Am J Psychiatry (1995) 152(8):1145–9.
29. Hardan AY, Minshew NJ, Mallikarjuhn M, Keshavan MS. Brain volume in autism. J Child Neurol (2001) 16(6):421–4. doi:10.1177/088307380101600607
30. Piven J, Arndt S, Bailey J, Andreasen N. Regional brain enlargement in autism: a magnetic resonance imaging study. J Am Acad Child Adolesc Psychiatry (1996) 35(4):530–6. doi:10.1097/00004583-199604000-00020
31. Aylward EH, Minshew NJ, Field K, Sparks BF, Singh N. Effects of age on brain volume and head circumference in autism. Neurology (2002) 59(2):175–83. doi:10.1212/WNL.59.2.175
32. Courchesne E, Karns CM, Davis HR, Ziccardi R, Carper RA, Tigue ZD, et al. Unusual brain growth patterns in early life in patients with autistic disorder: an MRI study. Neurology (2001) 57(2):245–54. doi:10.1212/WNL.57.2.245
33. Courchesne E, Carper R, Akshoomoff N. Evidence of brain overgrowth in the first year of life in autism. JAMA (2003) 290(3):337–44. doi:10.1001/jama.290.3.337
34. Hazlett HC, Poe M, Gerig G, Smith RG, Provenzale J, Ross A, et al. Magnetic resonance imaging and head circumference study of brain size in autism: birth through age 2 years. Arch Gen Psychiatry (2005) 62(12):1366–76. doi:10.1001/archpsyc.62.12.1366
35. Redcay E, Courchesne E. When is the brain enlarged in autism? A meta-analysis of all brain size reports. Biol Psychiatry (2005) 58(1):1–9. doi:10.1016/j.biopsych.2005.03.026
36. Schumann CM, Bloss CS, Barnes CC, Wideman GM, Carper RA, Akshoomoff N, et al. Longitudinal magnetic resonance imaging study of cortical development through early childhood in autism. J Neurosci (2010) 30(12):4419–27. doi:10.1523/JNEUROSCI.5714-09.2010
37. Courchesne E, Campbell K, Solso S. Brain growth across the life span in autism: age-specific changes in anatomical pathology. Brain Res (2011) 1380:138–45. doi:10.1016/j.brainres.2010.09.101
38. McAlonan GM, Cheung V, Cheung C, Suckling J, Lam GY, Tai KS, et al. Mapping the brain in autism. A voxel-based MRI study of volumetric differences and intercorrelations in autism. Brain (2005) 128(Pt 2):268–76. doi:10.1093/brain/awh332
39. Zeegers M, Hulshoff Pol H, Durston S, Nederveen H, Schnack H, van Daalen E, et al. No differences in MR-based volumetry between 2- and 7-year-old children with autism spectrum disorder and developmental delay. Brain Dev (2009) 31(10):725–30. doi:10.1016/j.braindev.2008.11.002
40. Gray KM, Taffe J, Sweeney DJ, Forster S, Tonge BJ. Could head circumference be used to screen for autism in young males with developmental delay? J Paediatr Child Health (2012) 48(4):329–34. doi:10.1111/j.1440-1754.2011.02238.x
41. Raznahan A, Wallace GL, Antezana L, Greenstein D, Lenroot R, Thurm A, et al. Compared to what? Early brain overgrowth in autism and the perils of population norms. Biol Psychiatry (2013) 74(8):563–75. doi:10.1016/j.biopsych.2013.03.022
42. Shen MD, Nordahl CW, Young GS, Wootton-Gorges SL, Lee A, Liston SE, et al. Early brain enlargement and elevated extra-axial fluid in infants who develop autism spectrum disorder. Brain (2013) 136(Pt 9):2825–35. doi:10.1093/brain/awt166
43. Lui JH, Hansen DV, Kriegstein AR. Development and evolution of the human neocortex. Cell (2011) 146(1):18–36. doi:10.1016/j.cell.2011.06.030
44. Rakic P. Evolution of the neocortex: a perspective from developmental biology. Nat Rev Neurosci (2009) 10(10):724–35. doi:10.1038/nrn2719
45. Shaw P, Kabani NJ, Lerch JP, Eckstrand K, Lenroot R, Gogtay N, et al. Neurodevelopmental trajectories of the human cerebral cortex. J Neurosci (2008) 28(14):3586–94. doi:10.1523/JNEUROSCI.5309-07.2008
46. Greenstein D, Lerch J, Shaw P, Clasen L, Giedd J, Gochman P, et al. Childhood onset schizophrenia: cortical brain abnormalities as young adults. J Child Psychol Psychiatry (2006) 47(10):1003–12. doi:10.1111/j.1469-7610.2006.01658.x
47. Gogtay N, Greenstein D, Lenane M, Clasen L, Sharp W, Gochman P, et al. Cortical brain development in nonpsychotic siblings of patients with childhood-onset schizophrenia. Arch Gen Psychiatry (2007) 64(7):772–80. doi:10.1001/archpsyc.64.7.772
48. Mattai AA, Weisinger B, Greenstein D, Stidd R, Clasen L, Miller R, et al. Normalization of cortical gray matter deficits in nonpsychotic siblings of patients with childhood-onset schizophrenia. J Am Acad Child Adolesc Psychiatry (2011) 50(7):697–704. doi:10.1016/j.jaac.2011.03.016
49. Greenstein DK, Wolfe S, Gochman P, Rapoport JL, Gogtay N. Remission status and cortical thickness in childhood-onset schizophrenia. J Am Acad Child Adolesc Psychiatry (2008) 47(10):1133–40. doi:10.1097/CHI.0b013e3181825b0c
50. Mattai A, Chavez A, Greenstein D, Clasen L, Bakalar J, Stidd R, et al. Effects of clozapine and olanzapine on cortical thickness in childhood-onset schizophrenia. Schizophr Res (2010) 116(1):44–8. doi:10.1016/j.schres.2009.10.018
51. Gogtay N, Weisinger B, Bakalar JL, Stidd R, Fernandez de la Vega O, Miller R, et al. Psychotic symptoms and gray matter deficits in clinical pediatric populations. Schizophr Res (2012) 140(1–3):149–54. doi:10.1016/j.schres.2012.07.006
52. Greenstein D, Malley JD, Weisinger B, Clasen L, Gogtay N. Using multivariate machine learning methods and structural MRI to classify childhood onset schizophrenia and healthy controls. Front Psychiatry (2012) 3:53. doi:10.3389/fpsyt.2012.00053
53. Hazlett HC, Poe MD, Gerig G, Styner M, Chappell C, Smith RG, et al. Early brain overgrowth in autism associated with an increase in cortical surface area before age 2 years. Arch Gen Psychiatry (2011) 68(5):467–76. doi:10.1001/archgenpsychiatry.2011.39
54. Hardan AY, Muddasani S, Vemulapalli M, Keshavan MS, Minshew NJ. An MRI study of increased cortical thickness in autism. Am J Psychiatry (2006) 163(7):1290–2. doi:10.1176/appi.ajp.163.7.1290
55. Hardan AY, Libove RA, Keshavan MS, Melhem NM, Minshew NJ. A preliminary longitudinal magnetic resonance imaging study of brain volume and cortical thickness in autism. Biol Psychiatry (2009) 66(4):320–6. doi:10.1016/j.biopsych.2009.04.024
56. Mak-Fan KM, Taylor MJ, Roberts W, Lerch JP. Measures of cortical grey matter structure and development in children with autism spectrum disorder. J Autism Dev Disord (2012) 42(3):419–27. doi:10.1007/s10803-011-1261-6
57. Wallace GL, Dankner N, Kenworthy L, Giedd JN, Martin A. Age-related temporal and parietal cortical thinning in autism spectrum disorders. Brain (2010) 133(Pt 12):3745–54. doi:10.1093/brain/awq279
58. Wallace GL, Robustelli B, Dankner N, Kenworthy L, Giedd JN, Martin A. Increased gyrification, but comparable surface area in adolescents with autism spectrum disorders. Brain (2013) 136(Pt 6):1956–67. doi:10.1093/brain/awt106
59. Raznahan A, Toro R, Daly E, Robertson D, Murphy C, Deeley Q, et al. Cortical anatomy in autism spectrum disorder: an in vivo MRI study on the effect of age. Cereb Cortex (2010) 20(6):1332–40. doi:10.1093/cercor/bhp198
60. Doyle-Thomas KA, Duerden EG, Taylor MJ, Lerch JP, Soorya LV, Wang AT, et al. Effects of age and symptomatology on cortical thickness in autism spectrum disorders. Res Autism Spectr Disord (2013) 7(1):141–50. doi:10.1016/j.rasd.2012.08.004
61. Scheel C, Rotarska-Jagiela A, Schilbach L, Lehnhardt FG, Krug B, Vogeley K, et al. Imaging derived cortical thickness reduction in high-functioning autism: key regions and temporal slope. Neuroimage (2011) 58(2):391–400. doi:10.1016/j.neuroimage.2011.06.040
62. Ecker C, Ginestet C, Feng Y, Johnston P, Lombardo MV, Lai MC, et al. Brain surface anatomy in adults with autism: the relationship between surface area, cortical thickness, and autistic symptoms. JAMA Psychiatry (2013) 70(1):59–70. doi:10.1001/jamapsychiatry.2013.265
63. Ecker C, Marquand A, Mourao-Miranda J, Johnston P, Daly EM, Brammer MJ, et al. Describing the brain in autism in five dimensions – magnetic resonance imaging-assisted diagnosis of autism spectrum disorder using a multiparameter classification approach. J Neurosci (2010) 30(32):10612–23. doi:10.1523/JNEUROSCI.5413-09.2010
64. Jiao Y, Chen R, Ke X, Chu K, Lu Z, Herskovits EH. Predictive models of autism spectrum disorder based on brain regional cortical thickness. Neuroimage (2010) 50(2):589–99. doi:10.1016/j.neuroimage.2009.12.047
65. Honea R, Crow TJ, Passingham D, Mackay CE. Regional deficits in brain volume in schizophrenia: a meta-analysis of voxel-based morphometry studies. Am J Psychiatry (2005) 162(12):2233–45. doi:10.1176/appi.ajp.162.12.2233
66. Taylor JL, Blanton RE, Levitt JG, Caplan R, Nobel D, Toga AW. Superior temporal gyrus differences in childhood-onset schizophrenia. Schizophr Res (2005) 73(2–3):235–41. doi:10.1016/j.schres.2004.07.023
67. Marquardt RK, Levitt JG, Blanton RE, Caplan R, Asarnow R, Siddarth P, et al. Abnormal development of the anterior cingulate in childhood-onset schizophrenia: a preliminary quantitative MRI study. Psychiatry Res (2005) 138(3):221–33. doi:10.1016/j.pscychresns.2005.01.001
68. Moran ME, Weisinger B, Ludovici K, McAdams H, Greenstein D, Gochman P, et al. At the boundary of the self: the insular cortex in patients with childhood-onset schizophrenia, their healthy siblings, and normal volunteers. Int J Dev Neurosci (2013). doi:10.1016/j.ijdevneu.2013.05.010
69. Greenstein D, Lenroot R, Clausen L, Chavez A, Vaituzis AC, Tran L, et al. Cerebellar development in childhood onset schizophrenia and non-psychotic siblings. Psychiatry Res (2011) 193(3):131–7. doi:10.1016/j.pscychresns.2011.02.010
70. Juuhl-Langseth M, Rimol LM, Rasmussen IA Jr, Thormodsen R, Holmen A, Emblem KE, et al. Comprehensive segmentation of subcortical brain volumes in early onset schizophrenia reveals limited structural abnormalities. Psychiatry Res (2012) 203(1):14–23. doi:10.1016/j.pscychresns.2011.10.005
71. Levitt JG, Blanton RE, Caplan R, Asarnow R, Guthrie D, Toga AW, et al. Medial temporal lobe in childhood-onset schizophrenia. Psychiatry Res (2001) 108(1):17–27. doi:10.1016/S0925-4927(01)00108-1
72. Mattai A, Hosanagar A, Weisinger B, Greenstein D, Stidd R, Clasen L, et al. Hippocampal volume development in healthy siblings of childhood-onset schizophrenia patients. Am J Psychiatry (2011) 168(4):427–35. doi:10.1176/appi.ajp.2010.10050681
73. Kendi M, Kendi AT, Lehericy S, Ducros M, Lim KO, Ugurbil K, et al. Structural and diffusion tensor imaging of the fornix in childhood- and adolescent-onset schizophrenia. J Am Acad Child Adolesc Psychiatry (2008) 47(7):826–32. doi:10.1097/CHI.Ob013e318172ef36
74. Decety J, Lamm C. The role of the right temporoparietal junction in social interaction: how low-level computational processes contribute to meta-cognition. Neuroscientist (2007) 13(6):580–93. doi:10.1177/1073858407304654
75. Greimel E, Nehrkorn B, Schulte-Ruther M, Fink GR, Nickl-Jockschat T, Herpertz-Dahlmann B, et al. Changes in grey matter development in autism spectrum disorder. Brain Struct Funct (2013) 218(4):929–42. doi:10.1007/s00429-012-0439-9
76. Goursaud AP, Bachevalier J. Social attachment in juvenile monkeys with neonatal lesion of the hippocampus, amygdala and orbital frontal cortex. Behav Brain Res (2007) 176(1):75–93. doi:10.1016/j.bbr.2006.09.020
77. Hadjikhani N, Joseph RM, Snyder J, Tager-Flusberg H. Anatomical differences in the mirror neuron system and social cognition network in autism. Cereb Cortex (2006) 16(9):1276–82. doi:10.1093/cercor/bhj069
78. Pfeifer JH, Peake SJ. Self-development: integrating cognitive, socioemotional, and neuroimaging perspectives. Dev Cogn Neurosci (2012) 2(1):55–69. doi:10.1016/j.dcn.2011.07.012
79. Kosaka H, Omori M, Munesue T, Ishitobi M, Matsumura Y, Takahashi T, et al. Smaller insula and inferior frontal volumes in young adults with pervasive developmental disorders. Neuroimage (2010) 50(4):1357–63. doi:10.1016/j.neuroimage.2010.01.085
80. Toal F, Bloemen OJ, Deeley Q, Tunstall N, Daly EM, Page L, et al. Psychosis and autism: magnetic resonance imaging study of brain anatomy. Br J Psychiatry (2009) 194(5):418–25. doi:10.1192/bjp.bp.107.049007
81. Duerden EG, Mak-Fan KM, Taylor MJ, Roberts SW. Regional differences in grey and white matter in children and adults with autism spectrum disorders: an activation likelihood estimate (ALE) meta-analysis. Autism Res (2012) 5(1):49–66. doi:10.1002/aur.235
82. Stanfield AC, McIntosh AM, Spencer MD, Philip R, Gaur S, Lawrie SM. Towards a neuroanatomy of autism: a systematic review and meta-analysis of structural magnetic resonance imaging studies. Eur Psychiatry (2008) 23(4):289–99. doi:10.1016/j.eurpsy.2007.05.006
83. Yu KK, Cheung C, Chua SE, McAlonan GM. Can Asperger syndrome be distinguished from autism? An anatomic likelihood meta-analysis of MRI studies. J Psychiatry Neurosci (2011) 36(6):412–21. doi:10.1503/jpn.100138
84. Langen M, Bos D, Noordermeer SD, Nederveen H, van Engeland H, Durston S. Changes in the development of striatum are involved in repetitive behavior in autism. Biol Psychiatry (2013). doi:10.1016/j.biopsych.2013.08.013
85. Nickl-Jockschat T, Habel U, Michel TM, Manning J, Laird AR, Fox PT, et al. Brain structure anomalies in autism spectrum disorder – a meta-analysis of VBM studies using anatomic likelihood estimation. Hum Brain Mapp (2012) 33(6):1470–89. doi:10.1002/hbm.21299
86. Hua X, Thompson PM, Leow AD, Madsen SK, Caplan R, Alger JR, et al. Brain growth rate abnormalities visualized in adolescents with autism. Hum Brain Mapp (2013) 34(2):425–36. doi:10.1002/hbm.21441
87. Via E, Radua J, Cardoner N, Happe F, Mataix-Cols D. Meta-analysis of gray matter abnormalities in autism spectrum disorder: should Asperger disorder be subsumed under a broader umbrella of autistic spectrum disorder? Arch Gen Psychiatry (2011) 68(4):409–18. doi:10.1001/archgenpsychiatry.2011.27
88. Bellani M, Calderoni S, Muratori F, Brambilla P. Brain anatomy of autism spectrum disorders II. Focus on amygdala. Epidemiol Psychiatr Sci (2013) 22(4):309–12. doi:10.1017/S2045796013000346
89. Langen M, Durston S, Staal WG, Palmen SJ, van Engeland H. Caudate nucleus is enlarged in high-functioning medication-naive subjects with autism. Biol Psychiatry (2007) 62(3):262–6. doi:10.1016/j.biopsych.2006.09.040
90. Qiu A, Adler M, Crocetti D, Miller MI, Mostofsky SH. Basal ganglia shapes predict social, communication, and motor dysfunctions in boys with autism spectrum disorder. J Am Acad Child Adolesc Psychiatry (2010) 49(6):e1–4. doi:10.1016/j.jaac.2010.02.012
91. Wolff JJ, Hazlett HC, Lightbody AA, Reiss AL, Piven J. Repetitive and self-injurious behaviors: associations with caudate volume in autism and fragile X syndrome. J Neurodev Disord (2013) 5(1):12. doi:10.1186/1866-1955-5-12
92. Hollander E, Anagnostou E, Chaplin W, Esposito K, Haznedar MM, Licalzi E, et al. Striatal volume on magnetic resonance imaging and repetitive behaviors in autism. Biol Psychiatry (2005) 58(3):226–32. doi:10.1016/j.biopsych.2005.03.040
93. Groen W, Teluij M, Buitelaar J, Tendolkar I. Amygdala and hippocampus enlargement during adolescence in autism. J Am Acad Child Adolesc Psychiatry (2010) 49(6):552–60. doi:10.1016/j.jaac.2009.12.023
94. Alexander AL, Lee JE, Lazar M, Field AS. Diffusion tensor imaging of the brain. Neurotherapeutics (2007) 4(3):316–29. doi:10.1016/j.nurt.2007.05.011
95. Kubicki M, McCarley R, Westin CF, Park HJ, Maier S, Kikinis R, et al. A review of diffusion tensor imaging studies in schizophrenia. J Psychiatr Res (2007) 41(1–2):15–30. doi:10.1016/j.jpsychires.2005.05.005
96. Faria AV, Zhang J, Oishi K, Li X, Jiang H, Akhter K, et al. Atlas-based analysis of neurodevelopment from infancy to adulthood using diffusion tensor imaging and applications for automated abnormality detection. Neuroimage (2010) 52(2):415–28. doi:10.1016/j.neuroimage.2010.04.238
97. Travers BG, Adluru N, Ennis C, Tromp do PM, Destiche D, Doran S, et al. Diffusion tensor imaging in autism spectrum disorder: a review. Autism Res (2012) 5(5):289–313. doi:10.1002/aur.1243
98. Keller A, Jeffries NO, Blumenthal J, Clasen LS, Liu H, Giedd JN, et al. Corpus callosum development in childhood-onset schizophrenia. Schizophr Res (2003) 62(1–2):105–14. doi:10.1016/S0920-9964(02)00354-7
99. Johnson SL, Greenstein D, Clasen L, Miller R, Lalonde F, Rapoport J, et al. Absence of anatomic corpus callosal abnormalities in childhood-onset schizophrenia patients and healthy siblings. Psychiatry Res (2013) 211(1):11–6. doi:10.1016/j.pscychresns.2012.09.013
100. Gogtay N, Lu A, Leow AD, Klunder AD, Lee AD, Chavez A, et al. Three-dimensional brain growth abnormalities in childhood-onset schizophrenia visualized by using tensor-based morphometry. Proc Natl Acad Sci U S A (2008) 105(41):15979–84. doi:10.1073/pnas.0806485105
101. Gogtay N, Hua X, Stidd R, Boyle CP, Lee S, Weisinger B, et al. Delayed white matter growth trajectory in young nonpsychotic siblings of patients with childhood-onset schizophrenia. Arch Gen Psychiatry (2012) 69(9):875–84. doi:10.1001/archgenpsychiatry.2011.2084
102. Clark K, Narr KL, O’Neill J, Levitt J, Siddarth P, Phillips O, et al. White matter integrity, language, and childhood onset schizophrenia. Schizophr Res (2012) 138(2–3):150–6. doi:10.1016/j.schres.2012.02.016
103. Samartzis L, Dima D, Fusar-Poli P, Kyriakopoulos M. White matter alterations in early stages of schizophrenia: a systematic review of diffusion ten- sor imaging studies. J Neuroimaging (2013). doi:10.1111/j.1552-6569.2012.00779.x
104. Fitzsimmons J, Kubicki M, Shenton ME. Review of functional and anatomical brain connectivity findings in schizophrenia. Curr Opin Psychiatry (2013) 26(2):172–87. doi:10.1097/YCO.0b013e32835d9e6a
105. Ashtari M, Cottone J, Ardekani BA, Cervellione K, Szeszko PR, Wu J, et al. Disruption of white matter integrity in the inferior longitudinal fasciculus in adolescents with schizophrenia as revealed by fiber tractography. Arch Gen Psychiatry (2007) 64(11):1270–80. doi:10.1001/archpsyc.64.11.1270
106. Kumra S, Ashtari M, Cervellione KL, Henderson I, Kester H, Roofeh D, et al. White matter abnormalities in early-onset schizophrenia: a voxel-based diffusion tensor imaging study. J Am Acad Child Adolesc Psychiatry (2005) 44(9):934–41. doi:10.1097/01.chi.0000170553.15798.94
107. Kyriakopoulos M, Perez-Iglesias R, Woolley JB, Kanaan RA, Vyas NS, Barker GJ, et al. Effect of age at onset of schizophrenia on white matter abnormalities. Br J Psychiatry (2009) 195(4):346–53. doi:10.1192/bjp.bp.108.055376
108. Courchesne E, Redcay E, Kennedy DP. The autistic brain: birth through adulthood. Curr Opin Neurol (2004) 17(4):489–96. doi:10.1097/01.wco.0000137542.14610.b4
109. Radua J, Via E, Catani M, Mataix-Cols D. Voxel-based meta-analysis of regional white-matter volume differences in autism spectrum disorder versus healthy controls. Psychol Med (2011) 41(7):1539–50. doi:10.1017/S0033291710002187
110. Aoki Y, Abe O, Nippashi Y, Yamasue H. Comparison of white matter integrity between autism spectrum disorder subjects and typically developing individuals: a meta-analysis of diffusion tensor imaging tractography studies. Mol Autism (2013) 4(1):25. doi:10.1186/2040-2392-4-25
111. Mak-Fan KM, Morris D, Vidal J, Anagnostou E, Roberts W, Taylor MJ. White matter and development in children with an autism spectrum disorder. Autism (2013) 17(5):541–57. doi:10.1177/1362361312442596
112. Ameis SH, Fan J, Rockel C, Voineskos AN, Lobaugh NJ, Soorya L, et al. Impaired structural connectivity of socio-emotional circuits in autism spectrum disorders: a diffusion tensor imaging study. PLoS One (2011) 6(11):e28044. doi:10.1371/journal.pone.0028044
113. Weinstein M, Ben-Sira L, Levy Y, Zachor DA, Ben Itzhak E, Artzi M, et al. Abnormal white matter integrity in young children with autism. Hum Brain Mapp (2011) 32(4):534–43. doi:10.1002/hbm.21042
114. Ben Bashat D, Kronfeld-Duenias V, Zachor DA, Ekstein PM, Hendler T, Tarrasch R, et al. Accelerated maturation of white matter in young children with autism: a high b value DWI study. Neuroimage (2007) 37(1):40–7. doi:10.1016/j.neuroimage.2007.04.060
115. Abdel Razek A, Mazroa J, Baz H. Assessment of white matter integrity of autistic preschool children with diffusion weighted MR imaging. Brain Dev (2013). doi:10.1016/j.braindev.2013.01.003
116. Walker L, Gozzi M, Lenroot R, Thurm A, Behseta B, Swedo S, et al. Diffusion tensor imaging in young children with autism: biological effects and potential confounds. Biol Psychiatry (2012) 72(12):1043–51. doi:10.1016/j.biopsych.2012.08.001
117. Wolff JJ, Gu H, Gerig G, Elison JT, Styner M, Gouttard S, et al. Differences in white matter fiber tract development present from 6 to 24 months in infants with autism. Am J Psychiatry (2012) 169(6):589–600. doi:10.1176/appi.ajp.2011.11091447
118. Lange N, Dubray MB, Lee JE, Froimowitz MP, Froehlich A, Adluru N, et al. Atypical diffusion tensor hemispheric asymmetry in autism. Autism Res (2010) 3(6):350–8. doi:10.1002/aur.162
119. Nagae LM, Zarnow DM, Blaskey L, Dell J, Khan SY, Qasmieh S, et al. Elevated mean diffusivity in the left hemisphere superior longitudinal fasciculus in autism spectrum disorders increases with more profound language impairment. AJNR Am J Neuroradiol (2012) 33(9):1720–5. doi:10.3174/ajnr.A3037
120. Joseph RM, Fricker Z, Fenoglio A, Lindgren KA, Knaus TA, Tager-Flusberg H. Structural asymmetries of language-related gray and white matter and their relationship to language function in young children with ASD. Brain Imaging Behav (2013). doi:10.1007/s11682-013-9245-0
121. Noriuchi M, Kikuchi Y, Yoshiura T, Kira R, Shigeto H, Hara T, et al. Altered white matter fractional anisotropy and social impairment in children with autism spectrum disorder. Brain Res (2010) 1362:141–9. doi:10.1016/j.brainres.2010.09.051
122. Dennis EL, Thompson PM. Mapping connectivity in the developing brain. Int J Dev Neurosci. (2013) 31(7):525–42. doi:10.1016/j.ijdevneu.2013.05.007
123. Alexander-Bloch AF, Gogtay N, Meunier D, Birn R, Clasen L, Lalonde F, et al. Disrupted modularity and local connectivity of brain functional networks in childhood-onset schizophrenia. Front Syst Neurosci (2010) 4:147. doi:10.3389/fnsys.2010.00147
124. Alexander-Bloch AF, Vertes PE, Stidd R, Lalonde F, Clasen L, Rapoport J, et al. The anatomical distance of functional connections predicts brain network topology in health and schizophrenia. Cereb Cortex (2013) 23(1):127–38. doi:10.1093/cercor/bhr388
125. White T, Moeller S, Schmidt M, Pardo JV, Olman C. Evidence for intact local connectivity but disrupted regional function in the occipital lobe in children and adolescents with schizophrenia. Hum Brain Mapp (2012) 33(8):1803–11. doi:10.1002/hbm.21321
126. Shi F, Yap PT, Gao W, Lin W, Gilmore JH, Shen D. Altered structural connectivity in neonates at genetic risk for schizophrenia: a combined study using morphological and white matter networks. Neuroimage (2012) 62(3):1622–33. doi:10.1016/j.neuroimage.2012.05.026
127. Just MA, Keller TA, Malave VL, Kana RK, Varma S. Autism as a neural systems disorder: a theory of frontal-posterior underconnectivity. Neurosci Biobehav Rev (2012) 36(4):1292–313. doi:10.1016/j.neubiorev.2012.02.007
128. Courchesne E, Pierce K. Why the frontal cortex in autism might be talking only to itself: local over-connectivity but long-distance disconnection. Curr Opin Neurobiol (2005) 15(2):225–30. doi:10.1016/j.conb.2005.03.001
129. Shi F, Wang L, Peng Z, Wee CY, Shen D. Altered modular organization of structural cortical networks in children with autism. PLoS One (2013) 8(5):e63131. doi:10.1371/journal.pone.0063131
130. Just MA, Cherkassky VL, Keller TA, Minshew NJ. Cortical activation and synchronization during sentence comprehension in high-functioning autism: evidence of underconnectivity. Brain (2004) 127(Pt 8):1811–21. doi:10.1093/brain/awh199
131. Williams DL, Cherkassky VL, Mason RA, Keller TA, Minshew NJ, Just MA. Brain function differences in language processing in children and adults with autism. Autism Res (2013) 6(4):288–302. doi:10.1002/aur.1291
132. Dinstein I, Pierce K, Eyler L, Solso S, Malach R, Behrmann M, et al. Disrupted neural synchronization in toddlers with autism. Neuron (2011) 70(6):1218–25. doi:10.1016/j.neuron.2011.04.018
133. Just MA, Cherkassky VL, Keller TA, Kana RK, Minshew NJ. Functional and anatomical cortical underconnectivity in autism: evidence from an FMRI study of an executive function task and corpus callosum morphometry. Cereb Cortex (2007) 17(4):951–61. doi:10.1093/cercor/bhl006
134. Damarla SR, Keller TA, Kana RK, Cherkassky VL, Williams DL, Minshew NJ, et al. Cortical underconnectivity coupled with preserved visuospatial cognition in autism: evidence from an fMRI study of an embedded figures task. Autism Res (2010) 3(5):273–9. doi:10.1002/aur.153
135. Abrams DA, Lynch CJ, Cheng KM, Phillips J, Supekar K, Ryali S, et al. Underconnectivity between voice-selective cortex and reward circuitry in children with autism. Proc Natl Acad Sci U S A (2013) 110(29):12060–5. doi:10.1073/pnas.1302982110
136. Rudie JD, Shehzad Z, Hernandez LM, Colich NL, Bookheimer SY, Iacoboni M, et al. Reduced functional integration and segregation of distributed neural systems underlying social and emotional information processing in autism spectrum disorders. Cereb Cortex (2012) 22(5):1025–37. doi:10.1093/cercor/bhr171
137. Shih P, Keehn B, Oram JK, Leyden KM, Keown CL, Muller RA. Functional differentiation of posterior superior temporal sulcus in autism: a functional connectivity magnetic resonance imaging study. Biol Psychiatry (2011) 70(3):270–7. doi:10.1016/j.biopsych.2011.03.040
138. Shen MD, Shih P, Ottl B, Keehn B, Leyden KM, Gaffrey MS, et al. Atypical lexicosemantic function of extrastriate cortex in autism spectrum disorder: evidence from functional and effective connectivity. Neuroimage (2012) 62(3):1780–91. doi:10.1016/j.neuroimage.2012.06.008
139. Redcay E, Courchesne E. Deviant functional magnetic resonance imaging patterns of brain activity to speech in 2-3-year-old children with autism spectrum disorder. Biol Psychiatry (2008) 64(7):589–98. doi:10.1016/j.biopsych.2008.05.020
140. Dickstein DP, Pescosolido MF, Reidy BL, Galvan T, Kim KL, Seymour KE, et al. Developmental meta-analysis of the functional neural correlates of autism spectrum disorders. J Am Acad Child Adolesc Psychiatry (2013) 52(3):279–89.e16. doi:10.1016/j.jaac.2012.12.012
141. Muller RA, Shih P, Keehn B, Deyoe JR, Leyden KM, Shukla DK. Underconnected, but how? A survey of functional connectivity MRI studies in autism spectrum disorders. Cereb Cortex (2011) 21(10):2233–43. doi:10.1093/cercor/bhq296
142. Weng SJ, Wiggins JL, Peltier SJ, Carrasco M, Risi S, Lord C, et al. Alterations of resting state functional connectivity in the default network in adolescents with autism spectrum disorders. Brain Res (2010) 1313:202–14. doi:10.1016/j.brainres.2009.11.057
143. Kennedy DP, Courchesne E. The intrinsic functional organization of the brain is altered in autism. Neuroimage (2008) 39(4):1877–85. doi:10.1016/j.neuroimage.2007.10.052
144. Uddin LQ, Supekar K, Menon V. Reconceptualizing functional brain connectivity in autism from a developmental perspective. Front Hum Neurosci (2013) 7:458. doi:10.3389/fnhum.2013.00458
145. Uddin LQ, Supekar K, Lynch CJ, Khouzam A, Phillips J, Feinstein C, et al. Salience network-based classification and prediction of symptom severity in children with autism. JAMA Psychiatry (2013) 70(8):869–79. doi:10.1001/jamapsychiatry.2013.104
146. Di Martino A, Yan CG, Li Q, Denio E, Castellanos FX, Alaerts K, et al. The autism brain imaging data exchange: towards a large-scale evaluation of the intrinsic brain architecture in autism. Mol Psychiatry (2013). doi:10.1038/mp.2013.78
147. Lynch CJ, Uddin LQ, Supekar K, Khouzam A, Phillips J, Menon V. Default mode network in childhood autism: posteromedial cortex heterogeneity and relationship with social deficits. Biol Psychiatry (2013) 74(3):212–9. doi:10.1016/j.biopsych.2012.12.013
148. Keehn B, Wagner JB, Tager-Flusberg H, Nelson CA. Functional connectivity in the first year of life in infants at-risk for autism: a preliminary near-infrared spectroscopy study. Front Hum Neurosci (2013) 7:444. doi:10.3389/fnhum.2013.00444
149. Sugranyes G, Kyriakopoulos M, Corrigall R, Taylor E, Frangou S. Autism spectrum disorders and schizophrenia: meta-analysis of the neural correlates of social cognition. PLoS One (2011) 6(10):e25322. doi:10.1371/journal.pone.0025322
150. Belmonte MK, Mazziotta JC, Minshew NJ, Evans AC, Courchesne E, Dager SR, et al. Offering to share: how to put heads together in autism neuroimaging. J Autism Dev Disord (2008) 38(1):2–13. doi:10.1007/s10803-006-0352-2
151. Courchesne E. Brain development in autism: early overgrowth followed by premature arrest of growth. Ment Retard Dev Disabil Res Rev (2004) 10(2):106–11. doi:10.1002/mrdd.20020
152. Ebert DH, Greenberg ME. Activity-dependent neuronal signalling and autism spectrum disorder. Nature (2013) 493(7432):327–37. doi:10.1038/nature11860
153. Bhakar AL, Dolen G, Bear MF. The pathophysiology of fragile X (and what it teaches us about synapses). Annu Rev Neurosci (2012) 35:417–43. doi:10.1146/annurev-neuro-060909-153138
154. Kaufmann WE, Cortell R, Kau AS, Bukelis I, Tierney E, Gray RM, et al. Autism spectrum disorder in fragile X syndrome: communication, social interaction, and specific behaviors. Am J Med Genet A (2004) 129A(3):225–34. doi:10.1002/ajmg.a.30229
155. Fung WL, McEvilly R, Fong J, Silversides C, Chow E, Bassett A. Elevated prevalence of generalized anxiety disorder in adults with 22q11.2 deletion syndrome. Am J Psychiatry (2010) 167(8):998. doi:10.1176/appi.ajp.2010.09101463
156. Schaer M, Debbane M, Bach Cuadra M, Ottet MC, Glaser B, Thiran JP, et al. Deviant trajectories of cortical maturation in 22q11.2 deletion syndrome (22q11DS): a cross-sectional and longitudinal study. Schizophr Res (2009) 115(2–3):182–90. doi:10.1016/j.schres.2009.09.016
157. Green AI, Drake RE, Brunette MF, Noordsy DL. Schizophrenia and co-occurring substance use disorder. Am J Psychiatry (2007) 164(3):402–8. doi:10.1176/appi.ajp.164.3.402
158. Shaw P, Lerch J, Greenstein D, Sharp W, Clasen L, Evans A, et al. Longitudinal mapping of cortical thickness and clinical outcome in children and adolescents with attention-deficit/hyperactivity disorder. Arch Gen Psychiatry (2006) 63(5):540–9. doi:10.1001/archpsyc.63.5.540
159. Shaw P, Eckstrand K, Sharp W, Blumenthal J, Lerch JP, Greenstein D, et al. Attention-deficit/hyperactivity disorder is characterized by a delay in cortical maturation. Proc Natl Acad Sci U S A (2007) 104(49):19649–54. doi:10.1073/pnas.0707741104
Keywords: autism spectrum disorder, childhood onset schizophrenia, neuroimaging, magnetic resonance imaging, child development, review
Citation: Baribeau DA and Anagnostou E (2013) A comparison of neuroimaging findings in childhood onset schizophrenia and autism spectrum disorder: a review of the literature. Front. Psychiatry 4:175. doi: 10.3389/fpsyt.2013.00175
Received: 29 September 2013; Accepted: 09 December 2013;
Published online: 20 December 2013.
Edited by:
Stephanie Ameis, University of Toronto, CanadaReviewed by:
Meng-Chuan Lai, University of Cambridge, UKOssama Yassin Mansour, Alexandria University Hospital, Egypt
Peter G. Enticott, Deakin University, Australia
Copyright: © 2013 Baribeau and Anagnostou. This is an open-access article distributed under the terms of the Creative Commons Attribution License (CC BY). The use, distribution or reproduction in other forums is permitted, provided the original author(s) or licensor are credited and that the original publication in this journal is cited, in accordance with accepted academic practice. No use, distribution or reproduction is permitted which does not comply with these terms.
*Correspondence: Evdokia Anagnostou, Holland Bloorview Kids Rehabilitation Hospital, 150 Kilgour Road, Toronto, ON M4G 1R8, Canada e-mail: eanagnostou@hollandbloorview.ca