Spatiotemporal dynamics of word processing in the human brain
- 1 Helen Wills Neuroscience Institute, University of California, Berkeley, CA, USA
- 2 Department of Psychology, University of California, Berkeley, CA, USA
- 3 INSERM–Unité 821, Processus mentaux et activation cérébrale Centre Hospitalier Le Vinatier, Bâtiment, Bron, France
- 4 Department of Radiology, University of California, San Francisco, CA, USA
- 5 Center for Aphasia and Related Disorders VANCHCS, Martinez, CA, USA
- 6 Department of Neurology, University of California, Davis, Martinez, CA, USA
- 7 Department of Neurology, University of California, San Francisco, CA, USA
- 8 Department of Neurosurgery, University of California, San Francisco, CA, USA
We examined the spatiotemporal dynamics of word processing by recording the electrocorticogram (ECoG) from the lateral frontotemporal cortex of neurosurgical patients chronically implanted with subdural electrode grids. Subjects engaged in a target detection task where proper names served as infrequent targets embedded in a stream of task-irrelevant verbs and nonwords. Verbs described actions related to the hand (e.g, throw) or mouth (e.g., blow), while unintelligible nonwords were sounds which matched the verbs in duration, intensity, temporal modulation, and power spectrum. Complex oscillatory dynamics were observed in the delta, theta, alpha, beta, low, and high gamma (HG) bands in response to presentation of all stimulus types. HG activity (80–200 Hz) in the ECoG tracked the spatiotemporal dynamics of word processing and identified a network of cortical structures involved in early word processing. HG was used to determine the relative onset, peak, and offset times of local cortical activation during word processing. Listening to verbs compared to nonwords sequentially activates first the posterior superior temporal gyrus (post-STG), then the middle superior temporal gyrus (mid-STG), followed by the superior temporal sulcus (STS). We also observed strong phase-locking between pairs of electrodes in the theta band, with weaker phase-locking occurring in the delta, alpha, and beta frequency ranges. These results provide details on the first few hundred milliseconds of the spatiotemporal evolution of cortical activity during word processing and provide evidence consistent with the hypothesis that an oscillatory hierarchy coordinates the flow of information between distinct cortical regions during goal-directed behavior.
Introduction
Paul Broca (Broca, 1861 ) and (Carl Wernicke Wernicke, 1874 ) were among the most noted scientists to identify critical brain regions responsible for the production and comprehension of speech. Since their reports of patients with focal brain damage it has become evident that language processing involves a widely distributed network of distinct cortical areas (Belin et al., 2002 ; Binder et al., 2000 ; Démonet et al.,1994 ; Dronkers et al., 2004 ; Dronkers, et al., 2007 ; Fecteau et al., 2004 ; Giraud and Price, 2001 ; Indefrey and Cutler, 2005 ; Mummery et al., 1999 ; Petersen et al., 1988 ; Price et al., 1992 ; Price et al., 1996 ; Scott and Wise, 2004 ; Vouloumanos et al., 2001 ; Wise et al., 1991 ; Wise et al., 2001 ; Wong et al., 2002 ; Zatorre et al., 1992 ) engaged in a complex pattern of activation during linguistic processing (Friederici et al., 1993 ; Kutas and Hillyard, 1980 ; Marinković et al., 2003 ; Marinković, 2004 ; Neville et al., 1991 ; Osterhout and Holcomb, 1992 ; Pulvermuller et al., 2003 ; Pulvermuller et al., 2006 ). Several theoretical models of language processing have been proposed to explain the spatiotemporal dynamics of cortical activity observed in empirical studies of language processing (Binder et al., 1994 , 1997 , 2000 ; Hickok and Poeppel, 2000 , 2004 , 2007 ; Pulvermuller, 2005 ).
Binder et al. (2000) propose a hierarchical model of language processing. Using functional magnetic resonance imaging (fMRI), Binder and colleagues generated a map of functional subdivisions within the human temporal cortex by having subject listen to unstructured noise, frequency-modulated (FM) tones, reversed speech, pseudowords, and words. They demonstrated that cortical regions surrounding Heschl's Gyrus bilaterally – in particular, the planum temporale and dorsolateral superior temporal gyrus (STG) – were more strongly activated by FM tones than by noise, suggesting that the regions are involved in processing temporally structured auditory stimuli. Speech stimuli, on the other hand, showed greater bilateral activation of the cortical regions surrounding the superior temporal sulcus (STS). Their results suggest a hierarchical processing stream which projects from the dorsal temporal cortex ventrally to the STS, the middle temporal gyrus (MTG), the inferior temporal gyrus (ITG), and then posteriorly to the angular gyrus and anteriorly to the temporal pole. Binder and colleagues provide a spatial map of language-related activity, but the neuroimaging method used does not provide temporal information about the onset, duration, and offset of activity in these cortical regions.
In support of a functional subdivision of human lateral temporal cortex, Hickok and Poeppel (2007) have suggested that language is represented by two processing streams: (1) a bilaterally organized ventral stream, which is involved in mapping sound onto meaning and includes structures in the superior and middle portions of the temporal lobe; and (2) a left dominant dorsal stream, which translates acoustic speech signals into motor representations of speech and includes the posterior frontal lobe and the dorsal-most aspect of the temporal lobe as well as the parietal operculum. Focusing on the ventral stream, Hickok and Poeppel propose a model which suggests that cortical speech processing first involves the spectrotemporal analysis of the acoustic signal by auditory cortices in the dorsal STG and phonological level processing involves the middle to posterior portions of the STS. Subsequently, the system diverges in parallel into the ventral and dorsal streams. The ventral stream projects toward the posterior middle and inferior portions of the temporal lobes, a region believed to link phonological and semantic information. These authors argue that the more anterior regions of the middle and inferior portions of the MTG are involved in a combinatorial network of speech processing. They further argue that parallel pathways are involved in mapping acoustic input into lexical phonological representations. They propose a multi-resolution model where speech is processed concurrently on two different time scales (a slow and fast rate), and then information is extracted and combined for lexical access. One pathway, right dominant lateralized, samples the acoustic input at a slow rate (theta range) and resolves syllable level information. The other pathway samples at a fast rate (gamma range) and resolves segment level information. According to their formulation, the fast pathway may be bilaterally organized, although this idea does not fit easily with the extant aphasia literature documenting a strong left hemisphere bias for language. Under normal conditions, these two pathways interact between hemispheres as well as within hemispheres, and each appears to be capable of activating lexical phonological networks.
A different approach was taken by Pulvermuller (1999, 2005) , who proposes that the lexicon is implemented by an associative network of activity where distinct cell assemblies represent different words and word classes. According to his theory, content words (nouns, adjectives, and verbs) are represented by a network of neurons located in both hemispheres and function words (pronouns, auxiliary verbs, conjunctions, and articles) which serve a grammatical purpose are housed primarily in the left hemisphere. All word types include a perisylvian cell assembly. Within the content word class, Pulvermuller describes different networks of cell assemblies representing “action words” and “perception words”. According to Pulvermuller, action words (words which refer to the movement of one's own body) are represented by a spatially extended reverberating circuit which includes perisylvian regions, premotor cortex, and the appropriate region of the motor cortex. In his theory, the word “blow” is represented by a distributed network of cell assemblies residing in perisylvian regions, premotor cortex, and the mouth portion of the motor homunculus, whereas the word “throw” is represented by perisylvian regions, the premotor cortex, and the hand portion of the motor homunculus. In contrast to these action words, perception words such as “tree” and “ocean” are represented by a perisylvian cell assembly linked to neuronal groups in the visual cortices of the occipital and temporal lobes. Pulvermuller and colleagues have provided evidence in support of this somatotopic cell assembly model of language using a variety of neuroimaging techniques, including fMRI, electroencephalography (EEG), magnetoencephalography (MEG), and TMS (Hauk et al., 2004a ; Hauk and Pulvermuller, 2004b ; Pulvermuller et al., 2005a ). Pulvermuller also proposes that cell assembly activation results in a fast, coherent reverberation of neuronal activity occurring in the low gamma range. In support of this “reverberating circuit” hypothesis, several EEG and MEG studies have shown stronger responses in the 25–35 Hz range to words as opposed to pseudowords (Lutzenberger et al., 1994 ; Pulvermuller et al., 1994b , 1995b , 1996b ) and in the 60–70 Hz range to words as opposed to nonwords (Eulitz et al., 1996 ).
It is difficult to fully evaluate the proposed models using only noninvasive neuroimaging techniques alone. Multiple studies using fMRI, positron emission tomography (PET), and patient populations with brain lesions have identified key brain areas involved in language processing. However, these techniques lack the temporal resolution needed to identify the precise order of activation of distinct cortical regions required to test alternative models of linguistic processing. Scalp-recorded EEG and MEG can track the fast time course of language processing but cannot unambiguously determine the spatial location of activated cortical areas (Friederici et al., 1993 ; Kutas and Hillyard, 1980 ). One neuroimaging method with excellent combined spatial and temporal resolution is electrocorticography (ECoG) recorded directly from the human cortex using subdural electrodes. The ECoG technique has several advantages over EEG and MEG. The subdural ECoG signal is an order of magnitude stronger in amplitude than scalp recorded EEG and is not affected by the ocular and muscle artifacts which contaminate scalp EEG. Furthermore, the source of the signal may be more precisely estimated. Most importantly, the ECoG signal provides access to high frequency electrical brain activity (60–200 Hz) not readily seen in the scalp EEG. The high gamma (HG) band (80–200 Hz) has been shown to be a strong index of sensory-, motor-, and task-related cortical activation across multiple tasks including language processing (Crone et al., 1998a , 1998b ; Crone et al., 2001a , 2001b ; Edwards et al., 2005 ). HG is largely invisible to scalp EEG due to amplitude attenuation and spatial low-pass filtering (Nunez and Srinivasan, 2006 ). HG amplitude can exist as high as 5–10 μV on the cortex and is likely at least an order of magnitude less on the scalp. This is due to a drop in field strength due to distance from the cortical surface to the scalp combined with fact that HG dipole generators of the ECoG can be 180 degrees out of phase within ∼3 mm on the cortical surface. Thus, positive and negative voltages can cancel resulting in no signal at the scalp. In this study, we used the high spatial and temporal resolution characteristic of ECoG HG activity seen with ECoG to expand upon previous findings and constrain competing theories of language by examining the spatiotemporal dynamics of word processing.
Materials and Methods
Participants
The four patients (all females, age range 35–45 years) participating in this study were candidates for surgical treatment for medically refractory epilepsy. Each had undergone a craniotomy for chronic implantation of a subdural electrode array and depth electrodes. The placement of the electrodes was determined on clinical grounds and varied for each subject, but included coverage of an 8 cm × 8 cm area centered over the left frontotemporal region for each of the four subjects described here. Implantation was followed by approximately 1 week of continuous monitoring of the ECoG in order to more precisely localize (1) the seizure focus for later resection, and (2) critical language and motor areas to be avoided during resective surgery. Consenting patients participated in the research study during the week of ECoG monitoring. In addition to the language task discussed in this paper, several other sensory, motor, and cognitive tasks were performed by the subjects while the ongoing ECoG was continuously recorded. The study protocol, approved by the UC San Francisco and UC Berkeley Committees on Human Research, did not interfere with the ECoG recording made for clinical purposes, and presented minimal risk to the participating subjects. Subject A was a 37 year-old right-handed woman with medically intractable complex partial seizures. MRI was normal and PET scan showed left temporal hypometabolism. She had a left anterior temporal lobectomy including the left amygdala and anterior hippocampus. Pathology showed left mesial temporal sclerosis. Subject B was a 45 year-old right-handed woman with intractable complex partial seizures. MRI showed abnormal signal and thinning of the left frontal opercular cortex and insular cortex as well as diminished size of the left hippocampus. She had resection of a portion of the left frontal lobe and left amygdala and hippocampus. Pathology showed cortical dysplasia. Subject C was a 35 year-old right-handed woman with a left temporal abscess in childhood resulting in intractable complex partial seizures. MRI showed a small resection cavity in the anterior inferior left temporal lobe, a small area of gliosis in the left cingulate gyrus, and subtle changes in the left hippocampal body and tail. She had a left anterior temporal lobectomy including amygdala and anterior hippocampus. Pathology showed gliosis and hippocampal sclerosis. Subject D was a 37 year-old right-handed woman with reflex epilepsy: she had reading-induced seizures consisting of word blindness and then a subjective feeling that she was losing awareness of her surroundings. MRI showed left mesial temporal sclerosis. She had a left posterior inferior temporal resection. Pathology was reported as gliosis and focal neuronal loss.
Stimuli and Task Description
As part of an auditory-linguistic target detection task, patients listened to three types of stimuli: mouth- or hand-related action verbs (babble, bark, blow, chew, grin, growl, hiss, howl, kiss, laugh, lick, sigh, sing, smile, spit, suck, clap, fold, hang, knock, mix, pinch, point, pour, scoop, sew, squeeze, stir, swat, type, write, zip; 45.25% occurrence) acoustically matched but unintelligible nonwords (45.25% occurrence), and proper names which served as target stimuli (Alex, Barbara, Becky, Ben, Brad, Brenda, Chad, Charles, Chris, Cindy, Dan, David, Emily, Erik, George, Jake, James, Janet, Jason, Jen, John, Judy, Julie, Justin, Karen, Laura, Linda, Lisa, Liz, Martha, Megan, Mitch, Ryan, Sheila, Steve, Susan, Tom, Tony, Tracy, Vicky; 9.5% occurrence). Subjects were instructed to respond with a button press using their left index finger each time they heard a proper name and to ignore all other stimuli. All stimuli were presented via two speakers placed on a table over the subjects’ bed approximately 1 meter from the subject's head and were randomly mixed in presentation order with an inter-stimulus interval of 1063 ± 100 ms. All verbs and proper names were recorded by a female native English speaker. The recorded .wav files were opened in MATLAB and adjusted to have the same root-mean-square power (-15.86 dB) and duration (637 ms). Each nonword matched one of the action verbs (i.e., words) in duration, intensity, power spectrum, and temporal modulation but was rendered unintelligible by removing ripple sound components from the spectrogram of individual verbs. Briefly, a spectrogram was generated for each verb and a two-dimensional Fourier transform of the resulting image was performed. This process creates a list of amplitudes and phases for ripple sound components. Ripples corresponding to formants important for human speech discrimination were then removed. The remaining ripples were then summed to recreate a spectrogram. Since the spectrogram does not contain phase information, an iterative process was used to construct a sound waveform via spectrographic inversion (Singh and Theunissen, 2003 ). This approach permitted us to subtract the acoustically matched nonword response from the verb response leaving the activity specifically related to word (verb) processing. Number of presentations of each stimulus type for each subject: Subject A, Nverb = 288, Nnonword = 288, Ntarget = 60; Subject B, Nverb = 192, Nnonword = 192, Ntarget = 40; Subject C, Nverb = 192, Nnonword = 192, Ntarget = 40; Subject D, Nverb = 224, Nnonword = 96, Ntarget = 40.
ECoG Recording and Electrode Localization
The electrode grids used to record ECoG for this study were 64-channel 8 × 8 arrays of platinum–iridium electrodes. In these arrays, each electrode is a 4 mm diameter disk with 2.3 mm exposed (thus 2.3 mm effective diameter), with 10 mm center-to-center spacing between adjacent electrodes. The low-pass filter of the recording system used for clinical monitoring does not permit recording of the high frequency content of the ECoG signal. Therefore, the signal for the ECoG grid was split and sent to both the clinical system and a custom recording system. An electrode at the corner of the grid (see Figure 1 A) was used as reference potential for all other grid electrodes. The ECoG for patients 1–3 was amplified ×10 000 and analog filtered in the range of 0.01–250 Hz, while the ECoG for patient 4 was amplified ×5000 and analog filtered in the range of 0.01–1000 Hz. Signals were digitized at 2003 Hz with 16 bit resolution. ECoG was recorded in separate blocks approximately 6 minutes in length. The process used to localize electrodes and coregister them with the structural MRI has been described in detail elsewhere (Dalal, 2007). Preoperative structural MR images were acquired on all patients with a 1.5T MRI scanner. Initial coregistrations were obtained using digital photographs taken immediately before and after the grid implantation and preoperative MRI scans using the Brain Extraction Tool (http://www.fmrib.ox.ac.uk/analysis/research/bet/ ), MRIcro (http://www.sph.sc.edu/comd/rorden/ mricro.html ), and SPM2 (http://www.fil.ion.ucl.ac.uk/spm/software/spm2 ). Using the gyri and sulci as landmarks, the photographs for each patient were matched to their structural MRI via a 3D–2D projective transform with manual correction (see Figure 1 for grid locations in all subjects). These coregistrations were used to create the MRI renderings with electrode locations shown in Figures 1 and 3 A. We report subject A's data in detail and list here the MNI coordinates of each electrode for this case (electrode, x, y, z): e1, -52, -14, -42; e2, -53, -6, -36; e3, -54, 2, -30; e4, -49, 8, -22; e5, -45, 15, -14; e6, -52, 22, -10; e7, -50, 29, -2; e8, -47, 36, 6; e9, -58, -20, -37; e10, -60, -12, -31; e11, -59, -5, -24; e12, -55, 1, -16; e13, -52, 8, -7; e14, -55, 16, 0; e15, -54, 23, 8; e16, -47, 29, 16; e17, -64, -26, -30; e18, -67, -18, -24; e19, -64, -12, -16; e20, -60, -5, -8; e21, -58, 2, 0; e22, -58, 9, 8; e23, -56, 16, 16; e24, -49, 22, 24; e25, -66, -32, -22; e26, -69, -25, -15; e27, -66, -18, -7; e28, -62, -12, 1; e29, -61, -5, 9; e30, -60, 2, 17; e31, -57, 9, 25; e32, -51, 15, 33; e33, -68, -40, -14; e34, -69, -32, -7; e35, -67, -26, 1; e36, -65, -19, 9; e37, -63, -12, 17; e38, -60, -5, 26; e39, -57, 2, 33; e40, -52, 7, 42; e41, -67, -47, -6; e42, -67, -39, 1; e43, -66, -33, 9; e44, -65, -26, 17; e45, -63, -19, 25; e46, -61, -13, 34; e47, -57, -6, 42; e48, -50, -1, 49; e49, -65, -53, 2; e50, -66, -46, 10; e51, -64, -39, 17; e52, -64, -32, 25; e53, -63, -26, 33; e54, -59, -20, 41; e55, -54, -13, 49; e56, -48, -8, 57; e57, -62, -59, 11; e58, -65, -52, 18; e59, -65, -45, 26; e60, -65, -38, 34; e61, -60, -32, 41; e62, -55, -26, 49; e63, -48, -21, 55; e64, -43, -15, 62.
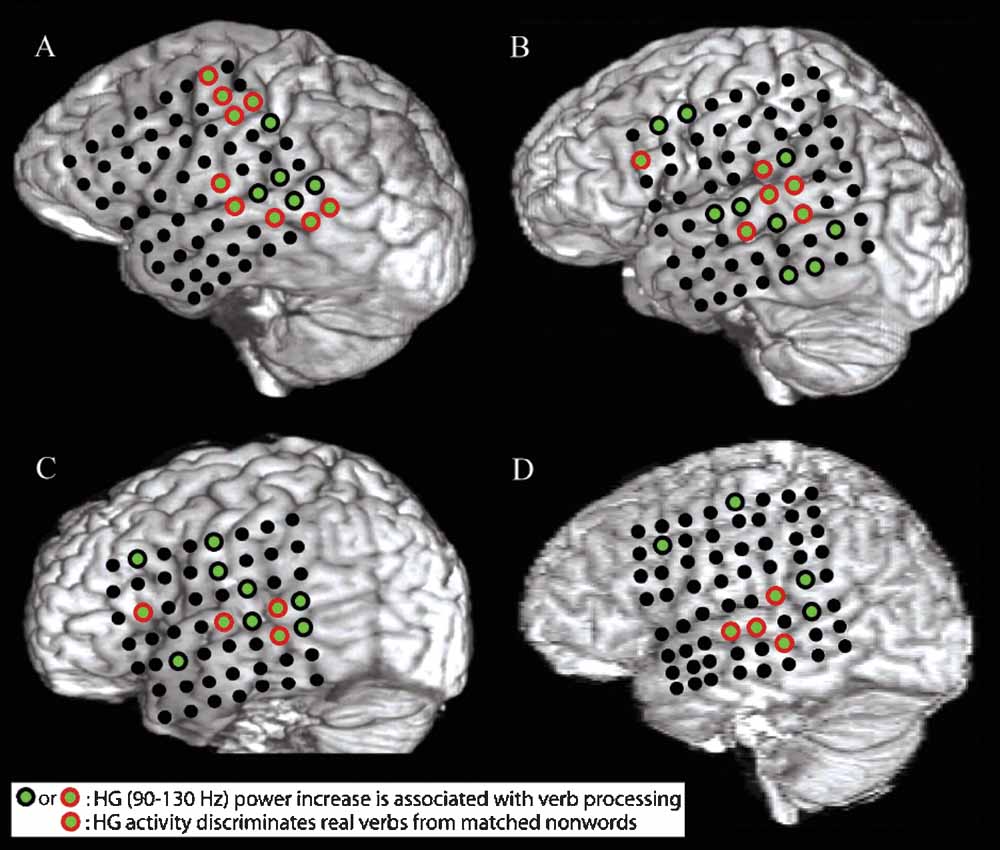
Figure 1. A–D show structural MRI renderings with electrode locations for the four subjects studied. Electrodes that exhibited a significant pre- to post-stimulus increase in HG power following verb presentation are shown with green centers. Electrodes that also showed a greater increase in HG power for presentation of verbs than for presentation of acoustically matched nonwords are outlined in red. Verb processing compared to nonword processing activates a distributed network of cortical areas including the post-STG, the mid-STG, and the STS.
Analysis
All analyses were done using custom MATLAB scripts. Prior to any further processing, channels with a low signal-to-noise ratio (SNR) were identified and deleted. Reasons for low SNR included 60 Hz line interference, electromagnetic noise from hospital equipment, and poor contact with cortical surface. The raw time series, voltage histograms, and power spectra were used to identify noisy channels. Two investigators had to both agree before a noisy channel was dropped. The multi-channel ECoG was digitally re-referenced to a common average and high-pass filtered above 2.3 Hz with a symmetrical (phase true) finite impulse response (FIR) filter (∼35 dB/octave roll-off) in order to minimize heartbeat artifact. Single channels of this minimally processed ECoG are referred to as the “raw signal” xRAW(t) in the following analyses. The raw ECoG signal and the event markers for the auditory stimuli were used to determine the direction, magnitude, and significance of event-related changes in the analytic amplitudes of different frequency bands of the ECoG signal.
To isolate a single frequency band in a single channel, the raw ECoG signal was convolved with an analytic Gabor basis function (Gaussian-weighted complex-valued sinusoid) to produce an analytic amplitude and analytic phase for that band at every sample point. This time-domain convolution was performed as a frequency-domain multiplication for computational efficiency. For example, given the sampling rate of 2003 Hz, a 5 minutes section of the raw, real-valued, time-domain ECoG signal xRAW(t) has N = 5 × 60 × 2003 = 600 900 sample points. An N-point, discrete-time complex Fourier transform (DTFT) of xRAW(t) generates a complex-valued, frequency-domain signal XRAW(f) with N = 600 900 points. Each (frequency-domain) sample point corresponds to the center frequency (CF) of a sinusoid whose time-domain representation has an integer number of cycles in the 5 minutes (N = 600 900 sample point) section considered, from 0 cycles (DC offset) to ±N/2 cycles (Nyquist frequency). Likewise, the analytic Gabor basis function has dual time-domain and frequency-domain representations and is continuous in both domains. Each analytic Gabor basis function is completely defined by two parameters, namely a CF and a fractional bandwidth (FBW). By sampling the analytic Gabor in the frequency-domain at the frequencies specified by XRAW(f), we generate a N-point discrete-frequency representation of the Gabor which we can call GCF,FBW(f). Since GCF,FBW(f) is analytic, it has non-zero weights only at non-negative frequencies. Multiplying XRAW(f) and GCF,FBW(f) generates a new frequency-domain signal ZCF,FBW(f). Applying an inverse DTFT to ZCF,FBW(f) completes the filtering process, generating a new, complex-valued time-domain signal zCF,FBW(t) = ACF,FBW(t) × exp[i × φCF,FBW(t)], where zCF,FBW(t) is the Hilbert transform of the band-passed ECoG signal, filtered with the given CF and FBW, ACF,FBW(t) is the analytic amplitude and φCF,FBW(t) is the analytic phase. The description above does not specify how the CF and FBW parameters were chosen. But as Bruns points out in his excellent paper (Bruns, 2004 ), the short-time Fourier transform (STFT), the band-pass Hilbert Transform (HT), and the wavelet transform (WT) as normally applied are mathematically identical to the process described above; each transform differs only in how it samples the available parameter space of CF and FBW. The full-width half-maximum (FWHM) bandwidth in units of Hertz is given by the CF (in Hz) multiplied by the FBW (unitless parameter); BW = CF × FBW. For example, with a CF of 10 Hz and a FBW of 0.25, the -6 dB power level is reached at 8.75 and 11.25 Hz, while for a CF of 85 Hz the -6 dB level is reached at 74.375 and 95.625 Hz. The WT uses a constant FBW, while for the STFT, the product BW = CF × FBW remains constant. In the analyses conducted for this paper, a constant FBW of 0.25 was used for a set of nearly logarithmically spaced center frequencies, which corresponds to a nonorthogonal, overcomplete wavelet decomposition. In particular, the 50 CFs used were: 2.5, 3.7, 4.9, 6.2, 7.4, 8.7, 10.0, 11.4, 12.8, 14.2, 15.6, 17.1, 18.7, 20.3, 22.0, 23.8, 25.5, 27.4, 29.4, 31.45, 33.7, 36.0, 38.4, 41.0, 43.7, 46.6, 49.6, 52.9, 56.4, 60.2, 64.2, 68.5, 73.2, 78.2, 83.6, 89.4, 95.7, 102.6, 110.0, 118.0, 126.8, 136.3, 146.6, 157.9, 170.1, 183.5, 198.1, 214.1, 231.5, 250.5 Hz.
To determine the direction and magnitude of stimulus event-related changes in the analytic amplitude of a given frequency band, first the raw ECoG signal xRAW(t) was convolved with a complex-valued Gabor basis function gCF,FBW(t) to generate the real-valued analytic amplitude time series ACF,FBW(t), which has the same number of samples as the raw ECoG signal. Second, epochs from -500 ms before to 1500 ms after the onset of an auditory stimulus were extracted from the real-valued time-series ACF,FBW(t). Third, these epochs were grouped according to stimulus type. That is, each individual epoch was assigned one of the labels VERBS, NONWORDS, or TARGET NAMES. Fourth, the mean amplitude as a function of time (mean across epochs for each sample point) was computed for each stimulus type. Fifth, the prestimulus mean (mean over time for the 500 ms interval before stimulus onset) was subtracted from each sample point of the trace in order to baseline correct the amplitude level. For each stimulus type, call this baseline-corrected time-series the real amplitude trace ATRACE(t), where -500 ms < t < 1500 ms around stimulus onset. In order to determine the significance of these stimulus event-related changes, an ensemble of surrogate mean amplitude values were created in order to determine the significance of the real amplitude trace. In detail, first the sample points corresponding to the onset of actual stimuli were all shifted forward or backward by the same randomly chosen integer lag, modulo the length of the continuous analytic amplitude time series ACF,FBW(t). This procedure preserves the number of samples between successive epochs, but shifts the surrogate indices away from actual stimulus onsets. Second, the mean amplitude across these surrogate indices is determined and stored. This value is one member of the surrogate ensemble. Third, this procedure was repeated 10 000 times to create a complete ensemble of 10 000 surrogate values. Fourth, a Gaussian distribution was fit to the ensemble. Note that while the raw amplitude values are well-fit by a Gamma distribution, the mean amplitude across epochs is well-fit by a Gaussian, in accord with the Central Limit Theorem. Fifth, the real amplitude trace ATRACE(t) was divided by the standard deviation of the ensemble to create a normalized or z-scored amplitude trace ZTRACE(t). Since the standard deviation of the ensemble of amplitude means is a measure of the intrinsic variability of the across-epoch mean analytic amplitude of the frequency band under examination, ZTRACE(t) can be used to directly determine the uncorrected two-tailed probability that the deviation seen in the real amplitude trace ATRACE(t) at time t is due to chance (rather than evoked by the stimulus itself). Sixth, the above procedure was applied to all CFs and all electrodes in each subject and subjected to a FDR correction of q = 0.01 in order to determine a corrected significance threshold. That is, uncorrected p-values from the time-frequency-channel-condition matrix were sorted in ascending order {p1, p2, p3,…,pM}, where M is the total number of separate comparisons for a single subject, with the threshold T = pa determined such that k > a implies pk > kq/M. The corrected event-related time–frequency z-scores are plotted in Figures 3 , 4 B, and 5 6 7 .
To compute the mean phase-locking value (PLV) as a function of frequency and inter-electrode distance and preferred phase difference plotted in Figure 8 , first the raw ECoG signal xRAW_A(t) from a given channel A was convolved with a complex-valued Gabor basis function gCF,FBW(t) to generate the complex-valued analytic time series zCF,FBW_A(t), which has the same number of samples as the raw ECoG signal. Second, each sample point in this time series was divided by its modulus to generate the unit-length, complex-valued phase time series φCF,FBW A(t). Third, this process was repeated for a different channel B to generate φCF,FBW B(t). Fourth, these two time series were divided in a pointwise fashion to generate a new, unit-length, complex-valued time series φCF,FBW A B DIFF(t), where the angle of each sample point in this time series represents the phase difference between φCF,FBW A(t) and φCF,FBW B(t). Fifth, the mean of φCF,FBW A B DIFF(t) over all time points was taken. The modulus of this mean is the PLV, while the angle of this mean is the preferred direction (the phase difference between φCF,FBW A(t) and φCF,FBW B(t) which occurs most often over time). Sixth, the distance between pairs of channels A and B was determined and the mean PLV of all pairs with this inter-electrode distance was determined for all frequencies between 2 and 32 Hz (Figure 8 A). Seventh, a histogram of preferred directions was computed for all channel pairs and frequencies (Figure 8 B).
Figures 1 and 2 B require the direct comparison of verbs to nonwords, rather than a comparison of pre- to post-stimulus activity, as above. To compute this, first the same analysis steps as above up to step three were completed, generating ensembles of single-trial epochs of band-passed analytic amplitude time-series labeled VERBS (with NVERBS single trials), NONWORDS (with NNONWORDS single trials), and TARGET NAMES (with NTARGET NAMES single trials). Second, the mean amplitude as a function of time (mean across epochs for each sample point) was computed for VERBS and NONWORDS and their difference taken. Call this trace the DREAL(t). Third, new surrogate single-trial ensembles were created by randomly permuting the set {VERBS, NONWORDS} and assigning the first NWORDS single-trial traces to the group SURROGATEVERBS and the remaining NNONWORDS single-trial traces to the group SURROGATENONWORDS. Fourth, the mean amplitude as a function of time (mean across epochs for each sample point) was computed for SURROGATEVERBS and SURROGATENONWORDS and their difference taken. Call this trace the DSURROGATE(t). Fifth, this process was repeated 2500 times to create a distribution of surrogate values at each time point. Sixth, a Gaussian distribution was fit to the distribution of surrogate values at each time point. Seventh, for each time point t, the value of the actual trace DREAL(t) was normalized by the Gaussian fit of surrogate values to create a normalized trace ZTRACE-DIFFERENCE(t), from which the uncorrected probability that the value seen at each sample point was due to chance could be estimated by referencing the standard normal cumulative distribution function. Eighth, the above procedure was applied to all CFs and all electrodes in each subject and subjected to a FDR correction of p = 0.01 in order to determine a corrected significance threshold.
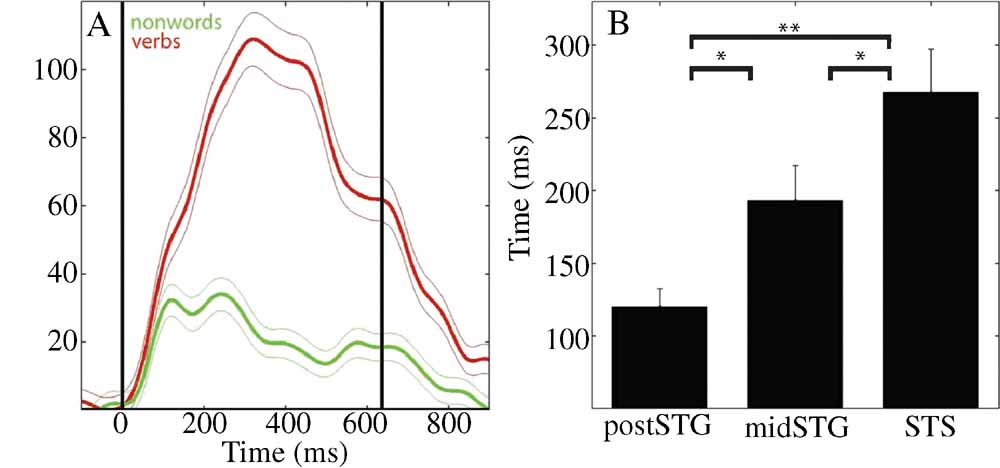
Figure 2. (A) Mean (±SE) percent signal change of HG analytic amplitude for verbs (red) and nonwords (green) for an electrode over the STS in patient A (49, see Figure 4 A for location). Black vertical lines indicate onset and offset of verb stimulus. (B) Processing of words as opposed to acoustically matched nonwords sequentially activates the post-STG, then the mid-STG, followed by the STS. Mean (±SE) onset time of significantly different HG activity for words versus acoustically matched nonwords in post-STG, mid-STG, and STS. (*: p < 0.05; **: p < 0.001, FDR corrected). (HG, 80–200 Hz) is the most effective frequency band for the temporal tracking of cortical activity associated with word processing.
Results
Time–frequency analysis of the ECoG signals during processing of hand- and mouth-related verbs, acoustically matched nonword stimuli, and target names revealed three key observations.
Spatial Results
All subjects showed an increase in HG power following presentation of words relative to acoustically matched nonwords at electrodes located over the posterior superior temporal gyrus (post-STG), middle superior temporal gyrus (mid-STG), and the STS (electrodes with red circle around green center in Figure 1 , p < 0.01, FDR corrected). Event-related power changes were also observed in the delta (2–4 Hz), theta (4–8 Hz), alpha (8–12 Hz), beta (12–30 Hz), and low gamma (30–80 Hz) bands in all subjects (p < 0.001, FDR corrected). As shown for one subject in Figure 3 , the spatial and temporal pattern of power changes in the delta, theta, alpha, beta, and low gamma bands were distinct from the spatiotemporal maps of HG activity. Across all electrodes in all subjects, a greater number of electrodes exhibited significant power changes for low frequencies than for high frequencies following presentation of verbs, with 39.8% (96/241) of channels showing changes in the delta band, 25.7% (62/241) for theta, 19.5% (47/241) for alpha, 17.0% (41/241) for beta, 18.7% (45/241) for low gamma, and 13.7% (33/241) for HG. While a significant negative correlation between frequency and spatial extent exists (r2 = 0.63, p < 0.0001), HG channels exhibit a high SNR. Thus, HG is a strong, spatially specific signal, while lower frequency bands such as theta exhibit changes over a wider spatial area.
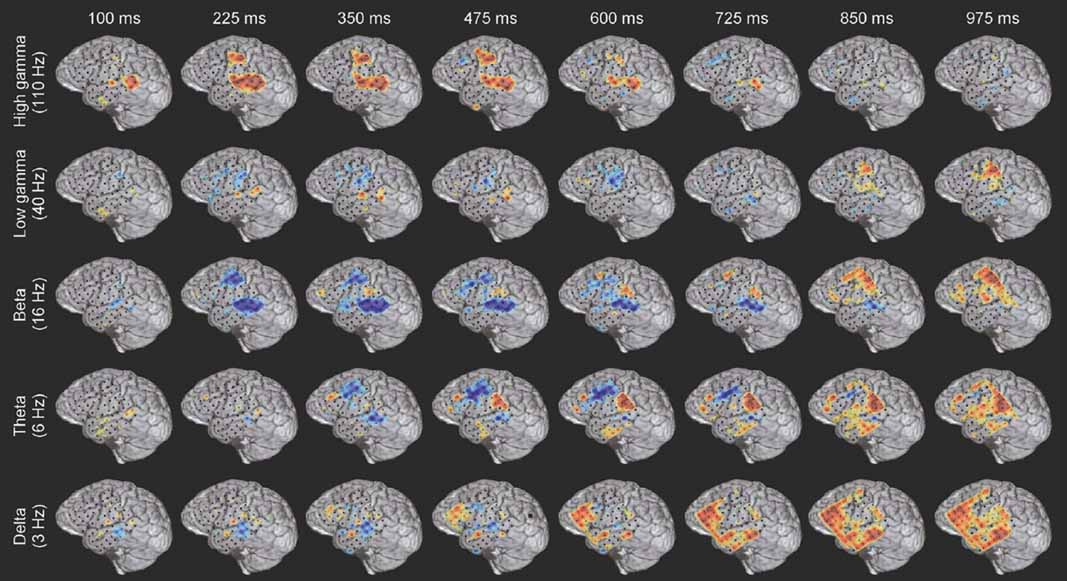
Figure 3. Example of the spatiotemporally complex oscillatory dynamics associated with verb processing. Spatial pattern of power changes in different frequency bands at successive times in response to verb presentation in subject A (see Figure 4 A for electrode locations on MRI rendering and methods for MNI coordinates). Red indicates power increase and blue indicates power decrease. HG activity along the STG and STS has an early, strong onset, and in this subject is accompanied by activation of premotor regions. An initial beta power decrease occurs at and surrounding regions of strong HG activity, but note the late (850–975 ms) beta power increase over motor areas. Theta power shows a transient power decrease over premotor/frontal areas (350–725 ms) and a late onset power increase over the inferior parietal lobule (e.g., 600–975 ms). Delta activity is late and spatially diffuse over prefrontal and middle temporal regions. Note that power changes in different frequency bands are active in overlapping but distinct cortical territories, and show distinct temporal patterns of onset, duration, and offset.
Temporal Results
Across subjects HG power tracked a sequence of word-specific processing starting in the post-STG at 120 ± 13 ms (mean onset time ± standard error), moving to the mid-STG 73 ms later (193 ± 24 ms), before activating the STS at 268 ± 30 ms. Figure 2 B shows that the onset time of the HG activity which differentiates words from acoustically matched nonwords in the STS is significantly later than in the mid-STG (p < 0.05, FDR corrected) or post-STG (p < 0.001, FDR corrected), and that mid-STG activity is significantly later than in post-STG (p < 0.05, FDR corrected). The duration of HG activity associated with word processing was coupled to stimulus onset and offset, while the magnitude of change depended upon stimulus type. For example, Figure 2 A shows the percent signal change in mean HG amplitude in response to verbs (red) and nonwords (green) with a duration of 637 ms for one electrode over the STS in one subject (electrode 49 in subject A). Presentation of simple tones of 180 ms duration resulted in a shorter duration of associated HG activity (p < 0.001, data not shown). Considering all electrodes in all subjects, we observed a negative correlation between frequency and the time of onset of significant power changes following presentation of verbs (r2 = 0.69, p < 0.0001), with HG activity occurring ∼600 ms before changes in theta power.
Stimulus- and Task-dependent Spectral Results
The spatiotemporal pattern of these frequency-specific oscillatory responses depend on both stimulus type and task demands. While similar results were observed for all subjects, below we consider the results from one subject in greater detail. Figures 5 6 7 show the event-related time-frequency responses for each electrode in subject A in response to the presentation of verbs, acoustically matched nonwords, and proper names which served as targets in this target detection task. Note that while some electrodes show a similar HG response to all auditory stimuli (e.g., electrode 58 over post-STG), several other electrodes show a differential response to linguistic stimuli such as verbs and names versus nonlinguistic stimuli such as the acoustically matched nonwords (e.g., electrodes 49 over the STS, and 55 over premotor area). In contrast, other electrodes exhibit differential responses to targets (names) versus distractors (verbs and nonwords) (e.g., electrodes 8 and 15 over prefrontal cortex). The presentation of proper names (targets in this target detection task) evoked HG activity in electrodes over prefrontal sites in all subjects (p < 0.01, FDR corrected). While verbs, nonwords, and target names all produced distinct changes in the spatiotemporal patterns of spectral power, no significant differences in the ECoG response to the presentation of hand-related verbs alone and mouth-related verbs alone was observed in any electrode, including those over motor and premotor cortices.
While the response for some frequency bands was similar for all stimulus types even when the HG response was not (e.g., beta power drop in electrode 35 over mid-STG), other bands showed sensitivity to targets versus distractors or linguistic category (e.g., theta at electrode 59 over the inferior parietal lobule, or delta at electrode 24 over the frontal lobe). This frequency-specific event-related activity occurred at different times in distinct cortical areas. In particular, note that (1) the power in a particular band can decrease in one local region while simultaneously increasing elsewhere (e.g., theta power profile at 600 ms in Figure 3 ), and that (2) different bands can be active in different areas (e.g., delta in frontal and middle temporal areas, theta in inferior parietal lobule, and beta in STG and motor areas at 850 ms in Figure 3 ) or at different times (e.g., early HG vs. late theta activity).
Even a single, local cortical area can show a complex oscillatory response during the processing of words, suggesting that multiple, spatially overlapping, frequency-tagged neuronal assemblies may become active in parallel as they engage in selective communication with other cortical regions. As an example, Figure 4 B shows the ECoG time–frequency response for an electrode over a premotor area in subject A in response to word presentation. Note that three key bands show sustained responses: a strong HG (110 Hz) power increase, quickly followed by a power drop in the beta 16 Hz) band, with a drop in theta power occurring 200 ms later.
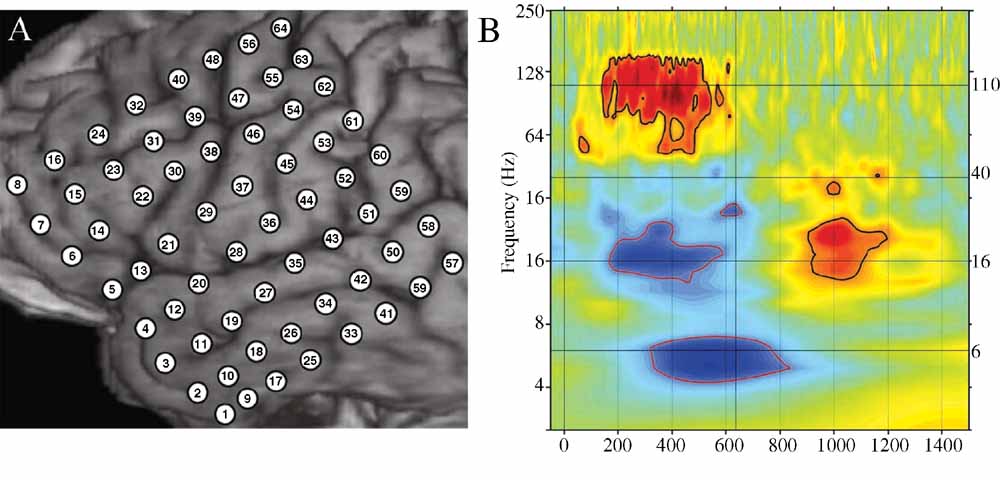
Figure 4. (A) Close-up of structural MRI for subject A showing numbered electrode positions (see also Figure Figure 1 A for same subject). See methods for MNI coordinates. (B) Event-related time–frequency plot for ECoG response at electrode 55 (premotor region) following verb presentation. Verb onset (0 ms) and offset (637 ms) are marked by solid black vertical lines. Black horizontal lines mark frequencies of interest (6, 16, 40, and 110 Hz) which are shown inb> Figure 3 . Note strong HG (∼110 Hz, HG) power increase (red), initial beta (∼16 Hz) power decrease (blue) followed by very late beta increase, and late theta (∼6 Hz) power decrease. Outermost black (red) contour line indicates significant power increase (decrease) (p < 0.001, FDR corrected).
Additionally, while the HG and beta responses end with stimulus offset, the theta response continues for several hundred milliseconds after stimulus offset and is followed by a late, transient increase in beta power.
In addition to the univariate analyses above, we also examined the frequency-specific phase-locking value between pairs of channels. PLVs between pairs of electrodes considered as a joint function of frequency (2–32 Hz) and inter-electrode distance (10–100 mm) have local maxima (peaks) in the delta, theta, alpha, and beta bands (e.g., Figure 8 A), with the strongest PLV occurring in the theta band for all inter-electrode distances. The preferred phase difference between electrodes clusters around 0 radians (0 degree, in phase) and π radians (180 degree out of phase) for all frequencies between 2 and 32 Hz.
Discussion
This study employed direct cortical ECoG recording to examine the event-related power changes in several frequency bands in order to evaluate models of language processing. These ECoG results demonstrate an orderly and automatic flow of word processing in the human temporal lobe. In particular, the HG band identifies the cortical regions involved in word processing with a greater spatial and temporal specificity than any other frequency band tested. Word processing involves sequential activation of the post-STG, mid-STG, and STS and these results validate previous spatial results regarding the cortical regions involved in word processing, and, in turn, language comprehension. These neuroanatomical results support lesion and neuroimaging studies which have shown word-related activity to occur in the post-STG, mid-STG, and STS (Belin et al., 2002 ; Binder et al., 2000 ; Démonet et al., 1994 ; Dronkers et al., 2004 ; Dronkers et al., 2007 ; Fecteau et al., 2004 ; Giraud and Price, 2001 ; Indefrey and Cutler, 2005 ; Mummery et al., 1999 ; Petersen et al., 1988 ; Price et al., 1992 ; Price et al., 1996 ; Scott and Wise, 2004 ; Vouloumanos et al., 2001 ; Wise et al., 2001 ; Wong et al., 2002 ; Zatorre et al., 1992 ). However, these results also reveal the temporal flow of information between these distinct brain regions and support a component of serial processing in language. This study complements and extends Binder and colleagues (2000) by demonstrating that word processing first activates the post-STG, then the mid-STG, and finally the STS.
Hickok and Poeppel (2007) propose a hierarchical model of word processing with parallel analysis of a word for its acoustic-spectral content by auditory regions and for its phonetic content by the STS, and later for its meaning-based content by regions in the posterior middle and inferior portions of the temporal lobe. Importantly, they specify that both the left and the right hemispheres are involved in speech processing (i.e., predominately the ventral stream). In this study, we were unable to thoroughly address their argument for parallel processing, because all of our subjects had electrode grids placed over their left hemisphere for clinical purposes. In regards to information flow, however, we did observe a systematic flow of word processing beginning with acoustic processing in the auditory cortices and ending with meaning-based processing in the STS. Note that Hickok and Poeppel argue that the STS is involved in phonetic processing. Our paradigm did not included phonemes so we cannot definitely conclude that the STS is solely involved in the processing of words for meaning and not involved in phonetic level analysis. We can, however, conclude that our data supports their proposal of a hierarchically organized ventral stream, which may not necessarily correspond with their functional subdivision of the temporal cortex.
In accord with Pulvermuller's theory of speech perception, we found HG activity occurring in the perisylvian regions with verb stimuli. However, we found no evidence in this dataset to support Pulvermuller's (1999) hypothesis that hand- and mouth-related verbs activate two different networks: one including perisylvian language areas and the mouth region of the motor cortex, and the other including perisylvian language areas and the hand region of the motor cortex. However, this should not be taken as definitive evidence against Pulvermuller's theory. For instance, EEG and ECoG electrodes are maximally sensitive to dipole sheets of different radii – while the signal from each 2.3 mm diameter ECoG electrode is largely generated by radially oriented cortex directly underneath it, EEG electrodes will record the largest signal from a properly oriented dipole sheet with a radius of 7–10 cm (Nunez et al., 2006). This implies that a highly synchronized neuronal assembly distributed over several different cortical regions may generate a strong scalp-EEG signal but only a weak ECoG signal at a local electrode, while ECoG can detect the activation of a synchronous, spatially localized neuronal assembly which remains invisible to EEG, perhaps explaining the contrast of the results of this study with previous findings (Pulvermuller et al., 2005b ). Nonetheless, word processing did activate electrodes over motor or premotor areas in all subjects examined (green electrodes in Figure 1 ), consistent with previous fMRI findings (Wilson et al., 2004 ).
It is difficult to model the activity observed at a single electrode in terms of a simple, monochromatic model of cortical “activation” and “inactivation”. A single cortical region can produce a spatiotemporally complex oscillatory response (e.g., Figure 4 B), and the existence of several semi-autonomous but interacting rhythms would seem to require distinct but spatially overlapping neuronal cell assemblies operating at those frequencies. Furthermore, complex behavioral tasks such as language require the coordination and integration of information across several different anatomically segregated brain areas. One class of models for how this integration could be accomplished proposes an oscillatory hierarchy operating at several different scales which can control the effective connectivity between separate neuronal assemblies (Lakatos et al., 2005 ). In particular, the receptivity of neurons to post-synaptic input and the probability of spiking output can be modulated by locally adjusting the amplitude and phase of ongoing rhythms, which reflect the population activity of distinct neuronal populations (Fries, 2005 ; Jacobs et al., 2007 ; Schaefer et al., 2006 ).
Examining the ECoG response of subjects to different stimulus types and task demands provides additional insight into the functional roles of neuronal sub-populations. Figures 5 6 7 show the event-related time-frequency response for all electrodes in Subject A following the presentation of hand- and mouth-related verbs, acoustically matched nonwords, and proper names. Importantly, verbs and names are intelligible while the nonwords were not. However, verbs and nonwords served as distractors and proper names served as targets in the task. Thus, observed differences in the oscillatory response patterns for the three conditions provide insight into the functional role of different rhythms; that is, were some oscillatory dynamics particular to language use, or to target detection, or do these oscillations arise with cortical activation in general?
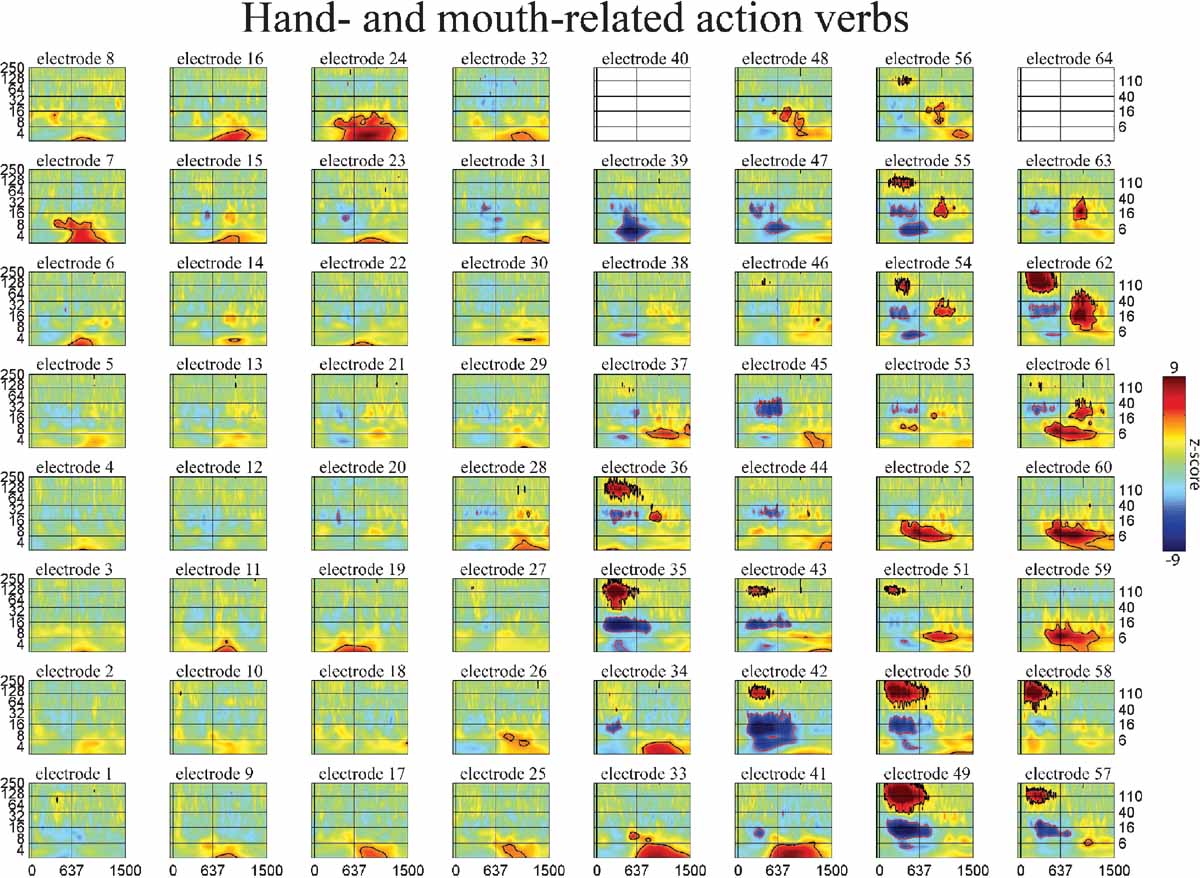
Figure 5. Event-related time–frequency plots for all electrodes in subject A in response to presentation of verbs. See Figure 4 A and methods for electrode locations. Vertical lines indicate stimulus onset and offset. Horizontal lines indicated frequencies of interest (theta, beta, low gamma, and HG). Outermost black (red) contour line indicates significant power increase (decrease) (p < 0.001, FDR corrected). Note that some electrodes show a similar HG response to all auditory stimuli (e.g., 58 over STG), while the HG response of others depends on linguistic category (verbs and names vs. nonwords, e.g., 49 over STS or 55 over premotor areas) or task demands (targets vs. distractors, e.g., 8 and 15 over prefrontal cortex). Other bands also exhibit stimulus specificity: e.g., theta at 59 over the inferior parietal lobule, or delta at 41 over middle temporal gyrusb>. (c.f. Figures 6 and 7 ).
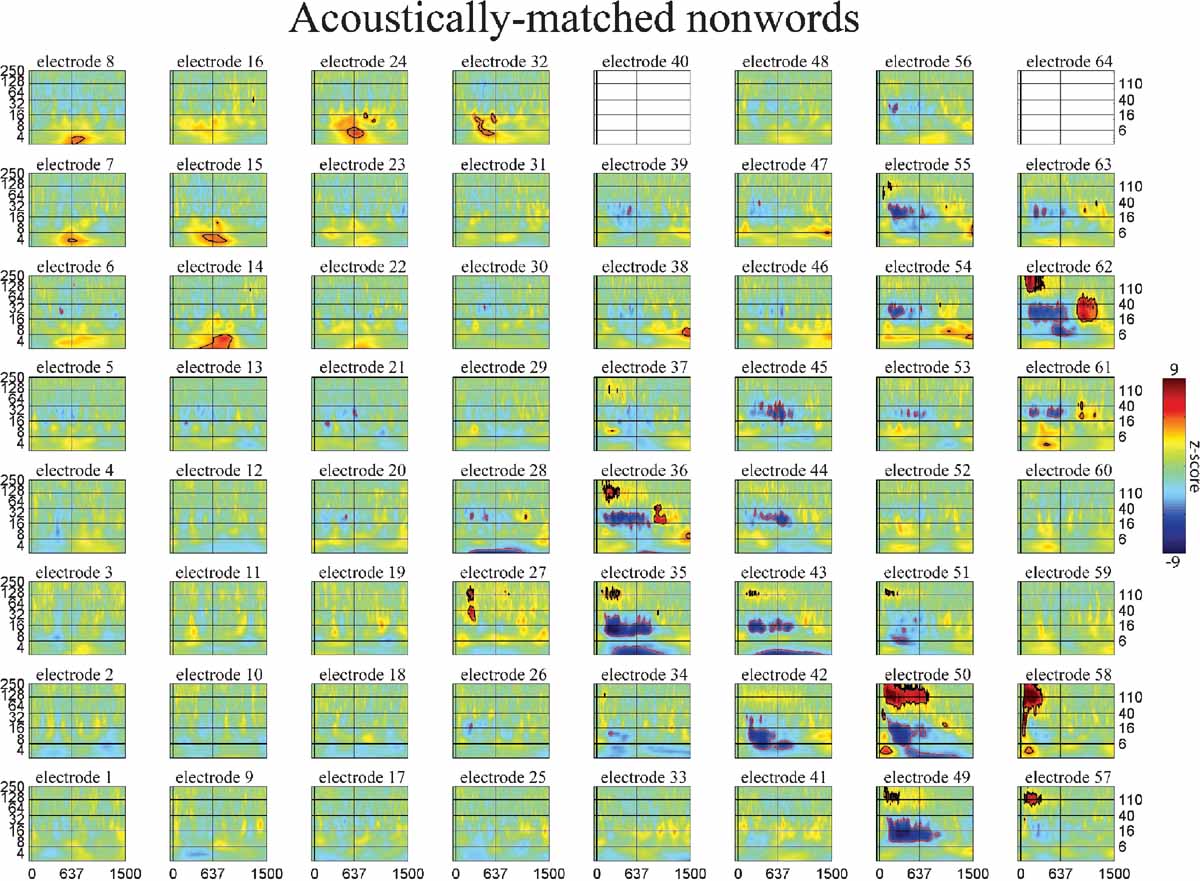
Figure 6. Event-related time-frequency plots for all electrodes in subject A in response to presentation of acoustically matched (unintelligible) nonwords. See Figure 4 A and methods for electrode locations. Vertical lines indicate stimulus onset and offset. Horizontal lines indicated frequencies of interest (theta, beta, low gamma, and HG). Outermost black (red) contour line indicates significant power increase (decrease) (p < 0.001, FDR corrected). See also legend for Figure 5 .
For example, consider the role of the theta rhythm in this task. The theta rhythm has been associated with many different functional roles in humans and animals, including navigation, working memory, attention, and executive control (Caplan et al., 2003 ; Ekstrom et al., 2005 ; Gevins et al., 1997 ; Ishii et al., 1999 ; Kahana et al., 1999 ; Onton et al., 2005 ; Sederberg et al., 2003 ). One notion is that theta activity observed in the ECoG data set may be involved in maintaining task set and readiness. Alternatively, theta could be involved in linguistic or semantic consolidation, supporting the recently described role of theta phase in speech discrimination (Luo and Poeppel, 2007 ). If theta power were involved in semantic processing, then a similar response to both distractor verbs and target names would be expected.
Consider the response in electrode 59 in Figures 5 6 7 (situated over the inferior parietal lobule in subject A). This site has no response to the nonlinguistic nonword distractors. In contrast, this site shows a strong increase in theta power for verb distractors but a strong decrease in theta power for target names. In addition, targets produce a strong, sustained increase in HG power. Interestingly, while target detection requires an ipsilateral motor response, self-paced finger tapping generates only a brief, weak drop in the theta power and no HG activity at this electrode (tapping data not shown). This supports the idea that patterns of theta power change seen during components of this study are related to maintaining and regulating task-specific behavior rather than to semantic processing as such. This is consistent with the demonstrated role of the theta rhythm in regulating the top–down modulation required for complex behavioral tasks. Note however that Luo and Poeppel (2007) using MEG report that theta phase, not power, was associated with speech discriminability when listening to sentences. Thus, while no theta phase resetting was observed in response to the presentation of single words in this study, it is possible that theta phase and power could play different but complementary roles in modulating the activity in a cortical area, with power controlling the amount of activity and phase controlling the timing of neuronal spiking (Bartos et al., 2007 ; Klimesch et al., 2007 ). Indirect evidence for this is the observed coupling of low gamma and HG power to both theta phase and theta power in human hippocampus and neocortex (Bruns and Eckhorn, 2004 ; Canolty et al., 2006 ; Mormann et al., 2005 ). Theta gating of single-unit activity in human hippocampus (Jacobs et al., 2007 ) provides direct evidence for oscillatory control of neuronal activity. The fact that we observed strong phase-locking in the theta band, with phase differences clustered around 0 and π radians (optimal phase offsets for communication and isolation, respectively), suggests that the theta rhythm may be an important regulator of inter-regional communication during complex behavioral tasks (Fries, 2005 ).
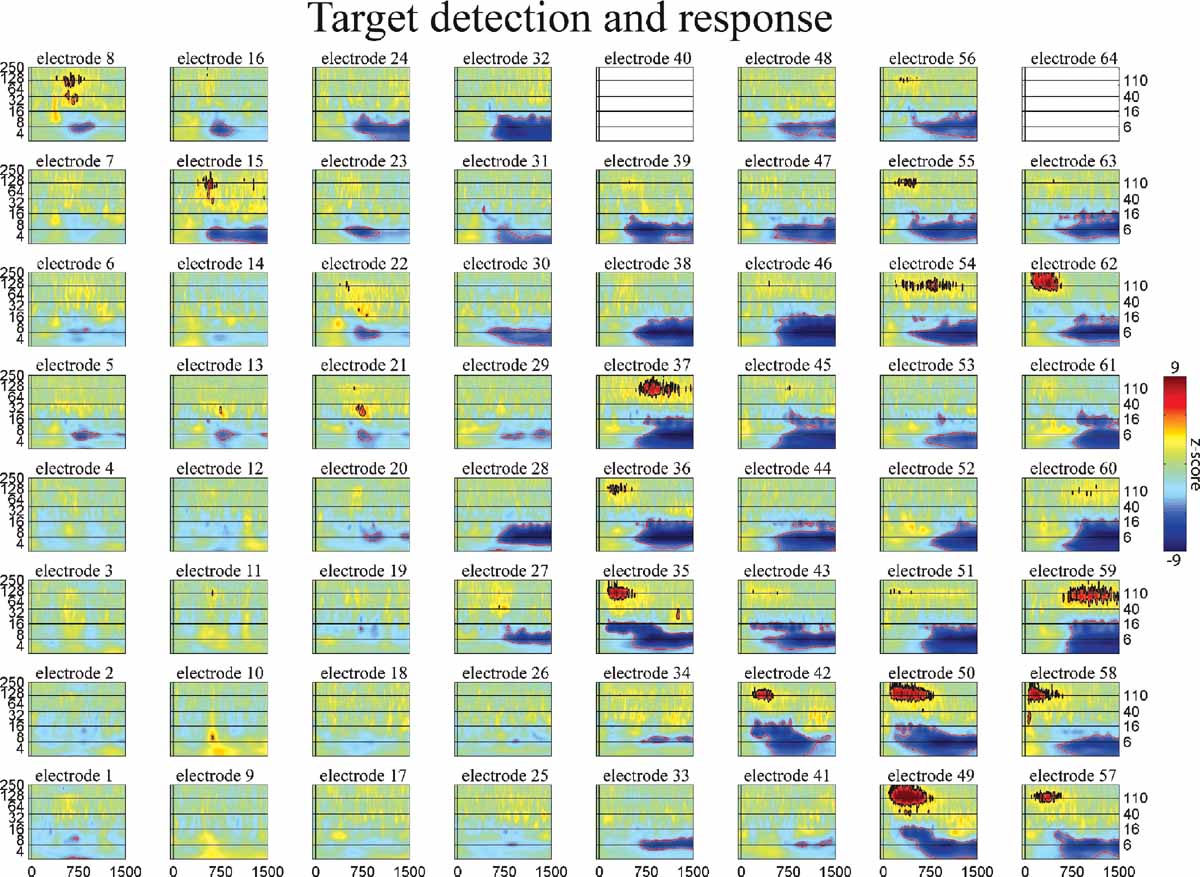
Figure 7. Event-related time–frequency plots for all electrodes in subject A in response to presentation of proper names (targets in target detection task). Note HG activity in electrodes 8 and 15 over prefrontal cortex. See Figure 4 A and methods for electrode locations. Vertical lines indicate stimulus onset and offset. Horizontal lines indicated frequencies of interest (theta, beta, low gamma, and HG). Outermost black (red) contour line indicates significant power increase (decrease) (p < 0.001, FDR corrected). See also legend for Figure 5 .
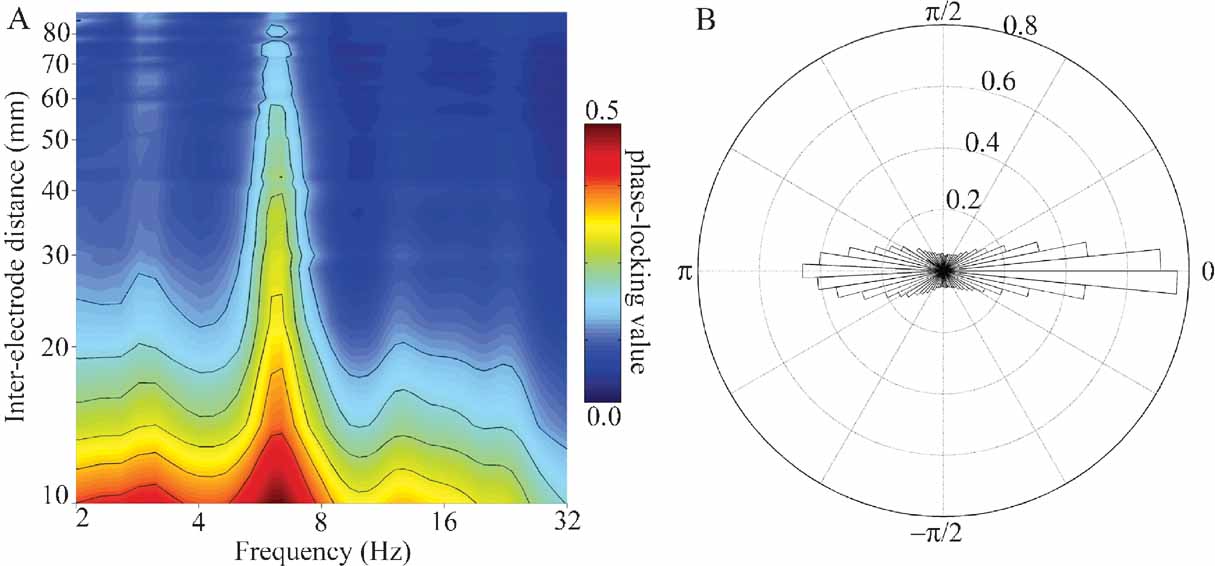
Figure 8. (A) Mean PLV as a function of frequency and inter-electrode distance for all pairs of electrodes in subject A. Larger PLVs indicate that pairs of electrodes exhibit a greater degree of phase coherence at that frequency. Note that for all inter-electrode distances the strongest phase coherence occurs in the theta (4–8 Hz) band, with smaller peaks occurring in the delta (2–4 Hz), alpha (8–12 Hz), and beta (12–30 Hz) bands. Outermost contour line indicates a PLV of 0.15; other contours indicate steps of 0.05. (B) Normalized polar histogram of preferred phase differences between electrode pairs for all frequencies and inter-electrode distances in subject A. Note that phase differences are clustered around 0 degree (in phase) and 180 degree (out of phase). This has implications for the ease of communication between areas (see Discussion).
Unlike theta, HG activity appears to be a robust, unambiguous indicator of local cortical activity which can be used to infer functional engagement. HG tracked local neuronal activity specifically related to word processing. While this study and others have shown that HG can be used to track functional engagement, the neurophysiological origin of HG activity remains unknown. Simulation studies have shown that stable oscillations in the 100–200 Hz range can be generated by networks of conductance-based neurons, even when each individual neuron fires irregularly and at a much lower rate (Geisler et al., 2005 ). It is thus possible that HG reflects the oscillatory population activity generated by networks of neurons coupled via chemical synapses. However, in vitro studies suggest that HG may depend on the propagation of spikelets through axo-axonic gap junctions between local networks of pyramidal cells (Whittington and Traub, 2003 ). Note that in this respect HG differs from low gamma, which depends upon fast, strong, shunting synapses between GABAergic interneurons and is stabilized by dendro-dendritic gap junctions (Bartos et al., 2007 ). If this model of HG proves to be the case, then HG would be more closely related to the mean spiking density in a cortical area than the local synaptic action density, as is the case for lower frequency bands (Nunez and Srinivasan, 2006 ). This interpretation is consistent with the observed correlation between the fMRI BOLD signal and HG in monkeys, cats, and humans (Lachaux et al., 2005 ; Logothetis et al., 2001 ; Mukamel et al., 2005 ; Niessing et al., 2005 ). In addition, unlike oscillations in lower frequency bands which tend to have a narrow frequency range, the broad-band HG activity may be more aptly described as “fluctuations” rather than “oscillations”. Single-trial estimates of the instantaneous frequency generated from reassigned time-frequency representations (Gardner and Magnasco, 2006 ) show large trial-to-trial variations, and often change quickly within a single trial. Therefore, while low gamma is thought to play a role in synchronizing separate cortical areas (Varela et al., 2001 ), the observed wide-band variability makes it seem unlikely that HG frequencies play a direct role in synchronizing distinct brain regions.
In this study, HG was used to track the spatiotemporal pattern of local cortical activity associated with language comprehension and revealed that listening to words sequentially activates first the post-STG, then the mid-STG, followed by the STS. Although we provide novel data regarding the serial temporal flow of word related processing across the temporal lobe, based on our data we cannot rule out the possibility that additional processing is also occurring in a parallel fashion. In sum, the spatiotemporal dynamics of the ECoG signal in different frequency bands reveals the relative roles played by both spiking and synaptic action in overlapping neuronal cell assemblies in widely separated brain areas during a complex behavioral task.
Conflict of Interest Statement
The authors declare that the research was conducted in the absence of any commercial or financial relationships that could be construed as a potential conflict of interest.
Acknowledgments
The authors thank Dr. Analia Arevalo for providing the word list and highlighting the ingestive versus communicative mouth verb distinction, Dr. Juliana Baldo for helpful feedback and discussions during analysis, Dr. Frederic Theunissen for advice and scripts used to generate the acoustically matched nonwords, and Emily Jacobs for helping with stimulus development. This work was supported by the Rauch family, an IBM Cognitive Computing Award, National Institute of Neurological Disorders and Stroke grant NS21135, National Science Foundation Fellowship 2004016118, and National Institute on Deafness and Other Communication Disorders grants F31DC006762, RO1 DC004855 and RO1 DC006435.
References
Bartos, M., Vida, I., and Jonas, P. (2007). Synaptic mechanisms of synchronized gamma oscillations in inhibitory interneuron networks. Nat. Rev. Neurosci. 8, 45-56.
Belin, P., Zatorre, R. J., and Ahad, P. (2002). Human temporal-lobe response to vocal sounds. Cogn. Brain Res. 13, 17-26.
Binder, J. R., Frost, J. A., Hammeke, T. A., Bellgowan, P. S., Sprinker, J. A., Kaufman, J. N., and Possing, E. T. (2000). Human temporal lobe activation by speech and nonspeech sounds. Cereb. Cortex 10, 512-528.
Binder, J. R., Frost, J. A., Hammeke, T. A., Cox, R. W., Rao, S. M., and Prieto, T. (1997). Human brain language areas identified by functional magnetic resonance imaging. J. Neurosci. 17, 353-362.
Binder, J. R., Rao, S. M., Hammeke, T. A., Yetkin, F. Z., Jsmanowicz, A., Bandettini, P. A., Wong, E. C., Estkowski, L. D., Goldstein, M. D., Haughton, V. M., and Hyde, J. S. (1994). Functional magnetic resonance imaging of human auditory cortex. Ann. Neurol. 35, 662-672.
Broca, P. (1861). Remarques sur le siège de la faculté du langage articulé, suivies d’une observation d’aphémie (perte de la parole). Bull. Mém. Soc. Anat. Paris 36, 330-357.
Bruns, A. (2004). Fourier-, Hilbert- and wavelet-based signal analysis: are they really different approaches? J. Neurosci. Meth. 137, 321-332.
Bruns, A., and Eckhorn, R. (2004). Task-related coupling from high- to low-frequency signals among visual cortical areas in human subdural recordings. Int. J. Psychophysiol. 51, 97-116.
Canolty, R. T., Edwards, E., Dalal, S. S., Soltani, M., Kirsch, H. E., Berger, M. S., Barbaro, N. M., and Knight, R. T. (2006). High gamma power is phase-locked to theta oscillations in human neocortex. Science 313, 1626-1628.
Caplan, J. B., Madsen, J. R., Schulze-Bonhage, A., Aschenbrenner-Scheibe, R., Newman, E. L., and Kahana, E. L. (2003). Human theta oscillations related to sensorimotor integration and spatial learning, J. Neurosci. 23, 4726-4736.
Crone, N. E., Boatman, D., Gordon, B., and Hao, L. (2001a). Induced electrocorticographic gamma activity during auditory perception. Clin. Neurophysiol. 112, 565-582.
Crone, N. E., Hao, L., Hart, J., Boatman, D., Lesser, R. P., Irizarry, R., and Gordon, B. (2001b). Electrocorticographic gamma activity during word production in spoken and sign language. Neurology 57, 2045-2053.
Crone, N. E., Miglioretti, D. L., Gordon, B., Sieracki, J. M., Wilson, M. T., Uematsu, S., and Lesser, R. P. (1998a). Functional mapping of human sensorimotor cortex with electrocorticographic spectral analysis: I. Alpha and beta event-related desychronization. Brain 121, 2271-2299.
Crone, N. E., Miglioretti, D. L., Gordon, B., and Lesser, R. P. (1998b). Functional mapping of human sensorimotor cortex with electrocorticographic spectral analysis: II. Event-related synchronization in the gamma band. Brain 121, 2301-2315.
Dalal, S. S., Guggisberg, A. G., Edwards, E., Sekihara, K., Findlay, A. M., Canolty, R. T., Knight, R. T., Barbaro, N. M., Kirsch, H. E., and Nagarajan, S. S. (2007). Spatial Localization of Cortical Time-Frequency Dynamics. Proceedings of the 29th IEEE EMBS Annual International Conference.
Démonet, J. F., Price, C., Wise, R., and Frackowiak, R. S. J. (1994). Differential activation of right and left posterior sylvian regions by semantic and phonological tasks: A positron-emission tomography study in normal human subjects. Neurosci. Let. 182, 25-28.
Dronkers, N. F., Wilkins, D. P., Van Valin, R. D., Redfern, B. B., and Jaeger, J. J. (2004). Lesion analysis of the brain areas involved in language comprehension. Cognition 92, 145-177.
Dronkers, N. F., Plaisant, O., Iba-Zizen, M. T., and Cabanis, E. A. (2007). Paul Broca's historic cases: high resolution MR imaging of the brains of Leborgne and Lelong. Brain 130, 1432-1441.
Edwards, E., Soltani, M., Deouell, L. Y., Berger, M. S., and Knight, R. T. (2005). High gamma activity in response to deviant auditory stimuli recorded directly from human cortex. J. Neurophysiol. 94, 4269-4280.
Ekstrom, A. D., Caplan, J. B., Ho, E., Shattuck, K., Fried, I., and Kahana, M. J. (2005). Human hippocampal theta activity during virtual navigation, Hippocampus 15, 881-889.
Eulitz, C., Maβ, B., Pantev, C., Friederici, A. D., Feige, B., and Elbert, T. (1996). Oscillatory neuromagnetic activity induced by language and non-language stimuli. Cogn. Brain Res. 4, 121-132.
Fecteau, S., Armony, J. L., Joanette, Y., and Belin, P. (2004). Is voice processing species-specific in human auditory cortex? An fMRI study. Neuroimage 23, 840-848.
Friederici, A. D., Pfeifer, E., and Hahne, A. (1993). Event-related brain potentials during natural speech processing: effects of semantic, morphological and syntactic violations. Cogn. Brain Res. 1, 183-192.
Fries, P. (2005). A mechanism for cognitive dynamics: neuronal communication through neuronal coherence. Trends Cogn. Sci. 9, (10) 474-480.
Gardner, T. J., and Magnasco, M. O. (2006). Sparse time-frequency representations. Proc. Natl. Acad. Sci. 103, 6094-6099.
Geisler, C., Brunel, N., and Wang, X. J. (2005). Contributions of intrinsic membrane dynamics to fast network oscillations with irregular neuronal discharges. J. Neurophysiol. 94, 4344-4361.
Gevins, A., Smith, M. E., McEvoy, L., and Yu, D. (1997). High-resolution EEG mapping of cortical activation related to working memory: effects of task difficulty, type of processing, and practice, Cereb. Cortex 7, 374-385.
Giraud, A. L., and Price, C. J. (2001). The constraints functional neuroimaging places on classical models of auditory word processing. J. Cogn. Neurosci. 13, 754-765.
Hauk, O., Johnsrude, I., and Pulvermuller, F. (2004a). Somatotopic representation of action words in human motor and premotor cortex. Neuron 41, 301-307.
Hauk, O., and Pulvermuller, F. (2004b). Neurophysiological distinction of action words in the fronto-central cortex. Hum. Brain. Mapp. 21, 191-2001.
Hickok, G., and Poeppel, D. (2000). Towards a functional neuroanatomy of speech perception. Trends Cogn. Sci. 4, 131-138.
Hickok, G., and Poeppel, D. (2004). Dorsal and ventral streams: a framework for understanding aspects of the functional anatomy of language. Cognition 92, 67-99.
Hickok, G., and Poeppel, D. (2007). The cortical organization of speech processing. Nat. Rev. Neurosci. 8, 393-402.
Indefrey, P., and Cutler, A. (2005). Prelexical and lexical processing in listening. In The Cognitive Neurosciences III M. Gazzaniga, ed. (Cambridge, MA, MIT Press) PP. 759-774.
Ishii, R., Shinosaki, K., Ukai, S., Inouye, T., Ishihara, T., Yoshimine, T., Hirabuki, N., Asada, H., Kihara, T., Robinson, S. E., and Takeda, M. (1999). Medial prefrontal cortex generates frontal midline theta rhythm. NeuroReport 10, 675-679.
Jacobs, J., Kahana, M. J., Ekstrom, A. D., and Fried, I. (2007). Brain oscillations control timing of single-neuron activity in humans. J. Neurosci. 27, 3839-3844.
Kahana, M. J., Sekuler, R., Caplan, J. B., Kirschen, M., and Madsen, J. R. (1999). Human theta oscillations exhibit task dependence during virtual maze navigation, Nature 399, 781-784.
Klimesch, W., Sauseng, P., Hanslmayr, S., Gruber, W., Freunberger, R. 2007. Event-related phase reorganization may explain evoked neural dynamics. Neurosci. Biobehav. Rev. 31, 1003-1016.
Kutas, M., and Hillyard, S. A. (1980). Reading senseless sentences: Brain potentials reflect semantic anomaly. Science 207, 203-205.
Lakatos, P., Shah, A. S., Knuth, K. H., Ulbert, I., and Karmos, G. (2005). An oscillatory hierarchy controlling neuronal excitability and stimulus processing in the auditory cortex. J. Neurophysiol. 94, (3) 1904-1911.
Lachaux, J. P., George, N., Tallon-Baudry, C., Martinerie, J., Hugueville, L., Minotti, L., Kahane, P., and Renault, B. (2005). The many faces of gamma band response to complex visual stimuli. Neuroimage 25, 491-501.
Logothetis, N. K., Pauls, J., Augath, M., Trinath, T., and Oeltermann, A. (2001). Neurophysiological investigation of the basis of the fMRI signal. Nature 412, 150-156.
Luo, H., and Poeppel, D. (2007). Phase patterns of neuronal responses reliably discriminate speech in human auditory cortex. Neuron 4, 1001-1010.
Lutzenberger, W., Pulvermuller, F., and Birbaumer, N. (1994). Words and pseudowords elicit distinct patterns of 30-Hz activity in humans. Neurosci. Lett. 183, 39-42.
Marinković, K. (2004). Spatiotemporal dynamics of word processing in the human cortex. Neuroscience 10, 142-152.
Marinković, K., Dhond, R. P., Dale, A. M., Glessner, M., Carr, V., and Halgren, E. (2003). Spatiotemporal dynamics of modality-specific and supramodal word processing. Neuron 8, 487-497.
Mormann, F., Fell, J., Axmacher, N., Weber, B., Lehnertz, K., Elger, C. E., and Fernandez, G. (2005). Phase/amplitude reset and theta-gamma interaction in the human medial temporal lobe during a continuous word recognition memory task. Hippocampus 7, 890-900.
Mukamel, R., Gelbard, H., Arieli, A., Hasson, U., Fried, I., and Malach, R. (2005). Coupling between neuronal firing, field potentials, and fMRI in human auditory cortex. Science 309, 951-954.
Mummery, C. J., Ashburner, J., Scott, S. K., and Wise, R. J. S. (1999). Functional neuroimaging of speech perception in six normal and two aphasic subjects. J. Acoust. Soc. Am. 106, 449-457.
Neville, H. J., Nicol, J. L., Barss, A., Forster, K. I., and Garrett, M. F. (1991). Syntactically based sentence processing classes: evidence from event-related brain potentials. J. Cog. Neurosci. 3, 151-165.
Niessing, J., Ebisch, B., Schmidt, K. E., Niessing, M., Singer, W., and Galuske, R. A. W. (2005). Hemodynamic signals correlate tightly with synchronized gamma oscillations. Science 309, 948-951.
Nunez, P., and Srinivasan, R. (2006). Electric fields of the brain: the neurophysics of EEG. 2nd edn. (New York, Oxford University Press).
Onton, J., Delorme, A., and Makeig, S. (2005). Frontal Midline EEG dynamics during working memory. Neuroimage 27, 341-356.
Osterhout, L., and Holcomb, P. J. (1992). Event-related brain potentials elicited by syntactic anomaly. J. Mem. Lang. 31, 785-806.
Petersen, S. E., Fox, P. T., Posner, M. I., Mintun, M., and Raichle, M. E. (1988). Positron emission tomographic studies of the cortical anatomy of single-word processing. Nature 331, 585-589.
Price, C. J., Wise, R., Ramsay, S., Friston, K., Howard, D., Patterson, K., and Frackowiak, R. (1992). Regional response differences within the human auditory cortex when listening to words. Neurosci. Lett. 146, 179-182.
Price, C. J., Wise, R. J. S., Warburton, E. A., Moore, C. J., Howard, D., Patterson, K., Frackowiak, R. S. J., and Friston, K. J. (1996). Hearing and saying: The functional neuro-anatomy of auditory word processing. Brain 119, 919-931.
Pulvermuller, F. (1994b). Syntax and Hirnmechanism. Perspektiven einer multidisziplinären Sprachwissenschaft. Kognitionswissenschaf 4, 17-31.
Pulvermuller, F. (1995a). Agrammatism: behavioral description and neurobiological explanation. J. Cogn. Neurosci. 7, 165-181.
Pulvermuller, F. (1995b). What neurobiology can buy language theory. Stud. Sec. Lang. Acq. 17, 73-77.
Pulvermuller, F. (1996b). Neruobiologie der Sprache. Gehirntheoretische Uberlegungen and empirische zur Sprachverarbeitung. Pschologia Universalis, Neue Reihe, Bd. 1. Lengerich Berlin u. a.: (Pabst Science Publishers).
Pulvermuller, F. (2005). Brain mechanisms linking language and action. Nat. Rev. Neurosci. 6, 576-582.
Pulvermuller, F., Shtyrov, Y., and Ilmoniemi, R. J. (2003). Spatiotemporal dynamics of neural processing: an MEG study using minimum-norm current estimates. Neuroimage 20, 1020-1050.
Pulvermuller, F, Hauk, O., Nikulin, V. V., and Ilmoniemi, R. J. (2005a). Functional links between motor and language systems. Eur. J. Neurosci. 21, 793-797.
Pulvermuller, F., Shtyrov, Y., and Ilmoniemi, R. (2005b). Brain signatures of meaning access in action word recognition. J. Cogn. Neurosci. 17, 884-892.
Pulvermuller, F., Shtyrov, Y., Ilmoniemi, R. J., and Marslen-Wilson, W. D. (2006). Tracking speech comprehension in space and time. Neuroimage 31, 1297-1305.
Schaefer, A. T., Angelo, K., Spors, H., and Margrie, T. W. (2006). Neuronal oscillations enhance stimulus discrimination by ensuring action potential precision. PLoS Biol. 4, (6) e163.
Scott, S. K., and Wise, R. J. S. (2004). The functional neuroanatomy of prelexical processing in speech perception, Cognition 92, 13-45.
Sederberg, P. B., Kahana, M. J., Howard, M. W., Donner, E. J., and Madsen, J. R. (2003). Theta and gamma oscillations during encoding predict subsequent recall, J. Neurosci. 23, 10809-10814.
Singh, N. C., and Theunissen, F. E. (2003). Modulation spectra of natural sounds and ethological theories of auditory processing. J. Acoust. Soc. Am. 114, 3394-3411.
Varela, F., Lachaux, J. P., Rodriguez, E., and Martinerie, J. (2001). Phase synchronization and large-scale integration. Nat. Rev. Neurosci. 2, 229-239.
Vouloumanos, A., Kiehl, K. A., Werker, J. F., and Liddle, P. F. (2001). Detection of sounds in the auditory stream: event-related fMRI evidence for differential activation to speech and nonspeech. J. Cog. Neurosci. 13, 994-1005.
Wernicke, K. (1874). Der aphasische sypmtomencomplex eine psychologische studie auf anatomischer basis. Hohn and Weigert, Breslau.
Whittington, M. A., and Traub, R. D. (2003). Interneuron diversity series: inhibitory interneurons and network oscillations in vitro. Trends Neurosci. 26, 676-682.
Wilson, S. M., Saygin, A. P., Sereno, M. I., and Iacoboni, M. (2004). Listening to speech activates motor areas involved in speech production. Nat. Neurosci. 7, 701-702.
Wise, R., Challet, F., Hadar, U., Friston, K., Hoffner, E., and Frackowiak, R. (1991). Distribution of cortical neural networks involved in word comprehension and word retrieval. Brain 114, 1803-1817.
Wise, R. J. S., Scott, S. K., Blank, S. C., Mummery, C. J., Murphy, K., and Warburton, E. A. (2001). Separate neural subsystems within ‘Wernicke's area’. Brain 124, 83-95.
Wong, D., Pisoni, D. B., Learn, J., Gandour, J. T., Miyamoto, R. T., and Hutchins, G. D. (2002). PET imaging of differential cortical activation by monaural speech and nonspeech stimuli. Hearing Res. 166, 9-23.
Keywords: electrocorticogram, oscillations, gamma, verbs, word processing, target detection, superior temporal gyrus, superior temporal sulcus
Citation: Ryan T. Canolty, Maryam Soltani, Sarang S. Dalal, Erik Edwards, Nina F. Dronkers, Srikantan S. Nagarajan, Heidi E. Kirsch, Nicholas M. Barbaro and Robert T. Knight (2007). Spatiotemporal dynamics of word processing in the human brain. Front. Neurosci. 1:1. 185-196. doi: 10.3389/neuro.01/1.1.014.2007
Received: 15 August 2007;
Paper pending published: 01 September 2007;
Accepted: 01 September 2007;
Published online: 15 October 2007
Edited by:
Idan Segev, Hebrew University, IsraelReviewed by:
Michael Kahana, University of Pennsylvania, USANathan Crone, The Johns Hopkins Hospital, USA
Copyright: © 2007 Canolty, Soltani, Dalal, Dronkers, Nagarajan, Kirsch, Barbaro and Knight. This is an open-access article subject to an exclusive license agreement between the authors and the Frontiers Research Foundation, which permits unrestricted use, distribution, and reproduction in any medium, provided the original authors and source are credited.
*Correspondence: Ryan T. Canolty, Helen Wills Neuroscience Institute, University of California, Berkeley, 132 Barker Hall, Berkeley, CA 94720-3190, USA. e-mail: rcanolty@gmail.com
a Both these authors contributed equally to this work.