1
Control and Dynamical Systems Program, California Institute of Technology, Pasadena, CA, USA
2
Division of Biology, California Institute of Technology, Pasadena, CA, USA
3
Division of Biology, Howard Hughes Medical Institute, California Institute of Technology, Pasadena, CA, USA
Structural changes at synapses are thought to be a key mechanism for the encoding of memories in the brain. Recent studies have shown that changes in the dynamic behavior of dendritic spines accompany bidirectional changes in synaptic plasticity, and that the disruption of structural constraints at synapses may play a mechanistic role in spine plasticity. While the prolonged disruption of N-cadherin, a key synaptic adhesion molecule, has been shown to alter spine morphology, little is known about the short-term regulation of spine morphological dynamics by N-cadherin. With time-lapse, confocal imaging in cultured hippocampal neurons, we examined the progression of structural changes in spines following an acute treatment with AHAVD, a peptide known to interfere with the function of N-cadherin. We characterized fast and slow timescale spine dynamics (minutes and hours, respectively) in the same population of spines. We show that N-cadherin disruption leads to enhanced spine motility and reduced length, followed by spine loss. The structural effects are accompanied by a loss of functional connectivity. Further, we demonstrate that early structural changes induced by AHAVD treatment, namely enhanced motility and reduced length, are indicators for later spine fate, i.e., spines with the former changes are more likely to be subsequently lost. Our results thus reveal the short-term regulation of synaptic structure by N-cadherin and suggest that some forms of morphological dynamics may be potential readouts for subsequent, stimulus-induced rewiring in neuronal networks.
Neuronal synapses are in a constant state of flux both biochemically (Inoue and Okabe, 2003
; Malinow and Malenka, 2002
), and structurally (Dailey and Smith, 1996
; Dunaevsky et al., 2001
; Holtmaat et al., 2005
; Knott et al., 2006
; Majewska and Sur, 2003
; Trachtenberg et al., 2002
; Zuo et al., 2005
). Dendritic spines, the post-synaptic sites of most excitatory synapses, show a wide range of structural dynamics (Dailey and Smith, 1996
; Engert and Bonhoeffer, 1999
; Fischer et al., 1998
; Grutzendler et al., 2002
; Halpain et al., 2005
;Holtmaat et al., 2005
, 2006
; Korkotian and Segal, 2001
; Lang et al., 2004
; Lippman and Dunaevsky, 2005
; Majewska et al., 2000
; Maletic-Savatic et al., 1999
; Matsuzaki et al., 2004
; Mizrahi and Katz, 2003
; Nagerl et al., 2004
; Oertner and Matus, 2005
; Okamoto et al., 2004
; Tada and Sheng, 2006
; Takeichi and Abe, 2005
; Trachtenberg et al., 2002
; Zhou et al., 2004
; Zito et al., 2004
). While the dynamics of actin, a cytoskeletal element, is known to be the physical end-effector of spine dynamics
(Fischer et al., 1998
; Sekino et al., 2007
), the structural supports provided by cell-adhesion molecules are thought to produce spine stability (Abe et al., 2004
; Bailey et al., 1992
; Salinas and Price, 2005
; Takeichi and Abe, 2005
; Togashi et al., 2002
). N-cadherin is a key cell-adhesion molecule (Fannon and Colman, 1996
; Redies, 2000
; Salinas and Price, 2005
; Shimoyama et al., 2000
; Takeichi, 1991
; Takeichi and Abe, 2005
; Uchida et al., 1996
; Wheelock and Johnson, 2003
) with demonstrated roles in synapse assembly (Benson and Tanaka, 1998
; Boggon et al., 2002
; Hirano et al., 2003
; Jontes et al., 2004
; Shapiro and Colman, 1999
; Togashi et al., 2002
), the formation of synaptic circuits (Redies et al., 1992
; Takeichi et al., 1997
), and synaptic plasticity (Benson and Tanaka, 1998
; Bozdagi et al., 2000
; Jungling et al., 2006
; Schuman and Murase, 2003
; Tanaka et al., 2000
; Tang et al., 1998
). Additionally, N-cadherin is linked to the actin cytoskeleton via intermediary proteins (Hirano et al., 1992
; Ozawa et al., 1990
), and this linkage is key to its adhesive function (Braga, 2002
; Braga et al., 1997
; Fukata and Kaibuchi, 2001
; Nagafuchi et al., 1994
). However, little is known about N-cadherinquotidns role in the regulation of ongoing spine structural dynamics. Further, while the effects of chronic destabilization of N-cadherin (over days) and those of knockout of αN-catenin (a molecule in the cadherin-mediated adhesion complex) on spine morphology have been described (Togashi et al., 2002
) the effects of acute N-cadherin disruption on spine remodeling are unclear. Other acute treatments that affect spine dynamics have been studied (Engert and Bonhoeffer, 1999
; Fischer et al., 2000
; Maletic-Savatic et al., 1999
; Matsuzaki et al., 2004
; Zhou et al., 2004
), and have the advantage of eliciting responses from cells in their native rather than in an altered state (for instance, after gene knockout). Thus, there is a need to understand the role of N-cadherin in modulating
ongoing spine dynamics, and particularly, the effects of the acute inhibition of N-cadherin-mediated adhesion on spine structure.
An independent and unexplored question in the study of spine dynamics itself is how dynamics at different timescales are regulated in the same spines. Timescale of dynamics simply represents the rate at which changes occur. For instance, while images of a spine taken once every hour could show no significant change in the length of a spine, images taken once every minute may reveal the occurrence of rapid length “twitching” around an average length. The magnitude of these rapid changes could be altered by a treatment though the average length may remain unaffected. This would indicate that the treatment affects fast (timescale of minutes), but not slower (timescale of hours) spine dynamics. Though biologically relevant spine dynamics have been reported in the literature to occur as quickly as over seconds and minutes (Fischer et al., 1998
; Korkotian and Segal, 2001
), and as slowly as over hours and days (Engert and Bonhoeffer, 1999
; Holtmaat et al., 2006
; Maletic-Savatic et al., 1999
; Nagerl et al., 2004
; Trachtenberg et al., 2002
), an investigation into the dynamics of spines at multiple timescales is missing.
Here, we address both these issues – (1) effects of acute N-cadherin disruption on spine dynamics, and (2) characterization of spine dynamics at multiple timescales. In cultured hippocampal neurons, we show that N-cadherin disruption leads to enhanced motility and reduced length (fast and slow timescale dynamics respectively) followed subsequently by spine loss. We report, for the first time, associations between early changes in spine dynamics and later spine loss. Additionally, we show that dynamics in any one spine feature, e.g., length, can be independently regulated at different timescales.
Cell Culture and Infection
Dissociated hippocampal neurons were prepared from postnatal day 2 Sprague-Dawley rat pups and plated at a density of 310–460/mm2, as described in (Aakalu et al., 2001
). Neurons were used after 20–25 days in vitro. Twelve hours prior to imaging, neurons were infected with Sindbis-EGFP virus by washing once with growth medium (Neurobasal A, supplemented with B27 and Gluta MAX-1), and then incubating with virus (diluted in growth medium) for 20 minutes at 37°C. Following infection, cells were washed again with growth medium and then incubated with conditioned media at 37°C for 10 hours. The growth medium was then replaced by HEPES buffered saline (HBS) containing, in mM: 119 NaCl, 5 KCl, 2 CaCl2, 2 MgCl2, 30 Glucose, 10 HEPES, pH 7.4 and allowed to equilibrate for 2 hours at 37°C in a humidified incubator prior to image acquisition. Subsequently, in between the brief imaging periods (about 8 minutes), the cells were returned to 37°C.
N-cadherin Disruption
The 5-mer peptide AHAVD (HAV) is known to interfere with the function of N-cadherin (Chuah et al., 1991
; Tang et al., 1998
), and its efficacy is enhanced by low extracellular Ca2+ concentrations (e.g., less than 2 mM) (Tang et al., 1998
). We acutely disrupted N-cadherin with a 10-minute pulse application of 2 μM AHAVD (“HAV” peptide) in a zero Ca2+ medium containing 1 mM EGTA at 37°C, followed by a wash and replacement into HBS. As control we used a scrambled 5-mer peptide AADHV (“SCR”) at the same concentration. The treatment (or control) was applied after acquisition of baseline images, and at the appropriate time-points further image stacks were acquired.
L Cell Aggregation Assay
L cells were transfected with N-cadherin (pCXN2-Ncad provided by Dr. Deanna Benson) using Lipofectamine 2000 (Invitrogen). A Gentamycin-resistant stable line was created from a single clone after a month of passaging (N-cad expression confirmed with Western blot). L cells were plated into 10 cm dishes in DMEM complete medium (Dulbecco’s modified Eagle’s medium, 10% FBS, 100 μg/ml Penicillin-Streptomycin) and allowed to reach confluency (normally within 2–3 days). Cells were then trypsinized, counted, and approximately 500 μL of cell suspension (0.95–1.07 × 10⁶ cells/100 μL) was used for each of three treatments in HBS – 2 μM HAV, or 2 μM SCR, or HBS. After a 10-minute incubation at 37°C, cells were rinsed with and suspended in media. Immediately, 10 μL of cell suspension from each sample was mounted onto slides. This represented time t = 0. The samples were all placed in a 37°C shaker at 500 rpm. At each time-point (t = 30, 75, 150, and 180 minutes), cell suspensions were plated onto slides as before and imaged using differential interference contrast (DIC) on an inverted confocal microscope (LSM 510 Meta, Zeiss) using an air objective (10× Plan-Neofluar, N. A. 0.3, Zeiss) at a zoom of 0.7. The extent of aggregation was quantified as described in (Nguyen and Sudhof, 1997
) as N0/Nt, where Nt was the number of cells not in aggregates at each t. Data (Figure 1
) are from three independent experiments.
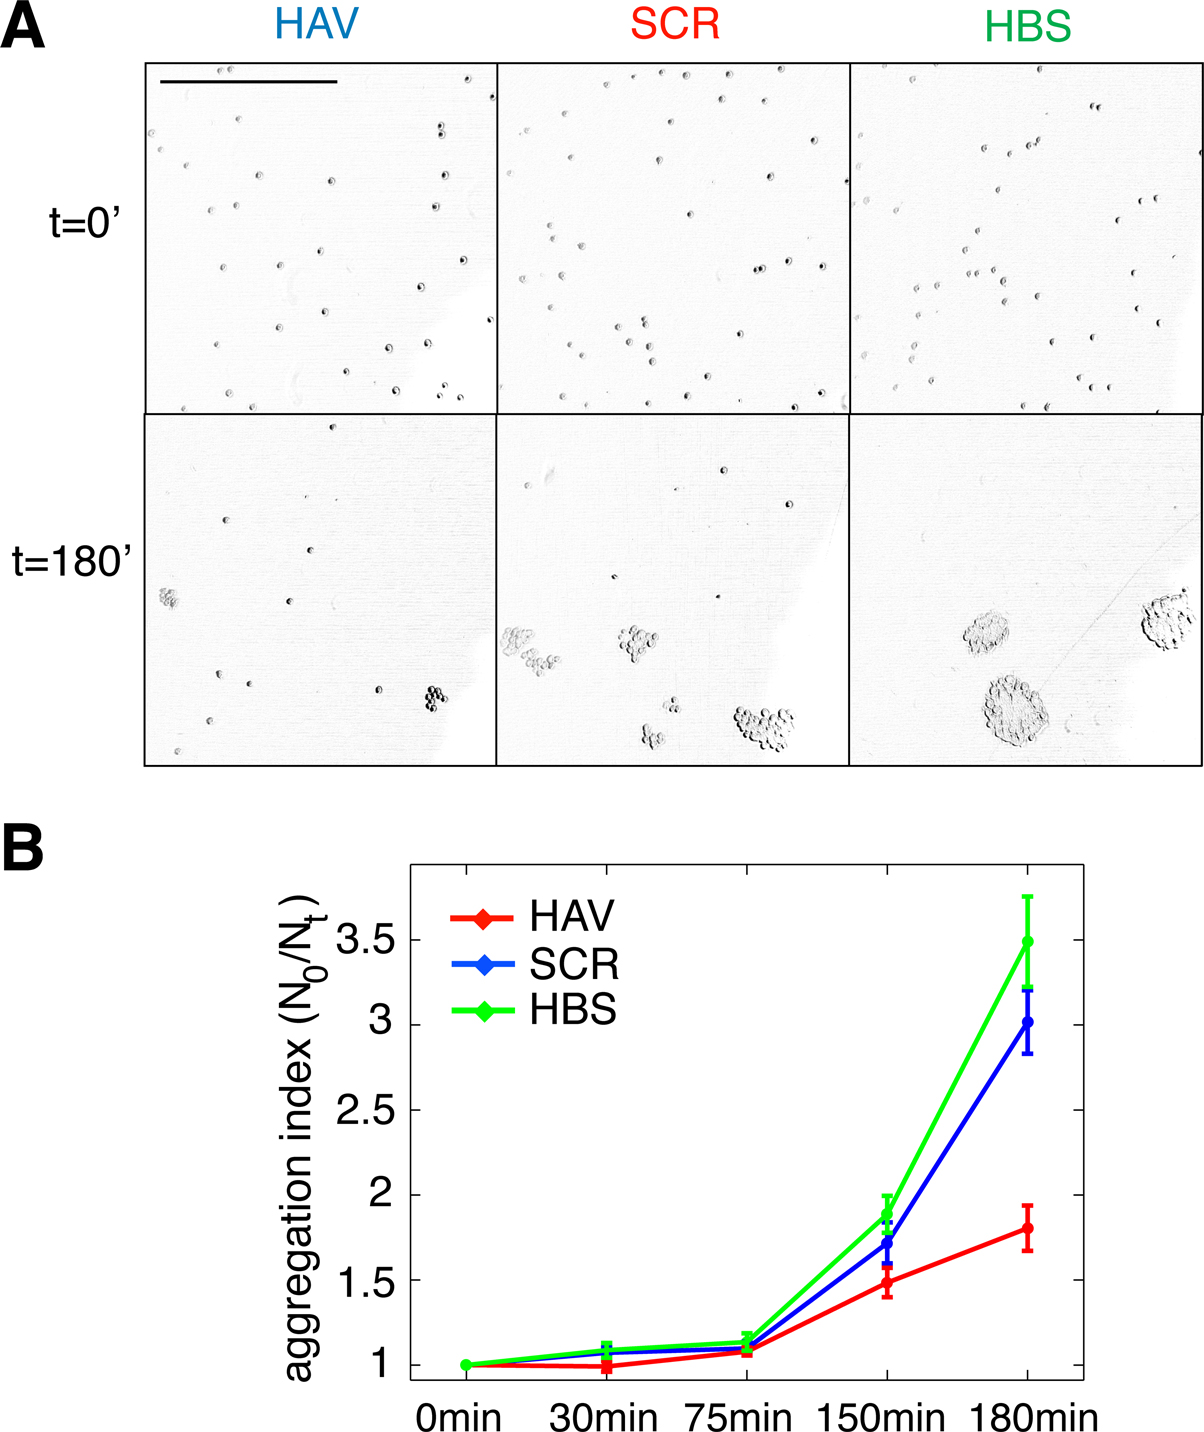
Figure 1. Ten-minute AHAVD (but not AADHV) peptide treatment disrupts N-cadherin mediated adhesion. (A) Differential interference contrast images of L cells plated onto slides at different time-points, after being treated with HAV, SCR, or HBS for 10 minutes (see Materials and methods section). Scalebar = 650 μm. (B) Plot of the aggregation efficiency of L cells as a function of time, measured as N0/Nt (see Materials and methods section). A higher N0/Nt value indicates greater adhesion. HAV – red, SCR – blue, HBS – green.
Live Imaging and Analysis
Image acquisition. All imaging was performed on an inverted LSM 510 Meta (Zeiss) microscope. Neuronal images were acquired as 8-bit, z-stacks with an oil immersion objective (Plan Apochromat 63×, N.A. 1.4, Zeiss) at a zoom of 2. Each z-stack consisted of 30 sections approximately. The x-y-z resolution was 0.07 × 0.07 × 0.37 μm/pixel.
Image preprocessing. Raw image stacks were 3D deconvolved in IMAGEJ [NIH, “Iterative Deconvolve 3D” plugin (Dougherty, 2005
)] using a theoretical estimate of the 3-D PSF (IMAGEJ, “Diffraction PSF 3D” plugin). No further filtering was performed. Stacks at all time-points were registered to the first stack. The z-projection (maximum) of the stack at each time-point was obtained, and from this, dendrites were straightened in IMAGEJ. The images at this stage are referred to as raw images in the text.
Spine selection and verification. For spine selection purposes, custom code in MATLAB (The Mathworks Inc.) was used that combined these raw images into a single stack, and z-projected them (maximum intensity). The resulting image is referred to as the t-projection below. Individual boxes were interactively drawn around each spine such that the box included the spine and some extracellular space (so that the shape of the spine was clearly visible), but not nearby dendritic projections or tissue debris. This process helped to select spines for further analysis. All dendritic protrusions in the imaged field of view that resembled spines/filopodia were selected, thereby minimizing bias. Using the t-projection for this purpose also facilitated the selection of those projections that were not present at all the time-points. We categorized dendritic protrusions based on their properties in the baseline period. This included categorizing them based on type – thin, stubby, mushroom, and filopodia – and based on their baseline values of size, motility, etc. In all these cases, no significant correlation was found between the initial spine property and later effects. Hence all protrusions were pooled for reporting the effects in this study. Consistent with reports in the literature (Dailey and Smith, 1996
), we also found that less than 2% were filopodia-like (more than 98% were spines of different types). Therefore, for the remainder of the discussion, we will refer to all dendritic protrusions as spines.
The coordinates of each spine’s box were used to extract time-lapse spine images from the raw images. These were used to verify visually whether or not the selected protrusion was a spine. Those spines (approximately 10% of total) for which any remaining uncorrected positional errors were large (for instance, if the spine image at some time point was translated or rotated inside the spine box) were discarded. Such errors occur when, for instance, a dendrite has moved over time, but the rest of the neuron has remained stationary, and they cannot be adequately corrected by global image registration. The remaining spines can have small residual positional errors that can potentially confound automated measurements of “real” motility. These errors were accounted for using appropriate noise thresholds (discussed below). These verified spines were then rotated appropriately to achieve vertical orientation (for instance, spines in Figure 2
).
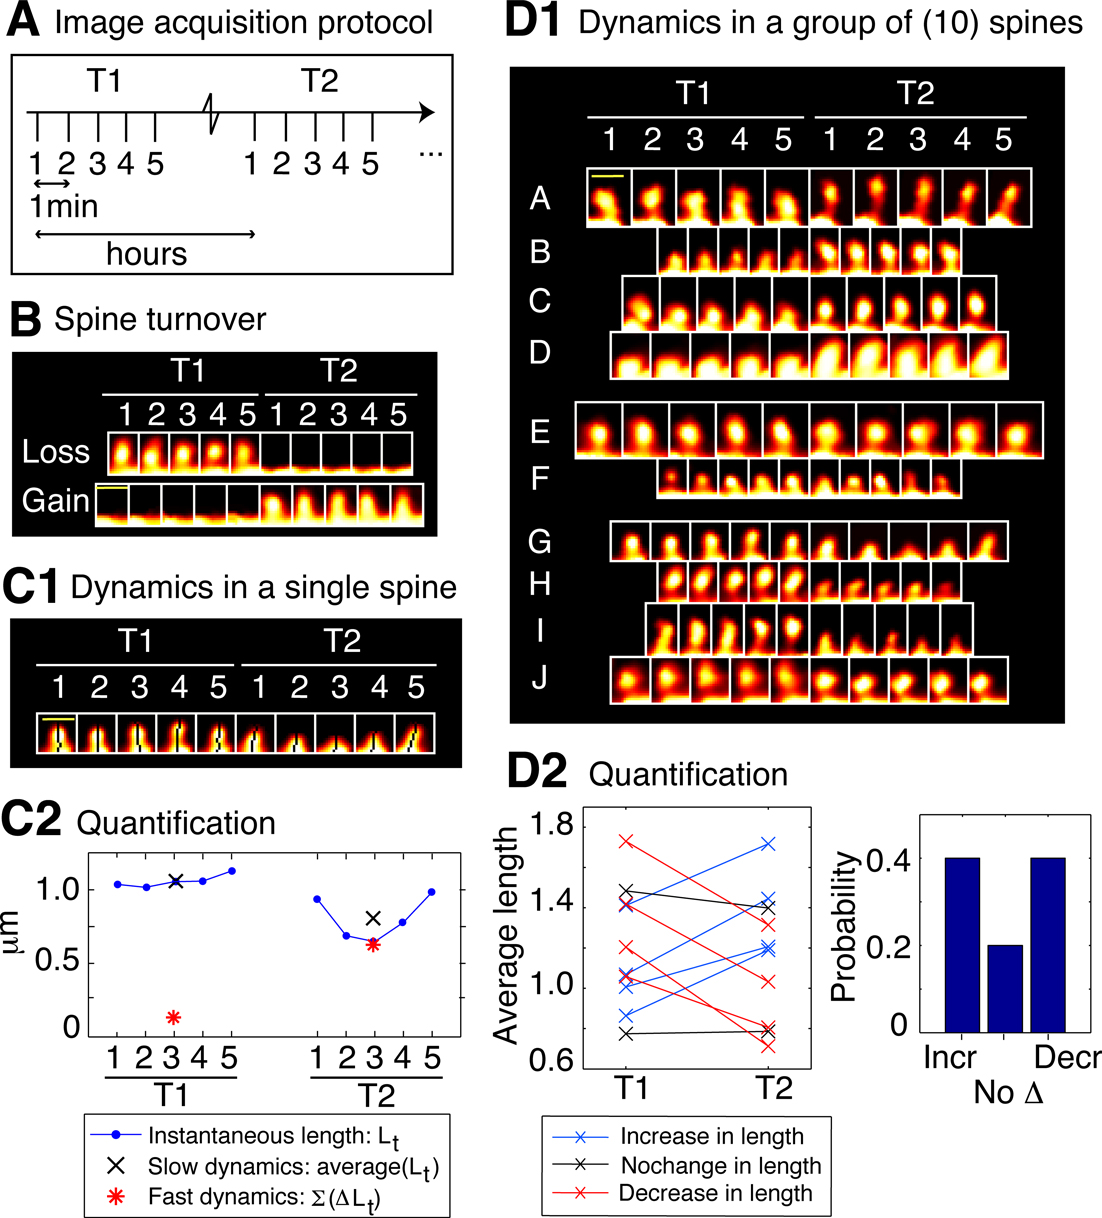
Figure 2. Spine dynamics at two timescales. All spines in this figure are from control neurons (SCR-treated); T1 was the baseline time-point taken before control treatment, and T2 was the time-point 75 minutes after it. (A) Image acquisition protocol. Each time-point (e.g., T1 or T2) consists of five image stacks taken once every minute (fast timescale). Different time-points (T1 or T2) are more than an hour apart (slow timescale). (B) Time-lapse images of two example spines from a control neuron that show spine loss (top image) and gain (bottom image), i.e., spine turnover – the most extreme form of spine morphological change. (C) Characterizing morphological dynamics in a single spine at the two timescales, with spine length as the example quantifier. (C1) Time-lapse images of an example spine from a control neuron acquired at the two time-points. The automated centerline generated to compute spine length at each instant is indicated as a one pixel-wide black curve (see Materials and methods section). (C2) Instantaneous length (Lt, blue circles); slow length dynamics, or average length [average (Lt) within each time-point, black cross]; and fast length dynamics, or length motility (Σ|ΔLt| within each time-point, red asterisk). The spine in (C1) shows a decrease in average length (slow timescale), but an increase in length motility (fast timescale). (D) Characterizing dynamics in a group of spines, with average length (slow length dynamics) as the example quantifier. (D1) Time-lapse images of 10 representative spines A–J from a control neuron, in which 4 spines A–D show an increase in average length, 2 spines E–F show no significant change, and 4 spines G–J show a decrease, with respect to T1. To determine the magnitude of change in the value of a quantifier that can be considered significant, we have experimentally measured noise thresholds that estimate the extent of change that can occur due to various sources of noise (Figure 3
). (D2) (Left panel) Average length of spines A–J at the two time-points T1 and T2. (Right panel) Probabilities of change (increase – Incr, decrease – Decr, no change – No Δ) in the average length of spines A–J at time-point T2 with respect to time-point T1, calculated as fractions of spines. In the rest of the paper, dynamics in spine groups are characterized with probabilities, and comparisons between treatment and control are made with respect to these probabilities. Scale bars in yellow = 1 μm.
Spine morphology quantification at two timescales. Various spine quantifiers like length, position (center-of-mass), area, head diameter, etc were computed using custom codes in MATLAB. Since HAV effects were observed only for average length and center-of-mass motility, we describe the calculation of just these measures. For both length and center-of-mass calculations, thresholded images were used so that the confounding effects of EGFP intensity distributions on estimating spine morphology were minimized. Thresholds were automatically determined using a modified Otsu’s method. The instantaneous centerline (“backbone”) of a spine was estimated from the thresholded image by successively computing the mid-point of all non-zero pixels in each horizontal line, from the bottom of the vertical spine image to the top. Instantaneous spine length (Lt) was calculated as the arc length of this centerline. Average length (slow length dynamics) was computed at each time-point as  where L1…L5 are the five instantaneous lengths measured at each of the five instants within a time-point (Figure 2
). Length motility (fast length dynamics) at each time-point was calculated as
where L1…L5 are the five instantaneous lengths measured at each of the five instants within a time-point (Figure 2
). Length motility (fast length dynamics) at each time-point was calculated as  The instantaneous center-of-mass was calculated as
  where (xi(t), yi(t)) are the positions of all non-zero pixels in the thresholded spine image at time t and N(t) is the total number of non-zero pixels at that time. Center-of-mass motility within each time-point is calculated as
Though all the analysis was performed on unfiltered images, for purposes of improved visualization in the figures, spine images were median (2 × 2) and mean (2 × 2) filtered. These images were then pseudo colored for display with EGFP intensity in spines represented using the hot colormap in MATLAB where black corresponds to an intensity of 0, white to 255, and various shades of red and yellow to intermediate intensity values.
Applying noise thresholds. Values of various spine quantifiers (e.g., center-of-mass motility and average length values) were calculated at each time-point and then compared to the corresponding noise thresholds. The threshold value for center-of-mass motility was estimated to be 0.12 μm (Figure 3
) and that for average length as 0.2 μm. If the calculated values were below their respective thresholds, they were reset to the threshold values. Spines for which a quantifier value is below the noise threshold at all time points are discarded from further analysis for that quantifier. Quantifier values at each time-point were then compared to baseline, and the nature of change in the value (increase, no change, or decrease) was determined using the noise thresholds for change estimated in Figures 3
B and 3
C – if the observed change for a spine was less than the threshold value, the spine was considered to have “no-change”, else it was considered to show either an increase or a decrease.
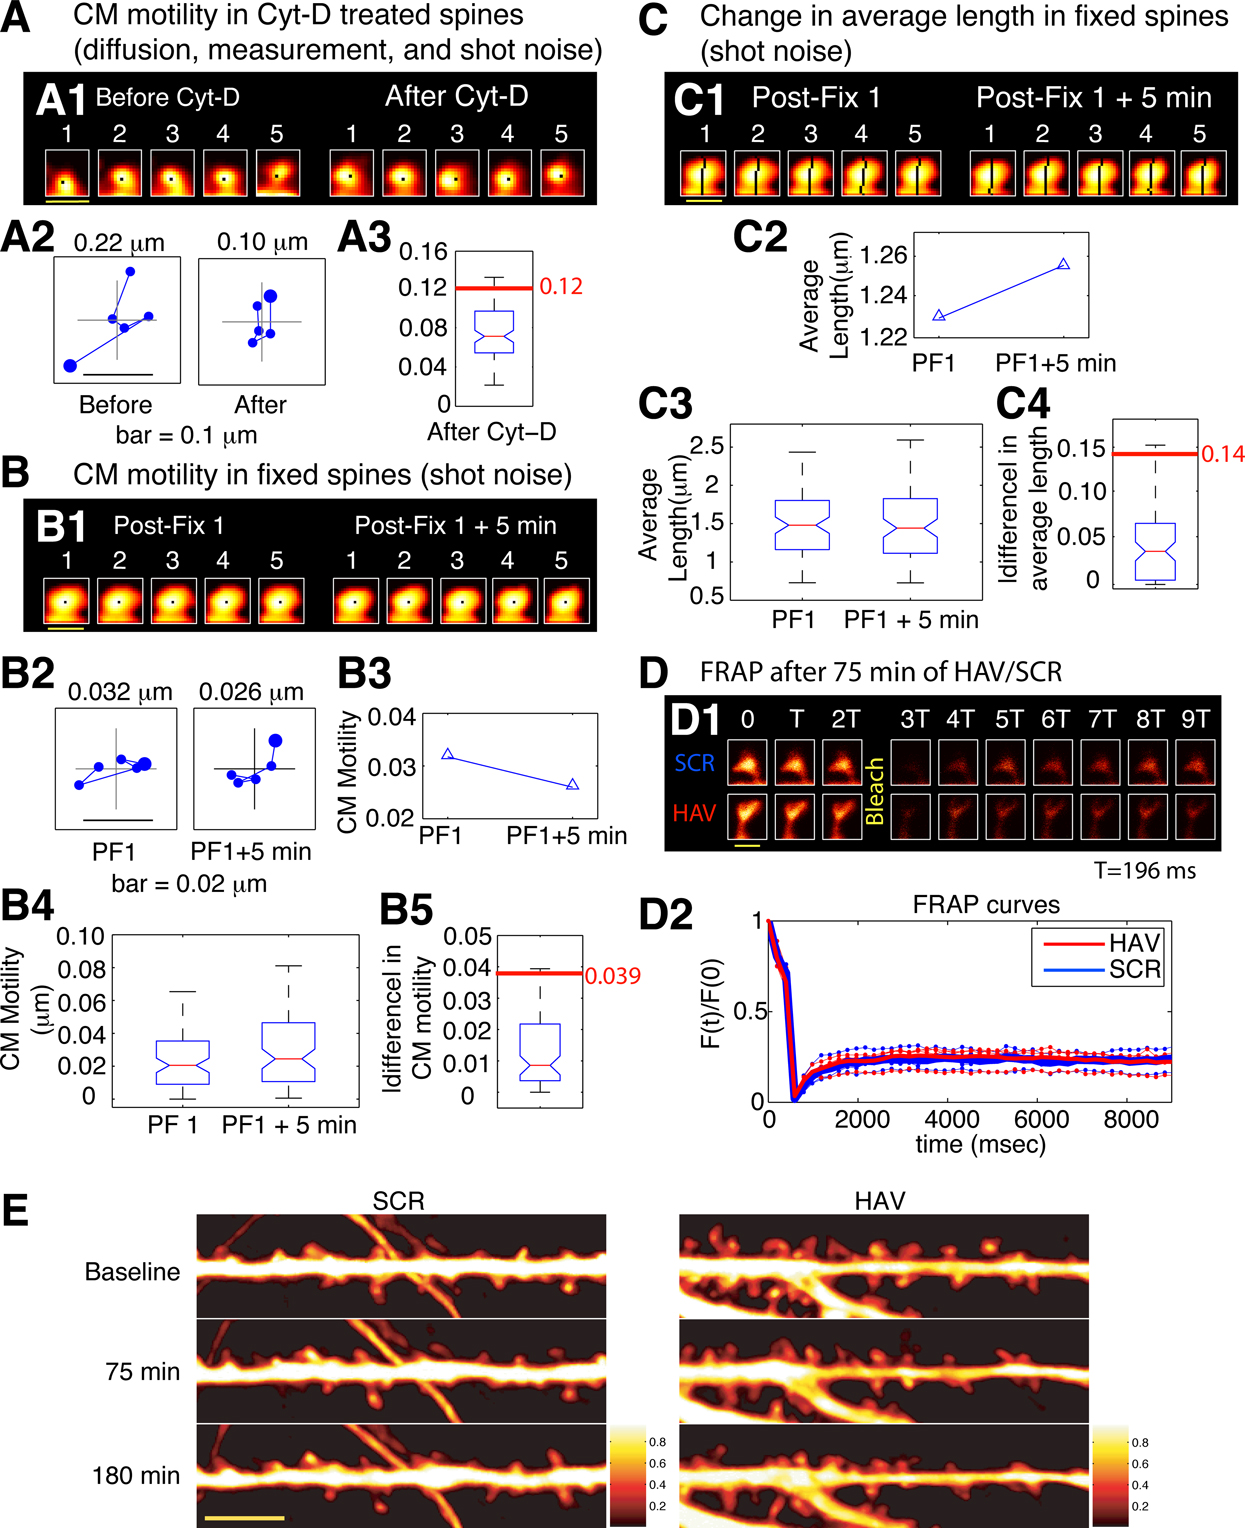
Figure 3. Estimation of noise-floors. (A) Estimate of noise in the measurement of center-of-mass motility of spines. (A1) Time-lapse images of a representative spine from an EGFP-expressing neuron before and 20 minutes after treatment with cyt-D (2 μM). (A2) Each panel shows the locus of successive instantaneous center-of-mass positions over the 5 minutes within a time-point (after translational normalization to center the locus at the origin). The large dot represents the position of the spine at the first minute within that time-point. The locus in each panel gives a visual indication of the extent to which the spine is motile. The center-of-mass motility value (net movement) of the spine within a time-point is indicated in microns. Cyt-D application causes a reduction in center-of-mass motility, as expected. (A3) Box plot showing the distribution of center-of-mass motility after cyt-D treatment (n = 229 spines). The 95-percentile value in this distribution (0.12 μm) was chosen as the noise threshold. (B) Estimate of noise in the change in center-of-mass motility. (B1) Time-lapse images of a representative spine at two time-points after fixing neurons and immunostaining EGFP-expressing neurons. (B2) Loci of the instantaneous center-of-mass positions of the example spine in (B1) within each of the two time-points (left and right panels respectively). The numbers in microns indicate total movement at that time-point. The difference between these two values is small, as expected. (B3) Center-of-mass motility of the example spine in (B1) at two time-points. (B4) Box plots showing the distributions of center-of-mass motility values at the two time-points after fixation (n = 128 spines). (B5) Box plot of the distribution of the absolute difference between the center-of-mass motility values measured at the two time-points. The 95-percentile value of this distribution (0.039 μm) noise was chosen as the noise threshold for change in center-of-mass motility. (C) Estimate of noise in the change in average length of spines. (C1) Time-lapse images of the example spine shown in (B1) with the instantaneous centerlines. (C2) Average length of the spine at two time-points. (C3) Box plots showing the distributions of spine average length values at the two time-points after fixation (n = 128 spines). (C4) Box plot of the distribution of the absolute difference between average length values measured at the two time-points. The 95-percentile value of this distribution (0.14 μm) noise was chosen as the noise threshold for change in average length. (D) Fluorescence recovery after photobleaching (FRAP) of EGFP. (D1) Time-lapse images of representative spines from HAV- and SCR-treated cells showing FRAP. (D2) Individual FRAP curves from four spines for each of the two treatments (red dots – HAV, blue dots – SCR) along with the average FRAP curves for each treatment (thick solid lines). Scale bar = 1 μm. (E) Time-lapse images of dendritic segments from neurons treated with SCR and HAV respectively. Scale bar = 5 μm.
Spine sample size and estimating probabilities of change. Spine data for Figures 3
–5
are from 690 spines (HAV), and 803 spines (SCR) across three experiments (four neurons for each condition). These spines were segregated into n = 14 and n = 16 groups for each treatment, respectively, with each group containing 50 spines. The probabilities of change (increase – pIncrease, decrease – pDecrease, and no change – pNochange) for each quantifier (e.g., average length, center-of-mass motility) were calculated for each group based on the behavior of the 50 spines within that group, and then the mean and standard error values were estimated from these. This segregation of spines into groups of 50 left us with a data set in which each group (“n”) was large enough to estimate probabilities while small enough that there were enough groups for statistical tests. Specifically, the data were grouped as follows: the dendrites from all the neurons in a condition were numbered randomly as were the spines on each dendrite. From this pool of spines, groups of 50 were marked off from 1 to the total number of spines in the pool. Since we observed the entire gamut of spine dynamics – loss/gain and increases and decreases in the various forms of motility – within each neuron (and, at times, within a dendrite); and this was true of control neurons as well, pooling together all spine data from a neuron (into one ‘n’) was not done to avoid potentially averaging out subtle effects. Using the number of dendritic segments as n was also not optimal since different segments in our dataset had sufficiently different numbers of spines making the spine-change probability estimates from these segments non-uniform. Once probabilities of change in a quantifier were estimated for each group of 50 spines, the distributions of these probabilities were compared between treatment and control. We found that when compared to just using population means and variances, quantifying the effects in terms of probabilities was more reliable for revealing subtle effects between spine populations. Additionally, this representation of the results allowed for convenient visualization of significant effects and for the interpretation of the probabilities as likelihoods for the behavior of individual spines.
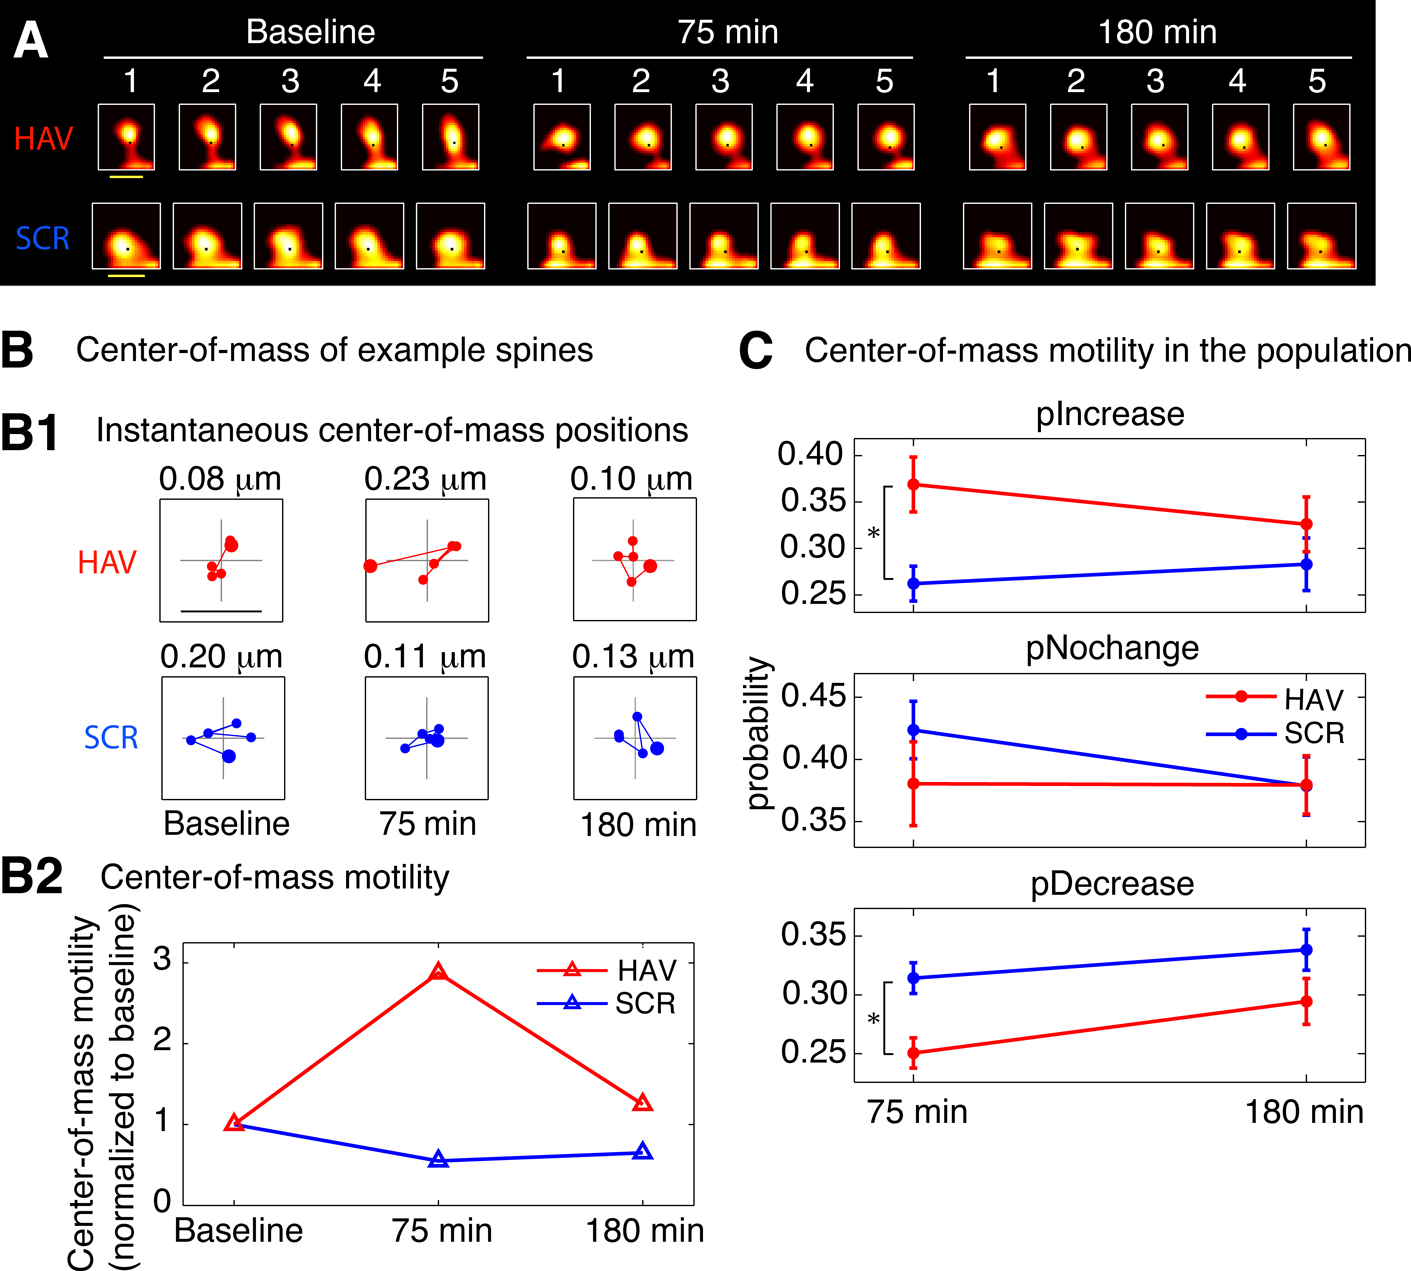
Figure 4. Spines show an increase in center-of-mass motility (fast timescale dynamics) after surface N-cadherin disruption. (A) Time-lapse images of representative persistent spines from AHAVD (HAV) and AADHV (SCR) treated neurons acquired at baseline, 75 minutes after treatment, and 180 minutes after treatment. The black dot superposed on each image represents the center-of-mass of the spine at that instant as computed from the thresholded image (see Materials and methods section). Scale bar = 1 μm. (B) Center-of-mass calculations for the example spines shown in A. (B1) Each panel shows the locus of successive instantaneous center-of-mass positions over the 5 minutes within a time-point (after translational normalization to center the locus at the origin). The large filled circle represents the position of the spine at the first minute within that time-point. The locus in each panel gives a visual indication of the extent to which the spine is motile. The center-of-mass motility value (net movement) of the spine within a time-point is indicated above the panel. Scale bar = 0.1 μm and applies to all panels. (B2) Center-of-mass motility of the example spines is plotted normalized to baseline. There was no significant difference at the baseline time-point in the center-of-mass motility values between the HAV- and SCR-treated spine populations. (C) Summary data (mean ± s.e.m) showing the probabilities of increase (pIncrease), no change (pNochange), and decrease (pDecrease) in the center-of-mass motility of all persistent spines. The motility value of a spine at each time-point was compared to that at baseline to determine the nature of change. Spine data in this and subsequent figures are based on 690 spines from HAV-treated cells, and 803 spines from SCR-treated cells (see Materials and methods section for details).
Electrophysiology
Whole-cell patch-clamp recordings were performed with an Axopatch 200B amplifier on cultured hippocampal neurons bathed in HBS containing in 1 μM TTX and 20 μM bicuculline. Whole-cell pipettes (with a resistance of 2.5–5 MΩ) were filled with a solution containing in mM: 100 cesium gluconate, 0.2 EGTA, 5 MgCl2, 2 ATP, 0.3 GTP, 40 HEPES, pH 7.2. Neurons with pyramidal-like morphology were voltage-clamped at –70 mV, and series resistance was left uncompensated. Membrane parameters and series resistance were monitored at the beginning and end of each recording and only cells with less than 20% change in series resistance were included for analysis. Mini analysis software (Synaptosoft) was used to manually detect minis. The data are
from 8–9 neurons in each condition, from 7 independent experiments paired for HAV and SCR treatments.
Statistical Comparisons
All data are plotted as mean ± s.e.m. Each sample distribution was tested for normality in MATLAB using the Lilliefors test. Since all comparisons in this paper are between HAV and SCR-treated sample distributions, the nature of the hypothesis test used depended on whether or not both the HAV and SCR distributions in each comparison were normally distributed. If they were, then two-tailed t-tests were used. If even one of the pair was not normally distributed, then the Wilcoxon two-sided rank sum test was used. ‘*’ represents significance at p < 0.05 for unpaired comparisons
(2 groups). Multiple comparisons (>2 groups) were performed where necessary (Figures 2
C, 3
C, 4
B,5
B and 5
C) and the inflation of Type-I error was kept in check using the false discovery rate (FDR) method (Genovese et al., 2002). In multiple comparisons, ‘*’ represents significance at p < 0.05 after correction. Comparisons that are not significant are not labeled.
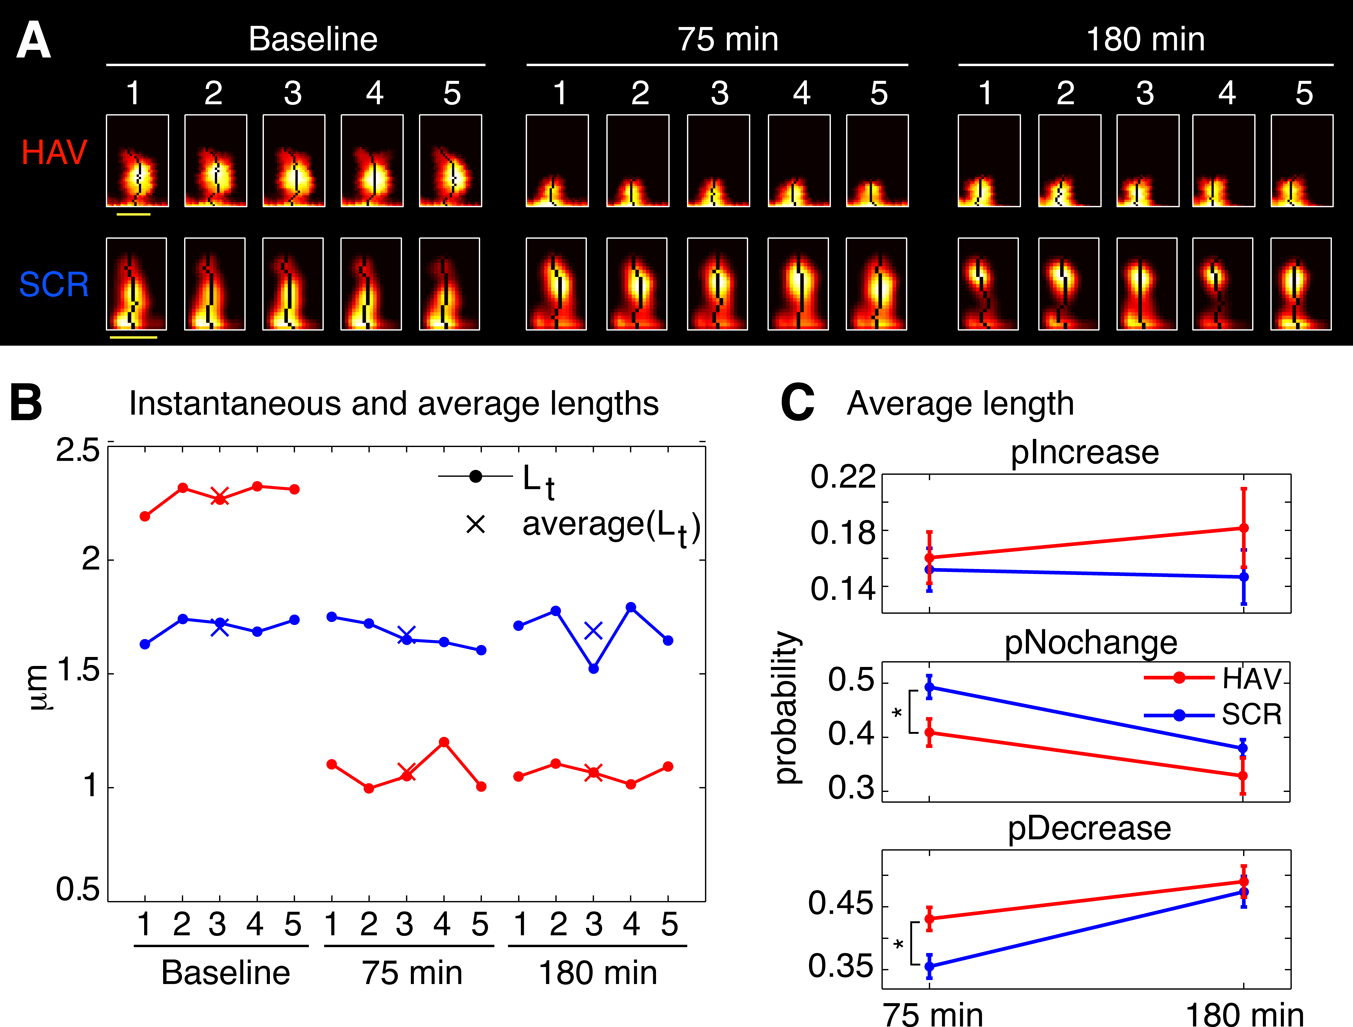
Figure 5. Spines shrink in length (slow timescale dynamics) after surface N-cadherin disruption. (A) Time-lapse images of representative persistent spines from HAV- and SCR-treated neurons. The single pixel curve superposed on each image represents the instantaneous centerline of the spine generated using a thresholded version of the raw image (see Materials and methods section). Scale bar = 1 μm. (B) Instantaneous and average lengths of example spines shown in A. Instantaneous lengths are denoted by filled circles, and average lengths at the three time-points by ‘X’. (C) Summary data (mean ± s.e.m) from all the spines showing the probabilities of increase (pIncrease), no change (pNochange), and decrease (pDecrease) in the average length. These are calculated by comparing the average length of a spine at each time point to that at baseline (see Materials and methods section).
Ten-Minute AHAVD (But Not AADHV) Peptide Treatment Disrupts N-cadherin Mediated Adhesion
To acutely disrupt N-cadherin-mediated structural synaptic constraints, we used a peptide (AHAVD) containing the His-Ala-Val sequence. Such peptides are known to inhibit N-cadherin- (Willems et al., 1995
; Williams et al., 2000
) and cadherin-mediated processes (Blaschuk et al., 1990
; Nose et al., 1990
), and have been used to investigate the role of N-cadherin in long-term potentiation (Tang et al., 1998
), axon-aligned Schwann cell process outgrowth (Wanner and Wood, 2002
), osteoblast differentiation (Ferrari et al., 2000
), and the differentiation and survival of olfactory epithelial neurons (Chuah et al., 1991
) (but see Renaud-Young and Gallin, 2002
). To evaluate the effectiveness of a brief application of AHAVD on N-cadherin-mediated adhesion, we performed cell aggregation assays (Figure 1
) on L cells that stably expressed N-cadherin (the expression of N-cadherin was verified by Western blot analysis; data not shown). When previously plated L cells were released, dissociated and then allowed to re-aggregate following either HAV (AHAVD), SCR (AADHV), or HBS (HEPES buffered saline, vehicle) treatment for 10 minutes, we found that HAV treated cells exhibited dramatically impaired re-aggregation (Figures 1
A and 1
B; N0/N90: HBS = 3.49 ± 0.27, HAV = 1.81 ± 0.13). We observed no significant difference between the aggregation recovery profiles of SCR- and vehicle-treated cells (N0/N90: SCR = 3.02 ± 0.19). These results confirm the ability of AHAVD containing peptides to disrupt the adhesive function of N-cadherin, indicate the effectiveness of acute HAV peptide treatment in producing persistent deficits in N-cadherin mediated adhesion, and establish the validity of using SCR as an effective control in our experiments.
Spine Dynamics at Two Timescales
To systematically characterize spine dynamics, we conducted high-resolution time-lapse confocal imaging of spines from cultured hippocampal neurons before and after N-cadherin disruption. Each acquisition time-point consisted of 5 z-stacks imaged once every minute –
representing the fast timescale – and time-points themselves were acquired hours apart – representing the slow timescale (Figure 2
A). Figures 2
C1 and 2
C2 show how the fast and slow dynamics in spine length were characterized (see Materials and methods section for details). Thus, fast length dynamics, henceforth referred to as length motility, represents the total amount of fast length “twitching” measured once every minute and summed over a course of 5 minutes. Slow length dynamics, henceforth referred to as average length, simply represents the average value of spine length over the 5-minute period. By calculating these two quantities at each time-point, we were able to study how fast and slow length dynamics change over time. We then performed this sort of characterization on a variety of spine morphology descriptors – spine head diameter, area, position, etc – and obtained fast and slow dynamic measurements for each of them.
Spine dynamics likely occur on a continuum of timescales, but we chose to study it at two representative timescales to illustrate the benefits of multiple timescale investigations in the same spines. Our rationale for the choice of minutes and hours to represent fast and slow timescales, respectively, was as follows – imaging at the rate of minutes was fast enough to capture rapid spine changes, yet slow enough to permit simultaneous volume imaging of a large number of spines (about 300 spines; scan speed of 1.57 seconds per z-scan at 1024 × 1024 resolution, with approximately 30 z-scans per z-stack), and imaging at the rate of hours permitted the examination of slower, steady-state-type cellular responses to treatment.
The diversity of spine dynamics, evident even in nearby spines on the same dendrite, makes the detection of treatment-induced differences across spine populations challenging. To determine differences in dynamics between spine populations, we found that comparing the probabilities of change between treatment and control was a reliable method for detecting treatment effects that are not revealed by comparing population means. For instance, in a group of 10 control spines (Figure 2
D1), the probabilities of change (increase – pIncrease, decrease – pDecrease, and no change – pNochange) in average length (slow length dynamics)
are calculated as the fractions of spines that shown an increase, no change, or decrease (Figure 2
D2) in length with respect to baseline measurements.
Estimation of Noise-Floors
Changes in spine morphology occur nearly continuously and range from subtle modifications to gross changes. These changes can be due to biological causes (actin dynamics) or manifestations of various kinds of noise (diffusion, measurement errors, shot noise, etc). To robustly detect even subtle changes in the dynamics of single spines and to distinguish “real” morphology changes from noise, we systematically estimated the contributions of various sources of noise to our measurements. These estimates for two representative spine descriptors, center-of-mass motility and average length, are described in Figure 3
. Similar estimates were obtained for all descriptors (data not shown).
To determine whether measured center-of-mass motility values corresponded to “real”, biological spine dynamics or not, we used Cytochalasin D (cyt-D), a drug that interferes with actin polymerization and is known to block spine dynamics (Fischer et al., 1998
). We reasoned that any dynamics measured post cyt-D application would provide a reliable estimate of the contribution of various sources of noise (diffusion, extra-spinal movement, shot noise) to the calculations of spine descriptors like center-of-mass motility. This estimate would also include the contribution of any residual, post-registration movement from extra-spinal sources (e.g., dendrite movement, dish movement, etc, see Materials and methods section). After cyt-D application, center-of-mass motility of spines decreased as expected (Figures 3
A1 and 3
A2), and the 95 percentile value in the distribution of post cyt-D center-of-mass motility values (Figure 3
A3) provided an estimate of the noise floor in center-of-mass motility measurements. Only those values of center-of mass motility that were above this noise-floor were considered to represent real dynamics (see Materials and methods section).
Though there may be no “real” change in the center-of-mass motility of a spine over time, the measured value can change because of contributions from noise (predominantly shot noise). To determine the magnitude of change that constitutes “real” change, we fixed neurons, immunostained them, and imaged spines at two time-points post fixation (Figures 3
B1–3
B4). We calculated the difference in center-of-motility between these two time-points. Since we expected no change in center-of-mass motility between these two time-points from biological causes, we reasoned that the 95 percentile value in the distribution of these differences would be a reliable estimate of the magnitude of change due to noise (Figure 3
B5). Only those changes in center-of-mass motility that exceeded this noise threshold in magnitude were considered to be real (see Materials and methods section). A similar estimate of the noise threshold for change in average length was obtained (Figures 3
C1–3
C4).
Finally, to determine whether HAV treatment affected the diffusion of EGFP (thereby confounding measurements of spine dynamics), we estimated diffusion rates in HAV-treated and control spines by examining fluorescence recovery after photobleaching (FRAP) (Figures 3
D1–3
D2). Since the significant effects we observed in center-of-mass motility (discussed below) were restricted to the 75-minute time-point, the FRAP experiment was also performed at 75 minutes after HAV or SCR treatment. The average fluorescence recovery curves for HAV and SCR spines were nearly identical, thereby indicating that there was no detectable effect of HAV on EGFP diffusion.
Thus, we established our ability to measure and detect changes in spine morphological descriptors and to distinguish them from noise. Time-lapse images of representative dendritic segments with spines following SCR or HAV treatment are shown in Figure 3
E illustrating that HAV treatment does not cause changes to the underlying dendritic segments (for instance, shrinkage), and therefore, that the spine effects we discuss below are not due to dendrite effects.
Spines Show an Increase in Center-of-Mass Motility (Fast Timescale Dynamics) after Surface N-cadherin Disruption
We first asked whether disrupting N-cadherin-mediated adhesion would lead to increased spine movement, in other words, an increase in spine dynamics in the fast timescale. Consistent with reports in the literature (Dailey and Smith, 1996
), more than 98% of the dendritic protrusions observed in our mature hippocampal neurons were spines (and less than 2% were filopodia-like). We monitored the fast dynamics of individual spines before and after (75 and 180 minutes) HAV or SCR peptide treatment for 10 minutes (Figure 4
). We found that in HAV-treated cells, more spines showed an increase in center-of-mass motility at 75 minutes than in control peptide-treated cells (scrambled AADHV peptide, SCR, Figure 4
C; at 75 minutes, pIncrease: HAV = 0.369 ± 0.030, SCR = 0.262 ± 0.019; pNochange: HAV = 0.381 ± 0.034, SCR = 0.423 ± 0.023; pDecrease: HAV = 0.251 ± 0.013, SCR = 0.314 ± 0.013). Center-of-mass is a descriptor that represents the central position of a spine at each instant (see Materials and methods section for details) and consequently center-of-mass motility represents the summed, fast positional movement of spines. This effect on fast timescale dynamics was no longer observed at 180 minutes after peptide exposure (pIncrease: HAV = 0.326 ± 0.029, SCR = 0.283 ± 0.028; pNochange: HAV = 0.380 ± 0.023; SCR = 0.379 ± 0.023, pDecrease: HAV = 0.294 ± 0.020, SCR = 0.338 ± 0.017). There was no significant difference at baseline between the center-of-mass motility distributions of HAV and SCR spines (data not shown). Of all the descriptors examined, the only significant effect in the fast time-scale was obtained in the center-of-mass of spines; the other descriptors (length, area, etc) showed no changes in motility after N-cadherin disruption (data not shown). These results demonstrate a preferential regulation of fast center-of-mass dynamics in spines by N-cadherin disruption. They establish directly that acute disruption of the N-cadherin-dependent structural constraints results in increased, fast spine movement, which lasts up to 75 minutes after treatment.
Spines Shrink in Length (Slow Timescale Dynamics) after Surface N-cadherin Disruption
We next examined the effects of N-cadherin disruption on slow spine dynamics (Figure 5
). We found that more spines showed a reduction in slow length dynamics (average length) 75 minutes after N-cadherin disruption (Figure 5
C; pIncrease: HAV = 0.161 ± 0.018, SCR = 0.152 ± 0.015; pNochange: HAV = 0.410 ± 0.025, SCR = 0.493 ± 0.021; pDecrease: HAV = 0.431 ± 0.018, SCR = 0.355 ± 0.019). Again, as with
center-of-mass motility, this effect was not observed 180-minute post treatment (Figure 5
C; pIncrease: HAV = 0.182 ± 0.028, SCR = 0.147 ± 0.019; pNochange: HAV = 0.328 ± 0.033, SCR = 0.379 ± 0.016, pDecrease: HAV = 0.490 ± 0.025, SCR = 0.474 ± 0.024). There was no significant difference at baseline between the average length distributions of HAV and SCR spines, and additionally, the average values of other spine morphological descriptors (like area, head diameter, etc) were unaffected by cadherin disruption (data not shown). These data show that N-cadherin disruption preferentially produces a decrease in average length (slow timescale), and an increase in center-of-mass motility (fast timescale). Further, an analysis of center-of-mass motility and spine length for spines under baseline conditions (data not shown) showed no relationship between these two parameters (for instance, it was not true that longer spines moved more). Together with the absence of an effect on other spine descriptors at the slow and fast timescales, the above data establish that (1) different aspects of spine morphology can be separately regulated (for instance average length is altered, but not average head diameter), and that (2) this regulation can be exerted independently at two different timescales (for instance, average length is modulated, but not length motility).
Acute Disruption of Surface N-cadherin Induces Spine Loss
In addition to changes in spine motility, it is possible to observe the growth of new spines or the complete retraction of pre-existing ones. N-cadherin disruption produced drastic effects on spines (Figure 6
). Spine turnover in HAV-treated neurons [spine turnover index = (spines lost + spines gained)/number of initial spines] was significantly greater in HAV-treated cells than in control beginning at 75 minutes (Figure 6
B, left panel; index at 75 minutes: HAV = 0.294 ± 0.016, SCR = 0.222 ± 0.023; index at 180 minutes: HAV = 0.422 ± 0.021, SCR = 0.307 ± 0.023). When spine turnover was split up into its component loss and gain fractions, there was no significant change in the gain fraction (Figure 6
B, middle panel; gain fraction at 75 minutes: HAV = 0.051 ± 0.008, SCR = 0.057 ± 0.009; gain fraction at 180 minutes: HAV = 0.132 ± 0.020, SCR = 0.111 ± 0.015); however the spine loss fraction was significantly greater at 180-minute post treatment (Figure 6
B, right panel; loss fraction at 75 minutes: HAV = 0.204 ± 0.023, SCR = 0.148 ± 0.018; loss fraction at 180 minutes: HAV = 0.290 ± 0.020, SCR = 0.196 ± 0.014). These data show that acute N-cadherin disruption at mature hippocampal synapses induces spine loss. To examine whether functional connectivity between neurons is also altered by N-cadherin disruption, we measured the frequency and amplitude of miniature excitatory postsynaptic currents (mEPSCs) recorded under whole-cell voltage clamp. We found that HAV treatment significantly reduced the mEPSC frequency (HAV = 0.414 ± 0.050 Hz, SCR = 1.140 ± 0.136 Hz) without altering the mean mEPSC amplitude (HAV = 16.315 ± 1.905 pA, SCR = 18.602 ± 1.924 pA; Figure 6
C). The above results indicate that spine loss induced by N-cadherin disruption is associated with the elimination of functional synaptic contacts.
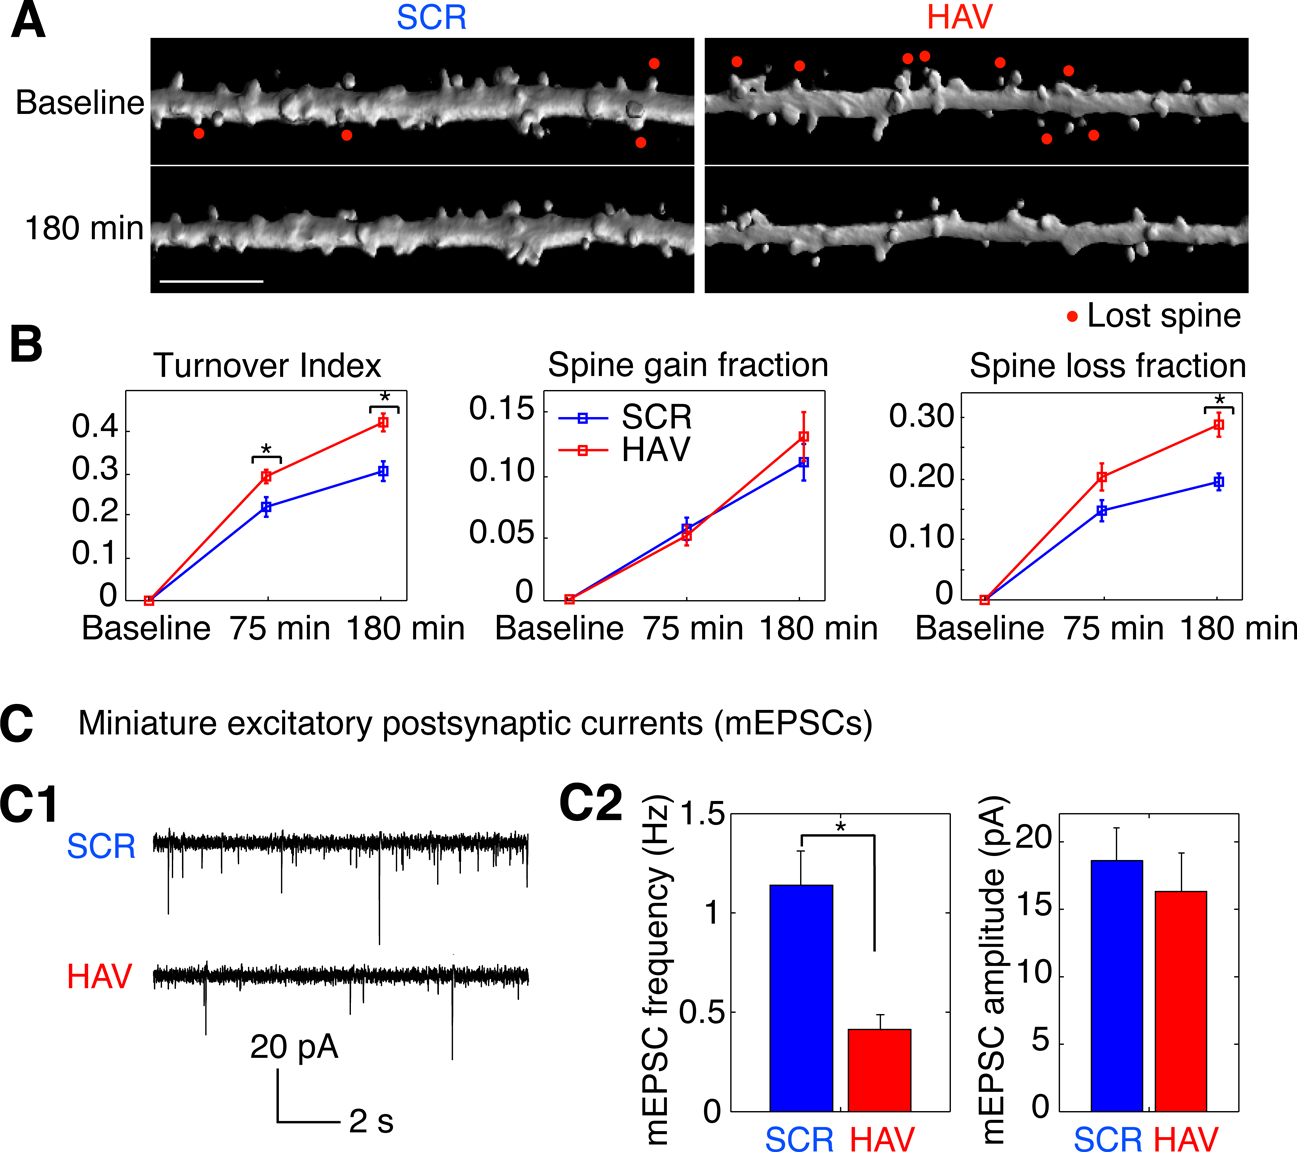
Figure 6. Acute disruption of surface N-cadherin induces spine loss. (A) Time lapse images of representative, 3-D reconstructed dendrites from neurons expressing soluble EGFP, obtained before (baseline) and 180 minutes after treatment. Left and right panels show SCR- and HAV-treated dendrites respectively. Scale bar = 5 μm. (B) Summary data (mean ± s.e.m) showing from left to right, spine turnover index [(loss + gain)/total], spine gain fraction, and spine loss fraction. (C) Examining miniature synaptic events (mEPSCs) with voltage-clamp recordings to determine functional effects. (C1) Sample mEPSCs from HAV- and SCR-treated cells recorded at 30 minutes after treatment. (C2) mEPSC frequency and amplitude plots. Data represent mean ± s.e.m, n = 9 and 8 neurons for HAV and SCR respectively.
N-cadherin Disruption Results in Increased Correlation Between Early Changes in Spine Dynamics and Later Spine Loss
The functional disruption of N-cadherin leads to changes in the average length and center-of-mass motility behavior of spines at 75 minutes and increased spine loss at 180 minutes. To examine whether early changes in spine behavior are linked to later loss, we compared between treatment (HAV) and scrambled control (SCR) groups the joint probability distributions of center-of-mass motility at 75 minutes and spine fate at 180 minutes. We found that the relationships between early spine behavior and later spine fate were significantly altered by treatment (Figure 7
). Interestingly, after HAV treatment, spines with increased center-of-mass motility were preferentially lost when compared to spines with other center-of-mass motility behavior (Figures 7
A1, 7
A2; probabilities from left to right, top to bottom, (HAV, SCR): (0.109 ± 0.016, 0.084 ± 0.013), (0.145 ± 0.025, 0.121 ± 0.015), (0.056 ± 0.010, 0.022 ± 0.008), (0.095 ± 0.020, 0.109 ± 0.011), (0.470 ± 0.028, 0.578 ± 0.024), (0.126 ± 0.023, 0.087 ± 0.011), and >7
C). Similarly, when we examined the joint probability distributions of average length at 75 minutes and spine fate at 180 minutes, we found that spines that first decreased in length were preferentially lost at the later time-point (Figures 7
B1, 7
B2; from left to right, top to bottom, (HAV,SCR): (0.346 ± 0.023, 0.393 ± 0.018), (0.126 ± 0.016, 0.189 ± 0.023), (0.088 ± 0.016, 0.071 ± 0.014), (0.064 ± 0.011, 0.067 ± 0.014), (0.283 ± 0.023, 0.242 ± 0.022), (0.093 ± 0.012, 0.038 ± 0.010), and 7
C). Together, these data show an increased correlation between early and late spine changes when compared to control and suggest directed structural effects: an early increase in motility and a decrease in length are structural precursors of later spine loss in the context of N-cadherin disruption.
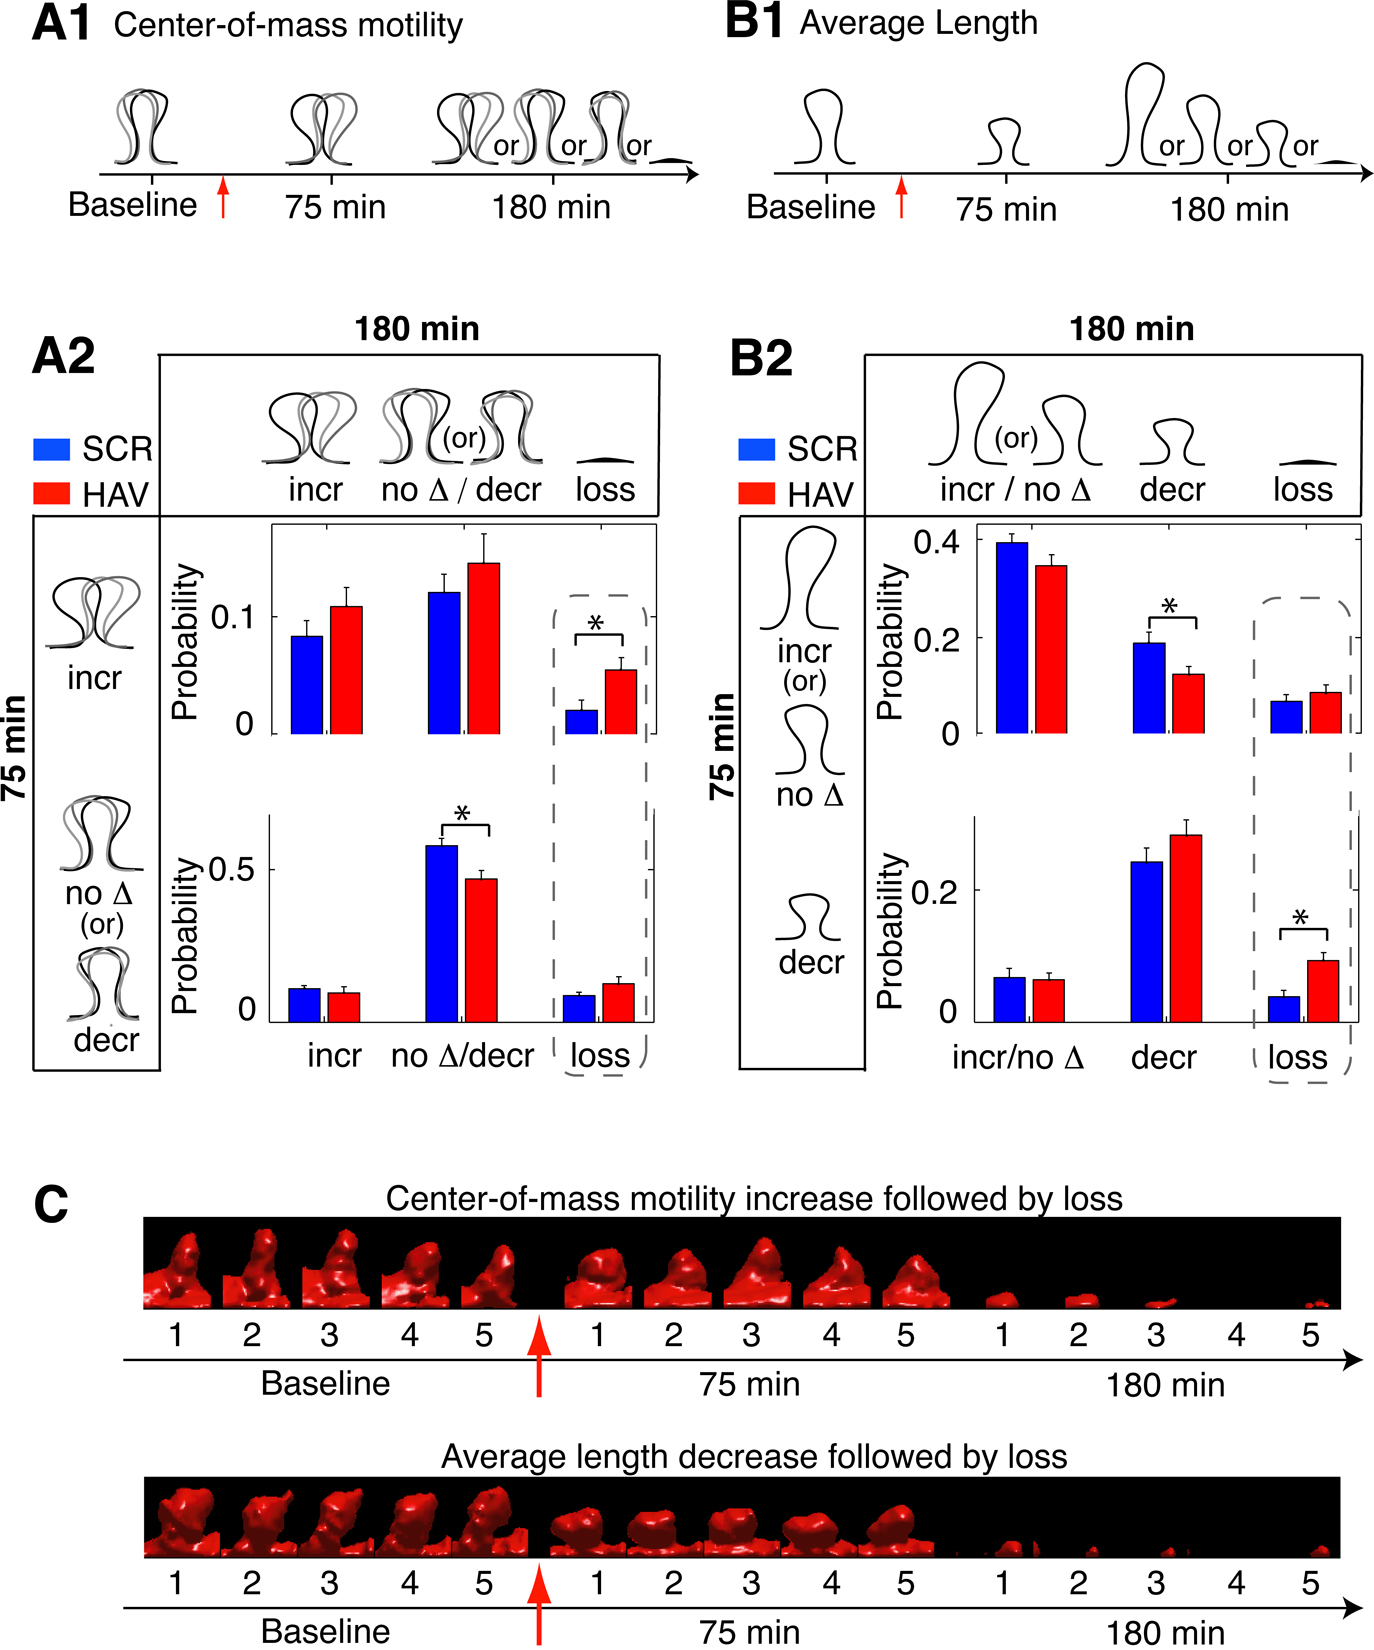
Figure 7. N-cadherin disruption results in increased correlation between early changes in spine dynamics and later spine loss. (A1) Schematic showing a spine with an increase in center-of-mass motility at 75 minutes and its possible states (with respect to center-of-mass motility) at 180 minutes. (A2) Joint probability distribution between center-of-mass motility at 75 minutes and spine fate (with respect to center-of-mass motility) at 180 minutes (incr – probability of increase, no Δ – no change, decr – decrease. The possible states of a spine at 75 and 180 minutes yield a joint distribution with 2 × 3 states in total. This distribution for HAV-treated spines is significantly different from that of SCR-treated spines (control) as indicated by ‘*’ (see Materials and methods section). The dashed box highlights the comparisons of interest and points to the increase with respect to control in the fraction of spines that first show an increase in center-of-mass motility and are then lost. Note that the fraction of spines that show other center-of-mass motility (no change or decrease) at 75 minutes and are then lost is not different between treatment and control. At 75 minutes, the no change and decrease in motility states have been merged to improve visualization while highlighting the significant effect in increase in motility. (B1) Schematic showing a spine with decrease in average length at 75 minutes and its possible states (with respect to average length) at 180 minutes. (B2) Joint probability distribution between average spine length behavior at 75 minutes and spine fate 180 minutes; 2 × 3 states in total. The joint distributions of HAV- and SCR-treated spines are significantly different. Further, spines that show a decrease in length at 75 minutes are preferentially lost at 180 minutes after HAV treatment - dashed box. We tested for correlations between average length and center-of-mass motility at 75 minutes and found no significant difference between HAV and control spines (data not shown). At 75 minutes, the no change and increase in length states have been merged to improve visualization while highlighting the significant effect in decrease in length. (C) (Top panel) Time-lapse, volume rendered images of an HAV-treated spine that showed an increase in motility at 75 minutes and was subsequently lost at 180 minutes. (Bottom panel) Volume rendered images of an HAV treated spine that first decreased in length and was then lost. Red arrows indicate the 10-minute application of treatment at time t = 0 minute.
With time-lapse imaging of hippocampal neurons, we have tracked the progression of structural events following acute surface N-cadherin disruption and have shown that there are significant structural and functional synaptic changes that occur within 3 hours. We have shown that synapses exposed to N-cadherin disruption exhibit diminished functional synaptic efficacy (as indicated by the reduction in mEPSC frequency at 30-minute post treatment). Spines exhibit greater motility, shrink in length, and are subsequently lost. These results also show that early structural changes (here, changes in spine length and motility) can become more tightly correlated with later structural plasticity (here, spine loss) when the synaptic environment undergoes alteration (here, by N-cadherin disruption). Such a processive relationship between forms of structural plasticity is novel and suggests a concerted regulation of structural dynamics.
Aggregation assays conducted in heterologous cells suggest that the significant structural effects we see in neurons are the result, at least in part, of the HAV-initiated persistent loss of N-cadherin-mediated adhesion. The increase in spine motility following αN-catenin disruption observed by Abe et al. (2004)
is in agreement with the increased dynamics we report here. However, our study constitutes the first direct investigation of the role of N-cadherin in regulating spine dynamics. Our data shed light on the observations of others showing that the removal of structural constraints is involved in certain forms of experience-dependent spine plasticity (Oray et al., 2004
), and the involvement of N-cadherin in the structural stability of synapses (Goda, 2002
; Takeichi and Abe, 2005
). Whether N-cadherin has a similar regulatory role in vivo has yet to be examined.
Specificity of AHAVD in Blocking N-cadherin
L cells do not natively express cadherins and exhibit negligible aggregation at Ca++ ext = 1 mM. Also, transformed L cells that express N cadherin aggregate in a Ca++-dependent manner (Hatta et al., 1988
). Together with the above, the inhibition of aggregation that we observe in N-cadherin expressing L cells following HAV application shows that the peptide blocks N-cadherin. It has been shown that if the flanking amino acids in HAV peptides are those found in N-cadherin, the resulting peptides are potent and specific inhibitors of N-cadherin function (Willems et al., 1995
; Williams et al., 2000
). This strongly suggests that AHAVD, the peptide used here, interferes specifically with N-cadherin function at synapses.
Acute N-cadherin Disruption
While presynaptic function in N-cadherin knockout cells is affected under conditions of high stimulation at 10–12 DIV, there is no effect on spontaneous neurotransmission (mEPSC amplitude or frequency) at resting conditions, under low frequency stimulation (Jungling et al., 2006
), or on initial synapse formation. On the one hand, these results reveal a role of N-cadherin in regulating vesicle exocytosis specifically during enhanced synaptic activity. However, the reported lack of an effect on baseline synaptic ultrastructure and function suggests that compensatory mechanisms may take over some of N-cadherin function during development, and therefore limit a full analysis of N-cadherin’s role in mature synapses. Our results show structural and functional deficits associated with acute N-cadherin disruption. This further supports the need for acute treatments in probing N-cadherin function at synapses in addition to knock out, or dominant negative overexpression techniques.
Characterizing Various Forms of Spine Dynamics
In the literature, the term “spine motility” has been used to describe a wide variety of structural phenomena ranging from subtle changes in the ruffling of membranes to the loss and gain of spines. Previous studies of individual spine dynamics have often used very general measures of change – for instance, the motility index (Dunaevsky et al., 1999
), and differences between successive time-lapse images (Fischer et al., 2000
). Alternatively, when specific measures have been used, they have been applied to quantify change in one or two aspects of spine morphology – for instance, protrusive motility [changes in length, (Fischer et al., 1998
; Maletic-Savatic et al., 1999
)], head morphing motility [changes in head size, (Fischer et al., 2000
; Konur and Yuste, 2004
; Okamura et al., 2004
; Tashiro and Yuste, 2004
)]. However, a systematic characterization of all forms of spine dynamics has not been performed. Additionally, the timescales along which changes can occur have not been treated systematically, and this constitutes another potentially confounding factor. To address these issues, we characterized dynamics at two timescales – fast and slow, and we performed this two-timescale characterization for each descriptor of spine morphology – length, area, position, head diameter, etc. Thus, effects on individual descriptors could be isolated. Is it biologically meaningful to separate out effects on individual aspects of spine morphology, as opposed to using general measures of change? It has been shown that intracellular mechanisms can, in fact, independently regulate different forms of spine dynamics (Tashiro and Yuste, 2004
), thereby establishing the need for such detailed characterization as described above.
In this paper, center-of-mass motility has emerged as the main form of fast timescale spine dynamics regulated by N-cadherin. What does this measure represent? Per the definition (see Materials and methods section), center-of-mass motility is a measure of the change in the position of spines. The lack of an effect in the fast timescale dynamics of length (protrusive motility) and other spine descriptors indicates that the positional changes described by center-of mass motility in this paper correspond largely to fast, lateral spine movement which is consistent with the idea of a “search” for presynaptic partners.
Spine Motility and EGFP Diffusion
Changes in cytosolic diffusion rates of fluorophores within a spine have been positively correlated with changes in neck length but not to any other forms of spine change (Majewska et al., 2000
). The diffusion rate of a membrane-bound GFP has been shown to be inversely correlated with volume motility (Richards et al., 2004
), but as membrane-limited diffusion processes differ significantly from cytosolic diffusion processes, the link between volume motility and cytosolic diffusion is unclear. Additionally, in these studies, motility and diffusion rates are compared on the same timescale (milliseconds or seconds). Here, diffusion rates are on the order of 100 seconds of milliseconds, while the fastest form of motility we observe is over two orders of magnitude slower (5 minutes) and can therefore not be compared directly. We observed that HAV treatment had no effect on GFP diffusion as measured by FRAP. Furthermore, the observation that HAV treatment selectively affects some forms of motility, but not others, is not consistent with a simple effect on GFP diffusion.
Comparing Stochastic Spine Dynamics Between Treatment and Control
Even in control neurons, spines display a wide variety of morphological dynamics. Comparing the dynamics post-treatment to these ongoing baseline dynamics can highlight stimulus-induced associations between various forms of spine motility. Particularly, any predictive associations can be studied via such comparisons to the stochastic baseline. In the context of N-cadherin disruption, we have used such comparisons to reveal correlations between early structural events and later spine loss in this study. Additionally, the other two significant effects in joint probability (seen outside the dashed boxes in Figures 6
A2 and 6
B2) further support the conclusion that N-cadherin disruption alters the underlying stochastic dynamics of spines.
By analyzing probability distributions in treatment and control conditions, we have presented a way of comparing large populations of spines in a statistically robust way. The resulting conclusions apply to the behavior of spine populations and cannot tell us whether or not any individual spine will show a particular behavior. However, the advantage of framing these statements in probabilistic terms is that they give us the likelihood with which any individual spine will behave in a particular manner.
Validity of Correlations Between Early and Late Structural Events Following N-cadherin Disruption
We show an increase in motility at 75 minutes and greater loss at 180 minutes as a result of N-cadherin disruption. Why then is an increased correlation between early motility increase and later loss not expected? At a population level, there is no reason to expect that earlier events are correlated with later ones though both are consequences of the same treatment. For instance, spines that did not show an increase in motility at 75 minutes could have been preferentially eliminated at 180 minutes leading to no change with respect to control in the correlation between early enhancement of spine motility and later loss. Our finding of an increase in this correlation is interesting as it reveals concerted regulation over time in the same spines.
Since length reduction immediately preceding spine loss is natural, why is the increased correlation between early spine length reduction and later loss meaningful? While loss necessitates earlier length reduction, the converse does not need to be true – length reduction does not necessitate later loss – as evidenced by short spines that can later elongate or otherwise persist. Further, since length reduction and loss are both measured at pre-determined time points (75 and 180 minutes, respectively), any observed correlation that is greater than baseline is surprising. The same holds true for the increased correlation between higher center-of-mass motility later spine loss.
Implications of Increased Correlations Between Early and Late Structural Events Following N-cadherin Disruption
It is unlikely that the significant increases in correlation observed between enhanced motility (or decreased length) on the one hand, and spine loss on the other, are indicative of a direct causal relationship between these early and late events. Instead, they are very likely indicative of a set of directed structural events following cadherin disruption. Spines that are more motile or short at the 75-minute time-point perhaps represent spines in different stages of instability following the loss of structural support at synapses.
Motility has been suggested as a mechanism by which dendritic protrusions search for presynaptic partners (Dailey and Smith, 1996
; Jontes and Smith, 2000
; Wong and Wong, 2000
). Given the reduction in functional synaptic efficacy we observe at 30-minute post treatment, the increased motility that follows is consistent with such a search scenario following N-cadherin disruption. The shorter spines we observe may represent the beginning of a withdrawal process following an inability to maintain synaptic contact. Subsequent to this, there is significant spine loss indicating an ongoing process of synaptic restructuring. Though spine loss is statistically significant only at 180 minutes, the trend for greater loss is evident even at 75 minutes in Figure 5
B, supporting the idea of a graded, stage-wise response to structural disruption with different spines at different stages. Loss may itself represent an intermediate step in a more long-term compensatory response in the cell involving eventual spino- and synaptogenesis. It has been shown in the literature (Togashi et al., 2002
) that after chronic (3-day) N-cadherin disruption via the overexpression of the dominant-negative form, there is a greater incidence of elongated (filopodia-like) dendritic protrusions, though there is no change in the overall density when compared to control. These data are consistent with our hypothesis of eventual recovery of spine and synapse number, since filopodia are thought to be precursors of spines (Dailey and Smith, 1996
).
Mechanistic Links
Mechanistically, the Rho family of small GTPases are known to play a key role in regulating spine dynamics (Bonhoeffer and Yuste, 2002
; Lamprecht and LeDoux, 2004
; Tashiro and Yuste, 2004
), and they have been shown to independently affect different forms of dynamics (Tashiro and Yuste, 2004
). Additionally, they are known to regulate cadherin-mediated cell adhesion (Anastasiadis and Reynolds, 2001
; Braga et al., 1997
; Fukata and Kaibuchi, 2001
; Magie et al., 2002
; Okabe et al., 2003
). It is plausible that the correlations we see upon N-cadherin disruption arise from a time-dependent regulation of the recruitment of these GTPases.
Components of the N-cadherin adhesion complex, such as β-catenin and αN-catenin subserve many of its signaling functions and mediate the intercellular linkage between N-cadherin and the actin cytoskeleton (Bienz, 2005
; Gates and Peifer, 2005
; Gumbiner, 2005
). αN-catenin knockout increases spine dynamics (Abe et al., 2004
) and β-catenin regulates spine morphology (Murase et al., 2002
; Okuda et al., 2007
; Yu and Malenka, 2003
). In addition, β-catenin plays a key role in the endocytosis of N-cadherin and potentially exercises control over actin dynamics (Okabe et al., 2003
; Tai et al., 2007
). The α- and β-catenins are therefore highly likely candidates for mediating the intracellular signaling following N-cadherin disruption which results in changes in spine structure and synaptic function.
Precursors of Spine Loss
Spine loss and synapse elimination can modulate the functioning of a neuronal network either by weakening synaptic coupling or by altering the network connectivity pattern (Chklovskii et al., 2004
; Poirazi and Mel, 2001
; Stepanyants and Chklovskii, 2005
). Therefore, understanding the sequence of events that lead up to spine loss are important. Structural events preceding synapse formation were recently reported (Knott et al., 2006
). However, the events preceding spine elimination have been unknown. By tracking the probability distributions underlying stochastic spine behavior, we have captured the events leading up to spine loss following an acute disruption of the structural constraints of synapses. Changes in these distributions allow us to discern relatively subtle structural effects, and we show that early increase in motility and reduction in spine length are indicators of later spine loss in the context of acutely disrupting the structural constraints of synapses. While the conclusions here are valid only in the specific context of N-cadherin disruption, such characterization opens the door for exploring in greater detail the evolution of experience-dependent structural plasticity in neuronal circuits in general.
Taken together, our results establish that structural events in spines can change in a coordinated way and that it is possible to uncover predictive relationships between early dynamics and later spine loss. This study argues that N-cadherin is important among cell-adhesion molecules in the maintenance and regulation of structural integrity at mature excitatory synapses in the hippocampus.
The authors declare that the research was conducted in the absence of any commercial or financial relationships that could be construed as a potential conflict of interest.
We thank Mike Sutton, Sally Kim, and Dani Dieterich for discussions and for critically reading the manuscript. We thank Jessica Woo for spine selection during image processing. This work was supported by HHMI and NIH R21MH076910-02.