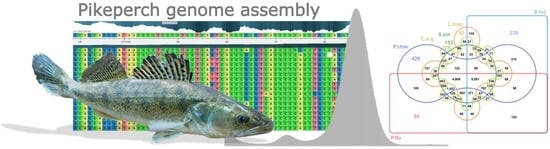
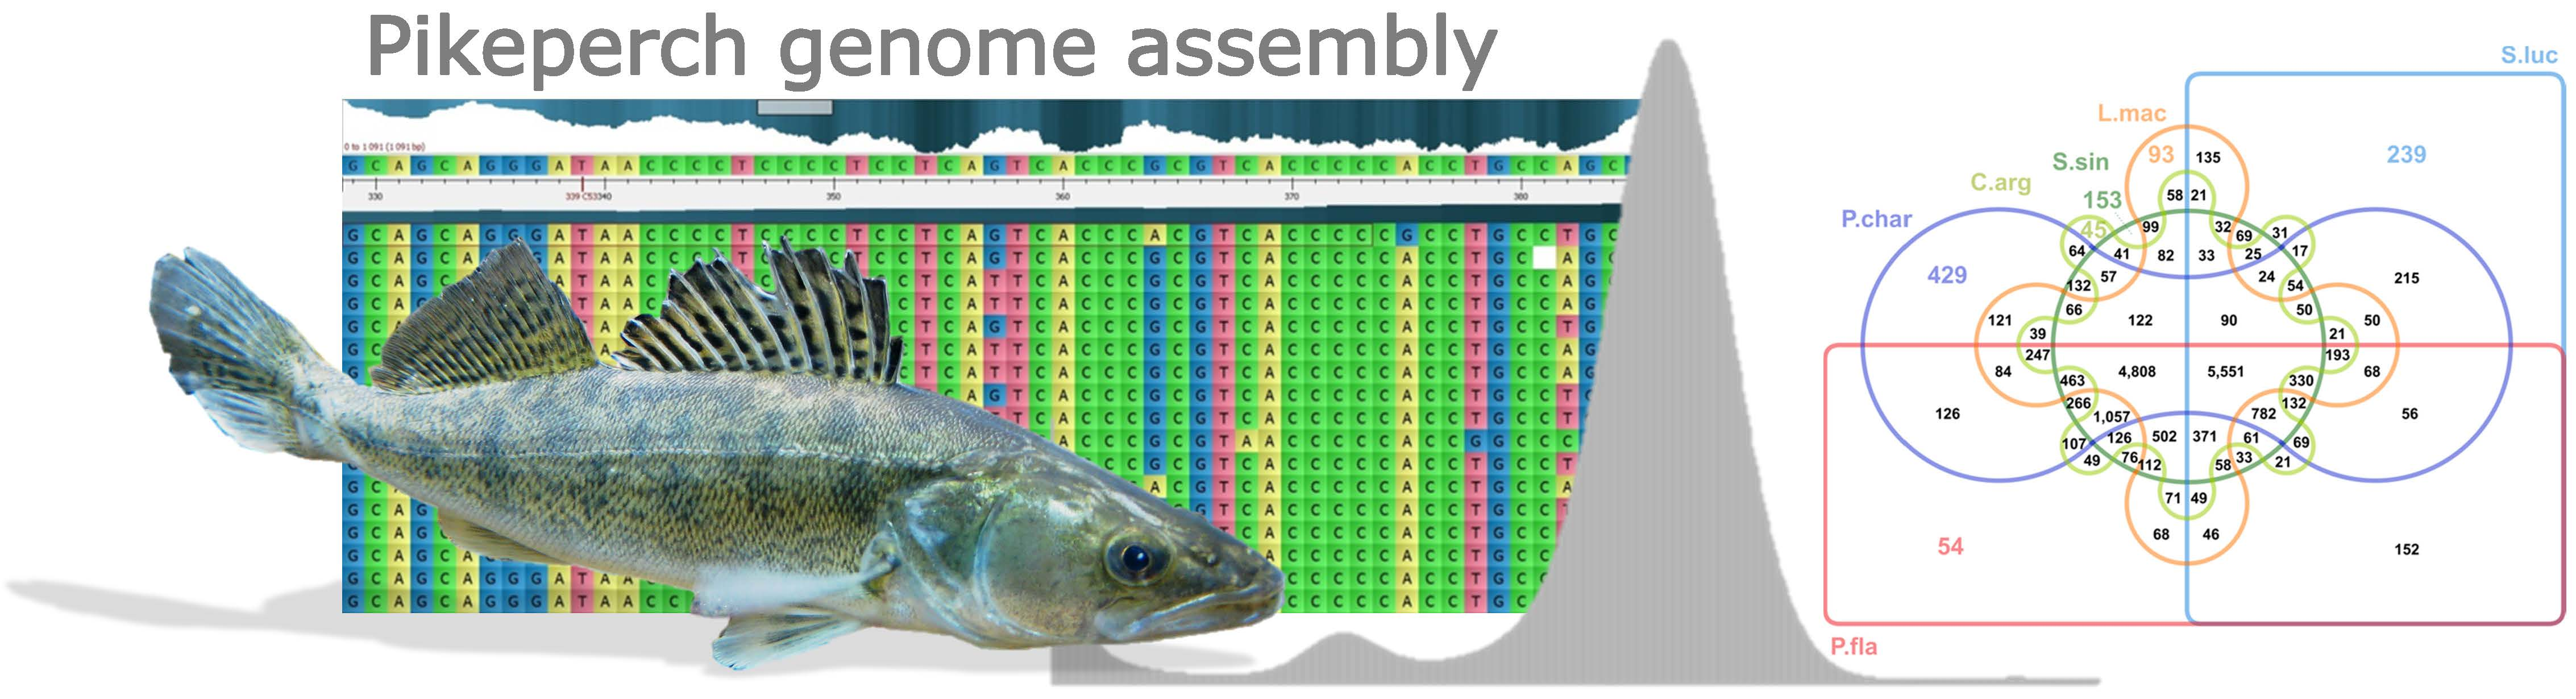
The First Highly Contiguous Genome Assembly of Pikeperch (Sander lucioperca), an Emerging Aquaculture Species in Europe

 , ,
, ,  ,
, 
Abstract
:
1. Introduction
2. Materials and Methods
2.1. Sample Collection, Library Preparation
2.2. Whole Genome Sequencing, Quality Control
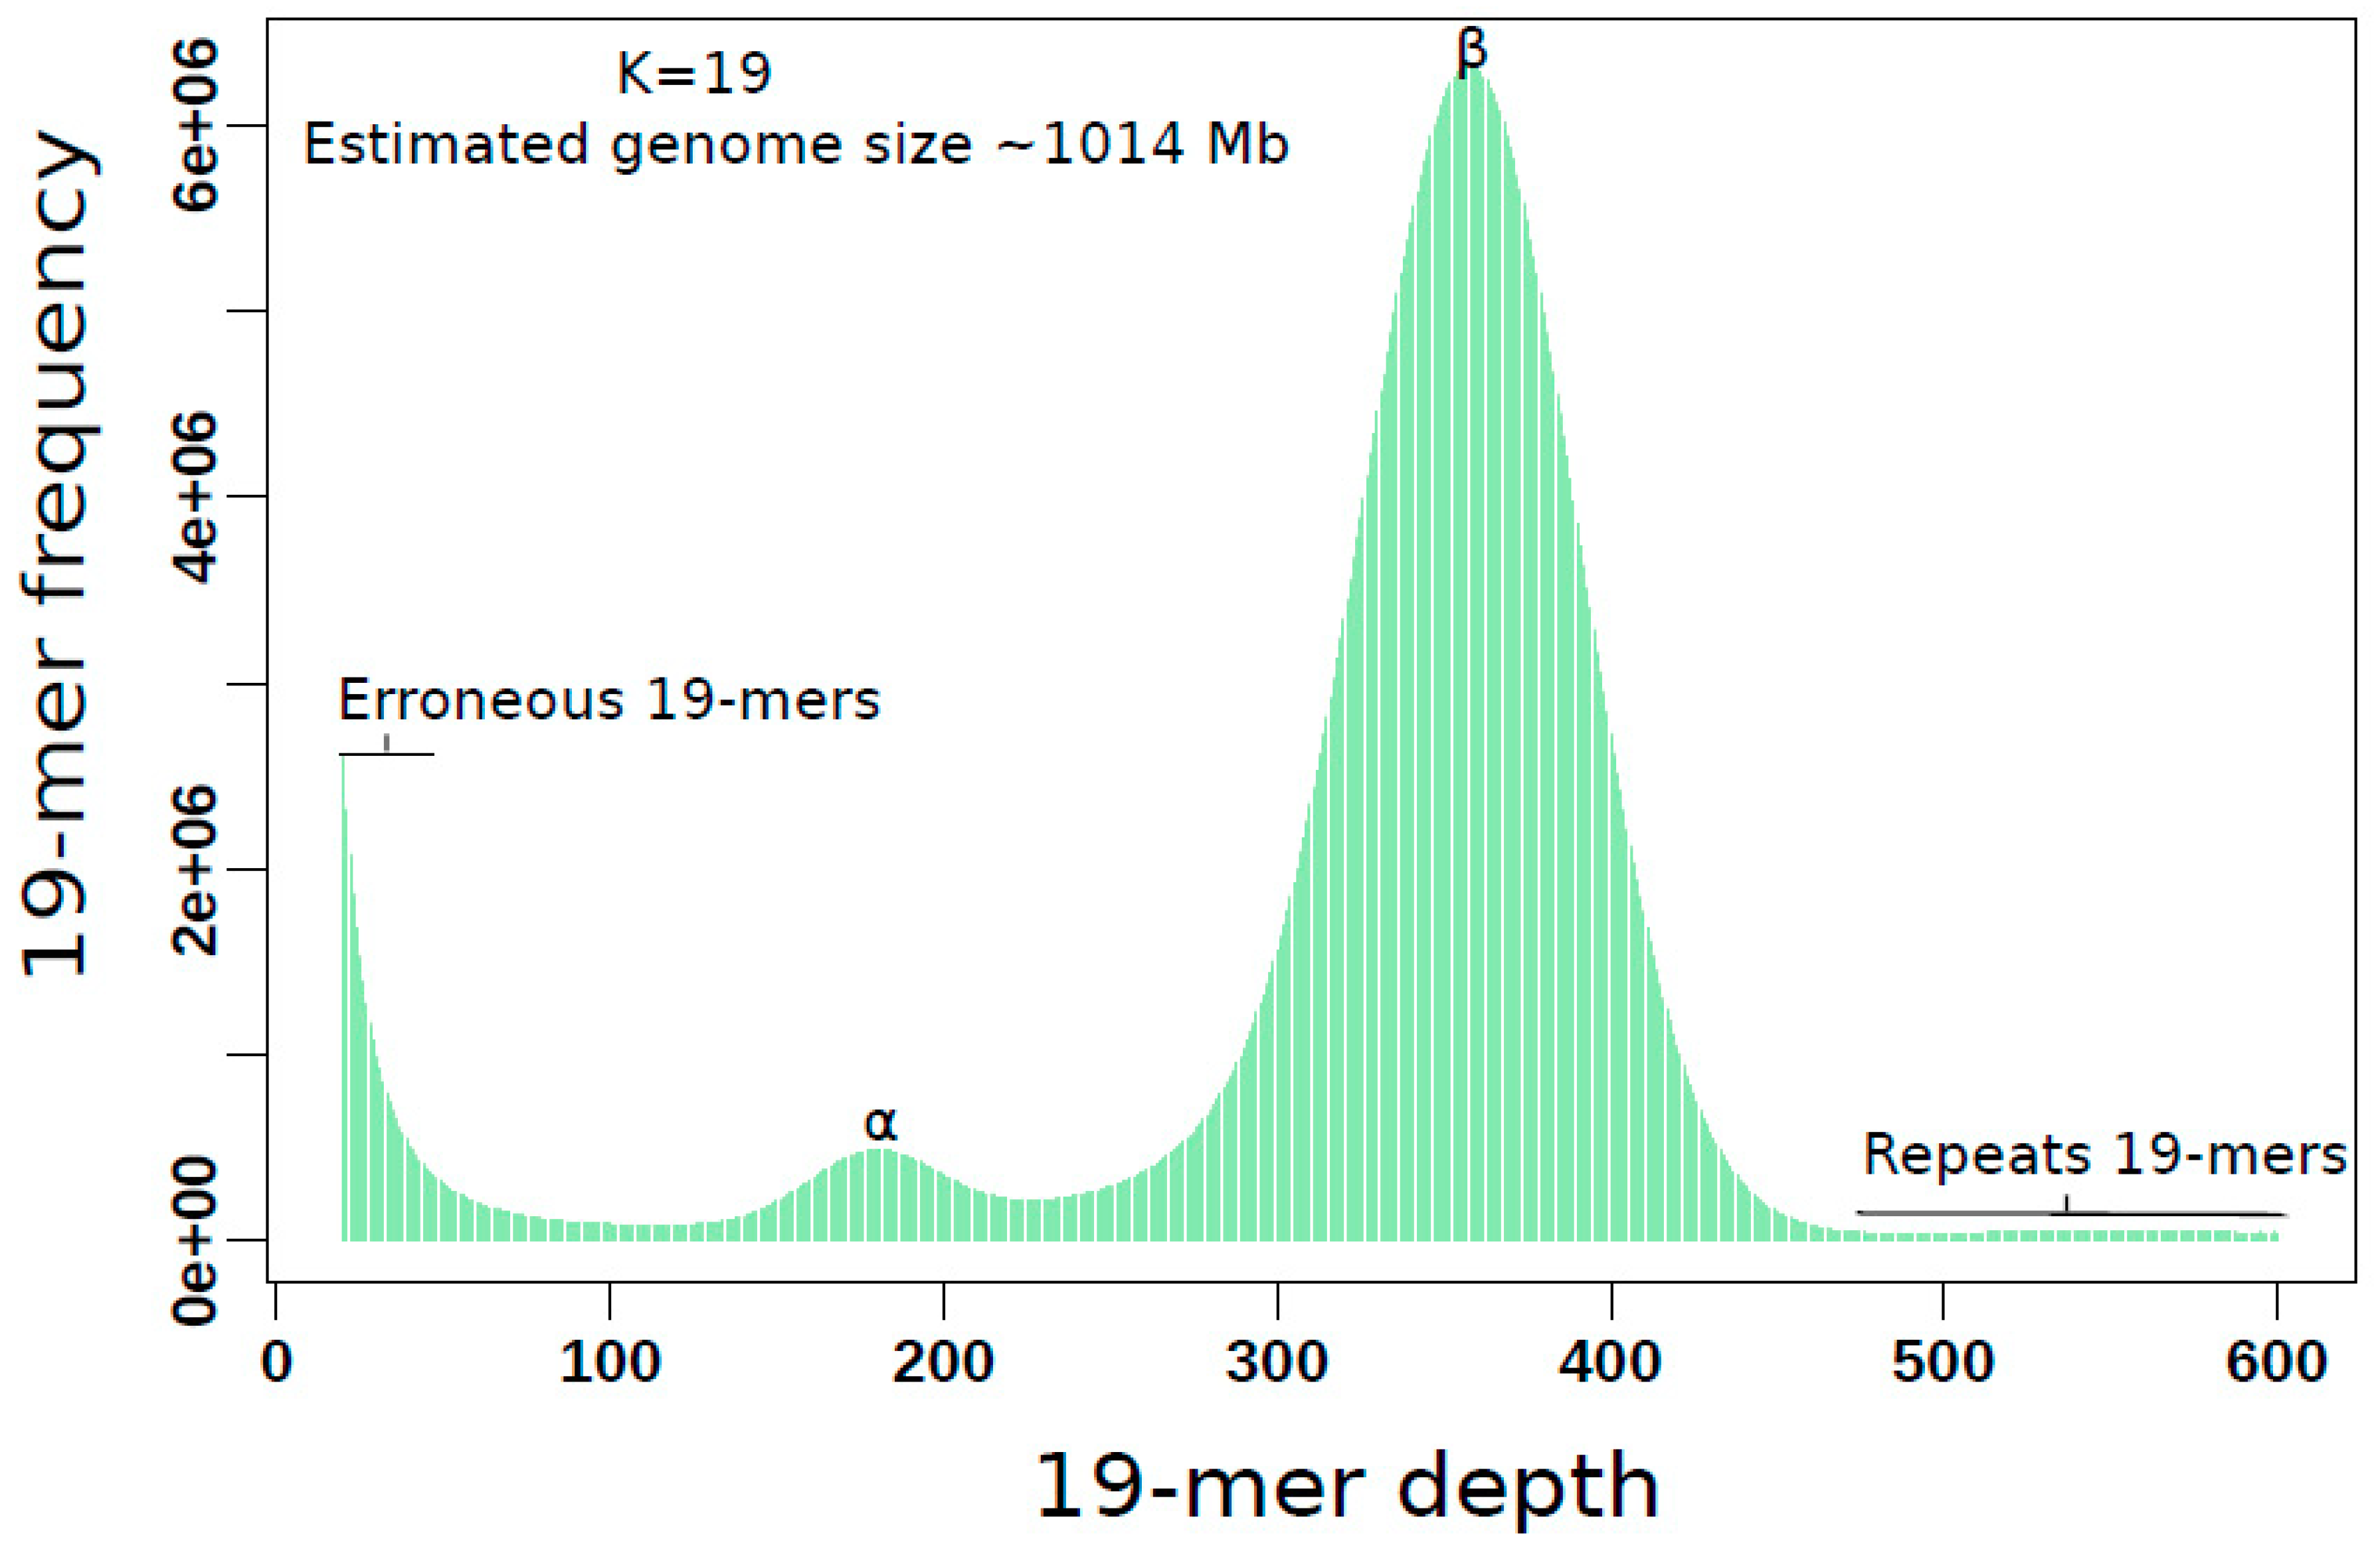
2.3. K-mer Based Genome Characteristics Estimation
2.4. Genome Assembly with Long PacBio Reads
2.5. Quality Assessment of the Assembly
2.6. Repeats Annotation
2.7. Gene Structure Prediction
2.8. Preliminary Functional Annotation of Protein-Coding Genes
2.9. Gene Orthologs Analysis
3. Results
4. Discussion and Conclusions
Supplementary Materials
Author Contributions
Funding
Acknowledgments
Conflicts of Interest
Ethical Statements
Abbreviations
References
- Kestemont, P.; Dabrowski, K.; Summerfelt, R.C. Biology and Culture of Percid Fishes: Principles and Practices, 1st ed.; Springer: Berlin, Germany, 2015; pp. 3–4. [Google Scholar]
- Müller, T.; Bódis, M.; Urbányi, B.; Bercsényi, M. Comparison of Growth in Pike-Perch (Sander lucioperca) and Hybrids of Pike-Perch (S. lucioperca) x Volga Pike-Perch (S. volgensis). Isr. J. Aquac.-Bamidgeh (IJA) 2011, 63, 545–551. [Google Scholar]
- Kottelat, M.; Freyhof, J. Handbook of European Freshwater Fishess; Kottelat: Munich, Germany, 2007. [Google Scholar]
- Eschbach, E.; Nolte, A.W.; Kohlmann, K.; Kersten, P.; Kail, J.; Arlinghaus, R. Population differentiation of zander (Sander lucioperca) across native and newly colonized ranges suggests increasing admixture in the course of an invasion. Evol. Appl. 2014, 7, 555–568. [Google Scholar] [CrossRef] [PubMed]
- Collette, B.B.; Banarescu, P. Systematics and Zoogeography of the Fishes of the Family Percidae. J. Fish. Res. Board Can. 1997, 34, 1450–1463. [Google Scholar] [CrossRef]
- Vinogradov, A.E. Genome size and GC-percent in vertebrates as determined by flow cytometry: The triangular relationship. Cytometry 1998, 31, 100–109. [Google Scholar] [CrossRef]
- Goldammer, T.; Klinkhardt, M.B. Karyologische Studien an verschiedenen Süßwasserfischen aus brackigen Küstenwässern der südwestlichen Ostsee. V. Der Zander (Stizostedion lucioperca (Linnaeus, 1758). Zool 1992, 3/4, 129–139. [Google Scholar]
- Nagpure, N.S.; Pathak, A.K.; Pati, R.; Rashid, I.; Sharma, J.; Singh, S.P.; Singh, M.; Sarkar, U.K.; Kushwaha, B.; Kumar, R.; et al. Fish Karyome version 2.1: A chromosome database of fishes and other aquatic organisms. Database (Oxford) 2016, 2016. [Google Scholar] [CrossRef] [PubMed]
- Kitano, J.; Peichel, C.L. Turnover of sex chromosomes and speciation in fishes. Environ. Biol. Fish. 2012, 94, 549–558. [Google Scholar] [CrossRef] [PubMed]
- Baekelandt, S.; Redivo, B.; Mandiki, S.N.M.; Bournonville, T.; Houndji, A.; Bernard, B.; El Kertaoui, N.; Schmitz, M.; Fontaine, P.; Gardeur, J.N.; et al. Multifactorial analyses revealed optimal aquaculture modalities improving husbandry fitness without clear effect on stress and immune status of pikeperch Sander lucioperca. Gen. Compac. Endocrinol. 2018, 258, 194–204. [Google Scholar] [CrossRef] [PubMed]
- Németh, S.; Horváth, Z.; Felföldi, Z.B.G. The use of permited ectopar asite disinfection methods on young pike perch (Sander lucioperca) after transition from over win tering lake to RAS. AACL Bioflux. 2013, 6, 1–11. [Google Scholar]
- Swirplies, F.; Wuertz, S.; Baßmann, B.; Orban, A.; Schäfer, N.; Brunner, R.; Hadlich, F.; Goldammer, T.; Rebl, A. Identification of molecular stress indicators in pikeperch Sander lucioperca correlating with rising water temperatures. Aquaculture 2019, 501, 260–271. [Google Scholar] [CrossRef]
- Pereira, L.S.; Agostinho, A.A.; Winemiller, K.O. Revisiting cannibalism in fishes. Rev. Fish Biol. Fish. 2017, 27, 499–513. [Google Scholar] [CrossRef]
- Andrews, S. FastQC: A Quality Control tool for High Throughput Sequencing Data. Online. 2010. Available online: http://www.bioinformatics.babraham.ac.uk/projects/fastqc/ (accessed on 13 September 2019).
- Chen, S.; Zhou, Y.; Chen, Y.; Gu, J. fastp: An ultra-fast all-in-one FASTQ preprocessor. Bioinformatics 2018, 34, i884–i890. [Google Scholar] [CrossRef] [PubMed]
- Marcais, G.; Kingsford, C. A fast, lock-free approach for efficient parallel counting of occurrences of k-mers. Bioinformatics 2011, 27, 764–770. [Google Scholar] [CrossRef] [PubMed] [Green Version]
- Li, R.; Fan, W.; Tian, G.; Zhu, H.; He, L.; Cai, J.; Huang, Q.; Cai, Q.; Li, B.; Bai, Y.; et al. The sequence and de novo assembly of the giant panda genome. Nature 2010, 463, 311–317. [Google Scholar] [CrossRef] [PubMed]
- Hozza, M.; Vinař, T.; Brejová, B. How Big is That Genome? Estimating Genome Size and Coverage from k-mer Abundance Spectra. In String Processing and Information Retrieval (SPIRE); Iliopoulos, C.S., Puglisi, S.J., Yilmaz, E., Eds.; Springer: London, UK, 2015; Volume 9309, pp. 199–209. [Google Scholar]
- Vurture, G.W.; Sedlazeck, F.J.; Nattestad, M.; Underwood, C.J.; Fang, H.; Gurtowski, J.; Schatz, M.C. GenomeScope: Fast reference-free genome profiling from short reads. Bioinformatics 2017, 33, 2202–2204. [Google Scholar] [CrossRef]
- Shin, G.H.; Shin, Y.; Jung, M.; Hong, J.M.; Lee, S.; Subramaniyam, S.; Noh, E.S.; Shin, E.H.; Park, E.H.; Park, J.Y.; et al. First Draft Genome for Red Sea Bream of Family Sparidae. Front. Genet. 2018, 9, 643. [Google Scholar] [CrossRef]
- Kajitani, R.; Toshimoto, K.; Noguchi, H.; Toyoda, A.; Ogura, Y.; Okuno, M.; Yabana, M.; Harada, M.; Nagayasu, E.; Maruyama, H.; et al. Efficient de novo assembly of highly heterozygous genomes from whole-genome shotgun short reads. Gen. Res. 2014, 24, 1384–1395. [Google Scholar] [CrossRef] [Green Version]
- Liu, B.; Shi, Y.; Yuan, J.; Hu, X.; Zhang, H.; Li, N.; Li, Z.; Chen, Y.; Mu, D.; Fan, W. Estimation of genomic characteristics by analyzing k-mer frequency in de novo genome projects. arXiv 2012, arXiv:1308.2012. [Google Scholar]
- Lin, Y.; Yuan, J.; Kolmogorov, M.; Shen, M.W.; Chaisson, M.; Pevzner, P.A. Assembly of long error-prone reads using de Bruijn graphs. Proc. Natl. Acad. Sci. USA 2016, 113, 643. [Google Scholar] [CrossRef]
- Mandric, I.; Zelikovsky, A. ScaffMatch: scaffolding algorithm based on maximum weight matching. Bioinformatics 2015, 31, 2632–2638. [Google Scholar] [CrossRef] [Green Version]
- Xu, G.C.; Xu, T.J.; Zhu, R.; Zhang, Y.; Li, S.Q.; Wang, H.W.; Li, J.T. LR_Gapcloser: A tiling path-based gap closer that uses long reads to complete genome assembly. Gigascience 2019, 8, giy157. [Google Scholar] [CrossRef] [PubMed]
- Simao, F.A.; Waterhouse, R.M.; Ioannidis, P.; Kriventseva, E.V.; Zdobnov, E.M. BUSCO: assessing genome assembly and annotation completeness with single-copy orthologs. Bioinformatics 2015, 31, 3210–3212. [Google Scholar] [CrossRef] [PubMed] [Green Version]
- Li, H.; Durbin, R. Fast and accurate short read alignment with Burrows-Wheeler transform. Bioinformatics 2009, 25, 1754–1760. [Google Scholar] [CrossRef] [PubMed] [Green Version]
- Crescente, J.M.; Zavallo, D.; Helguera, M.; Vanzetti, L.S. MITE Tracker: An accurate approach to identify miniature inverted-repeat transposable elements in large genomes. BMC Bioinform. 2018, 19, 348. [Google Scholar] [CrossRef] [PubMed]
- Chen, N. Using RepeatMasker to identify repetitive elements in genomic sequences. Curr. Protoc. Bioinform. 2004, 25, 4–10. [Google Scholar]
- Aparicio, S.; Chapman, J.; Stupka, E.; Putnam, N.; Chia, J.M.; Dehal, P.; Christoffels, A.; Rash, S.; Hoon, S.; Smit, A.; et al. Whole-genome shotgun assembly and analysis of the genome of Fugu rubripes. Science 2002, 297, 1301–1310. [Google Scholar] [CrossRef] [PubMed]
- Jaillon, O.; Aury, J.M.; Brunet, F.; Petit, J.L.; Stange-Thomann, N.; Mauceli, E.; Bouneau, L.; Fischer, C.; Ozouf-Costaz, C.; Bernot, A.; et al. Genome duplication in the teleost fish Tetraodon nigroviridis reveals the early vertebrate proto-karyotype. Nature 2004, 431, 946–957. [Google Scholar] [CrossRef] [PubMed] [Green Version]
- Xu, J.; Bian, C.; Chen, K.; Liu, G.; Jiang, Y.; Luo, Q.; You, X.; Peng, W.; Li, J.; Huang, Y.; et al. Suppporting data for the draft genome of the Northern snakehead, Channa argus. GigaSci. Database 2017, 6, gix011. [Google Scholar]
- Cunningham, F.; Amode, M.R.; Barrell, D.; Beal, K.; Billis, K.; Brent, S.; Carvalho-Silva, D.; Clapham, P.; Coates, G.; Fitzgerald, S.; et al. Ensembl 2015. Nucl. Acids Res. 2015, 43, D662–D669. [Google Scholar] [CrossRef]
- Ahn, D.H.; Shin, S.C.; Kim, B.M.; Kang, S.; Kim, J.H.; Ahn, I.; Park, J.; Park, H. Draft genome of the Antarctic dragonfish, Parachaenichthys charcoti. Gigasci. Database 2017, 6, gix060. [Google Scholar] [CrossRef]
- Xu, S.; Xiao, S.; Zhu, S.; Zeng, X.; Luo, J.; Liu, J.; Gao, T.; Chen, N. A draft genome assembly of the Chinese sillago (Sillago sinica), the first reference genome for Sillaginidae fishes. Gigasci. Database 2018, 7, giy108. [Google Scholar] [CrossRef] [PubMed]
- Altschul, S.F.; Madden, T.L.; Schaffer, A.A.; Zhang, J.; Zhang, Z.; Miller, W.; Lipman, D.J. Gapped BLAST and PSI-BLAST: A new generation of protein database search programs. Nucl. Acids Res. 1997, 25, 3389–3402. [Google Scholar] [CrossRef] [PubMed]
- Slater, G.S.; Birney, E. Automated generation of heuristics for biological sequence comparison. BMC Bioinform. 2005, 6, 31. [Google Scholar] [CrossRef] [PubMed]
- Stanke, M.; Keller, O.; Gunduz, I.; Hayes, A.; Waack, S.; Morgenstern, B. AUGUSTUS: ab initio prediction of alternative transcripts. Nucl. Acids Res. 2006, 34, W435–W439. [Google Scholar] [CrossRef] [PubMed] [Green Version]
- Burge, C.; Karlin, S. Prediction of complete gene structures in human genomic DNA. J. Mol. Biol. 1997, 268, 78–94. [Google Scholar] [CrossRef] [PubMed] [Green Version]
- Kim, D.; Langmead, B.; Salzberg, S.L. HISAT: A fast spliced aligner with low memory requirements. Nat. Methods 2015, 12, 357–360. [Google Scholar] [CrossRef] [PubMed]
- Trapnell, C.; Roberts, A.; Goff, L.; Pertea, G.; Kim, D.; Kelley, D.R.; Pimentel, H.; Salzberg, S.L.; Rinn, J.L.; Pachter, L. Differential gene and transcript expression analysis of RNA-seq experiments with TopHat and Cufflinks. Nat. Protoc. 2012, 7, 562–578. [Google Scholar] [CrossRef] [PubMed] [Green Version]
- Grabherr, M.G.; Haas, B.J.; Yassour, M.; Levin, J.Z.; Thompson, D.A.; Amit, I.; Adiconis, X.; Fan, L.; Raychowdhury, R.; Zeng, Q.; et al. Full-length transcriptome assembly from RNA-Seq data without a reference genome. Nat. Biotechnol. 2011, 29, 644–652. [Google Scholar] [CrossRef] [PubMed] [Green Version]
- Haas, B.J.; Salzberg, S.L.; Zhu, W.; Pertea, M.; Allen, J.E.; Orvis, J.; White, O.; Buell, C.R.; Wortman, J.R. Automated eukaryotic gene structure annotation using EVidenceModeler and the Program to Assemble Spliced Alignments. Genome Biol. 2008, 9, R7. [Google Scholar] [CrossRef]
- Lowe, T.M.; Chan, P.P. tRNAscan-SE On-line: Integrating search and context for analysis of transfer RNA genes. Nucl. Acids Res. 2016, 44, W54–W57. [Google Scholar] [CrossRef]
- Lagesen, K.; Hallin, P.; Rdland, E.A.; Staerfeldt, H.H.; Rognes, T.; Ussery, D.W. RNAmmer: Consistent and rapid annotation of ribosomal RNA genes. Nucl. Acids Res. 2007, 35, 3100–3108. [Google Scholar] [CrossRef] [PubMed]
- Griffiths-Jones, S.; Grocock, R.J.; van Dongen, S.; Bateman, A.; Enright, A.J. miRBase: MicroRNA sequences, targets and gene nomenclature. Nucl. Acids Res. 2006, 34, D140–D144. [Google Scholar] [CrossRef] [PubMed]
- Friedlander, M.R.; Mackowiak, S.D.; Li, N.; Chen, W.; Rajewsky, N. miRDeep2 accurately identifies known and hundreds of novel microRNA genes in seven animal clades. Nucl. Acids Res. 2012, 40, 37–52. [Google Scholar] [CrossRef] [PubMed]
- Finn, R.D.; Attwood, T.K.; Babbitt, P.C.; Bateman, A.; Bork, P.; Bridge, A.J.; Chang, H.Y.; Dosztanyi, Z.; El-Gebali, S.; Fraser, M.; et al. InterPro in 2017-beyond protein family and domain annotations. Nucl. Acids Res. 2017, 45, D190–D199. [Google Scholar] [CrossRef] [PubMed]
- Jones, P.; Binns, D.; Chang, H.Y.; Fraser, M.; Li, W.; McAnulla, C.; McWilliam, H.; Maslen, J.; Mitchell, A.; Nuka, G.; et al. InterProScan 5: Genome-scale protein function classification. Bioinformatics 2014, 30, 1236–1240. [Google Scholar] [CrossRef]
- Emms, D.M.; Kelly, S. OrthoFinder: Solving fundamental biases in whole genome comparisons dramatically improves orthogroup inference accuracy. Genome Biol. 2015, 16, 157. [Google Scholar] [CrossRef]
- Sneddon, T.P.; Li, P.; Edmunds, S.C. GigaDB: announcing the GigaScience database. Gigascience 2012, 1, 11. [Google Scholar] [CrossRef]
- Katoh, K.; Standley, D.M. MAFFT multiple sequence alignment software version 7: Improvements in performance and usability. Mol. Biol. Evol. 2013, 30, 772–780. [Google Scholar] [CrossRef]
- Price, M.N.; Dehal, P.S.; Arkin, A.P. FastTree: Computing large minimum evolution trees with profiles instead of a distance matrix. Mol. Biol. Evol. 2009, 26, 1641–1650. [Google Scholar] [CrossRef]
- Yang, Z. PAML: A program package for phylogenetic analysis by maximum likelihood. Comput. Appl. Biosci. 1997, 13, 555–556. [Google Scholar] [CrossRef]
- Kumar, S.; Stecher, G.; Suleski, M.; Hedges, S.B. TimeTree: A Resource for Timelines, Timetrees, and Divergence Times. Mol. Biol. Evol. 2017, 34, 1812–1819. [Google Scholar] [CrossRef] [PubMed]
- Bradnam, K.R.; Fass, J.N.; Alexandrov, A.; Baranay, P.; Bechner, M.; Birol, I.; Boisvert, S.; Chapman, J.A.; Chapuis, G.; Chikhi, R.; et al. Assemblathon 2: Evaluating de novo methods of genome assembly in three vertebrate species. Gigascience 2013, 2, 10. [Google Scholar] [CrossRef] [PubMed]
- Fernandez-Silva, I.; Henderson, J.B.; Rocha, L.A.; Simison, W.B. Whole-genome assembly of the coral reef Pearlscale Pygmy Angelfish (Centropyge vrolikii). Sci. Rep. 2018, 8, 1498. [Google Scholar] [CrossRef] [PubMed]
- Ozerov, M.Y.; Ahmad, F.; Gross, R.; Pukk, L.; Kahar, S.; Kisand, V.; Vasemagi, A. Highly Continuous Genome Assembly of Eurasian Perch (Perca fluviatilis) Using Linked-Read Sequencing. G3 (Bethesda) 2018, 8, 3737–3743. [Google Scholar] [CrossRef] [PubMed]
- NCBI Perca flavescens Annotation Release 100. Available online: https://www.ncbi.nlm.nih.gov/genome/annotation_euk/Perca_flavescens/100/ (accessed on 19 July 2019).
- Shao, C.; Li, C.; Wang, N.; Qin, Y.; Xu, W.; Liu, Q.; Zhou, Q.; Zhao, Y.; Li, X.; Liu, S.; et al. Chromosome-level genome assembly of the spotted sea bass, Lateolabrax maculatus. Gigascience 2018, 7, giy114. [Google Scholar] [CrossRef] [PubMed]
- Sanciangco, M.D.; Carpenter, K.E.; Betancur, R.R. Phylogenetic placement of enigmatic percomorph families (Teleostei: Percomorphaceae). Mol. Phylogenet. Evol. 2016, 94, 565–576. [Google Scholar] [CrossRef] [PubMed] [Green Version]
- Polgar, G.; Zane, L.; Babbucci, M.; Barbisan, F.; Patarnello, T.; Ruber, L.; Papetti, C. Phylogeography and demographic history of two widespread Indo-Pacific mudskippers (Gobiidae: Periophthalmus). Mol. Phylogenet. Evol. 2014, 73, 161–176. [Google Scholar] [CrossRef] [PubMed]


| Categories | Actinopterygii | Vertebrata | ||
|---|---|---|---|---|
| #Genes | Percentage | #Genes | Percentage | |
| Complete single-copy | 4413 | 96.27 | 2523 | 97.56 |
| Complete duplicated | 112 | 2.45 | 26 | 1.01 |
| Fragmented | 89 | 1.94 | 40 | 1.54 |
| Missing | 82 | 1.79 | 23 | 0.89 |
| A-ASSEMBLY | |
| Total size (nt) | 900,477,756 |
| No. of contigs | 1966 |
| Contigs N50 (nt) | 2,995,800 |
| Longest contig (nt) | 17,774,792 |
| No. of scaffolds | 1313 |
| Scaffold N50 (nt) | 4,929,547 |
| Longest scaffold (nt) | 19,065,786 |
| Average scaffold (nt) | 685,817 |
| GC-content (%) | 40.91 |
| B-PROTEIN-CODING GENES | |
| Number of coding genes | 21,249 |
| mean gene length (nt) | 10,961 |
| Mean coding sequence (CDS) length (nt) | 1313 |
| Mean intron length (nt) | 1696 |
| Mean exon length (nt) | 196 |
| Average no. of exons per CDS | 6.7 |
| % of genome covered by genes | 25.9 |
| % of genome covered by CDS | 3.1 |
| C-FUNCTIONAL DATABASES | |
| Non-redundant (NR) hits | 18,536 (87.2%) |
| Swissprot hits | 13,783 (64.8%) |
| trEMBL hits | 18,171 (85.5%) |
| Interpro hits | 18,486 (87.0 %) |
| D-NON-CODING RNA PREDICTION | |
| tRNA | 2313 |
| rRNA | 180 |
| miRNA | 166 |
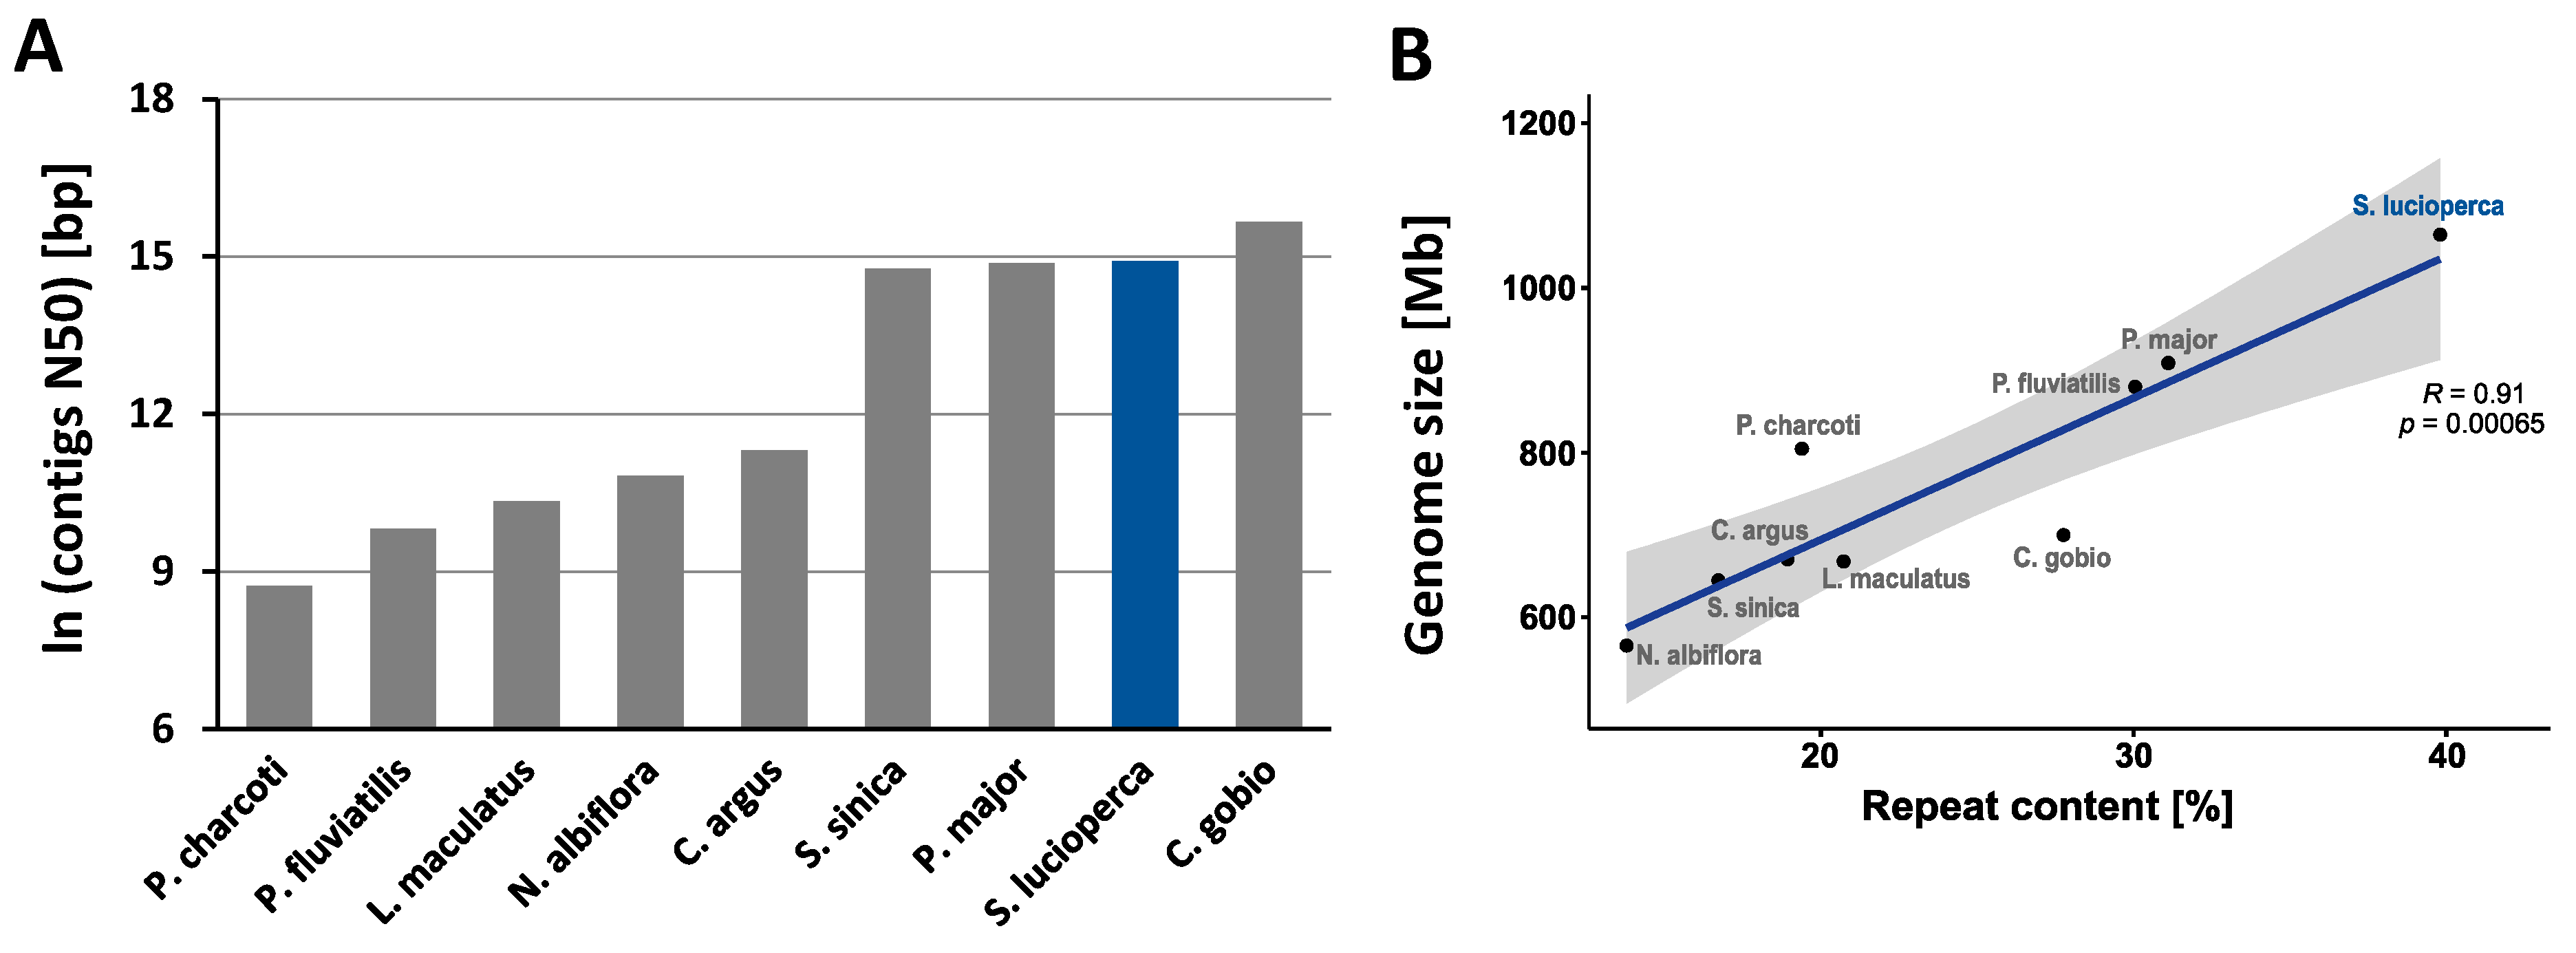
| Estimated Repeat Content (%) | Total Assembly Length (Mb) | Ungapped Length (Mb)/(%) | Number of Contigs | Contigs N50 (Mb) | #Coding Genes | |
|---|---|---|---|---|---|---|
| Yellow perch | 41 | 877.4 | 877.0 (99.9%) | 1097 | 4.2 | 23,749 |
| Pikeperch | 39 | 900.5 | 899.8 (99.9%) | 1966 | 3.0 | 21,249 |
| Eurasian perch | 33 | 958.2 | 851.6 (88.9%) | 100,821 | 0.0182 | 23,397 |
© 2019 by the authors. Licensee MDPI, Basel, Switzerland. This article is an open access article distributed under the terms and conditions of the Creative Commons Attribution (CC BY) license (http://creativecommons.org/licenses/by/4.0/).
Share and Cite
Nguinkal, J.A.; Brunner, R.M.; Verleih, M.; Rebl, A.; Ríos-Pérez, L.d.l.; Schäfer, N.; Hadlich, F.; Stüeken, M.; Wittenburg, D.; Goldammer, T. The First Highly Contiguous Genome Assembly of Pikeperch (Sander lucioperca), an Emerging Aquaculture Species in Europe. Genes 2019, 10, 708. https://doi.org/10.3390/genes10090708
Nguinkal JA, Brunner RM, Verleih M, Rebl A, Ríos-Pérez Ldl, Schäfer N, Hadlich F, Stüeken M, Wittenburg D, Goldammer T. The First Highly Contiguous Genome Assembly of Pikeperch (Sander lucioperca), an Emerging Aquaculture Species in Europe. Genes. 2019; 10(9):708. https://doi.org/10.3390/genes10090708
Chicago/Turabian StyleNguinkal, Julien Alban, Ronald Marco Brunner, Marieke Verleih, Alexander Rebl, Lidia de los Ríos-Pérez, Nadine Schäfer, Frieder Hadlich, Marcus Stüeken, Dörte Wittenburg, and Tom Goldammer. 2019. "The First Highly Contiguous Genome Assembly of Pikeperch (Sander lucioperca), an Emerging Aquaculture Species in Europe" Genes 10, no. 9: 708. https://doi.org/10.3390/genes10090708