
Measuring the Anisotropy in Interfacial Tension of Nematic Liquid Crystals


Experimental Soft Matter Physics Group, University of Luxembourg, L-1511 Luxembourg, Luxembourg
*
Authors to whom correspondence should be addressed.
†
Current address: Laboratory of Physical Chemistry and Soft Matter, Wageningen University and Research, 6708 WE Wageningen, The Netherlands.
Crystals 2021, 11(6), 687; https://doi.org/10.3390/cryst11060687
Submission received: 21 May 2021
/
Revised: 8 June 2021
/
Accepted: 11 June 2021
/
Published: 15 June 2021
(This article belongs to the Special Issue Optical and Molecular Aspects of Liquid Crystals)
Abstract
:Liquid crystal (LC) phases typically show anisotropic alignment-dependent properties, such as viscosity and dielectric permittivity, so it stands to reason that LCs also have anisotropic interfacial tensions. Measuring the interfacial tension of an LC with conventional methods, such as pendant drops, can be challenging, however, especially when we need to know for different LC aligning conditions, as is the case when we seek , the interfacial tension anisotropy. Here, we present measurements of of the common synthetic nematic LC compound 5CB against water using a microfluidic droplet aspiration technique. To ensure tangential and normal alignment, respectively, we add poly(vinyl alcohol) (PVA) and sodium dodecylsulfate (SDS), respectively, as a stabilizer and measure for different concentrations of stabilizer. By fitting the Szyszkowski equation to the data, we can extrapolate to zero-stabilizer concentration, obtaining the of 5CB to pure water for each alignment. For normal alignment, we find mN·m−1, on the order of 1 mN·m−1 greater than mN·m for tangential alignment. This resonates with the empirical knowledge that 5CB aligns tangentially to an interface with pure water. The main uncertainty arises from the use of polymeric PVA as tangential-promoting stabilizer. Future improvements in accuracy may be expected if PVA can be replaced by a low molar mass stabilizer that ensures tangential alignment.
Keywords:
liquid crystal; interfacial tension; surface tension; alignment; anisotropy; PVA; SDS; microfluidics1. Introduction
The interfacial tension between immiscible fluids is a material property with implications on a variety of fields, ranging from fundamental biophysics (such as respiration and locomotion) to applications in jetting dynamics. Many techniques exist to measure , ranging from plate [1,2] and ring methods [3] to pendant drops [4,5,6,7,8,9] and further to droplet [10] and bubble deformation techniques [11,12]. However, when it comes to long-range ordered liquids, liquid crystals (LCs), many of these techniques show significant shortcomings. Most of these issues are material-related, as the methods require data on other material parameters for calculating : the room temperature densities of common LCs can be extremely close to that of water [1,4,9,13], and any uncertainties in these values will propagate into uncertainty in the measurements [4]. Other techniques rely on other external properties, such as viscosity [10], which can show strong orientation dependence; others work only for specific LC phases [11,12]; and yet others, in particular rings and plates, require large amounts of material for baths and to ensure adequate contact with the apparatus, which is not appropriate when working with small quantities of precious liquids.
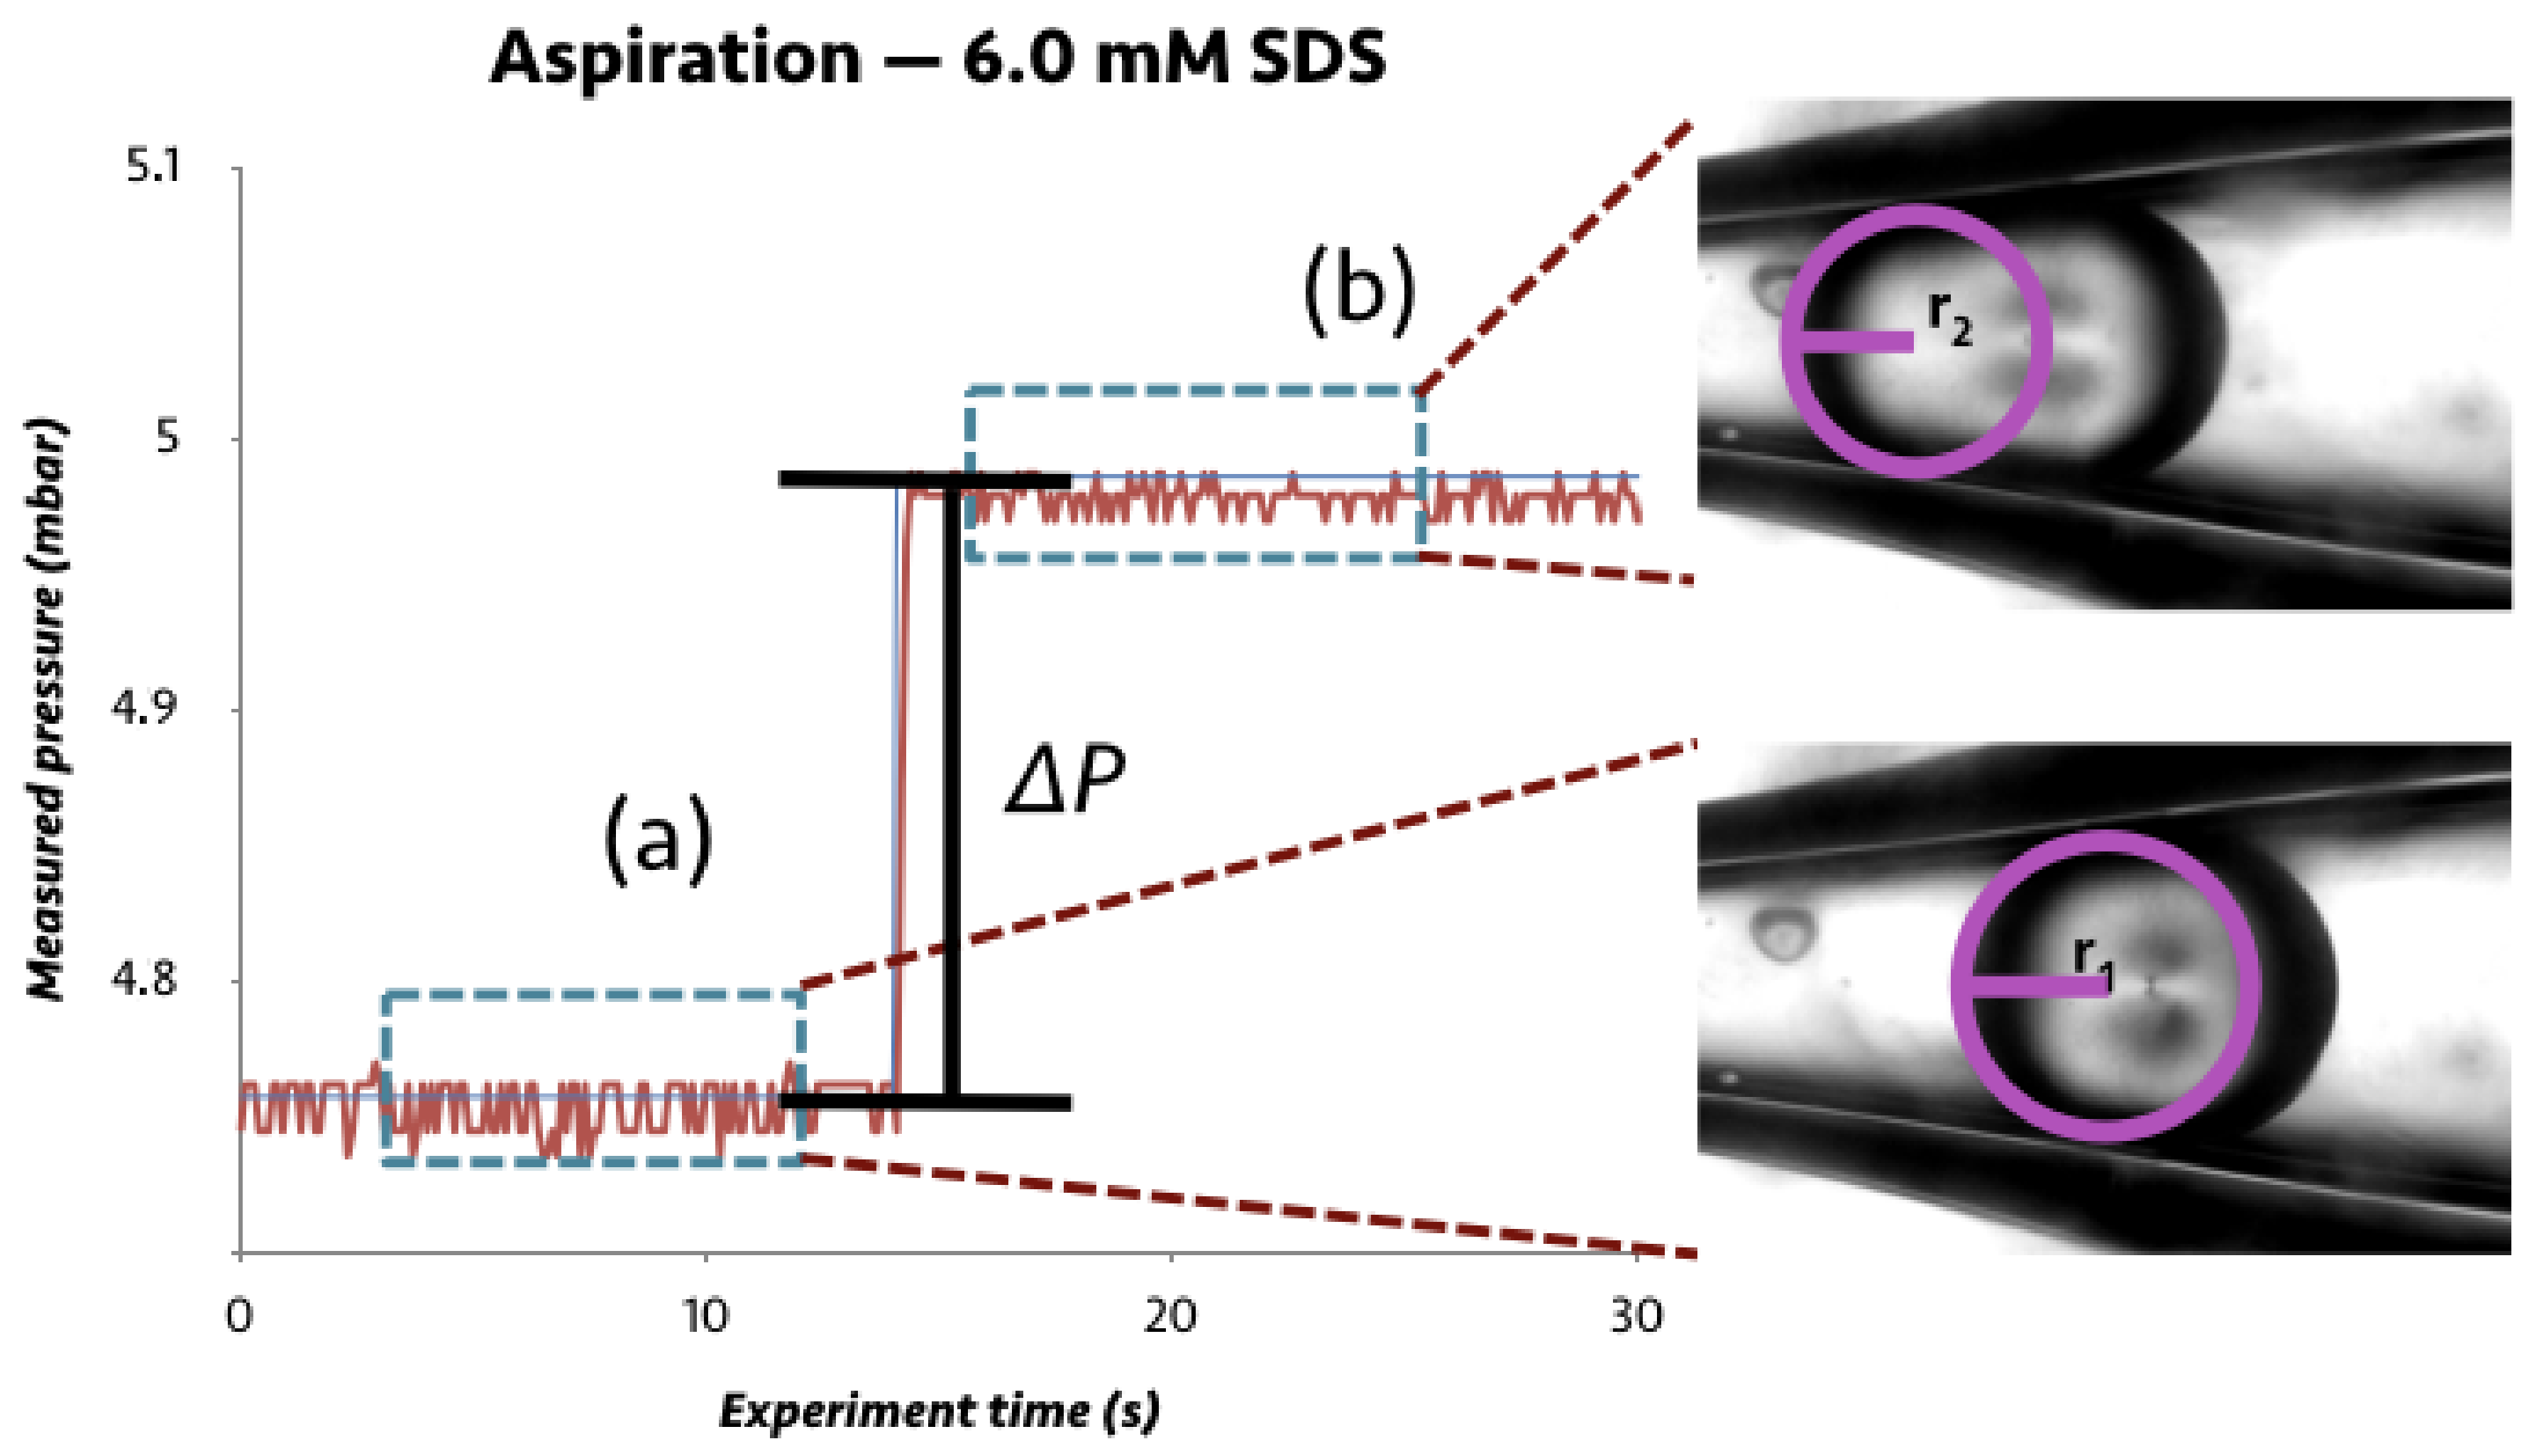
An option for measuring interfacial tension is using LC droplets, which have shown themselves to be robust and versatile for manipulation in a variety of settings [14,15,16,17]. Based on the principle of micropipette aspiration [18,19,20], originally used for measuring the cortical tensions of lipid membranes, we developed an interfacial tensiometry technique using glass capillary-based microfluidic devices, obtaining solely from direct experimental observations of droplet deformation in a channel and measurement of the pressure difference () required to induce the deformation [21]. The remarkable part of this technique is that no material parameter values are needed to establish : all that is needed is and an initial and final radius of curvature of the droplet ( and , respectively). These values are then related to through the following equation:
A schematic of the operation of this technique is shown in Figure 1.
This technique was found to be robust and applicable to a wide range of fluids with interfacial tensions on the order of as little as 0.1 mN·m [21]. A stretch goal, however, was to probe , and in particular its anisotropy , of LCs, measurements which have proven difficult to perform with classic techniques [4,8,9]. Being anisotropic liquids with alignment-dependent properties [22,23,24], LCs should show an alignment-dependent interfacial tension. To be clear, the meaning of the LC being aligned in a certain way with respect to its boundary is that the director, indicating the preferred direction of molecular orientation in the LC, aligns in this way at the interface, the two extreme cases being tangential and normal alignments. Intermediate situations, referred to as tilted alignment, are also possible. Initial work by Gannon et al. showed that there could be a difference between of normal and of tangential alignment [1], but measuring this directly is not straightforward. Indeed, most studies measuring of LCs have not looked at the effects of different aligning conditions [4,8,9]. Field alignment through a Frederiks transition is a way to achieve a uniform alignment [25,26], but this is not appropriate for use with droplets and for large samples.
To achieve the desired alignment, however, we can instead make use of the sensitivity of LC alignment to its surrounding environment. This is, of course, fundamentally an effect of the non-zero for each medium in contact with the LC. Pure water promotes tangential alignment, while the presence of a surfactant favors normal alignment; however, the surfactant inherently decreases [8], reflecting the fact that an aqueous surfactant solution is a quite different medium from pure water. In practice, experiments with pure water are notoriously difficult due to wetting issues and poor droplet stability, hence stabilizers are added regardless of which alignment is desired. To ensure a stable interface with water with tangential alignment, the standard choice is to add a water-soluble polymer, such as polyvinylalcohol (PVA) [27,28]. As with the case of surfactant addition, the introduction of PVA changes the medium from pure water. While PVA is often not thought of as a surfactant, solutions of polymers such as PVA have been shown to have some degree of surface activity [2,29], hence we cannot simply assume that the value of of an LC in contact with aqueous PVA solution is identical to that of an interface with pure water, although the alignment is the same.
Since the use of a surfactant or polymer is necessary to stabilize a droplet for measurement, and such a material can have considerable surface effects, we need to account for this in the measurements. For aqueous surfactant solutions with concentration c below the critical micelle concentration, the interfacial tension as a function of concentration, , is described by the Szyszkowski equation (sometimes called the Langmuir-Szyszkowski equation) [30,31,32]:
where is the interfacial tension without surfactant, J · K · mol the ideal gas constant, T the temperature, the monolayer surface coverage capacity, and a rate constant determined by the chemical potentials of the solute ( in bulk and at the interface). For a given system of solute and medium at the other side of the interface, at a constant temperature, we can assume T, , and to be constant [30], thus enabling us to fit Equation (2) to experimental data using c as the independent variable and , and as fitting parameters. The beauty of this approach is that we can obtain of an LC in contact with any medium with which we can conduct experimental measurements of , the medium with determining the LC alignment. This means that, although our experiments are done with stabilizers, we are effectively extrapolating the results to obtain at an interface with pure water, yet with the alignment promoted by the stabilizer used in each experiment.
In this work, we use this method to determine the interfacial tension to pure water of the common synthetic liquid crystal 4-cyano-4′-pentylbiphenyl (5CB), for both tangential and normal alignment, the latter impossible to achieve in a direct experiment. This allows us to, for the first time, we believe, establish the interfacial tension anisotropy for 5CB in contact with pure water. We further compare the data to pendant drop measurements, concluding that pendant drops are not suitable for measuring the interfacial tension of 5CB due to the density uncertainty and lack of aspherical shape, underlining the advantage of the pipette aspiration technique.
2. Materials and Methods
2.1. Materials
The liquid crystal 4-cyano-4′-pentylbiphenyl (5CB, 99+%) was sourced from Xinhua Yantai Corporation. The surfactant SDS (sodium dodecyl sulfate, 95%+), the surface treatment agent DMOAP (dimethyloctadecyl[3-(trimethoxysilyl)propyl]ammonium chloride, 42% in methanol), and PVA ( 13–23 Mg·mol, 87–89% hydrolyzed) were sourced from Sigma Aldrich. All chemicals were used as supplied without further purification.
Microfluidic devices were prepared using 1.05 mm borosilicate glass square capillaries sourced from the University of Pennsylvania; 1.0 mm outer diameter/0.7 mm inner diameter borosilicate glass cylindrical capillaries obtained from WPI; 21-gauge cannulas from Braun; Pattex two-component Super Mix Metal epoxy; and Norland NOA61 Optical Adhesive. The borosilicate glass capillaries were cut to lengths suitable to contain the constricted capillaries created from the cylindrical capillaries.
2.2. Solution Preparation
Aqueous solutions of 0.010 mM, 0.10 mM, 1.0 mM, 2.0 mM, 3.0 mM, and 6.0 mM SDS and of 1.0%, 2.5%, 5.0%, 7.5%, and 10.0% w/w PVA were prepared from ultrapure deionized water (Sartorius Arium or Millipore, resistivity 18.2 Mcm) and the mass of the powder to achieve the desired concentrations. Solutions of PVA were prepared by adding the PVA powder to hot water and left to stir at at least 75 °C overnight or longer until a clear, homogeneous solution was obtained, while solutions of SDS could be prepared in a volumetric flask before transferring to a vial for stirring at room temperature to obtain a clear, optically homogeneous solution. All solutions were, once prepared, stored at room temperature and used within a week of preparation.
2.3. Microfluidic Droplet Aspiration
2.3.1. Device Assembly and Experimental Set-Up
The assembly of microfluidic devices followed procedures previously detailed for the assembly of tensiometry devices [21,33], in turn based on techniques used for droplet and shell production [27,28]. In brief, cylindrical capillaries were pulled using a Sutter P-100 pipette puller to create a constriction of inner diameter 100–200 μm, using a heating setting to soften the glass and gently pull it without breaking. Other cylindrical capillaries for injection and production of droplets were pulled using normal settings and cut using a Narishige microforge to have an orifice diameter of 50–80 μm. The constricted and cut cylindrical capillaries and the square capillaries were then treated by soaking in a dilute aqueous solution of DMOAP (1–2% v/v DMOAP) for at least 15 min, changing the solution at least once, before rinsing in ultrapure water and curing in an oven under vacuum at 120 °C for at least 30 min. The silanized capillaries were then cooled to room temperature before device assembly.
Using a length of square capillary sufficient to encase the constriction in the collection capillary entirely within the square capillary, the injection and collection capillaries were positioned within the square capillary to be coaxially nested before sealing with both UV-reactive epoxy and normal epoxy to prevent leakage. Devices were allowed to dry overnight before use to ensure the glues had fully solidified.
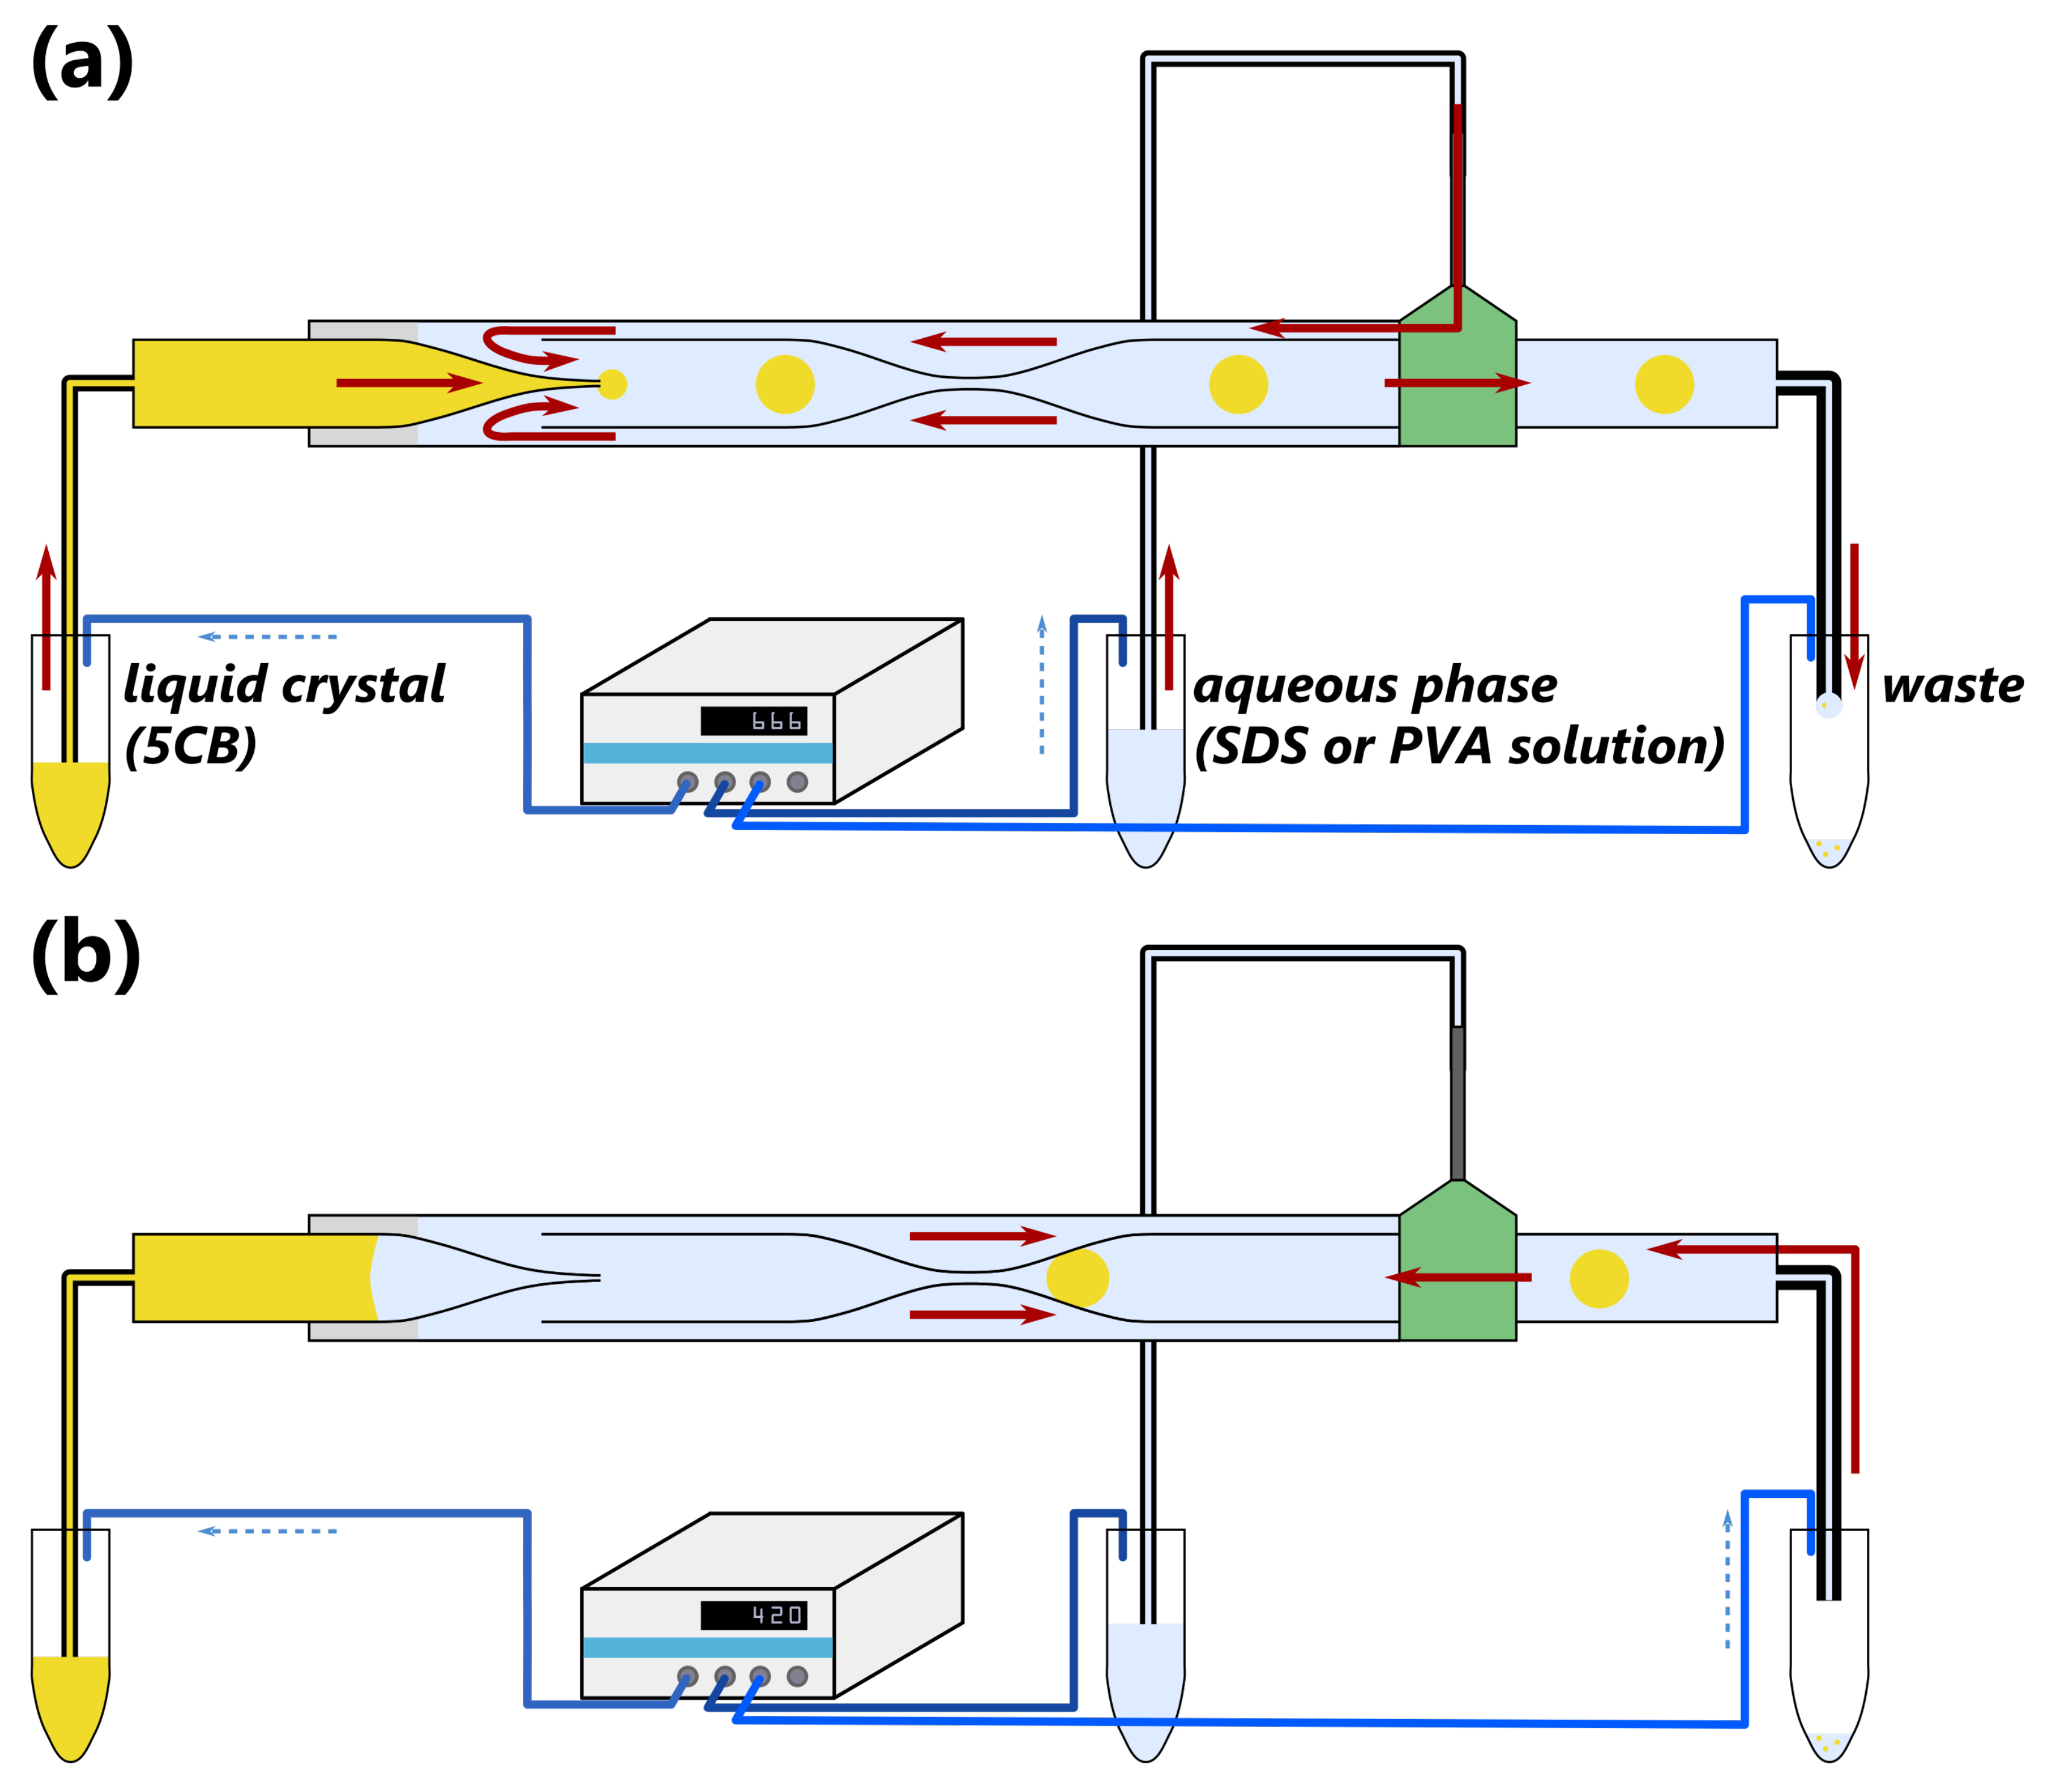
Once assembled, the devices were connected through thin, flexible polyethylene tubing to vials equipped with septa. Pressures were applied and regulated with a Fluigent MFCS system equipped with channels to supply 25 mbar pressure with 0.01 mbar steps (for the aspiration stages) and 1034 mbar pressure with resolution of ±0.31 mbar steps (for droplet production). A schematic of the fully assembled device both in droplet production and measurement modes is presented in Figure 2.
2.3.2. Experimental Procedure
The device was flushed first with alternating rinses of ultrapure water and ethanol to both clean the device and check for leaks. We then began flowing the outer bath phase through the channel to prime the device. Once filled with the outer bath phase, the LC was flowed through the inner channel to create droplets of various sizes, the target droplet size being with a diameter on the order of 300–400 μm. Once a suitable droplet was obtained, it would be stopped in the channel and pushed gently back towards the constriction, adjusting both the supplied pressure from the pressure pump unit and the hydrostatic pressure from the vials to push the droplet to the beginning of the constriction, causing either no deformation or a minimal deformation to hold the droplet in place. This process was continuously imaged using an IDT camera operated by MotionStudio 64 software, with the entire set-up mounted on a Nikon Eclipse inverted microscope.
Still frames from the aspiration process, with one image taken before and the other image taken after the application of an aspiration pressure (), were analyzed in a graphics software by measuring the radius of curvature of the leading edge of the droplet (facing the constriction of the channel) at the center of the channel: measurement at the center of the channel is essential to avoid distortions that result from the curvature of the cylindrical capillary [34]. The radii of curvature from the before and after images ( and , respectively), along with the aspiration pressure, are the quantities that are then used in Equation (1) to obtain the interfacial tension.
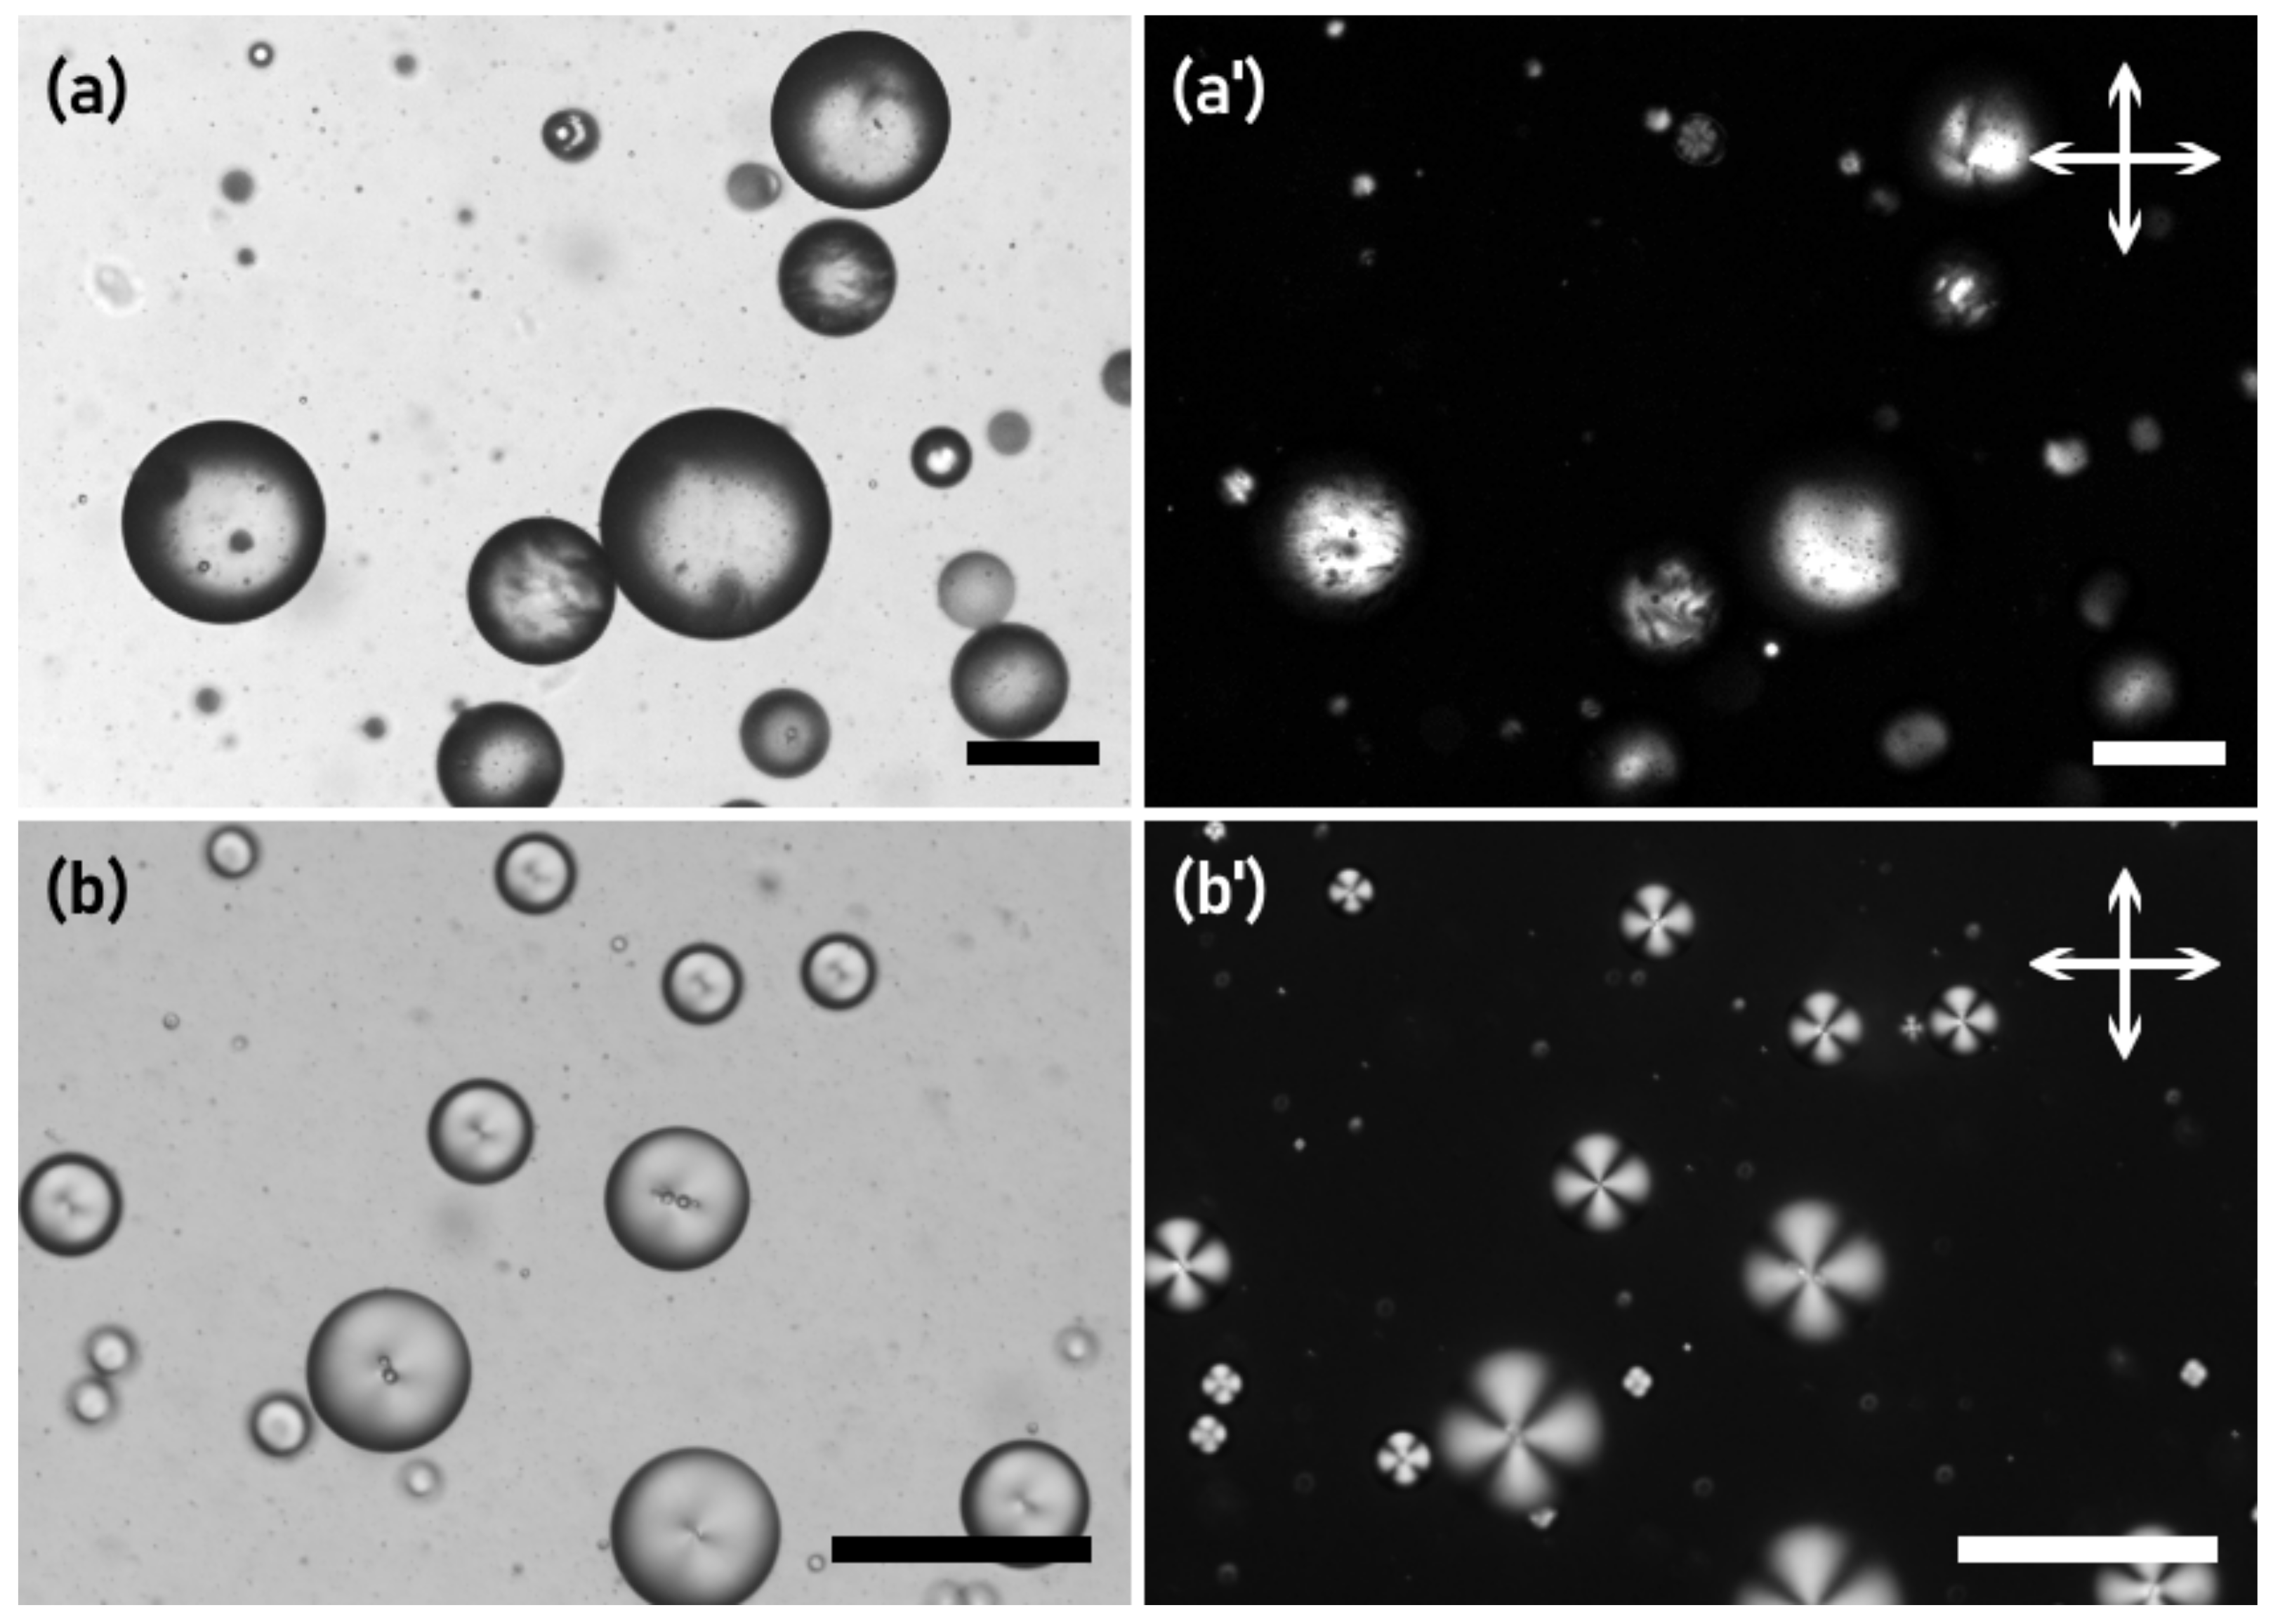
Verification of the alignment of the LC droplets is best performed between crossed polarizers, but viewing droplets in this configuration makes measuring the radii of curvature challenging since the edges of the droplet need to be clearly seen. As shown in Figure 3, however, normal or tangential alignment of the LC droplet can still be verified without crossed polarizers.
2.4. Pendant Drops
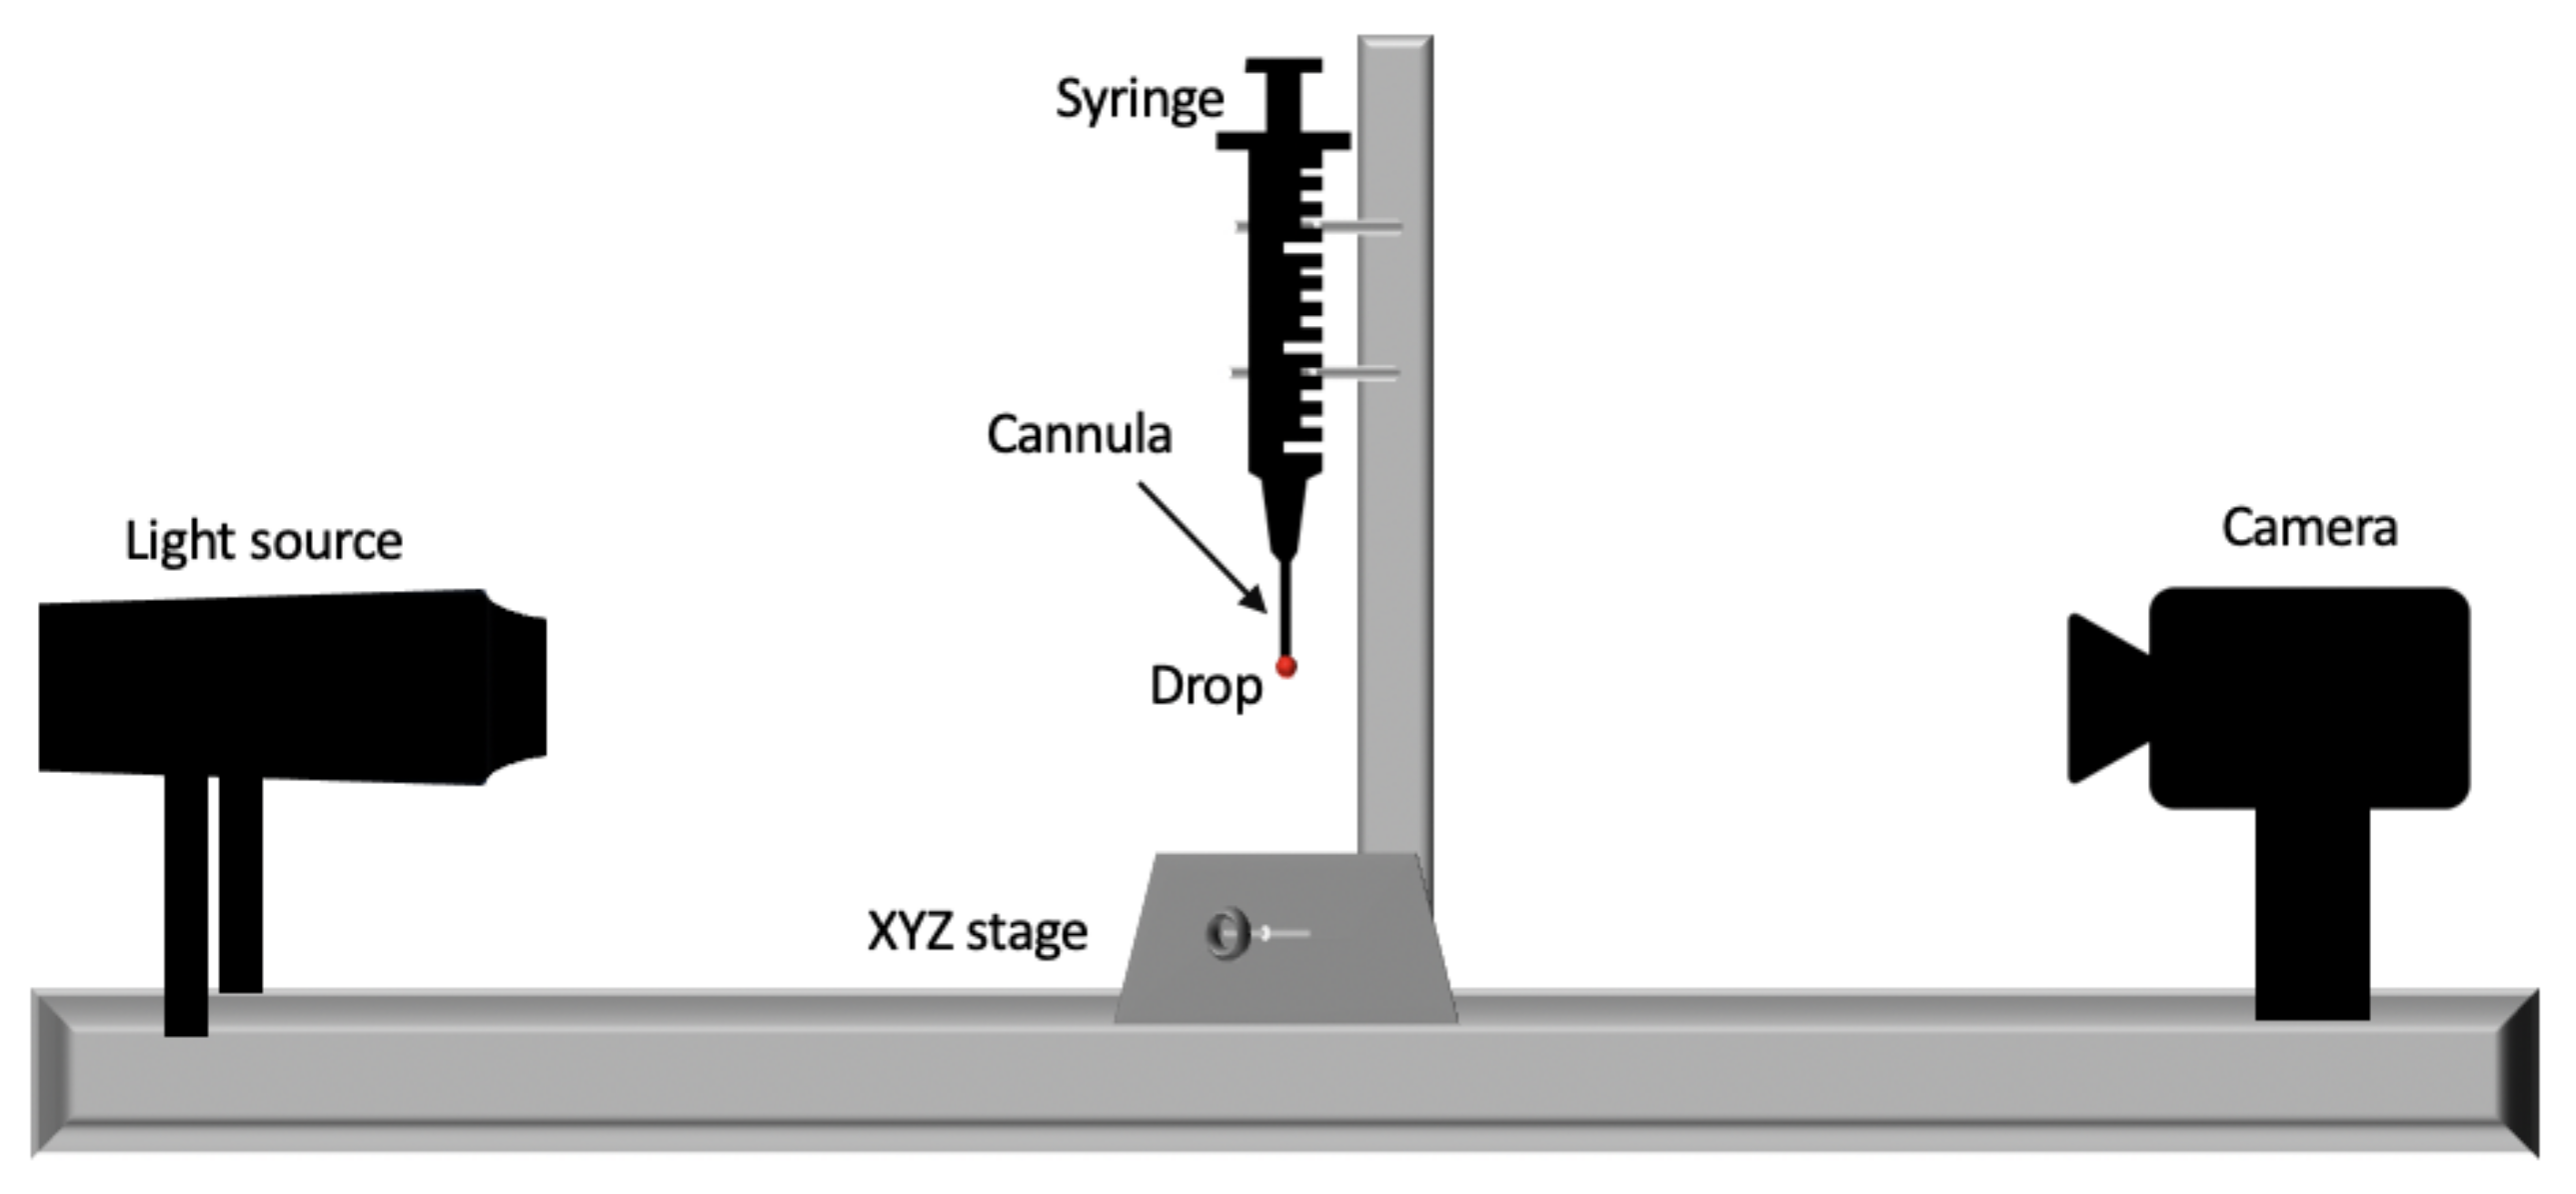
Measurements of using the pendant drop method were performed for 5CB both in air and in aqueous phases, using a “SURFTENS universal” set-up from OEG Gmbh. The set-up is equipped with a base plate, an sample stage, a manual dosing system, a USB camera with 6.5× zoom lens, and a white LED, and is controlled by the software “SURFTENS PD”. A schematic of the experimental set-up is shown in Figure 4. After the calibration, we need to provide the density of the LC and of the surrounding medium. To measure the surface tension (air is the external medium) of 5CB, we filled 500 μL into a glass syringe connected to a cannula (blunt end needle) with an inner diameter of 0.20 mm. Because of the pressure generated in the syringe while filling the LC, it came out of the cannula in a droplet shape. Once the droplet was stable without any oscillations, we began to measure using the “measuring window” option in the software.
For measurements of interfacial tension (using an aqueous phase as the external medium), we filled a glass cuvette with the appropriate surrounding liquid and inserted the cannula into this cuvette. We pressed the syringe manually to create a drop and measured using the same software options. In this case, however, we updated the density of the surrounding medium from that of air to that of the liquid. All the surface and interfacial measurements were performed at 20 °C, and the liquid and 5CB densities were measured using an Anton Paar DMA 5000 M densitometer. The measured density values for 5CB and 5% w/w PVA solution were 1.025796 g·cm and 1.010091 g·cm, respectively. We took around 20 measurements of the surface tension or interfacial tension.
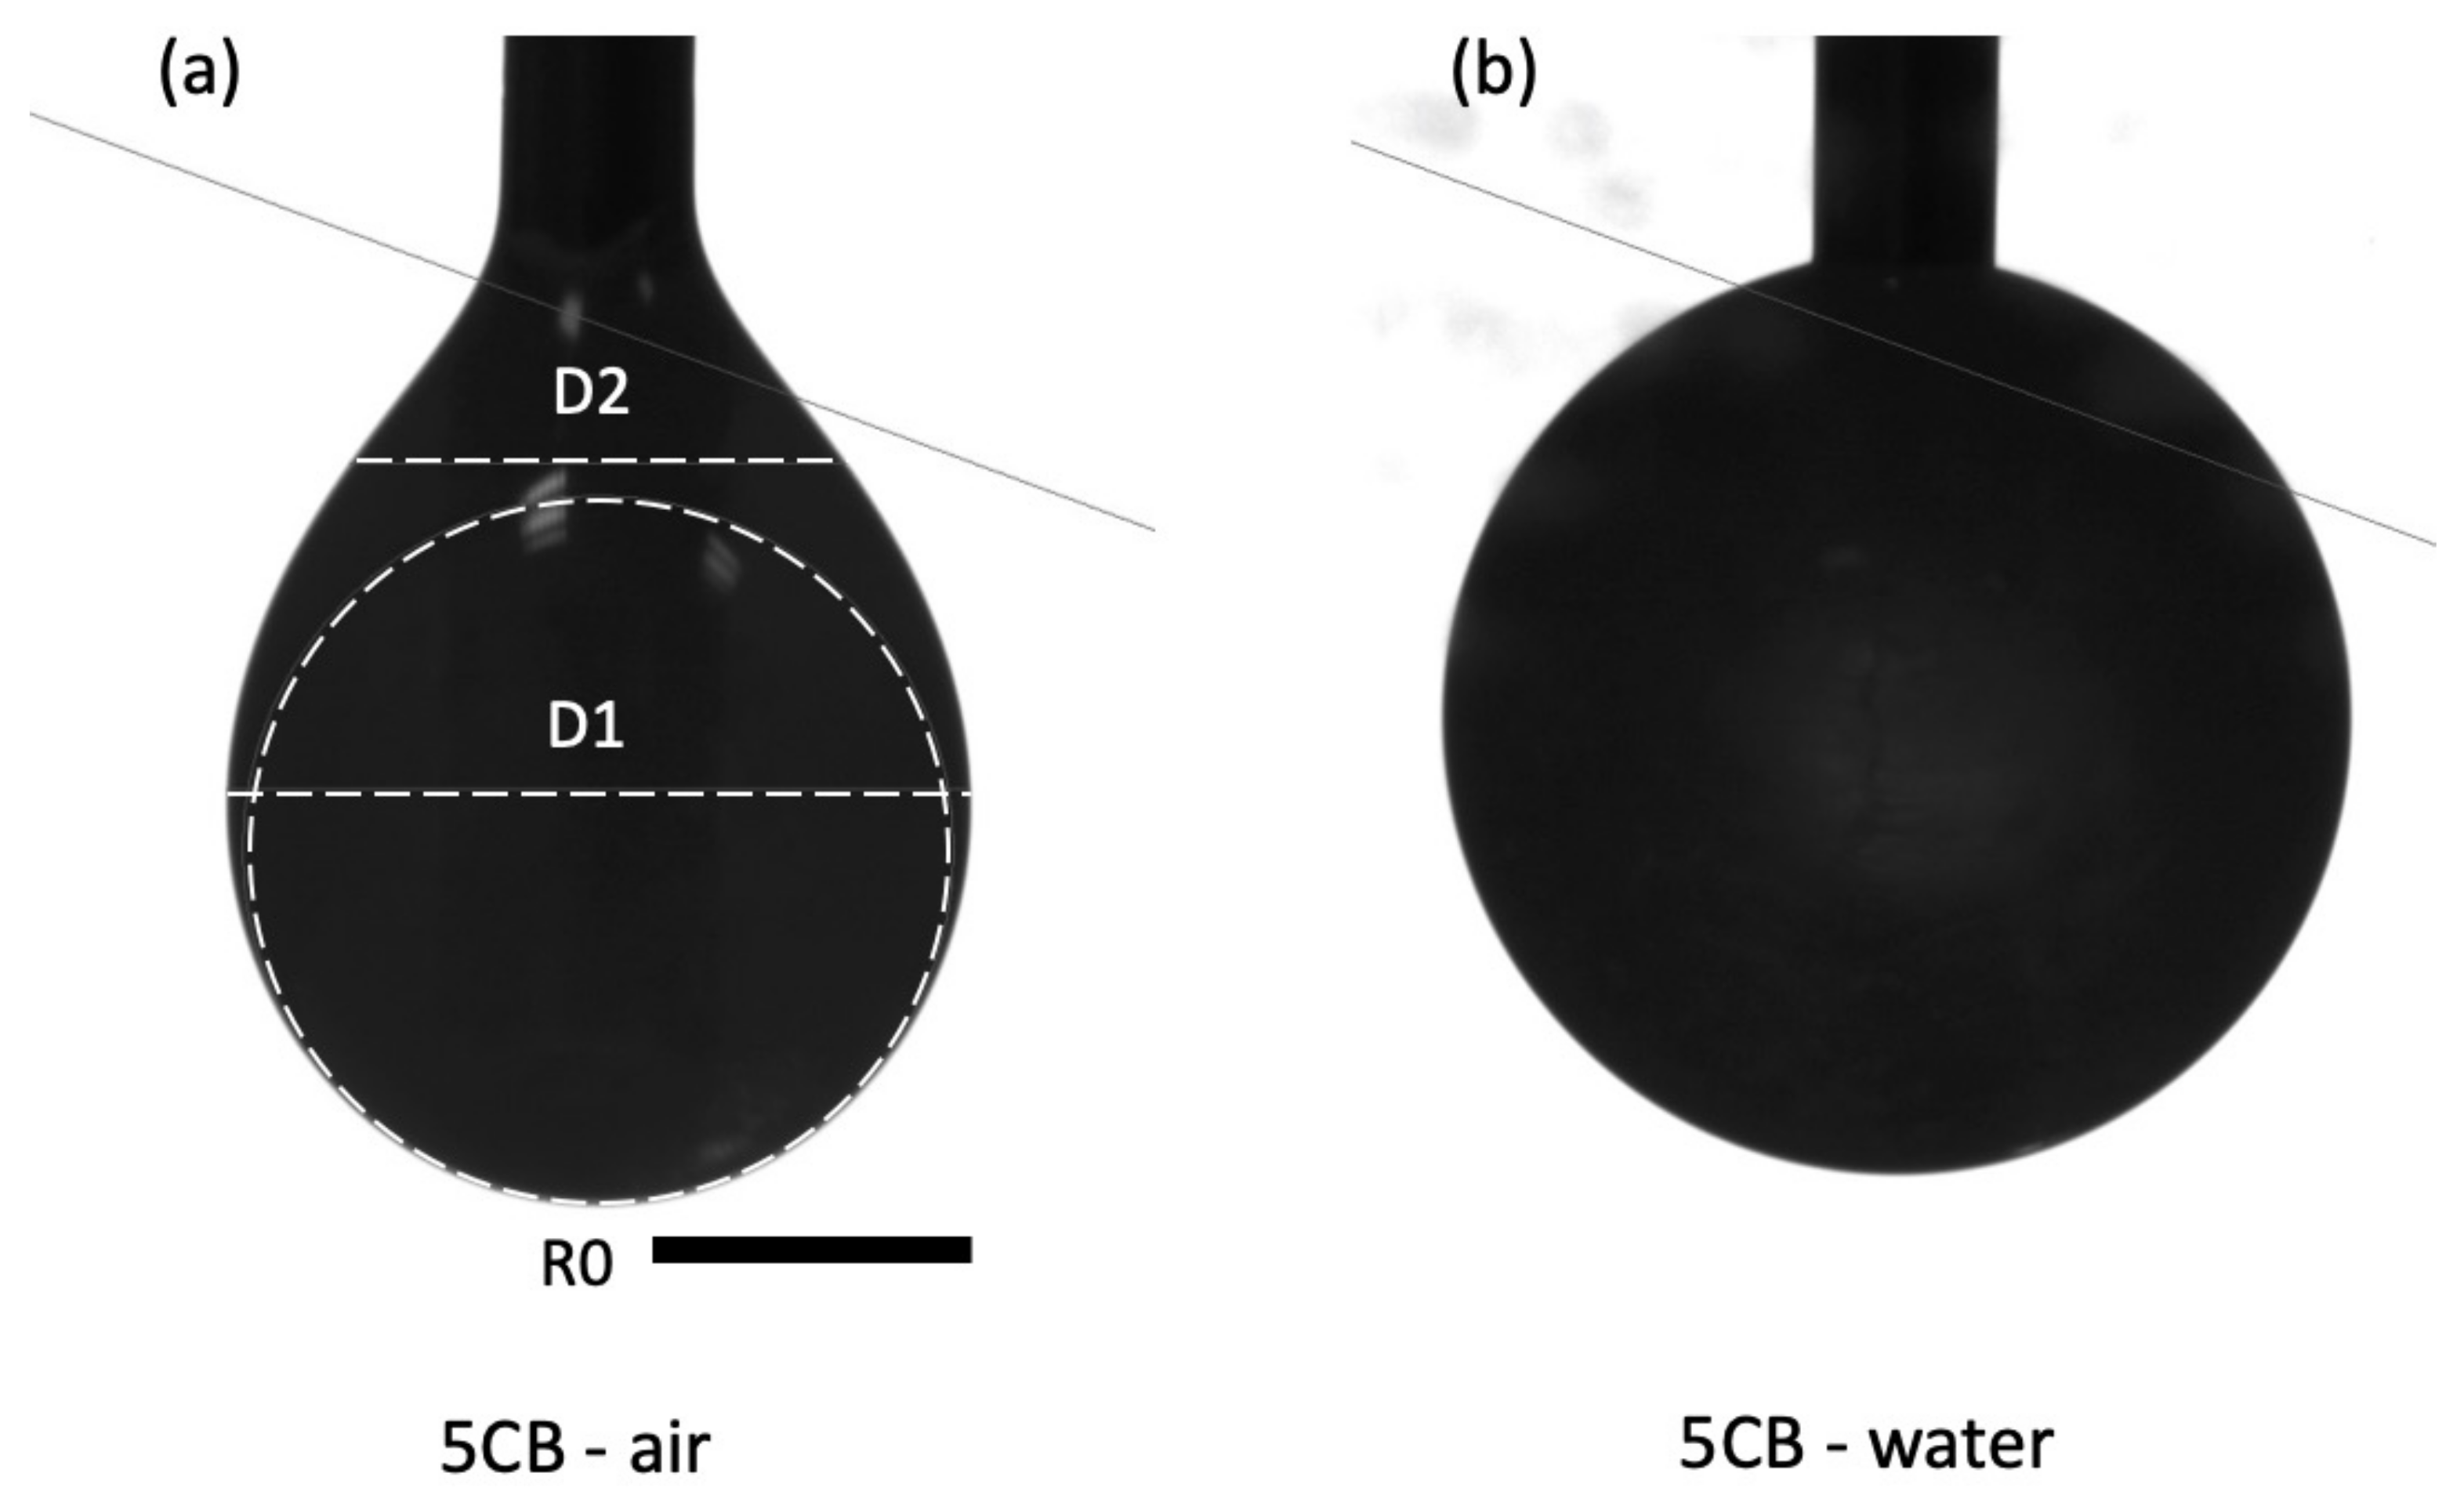
The calculation of the surface/interfacial tension is given by
where is the surface/interfacial tension in mN·m, is the gravitational acceleration (assumed to be 9.81 m·s), is the density difference in g·cm, R is the radius of curvature, and is a dimensionless form factor that contains the diameter ratio , where and are the diameters defined in Figure 5.
3. Results
3.1. Microfluidic Droplet Aspiration
3.1.1. Normal Anchoring with Surfactant
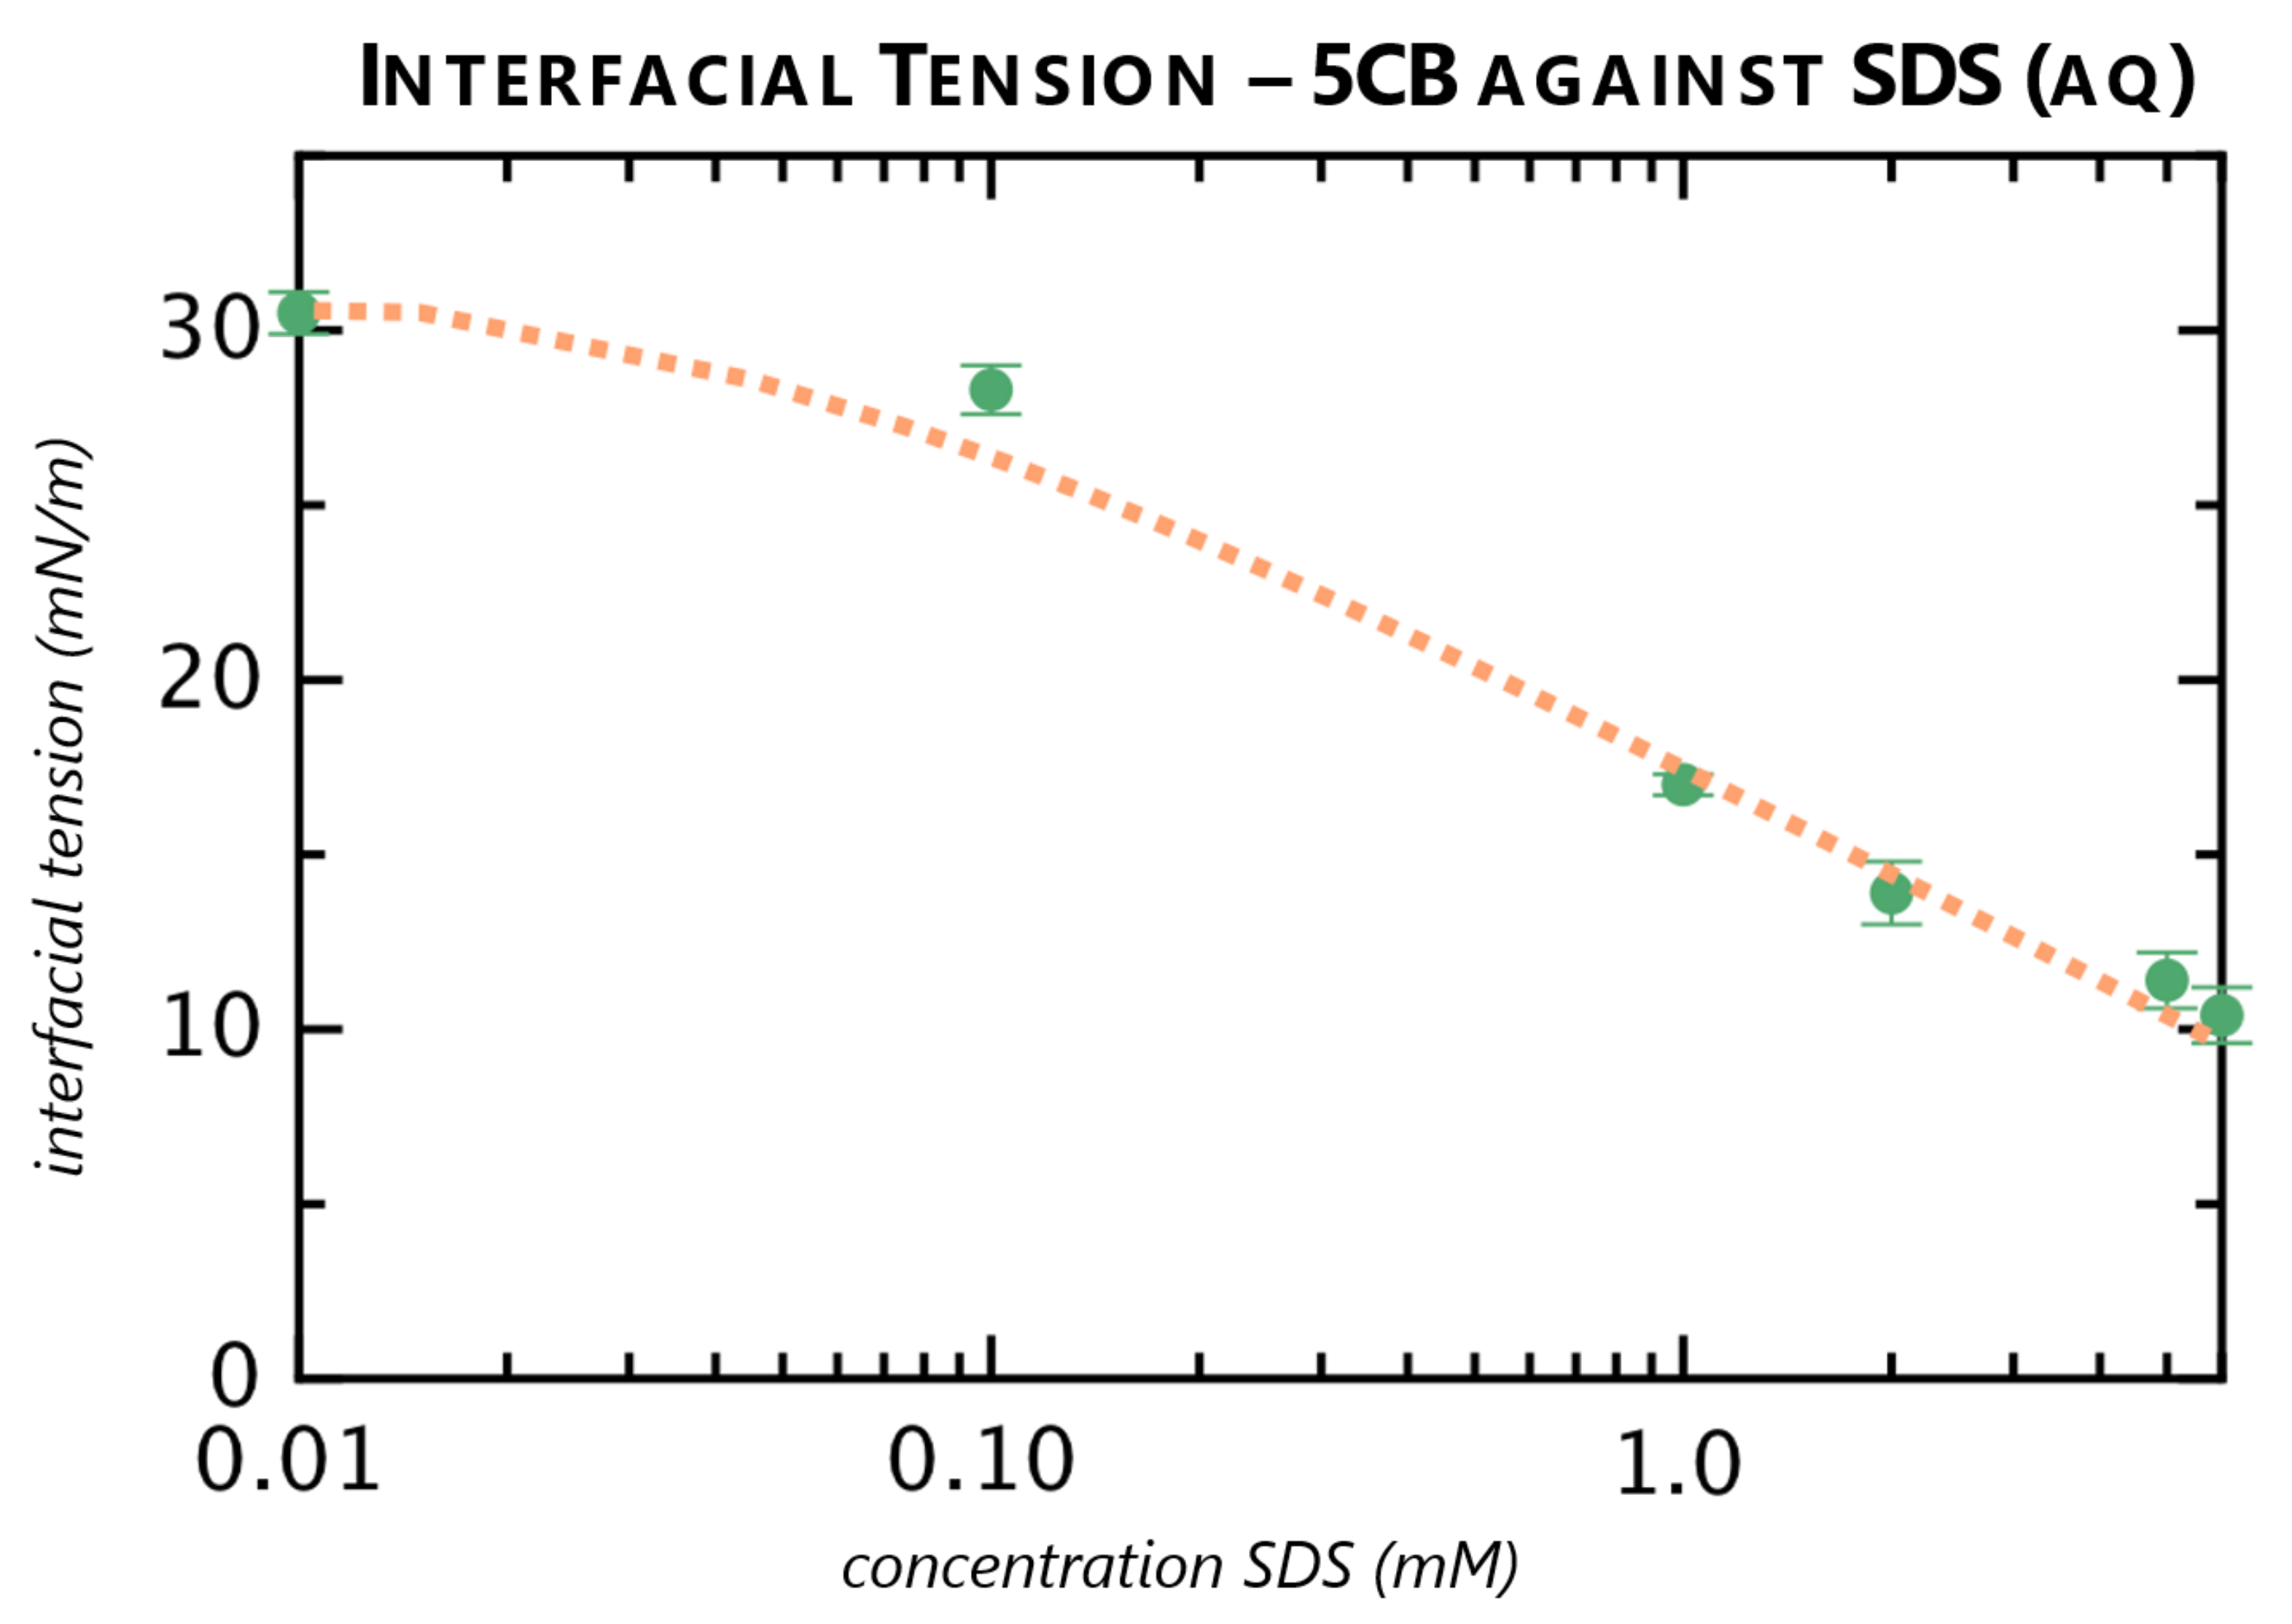
The interfacial tension of 5CB in the nematic phase was measured against aqueous solutions of sodium dodecyl sulfate (SDS), a surfactant used to achieve normal alignment, of varying concentrations. The data from these measurements are presented in Table 1. To determine the zero-surfactant interfacial tension in the normal case, because a surfactant is needed for normal anchoring, we fitted the data from Table 1 by using Equation (2) down to zero surfactant concentration, as shown in Figure 6.
By fitting Equation (2) to the data, using a temperature of 20 °C, we obtained the numerical values of the fitting parameters in Equation (1) as . Taking the standard deviation obtained from fitting, we can thus give the value of the interfacial tension of 5CB with normal alignment to water as = 31.9 ± 0.8 mN m. The two other fitting parameters were found to be m and .
3.1.2. Tangential Anchoring with and without Polymer Stabilizer
As previously described, pure water alone is sufficient to give tangential alignment of 5CB, but the droplets of 5CB in pure water very readily wet the glass walls of the tensiometry device, both with and without silanization treatment. This property makes data collection challenging and sometimes impossible if a meniscus shape is unobtainable. We previously were able to directly measure the interfacial tension of 5CB against water, obtaining a value of 30.8 ± 7.5 mN·m [21], a value in good agreement with existing data notwithstanding the issues in collecting the measurement [35].
To overcome the issues of limited droplet stability, we further collected measurements of 5CB against aqueous solutions of low-weight, low-hydrolysis PVA at concentrations between 1.0% w/w and 10.0% w/w: while lower hydrolysis PVA can have a stronger surface activity compared to PVA with higher hydrolysis content [2,29], the higher degree of surface activity results in more stable droplets, which facilitates the measurement process. Even if small droplets were not readily obtainable, the presence of PVA appeared to reduce the effects of wetting, allowing us to obtain a meniscus that readily responded to pressure and with which we could measure a change in the radii of curvature due to aspiration. Since PVA is traditionally not considered a surfactant, we were interested in seeing to what extent, if any, the interfacial tension became affected by the addition of PVA. The results obtained are presented in Table 2.
By fitting Equation (2) to these data, we obtain a fitted curve as shown in Figure 7. The fitting produce gives us the interfacial tension for the tangential anchoring case as = 30.8 ± 4.8 mN·m. The other two fitting parameters came out as ± 12.4 and ± 91. The high uncertainties in the fitted parameters suggest that the Szyszkowski equation may not be the appropriate fitting equation to describe the activity of PVA at the interface, but the procedure nevertheless gives a value of in concordance with our direct observation [21].
3.2. Pendant Drop Measurements
At an interface to air, 5CB aligns normally, thus the surface tension obtained by pendant drop experiments with 5CB in air was is 29.0 ± 1.6 mN·m by using a density value for 5CB of 1.021 g·cm. In comparison to literature values [36], this number is close, though the discrepancy to the reported values can be strongly affected by the reported density.
Measurements in water and in surfactant solutions, however, were inconclusive. Pendant drop measurements are optimal in regimes of intermediate Eötvös/Bond number: that is, , where and L is a characteristic length (often the radius of curvature of the droplet, ), with best results when Eo is close to unity [7,8]. With the reported density of 5CB within the range of 1.008 to 1.03 g·cm, the relevance of then becomes problematic for determining the Eötvös number. For a typical pendant drop volume of 100 μL, using our experimentally-determined values for the interfacial tension of 5CB against water without surfactant (∼30 mN · m):
4. Discussion
Measurement both with and without PVA present in the solution gave the same zero-additive interfacial tensions of 5CB against water in the tangential configuration. In both cases, the values of with uncertainty ranges fall within the values of interfacial tension reported by Proust et al. [35] by using a plate method. The weak surface activity of PVA does not drive down the interfacial tension appreciably: from 0% to 10% PVA, the interfacial tension drops from 30.8 mN·m to 28.4 mN·m. PVA does not have a known critical micelle concentration, so it is unclear at what point the interfacial tension should plateau, if at all; even at about 10% w/w concentration, however, measurements become extremely difficult due to the high viscosity of concentrated PVA solution, which makes pinching off droplets in the flow-focusing geometry challenging. Confirmatory measurements of interfacial tension with pendant drops, however, simply were not achievable because the pendant drop technique does not optimally work within the Eötvös number regime that 5CB/water can be found in. While there was found to be an anisotropy in the interfacial tensions between the tangential and normal anchoring cases of 5CB, the anisotropy was quite small (1.0 mN·m).
During the fitting process, discounting the large uncertainties in the fitting parameters for PVA solution, the values obtained for make sense. Physically, when , this means that ; thus, SDS favors adsorption at the liquid crystal-water interface as opposed to being present in the bulk, particularly in the case below the critical micelle concentration (8.2 mM for SDS [37]). In contrast, when , , demonstrating the general preference for the PVA to remain in the bulk solution as opposed to adsorbing at the interface. While still stabilizing the liquid crystal droplets, this results instead in a tangential configuration in the presence of a polymer, similar to the case of the use of polyethylene glycol-based surfactants/stabilizers [38].
Moll et al. proposed that, for sufficiently non-hydrolyzed aqueous PVA solutions at the interface with water and air, the PVA chains will adopt a configuration where the hydroxyl groups will point away from the water and into air, in part due to electrostatic repulsion from the unhydrolyzed acetate groups [2]. The arrangement of PVA at this interface contributes to a decrease in surface tension from the case of pure water, but, above a threshold concentration of PVA, there is minimal variance. While Figure 7 and the corresponding data in Table 2 do show that there is a decrease in interfacial tension with an increase in PVA concentration, the effect is not pronounced. A likely arrangement of how the arrangement of PVA differs from that of SDS is presented in Figure 8.
Previous work by Popov et al. suggests that there is a threshold concentration of SDS above which the preferred orientation of the liquid crystal is normal [37,39]. This threshold is pH-dependent and, for flat films contained within nickel grids with a hybrid aligning condition, was generally on the magnitude of 0.1 mM. Without the use of polarizers to observe the images, it is not fully clear if, for the very low concentrations of SDS, a fully normal alignment is fully achieved. However, the case of a relatively freely-floating droplet is quite distinct geometrically from the suspended film: the cases of suspended films are subject to boundary conditions from the supporting substrate (nickel promotes normal alignment, which is a tangential alignment with respect to the film), while no additional boundary condition needs to be overcome in a droplet. That said, at very low surfactant or additive concentration, the interfacial tension does not differ appreciably from the zero-surfactant case, so any difference that would thus be due to a differing alignment of the liquid crystal may not be appreciable.
5. Conclusions
We have quantified the difference in interfacial tensions between the tangential and normal alignment cases of 5CB in pure water. The difference is small, on the order of 1 mN/m greater for normal than for tangential alignment. This confirms the preference for tangential liquid crystal orientation in the presence of pure water while additionally suggesting that very low surfactant concentrations would be necessary to force a change of alignment. Theoretically, pendant drops, owing to their physical limitations, are not ideal techniques for measuring the interfacial tensions of liquid crystals, and this is confirmed by our observations.
We additionally found that PVA does show some surface activity in addition to stabilizing 5CB, with the zero-PVA interfacial tension of 5CB and water matching the previously directly-measured value and additionally being in reasonable agreement with previous literature values. The surface activity of PVA, however, is not of the same degree as that of SDS. This may suggest that a different model than the Szyszkowski equation is ideal to predict the interfacial behavior of PVA.
Author Contributions
Conceptualization, L.W.H.; Data curation, L.W.H., A.S. (Anjali Sharma) and J.P.F.L.; Formal analysis, L.W.H., A.S. (Anjali Sharma), A.S. (Andy Schanen) and J.P.F.L.; Funding acquisition, L.W.H. and J.P.F.L.; Investigation, L.W.H., A.S. (Anjali Sharma), A.S. (Andy Schanen) and J.P.F.L.; Methodology, L.W.H. and A.S. (Andy Schanen); Project administration, J.P.F.L.; Supervision, J.P.F.L.; Writing—original draft, L.W.H. and A.S. (Anjali Sharma); Writing—review & editing, L.W.H., A.S. (Anjali Sharma), A.S. (Andy Schanen) and J.P.F.L. All authors have read and agreed to the published version of the manuscript.
Funding
This research was funded by the Luxembourg National Research Fund under the framework of an Aide à la formation-recherche grant (grant 9784104, LIMEFLOW) and a PRIDE doctoral training consortium (grant 2016/10935404, MASSENA) and a Consolidator Grant awarded by the European Research Council (grant 648763, INTERACT).
Institutional Review Board Statement
Not applicable.
Informed Consent Statement
Not applicable.
Data Availability Statement
The data presented in this study are available on request from the corresponding authors.
Acknowledgments
The authors thank Ralf Stannarius, Manos Anyfantakis, V.S.R. Jampani, Hakam Agha, Yong Geng, and JungHyun Noh for technical support and discussions; Siddharth Deshpande, in whose lab some of the reference images were obtained; Floris Dautzenberg, Axel Eijffius, Marlene Vollmer, and Niels Wensink for obtaining some of the reference images; and Angelo Manna for technical support in carrying out some of the experiments.
Conflicts of Interest
The authors declare no conflict of interest. The funders had no role in the design of the study; in the collection, analyses, or interpretation of data; in the writing of the manuscript; or in the decision to publish the results.
Abbreviations
The following abbreviations are used in this manuscript:
| 5CB | 4-cyano-4′-pentylbiphenyl |
| SDS | sodium dodecyl sulfate |
| PVA | poly(vinyl alcohol) |
| DMOAP | dimethyloctadecyl[3(trimethoxy-silyl)propyl]ammonium chloride |
| LC | liquid crystal |
References
- Gannon, M.G.; Faber, T.E. The surface tension of nematic liquid crystals. Philos. Mag. Phys. Condens. Matter Struct. Defects Mech. Prop. 1978, 37, 117–135. [Google Scholar] [CrossRef]
- Moll, C.J.; Meister, K.; Kirschner, J.; Bakker, H.J. Surface Structure of Solutions of Poly(vinyl alcohol) in Water. J. Phys. Chem. B 2018, 122, 10722–10727. [Google Scholar] [CrossRef]
- Lecomte du Noüy, P. An interfacial tensiometer for universal use. J. Gen. Physiol. 1925, 7, 625–632. [Google Scholar] [CrossRef]
- Kim, J.W.; Kim, H.; Lee, M.; Magda, J.J. Interfacial tension of a nematic liquid crystal/water interface with homeotropic surface alignment. Langmuir 2004, 20, 8110–8113. [Google Scholar] [CrossRef]
- Boyce, J.; Schürch, S.; Rotenberg, Y.; Neumann, A.W. The Measurement of Surface and Interfacial Tension by the Axisymmetric Drop Technique. Colloids Surf. 1984, 9, 307–317. [Google Scholar] [CrossRef]
- Del Río, O.I.; Neumann, A.W. Axisymmetric drop shape analysis: Computational methods for the measurement of interfacial properties from the shape and dimensions of pendant and sessile drops. J. Colloid Interface Sci. 1997, 196, 136–147. [Google Scholar] [CrossRef] [Green Version]
- Saad, S.M.I.; Policova, Z.; Neumann, A.W. Design and accuracy of pendant drop methods for surface tension measurement. Colloids Surf. A Physicochem. Eng. Asp. 2011, 384, 442–452. [Google Scholar] [CrossRef]
- Popov, P.; Honaker, L.W.; Mirheydari, M.; Mann, E.K.; Jákli, A. Chiral nematic liquid crystal microlenses. Sci. Rep. 2017, 7, 1–9. [Google Scholar] [CrossRef] [Green Version]
- Tintaru, M.; Moldovan, R.; Beica, T.; Frunza, S. Surface tension of some liquid crystals in the cyanobiphenyl series. Liq. Cryst. 2001, 28, 37–41. [Google Scholar] [CrossRef]
- Brosseau, Q.; Vrignon, J.; Baret, J.C. Microfluidic Dynamic Interfacial Tensiometry (μDIT). Soft Matter 2014, 10, 3066–3076. [Google Scholar] [CrossRef] [PubMed] [Green Version]
- Harth, K.; Stannarius, R. Measurement of the interface tension of smectic membranes in water. Phys. Chem. Chem. Phys. 2013, 15, 7204–7209. [Google Scholar] [CrossRef]
- Harth, K.; Shepherd, L.M.; Honaker, J.; Stannarius, R. Dynamic interface tension of a smectic liquid crystal in anionic surfactant solutions. Phys. Chem. Chem. Phys. 2015, 17, 26198–26206. [Google Scholar] [CrossRef] [Green Version]
- Oweimreen, G.A.; Shihab, A.K.; Halhouli, K.; Sikander, S.F. Density Measurements in the Nematic and Isotropic Phases of 5CB and Dilute Solutions of Tetraethylmethane in 5CB. Mol. Cryst. Liq. Cryst. 1986, 138, 327–338. [Google Scholar] [CrossRef]
- Bao, P.; Paterson, D.A.; Harrison, P.L.; Miller, K.; Peyman, S.; Jones, J.C.; Sandoe, J.; Evans, S.D.; Bushby, R.J.; Gleeson, H.F. Lipid coated liquid crystal droplets for the on-chip detection of antimicrobial peptides. Lab Chip 2019, 19, 1082–1089. [Google Scholar] [CrossRef] [Green Version]
- Orlova, T.; Aßhoff, S.J.; Yamaguchi, T.; Katsonis, N.; Brasselet, E. Creation and manipulation of topological states in chiral nematic microspheres. Nat. Commun. 2015, 6. [Google Scholar] [CrossRef] [Green Version]
- Peddireddy, K.; Čopar, S.; Le, K.V.; Muševič, I.; Bahr, C.; Jampani, V.S.R. Self-shaping liquid crystal droplets by balancing bulk elasticity and interfacial tension. Proc. Natl. Acad. Sci. USA 2021, 118, 1–7. [Google Scholar] [CrossRef]
- Sleczkowski, P.; Zhou, Y.; Iamsaard, S.; De Pablo, J.J.; Katsonis, N.; Lacaze, E. Light-activated helical inversion in cholesteric liquid crystal microdroplets. Proc. Natl. Acad. Sci. USA 2018, 115, 4334–4339. [Google Scholar] [CrossRef] [PubMed] [Green Version]
- Hochmuth, R.M. Micropipette aspiration of living cells. J. Biomech. 2000, 33, 15–22. [Google Scholar] [CrossRef]
- Lee, S.; Kim, D.H.; Needham, D. Equilibrium and Dynamic Interfacial Tension Measurements at Microscopic Interfaces Using a Micropipet Technique. 1. A New Method for Determination of Interfacial Tension. Langmuir 2001, 17, 5537–5543. [Google Scholar] [CrossRef]
- Lee, S.; Kim, D.H.; Needham, D. Equilibrium and Dynamic Interfacial Tension Measurements at Microscopic Interfaces Using a Micropipet Technique. 2. Dynamics of Phospholipid Monolayer Formation and Equilibrium Tensions at the Water-Air Interface. Langmuir 2001, 17, 5544–5550. [Google Scholar] [CrossRef]
- Honaker, L.W.; Lagerwall, J.P.F.; Jampani, V.S.R. Microfluidic Tensiometry Technique for the Characterization of the Interfacial Tension between Immiscible Liquids. Langmuir 2018, 34, 2403–2409. [Google Scholar] [CrossRef] [Green Version]
- Stephen, M.J.; Straley, J.P. Physics of liquid crystals. Rev. Mod. Phys. 1974, 46, 617–704. [Google Scholar] [CrossRef]
- Abe, K.; Usami, A.; Ishida, K.; Fukushima, Y.; Shigenari, T. Dielectric and fluorescence study on phase transitions in liquid crystal 5CB and 8CB. J. Korean Phys. Soc. 2005, 46, 220–223. [Google Scholar]
- Cui, M.; Kelly, J.R. Temperature Dependence of Visco-Elastic Properties of 5CB. Mol. Cryst. Liq. Cryst. Sci. Technol. Sect. A Mol. Cryst. Liq. Cryst. 1999, 331, 49–57. [Google Scholar] [CrossRef]
- Jérôme, B. Surface effects and anchoring in liquid crystals. Rep. Prog. Phys. 1999, 54, 391–451. [Google Scholar] [CrossRef]
- Yokoyama, H. Surface Anchoring of Nematic Liquid Crystals. Mol. Cryst. Liq. Cryst. 1988, 165, 265–316. [Google Scholar] [CrossRef]
- Noh, J.; Reguengo de Sousa, K.; Lagerwall, J.P.F. Influence of interface stabilisers and surrounding aqueous phases on nematic liquid crystal shells. Soft Matter 2015, 12, 367–372. [Google Scholar] [CrossRef] [PubMed]
- Urbanski, M.; Reyes, C.G.; Noh, J.; Sharma, A.; Geng, Y.; Subba Rao Jampani, V.; Lagerwall, J.P.F. Liquid crystals in micron-scale droplets, shells and fibers. J. Phys. Condens. Matter 2017, 29, 1–53. [Google Scholar] [CrossRef] [PubMed] [Green Version]
- Squillace, O.; Fong, R.; Shepherd, O.; Hind, J.; Tellam, J.; Steinke, N.J.; Thompson, R.L. Influence of PVAc/PVA hydrolysis on additive surface activity. Polymers 2020, 12, 205. [Google Scholar] [CrossRef] [PubMed] [Green Version]
- Zhmud, B.V.; Tiberg, F.; Kizling, J. Dynamic surface tension in concentrated solutions of CnEm surfactants: A comparison between the theory and experiment. Langmuir 2000, 16, 2557–2565. [Google Scholar] [CrossRef]
- Barnaba, C.; García-Alvarado, M.A.; Tejero-Andrade, J.M.; Medina-Meza, I.G. Langmuir adsorption isotherms for different organic solutions of cholesterol. Rev. Mex. Ing. Qumica 2013, 12, 283–292. [Google Scholar]
- Bąk, A.; Podgórska, W. Interfacial and surface tensions of toluene/water and air/water systems with nonionic surfactants Tween 20 and Tween 80. Colloids Surf. Physicochem. Eng. Asp. 2016, 504, 414–425. [Google Scholar] [CrossRef]
- Schanen, A. Microfluidics for Measuring the Interfacial Tension of Liquid Crystals. Master’s Thesis, University of Luxembourg, Luxembourg, 2019. [Google Scholar]
- Honaker, L.W. Liquid Metals and Liquid Crystals Subject to Flow: From Fundamental Fluid Physics to Functional Fibers. Ph.D. Thesis, University of Luxembourg, Luxembourg, 2019. [Google Scholar]
- Proust, J.E.; Perez, E.; Ter-Minassian-Saraga, L. Films minces de cristal liquide nématique sur support liquide. Colloid Polym. Sci. Kolloid Z. Z. Polym. 1978, 256, 666–681. [Google Scholar] [CrossRef]
- Carboni, C.; Al-Ruzaiqi, S.; Al-Siyabi, A.; Al-Harthi, S.; George, A.; Sluckin, T. The behaviour of the interfacial surface tension of liquid-crystal materials in the vicinity of the nematic-isotropic phase transition. Mol. Cryst. Liq. Cryst. 2008, 494, 114–126. [Google Scholar] [CrossRef]
- Popov, N.; Smirnova, A.; Popov, P.; Usol’tseva, N. Determination of Concentrations of Surface-Active Materials in Aqueous Solutions at Different pH Values Using Liquid Crystals. Liq. Cryst. Their Appl. 2017, 17, 34–42. [Google Scholar] [CrossRef]
- Noh, J.H.; Wang, Y.; Liang, H.L.; Jampani, V.S.R.; Majumdar, A.; Lagerwall, J.P.F. Dynamic tuning of the director field in liquid crystal shells using block copolymers. Phys. Rev. Res. 2020, 2, 33160. [Google Scholar] [CrossRef]
- Popov, N.; Honaker, L.W.; Popova, M.; Usol’tseva, N.; Mann, E.K.; Jákli, A.; Popov, P.; Popov, P. Thermotropic Liquid Crystal-Assisted Chemical and Biological Sensors. Materials 2018, 11, 20. [Google Scholar] [CrossRef] [PubMed] [Green Version]
Figure 1.
Aspiration of a droplet of 5CB in an aqueous surfactant solution (6.0 mM SDS). The difference in pressure values obtained from (a) before and (b) after the aspiration (), along with the corresponding radii of curvature before and during aspiration ( and , respectively), are then inserted into Equation (1) to obtain the interfacial tension .

Figure 2.
A schematic representation of our set-up used to both (a) produce and (b) measure droplets. Liquids are flowed from pressurized, sealed vessels using a microfluidic pressure controller. Once suitable droplets are generated in (a), the pressures used to produce the droplets are cut and a gentle pressure applied from the waste vessel to deform the droplet in the constriction. Adapted in part from Honaker et al. [21].

Figure 3.
Micrographs of a bulk sample of an aqueous solution containing 5CB droplets, using (a) and (a′) PVA, to promote tangential alignment; and (b) and (b′) SDS, to induce normal alignment. Images are viewed (a) and (b) with a single polarizer and (a′) and (b′) between crossed linear polarizers. Even without crossed polarizers, a characteristic texture when droplets are normally aligned is clearly visible in (b), which allows us to verify the droplet alignment. Scale bars 100 μm.

Figure 4.
A schematic representation of the pendant drop experiment set-up, in the configuration for measuring surface tension (against air).
Figure 4.
A schematic representation of the pendant drop experiment set-up, in the configuration for measuring surface tension (against air).

Figure 5.
Drops of 5CB in (a) air and (b) water. Scale bar represents 1 mm.

Figure 6.
Interfacial tension of 5CB against aqueous SDS solutions from Table 1 (in green) with a fitted Szyszkowski equation (in orange).
Figure 6.
Interfacial tension of 5CB against aqueous SDS solutions from Table 1 (in green) with a fitted Szyszkowski equation (in orange).

Figure 7.
Interfacial tension of 5CB against aqueous PVA solutions from Table 2 (in green ) with a fitted Szyszkowski equation (in pink).
Figure 7.
Interfacial tension of 5CB against aqueous PVA solutions from Table 2 (in green ) with a fitted Szyszkowski equation (in pink).

Figure 8.
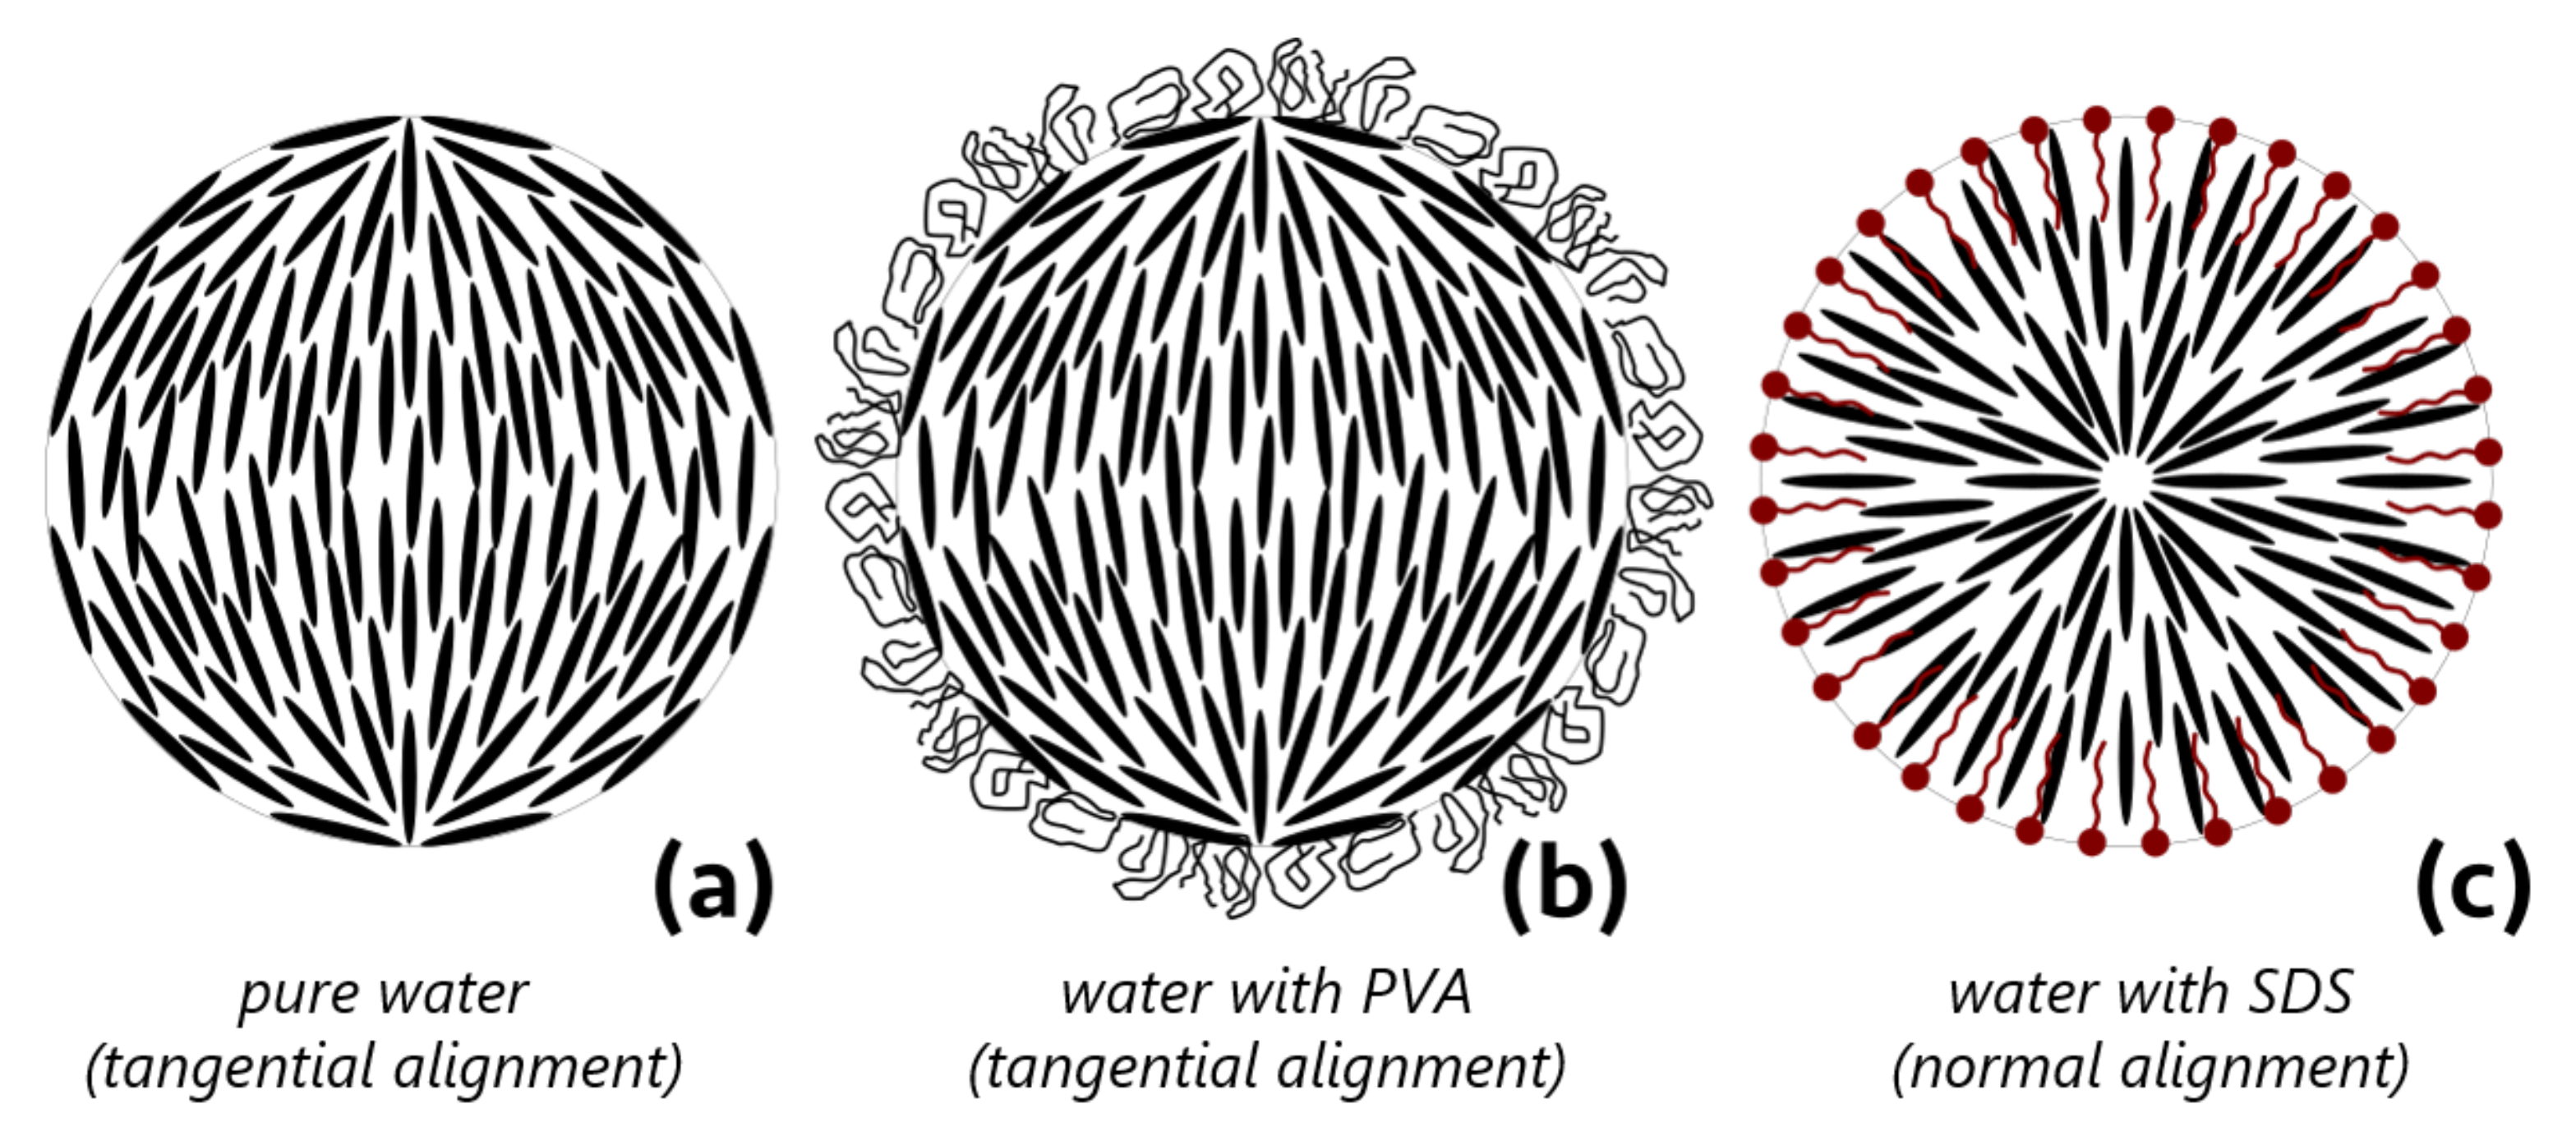
Two-dimensional representation of the configurations of the arrangement of 5CB molecules in a droplet under different anchoring conditions induced by additives. (a) The case of alignment under pure water, where tangential alignment is observed. (b) The case of PVA solution, where the PVA adsorbs weakly to the droplet interface, forming a sort of protective “shell” while leaving the alignment undisturbed. (c) In the presence of SDS or a similar long-tailed surfactant, the tails embed within the liquid crystal, changing the alignment to normal. Note that the “molecules” are not to scale and that the degree of orientational order is greatly exaggerated for simplicity.
Figure 8.
Two-dimensional representation of the configurations of the arrangement of 5CB molecules in a droplet under different anchoring conditions induced by additives. (a) The case of alignment under pure water, where tangential alignment is observed. (b) The case of PVA solution, where the PVA adsorbs weakly to the droplet interface, forming a sort of protective “shell” while leaving the alignment undisturbed. (c) In the presence of SDS or a similar long-tailed surfactant, the tails embed within the liquid crystal, changing the alignment to normal. Note that the “molecules” are not to scale and that the degree of orientational order is greatly exaggerated for simplicity.


Table 1.
Interfacial tensions of 5CB against aqueous SDS solutions of various concentrations below critical micelle concentration. Data adapted in part from Honaker et al. [21] and reproduced with permission from the American Chemical Society.
Table 1.
Interfacial tensions of 5CB against aqueous SDS solutions of various concentrations below critical micelle concentration. Data adapted in part from Honaker et al. [21] and reproduced with permission from the American Chemical Society.
| Concentration SDS (aq), mM | Interfacial Tension, mN·m |
|---|---|
| 6.0 | 10.4 ± 0.8 |
| 5.0 | 11.4 ± 0.8 |
| 2.0 | 13.9 ± 0.9 |
| 1.0 | 17.0 ± 0.3 |
| 0.10 | 28.3 ± 0.7 |
| 0.010 | 30.5 ± 0.6 |
Table 2.
Interfacial tensions of 5CB against aqueous PVA solutions of various concentrations with the molar equivalents for comparison to the results with SDS, based on molar masses of 13-23 kDa as reported by the manufacturer. The value for 5.0% w/w PVA was reported by Schanen [33] using the same technique.
| Concentration PVA (aq), % w/w | Concentration Molar Equivalent | Interfacial Tension, mN·m |
|---|---|---|
| 1.0 | 0.44–0.78 mM | 30.3 ± 6.0 |
| 2.50 | 1.12–1.97 mM | 30.2 ± 2.5 |
| 5.0 | 2.29–4.05 mM | 29.7 ± 1.5 |
| 7.50 | 3.53–6.24 mM | 28.6 ± 1.1 |
| 10.0 | 4.83–8.55 mM | 28.4 ± 1.0 |
Publisher’s Note: MDPI stays neutral with regard to jurisdictional claims in published maps and institutional affiliations. |
© 2021 by the authors. Licensee MDPI, Basel, Switzerland. This article is an open access article distributed under the terms and conditions of the Creative Commons Attribution (CC BY) license (https://creativecommons.org/licenses/by/4.0/).
Share and Cite
MDPI and ACS Style
Honaker, L.W.; Sharma, A.; Schanen, A.; Lagerwall, J.P.F. Measuring the Anisotropy in Interfacial Tension of Nematic Liquid Crystals. Crystals 2021, 11, 687. https://doi.org/10.3390/cryst11060687
AMA Style
Honaker LW, Sharma A, Schanen A, Lagerwall JPF. Measuring the Anisotropy in Interfacial Tension of Nematic Liquid Crystals. Crystals. 2021; 11(6):687. https://doi.org/10.3390/cryst11060687
Chicago/Turabian StyleHonaker, Lawrence W., Anjali Sharma, Andy Schanen, and Jan P. F. Lagerwall. 2021. "Measuring the Anisotropy in Interfacial Tension of Nematic Liquid Crystals" Crystals 11, no. 6: 687. https://doi.org/10.3390/cryst11060687
Note that from the first issue of 2016, this journal uses article numbers instead of page numbers. See further details here.