Genome-Wide Genetic Diversity and Population Structure of Tunisian Durum Wheat Landraces Based on DArTseq Technology

 , , and
Abstract
:
1. Introduction
2. Results
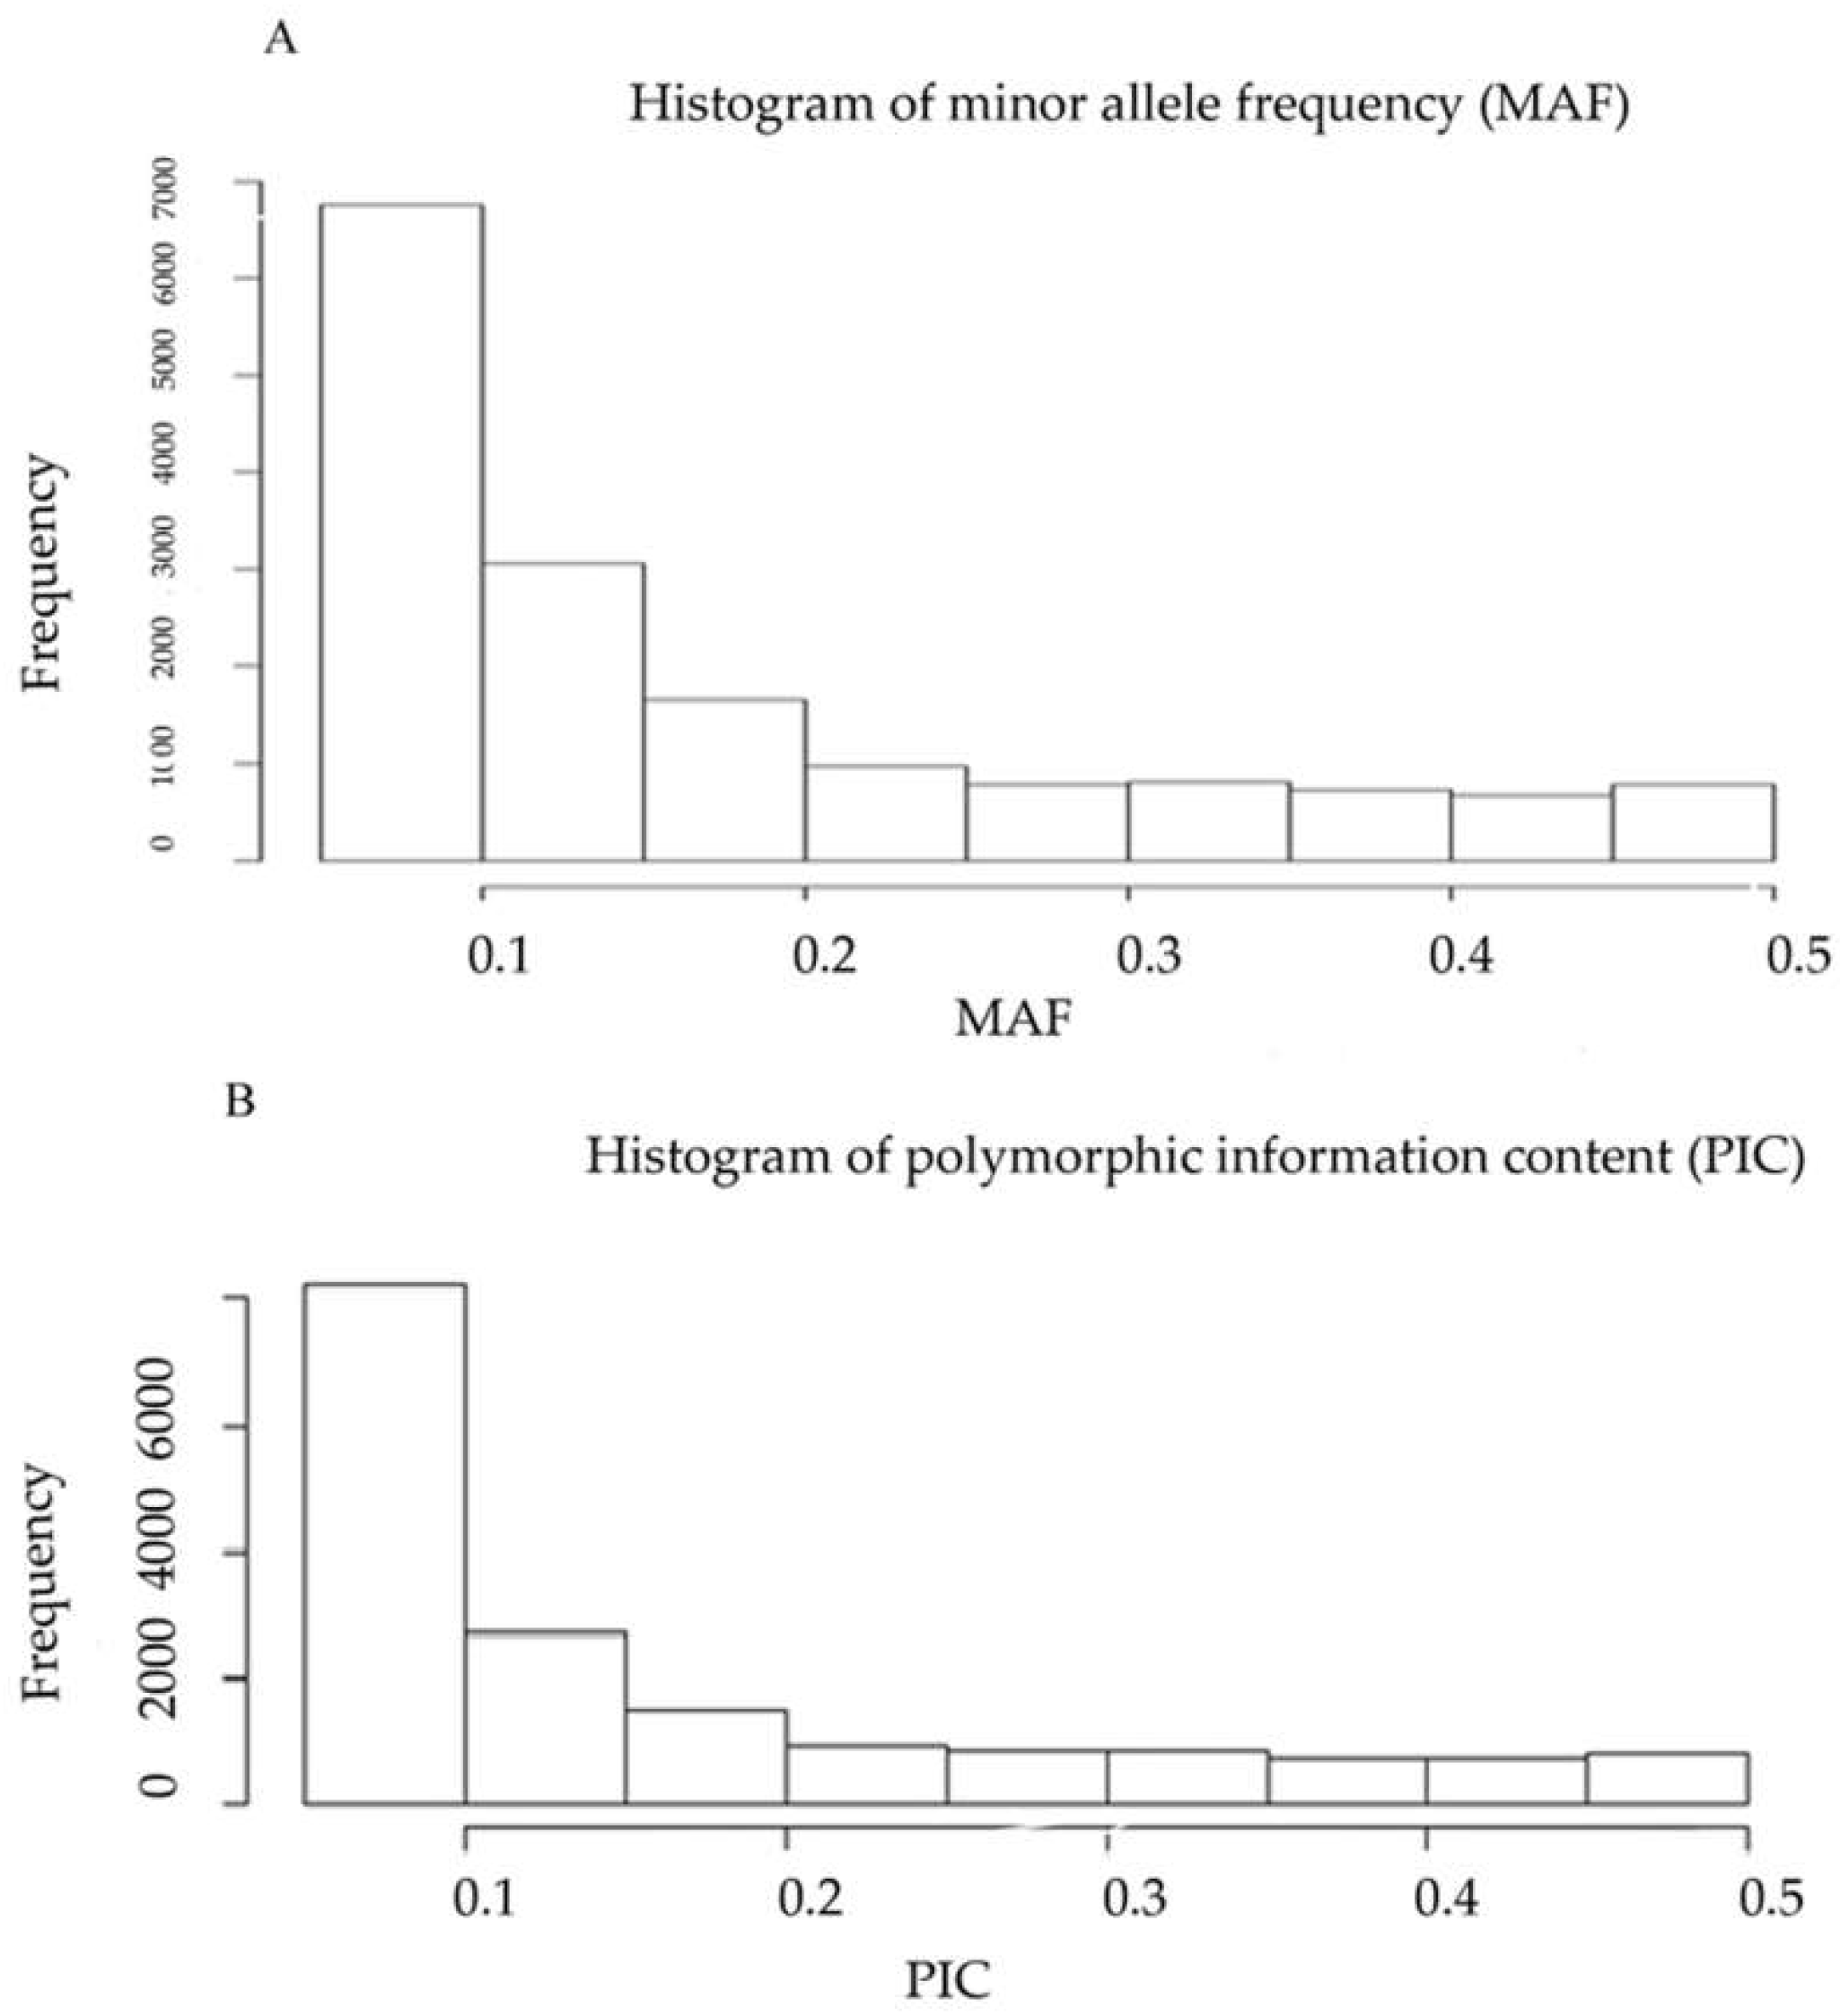
2.1. DArTseq Marker Characteristics
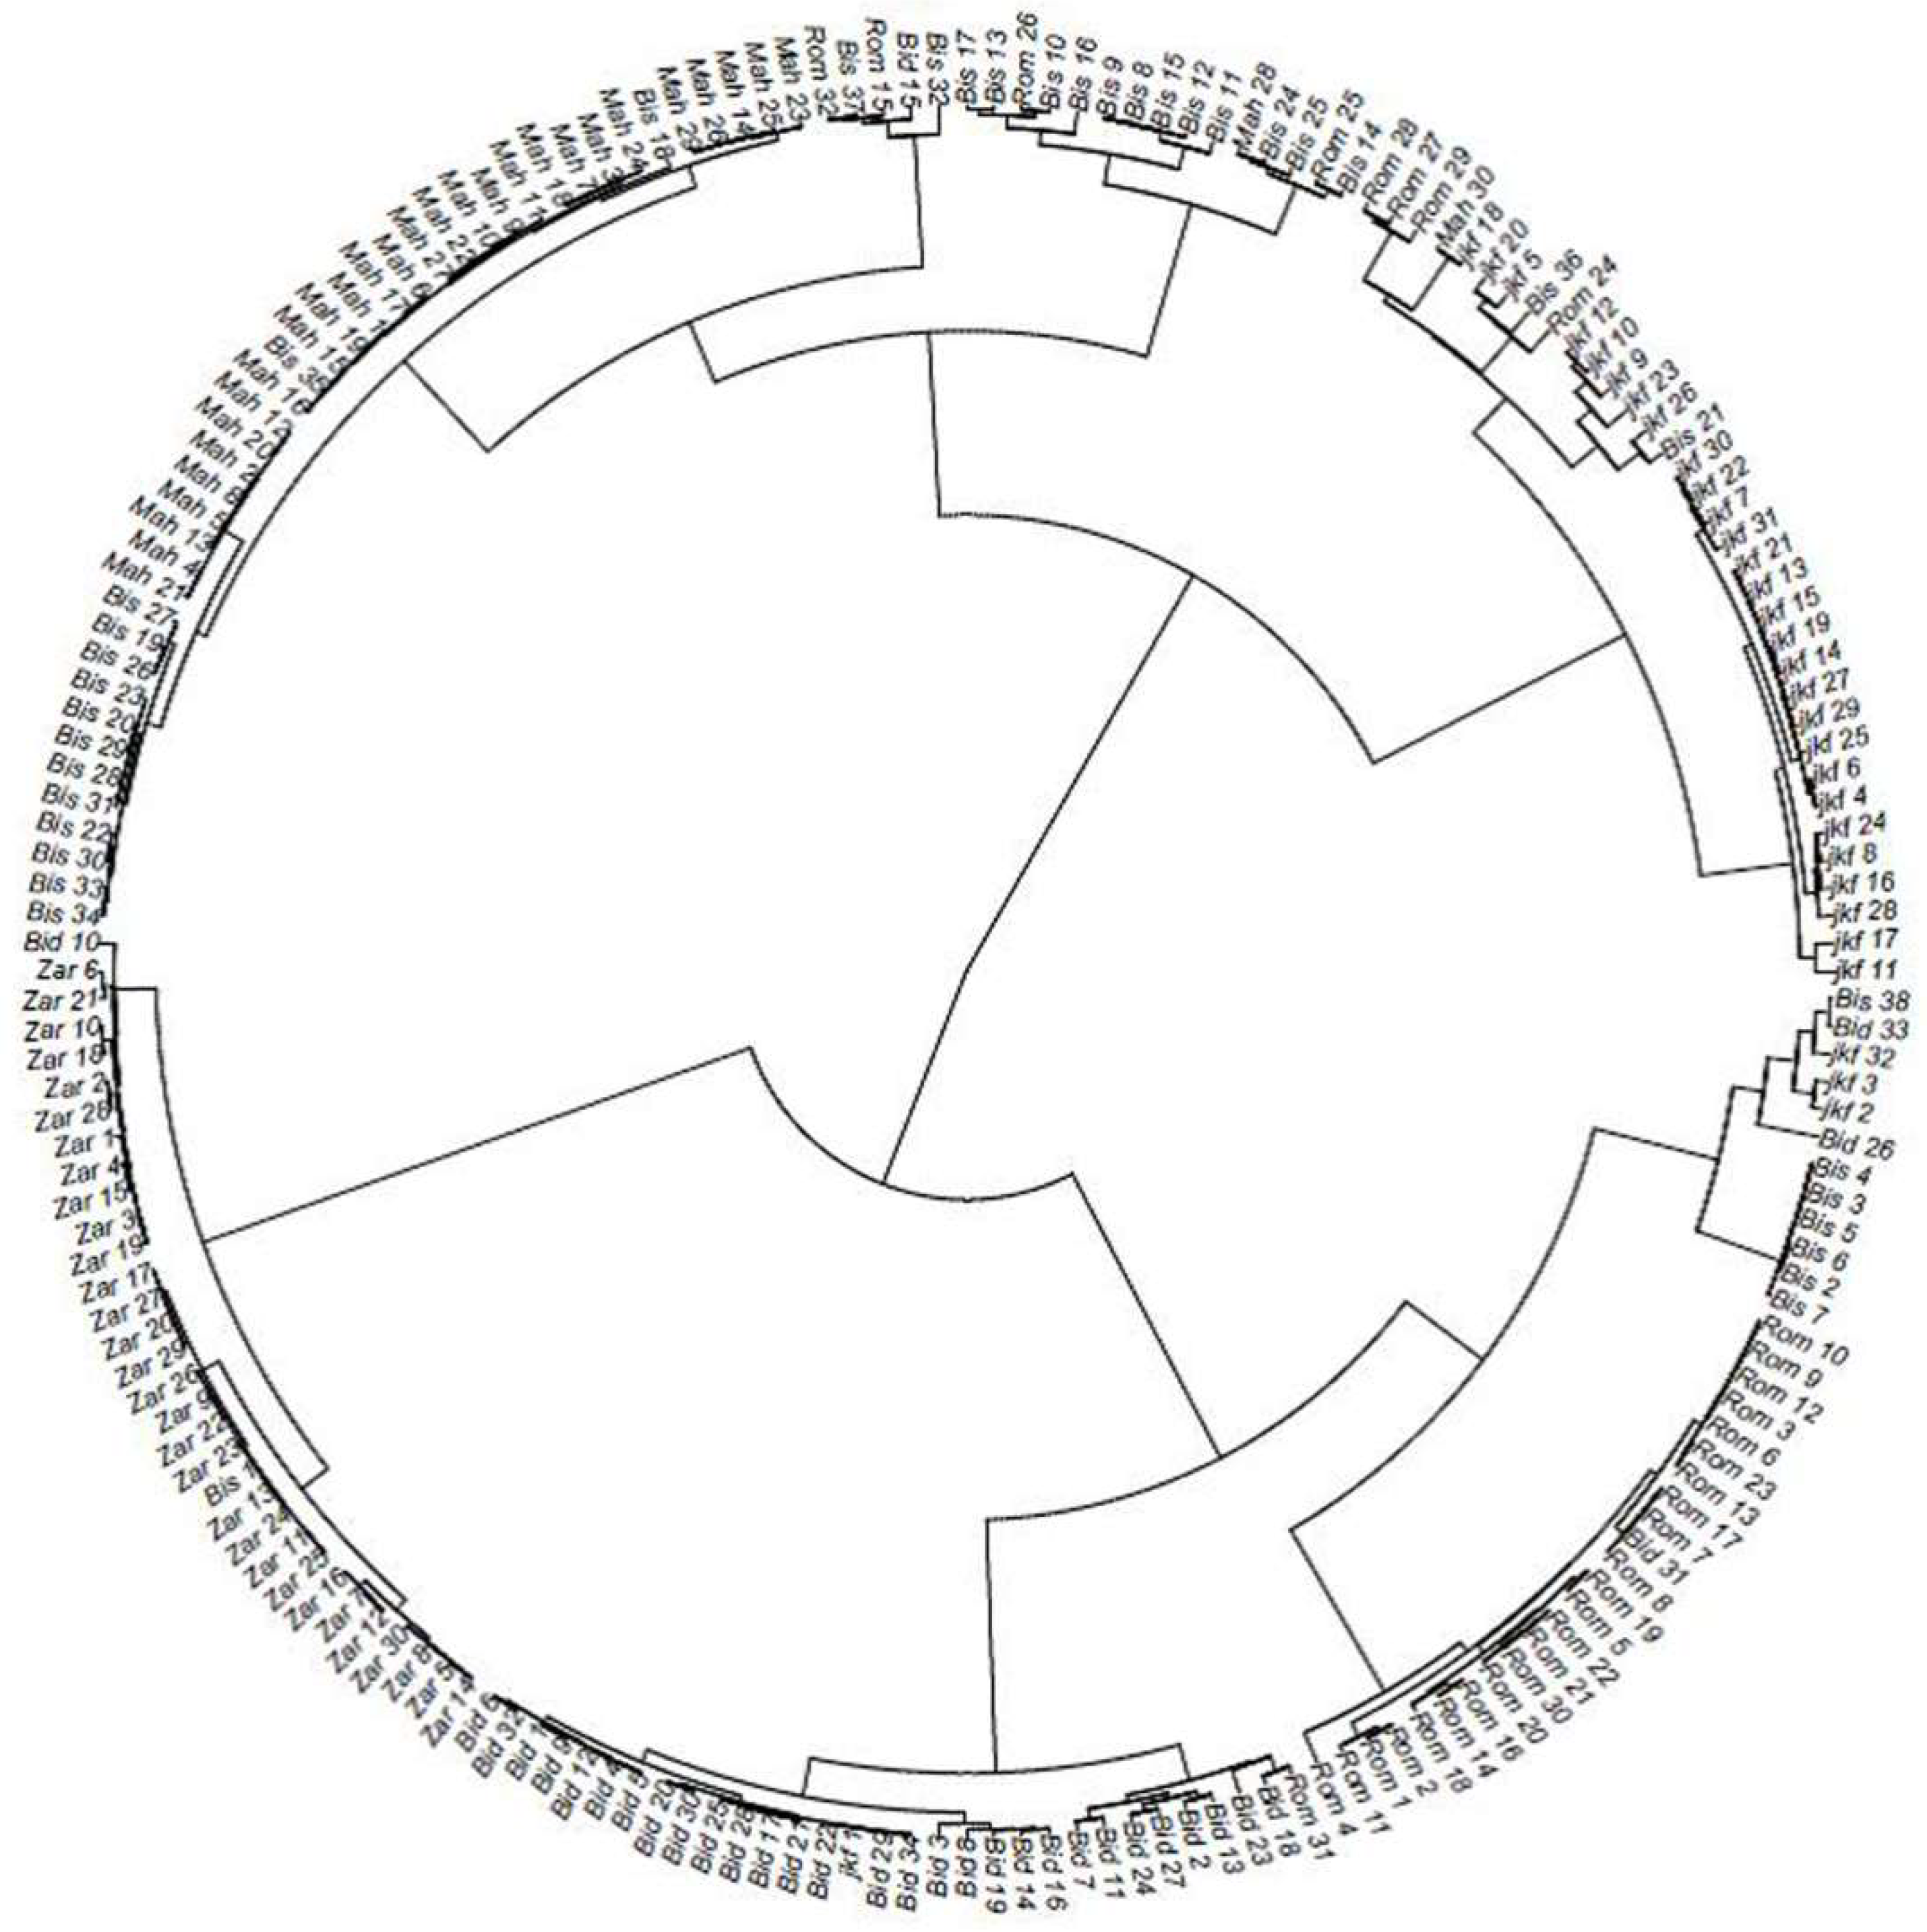
2.2. Genetic Distance and Clustering of the Tunisian Landraces
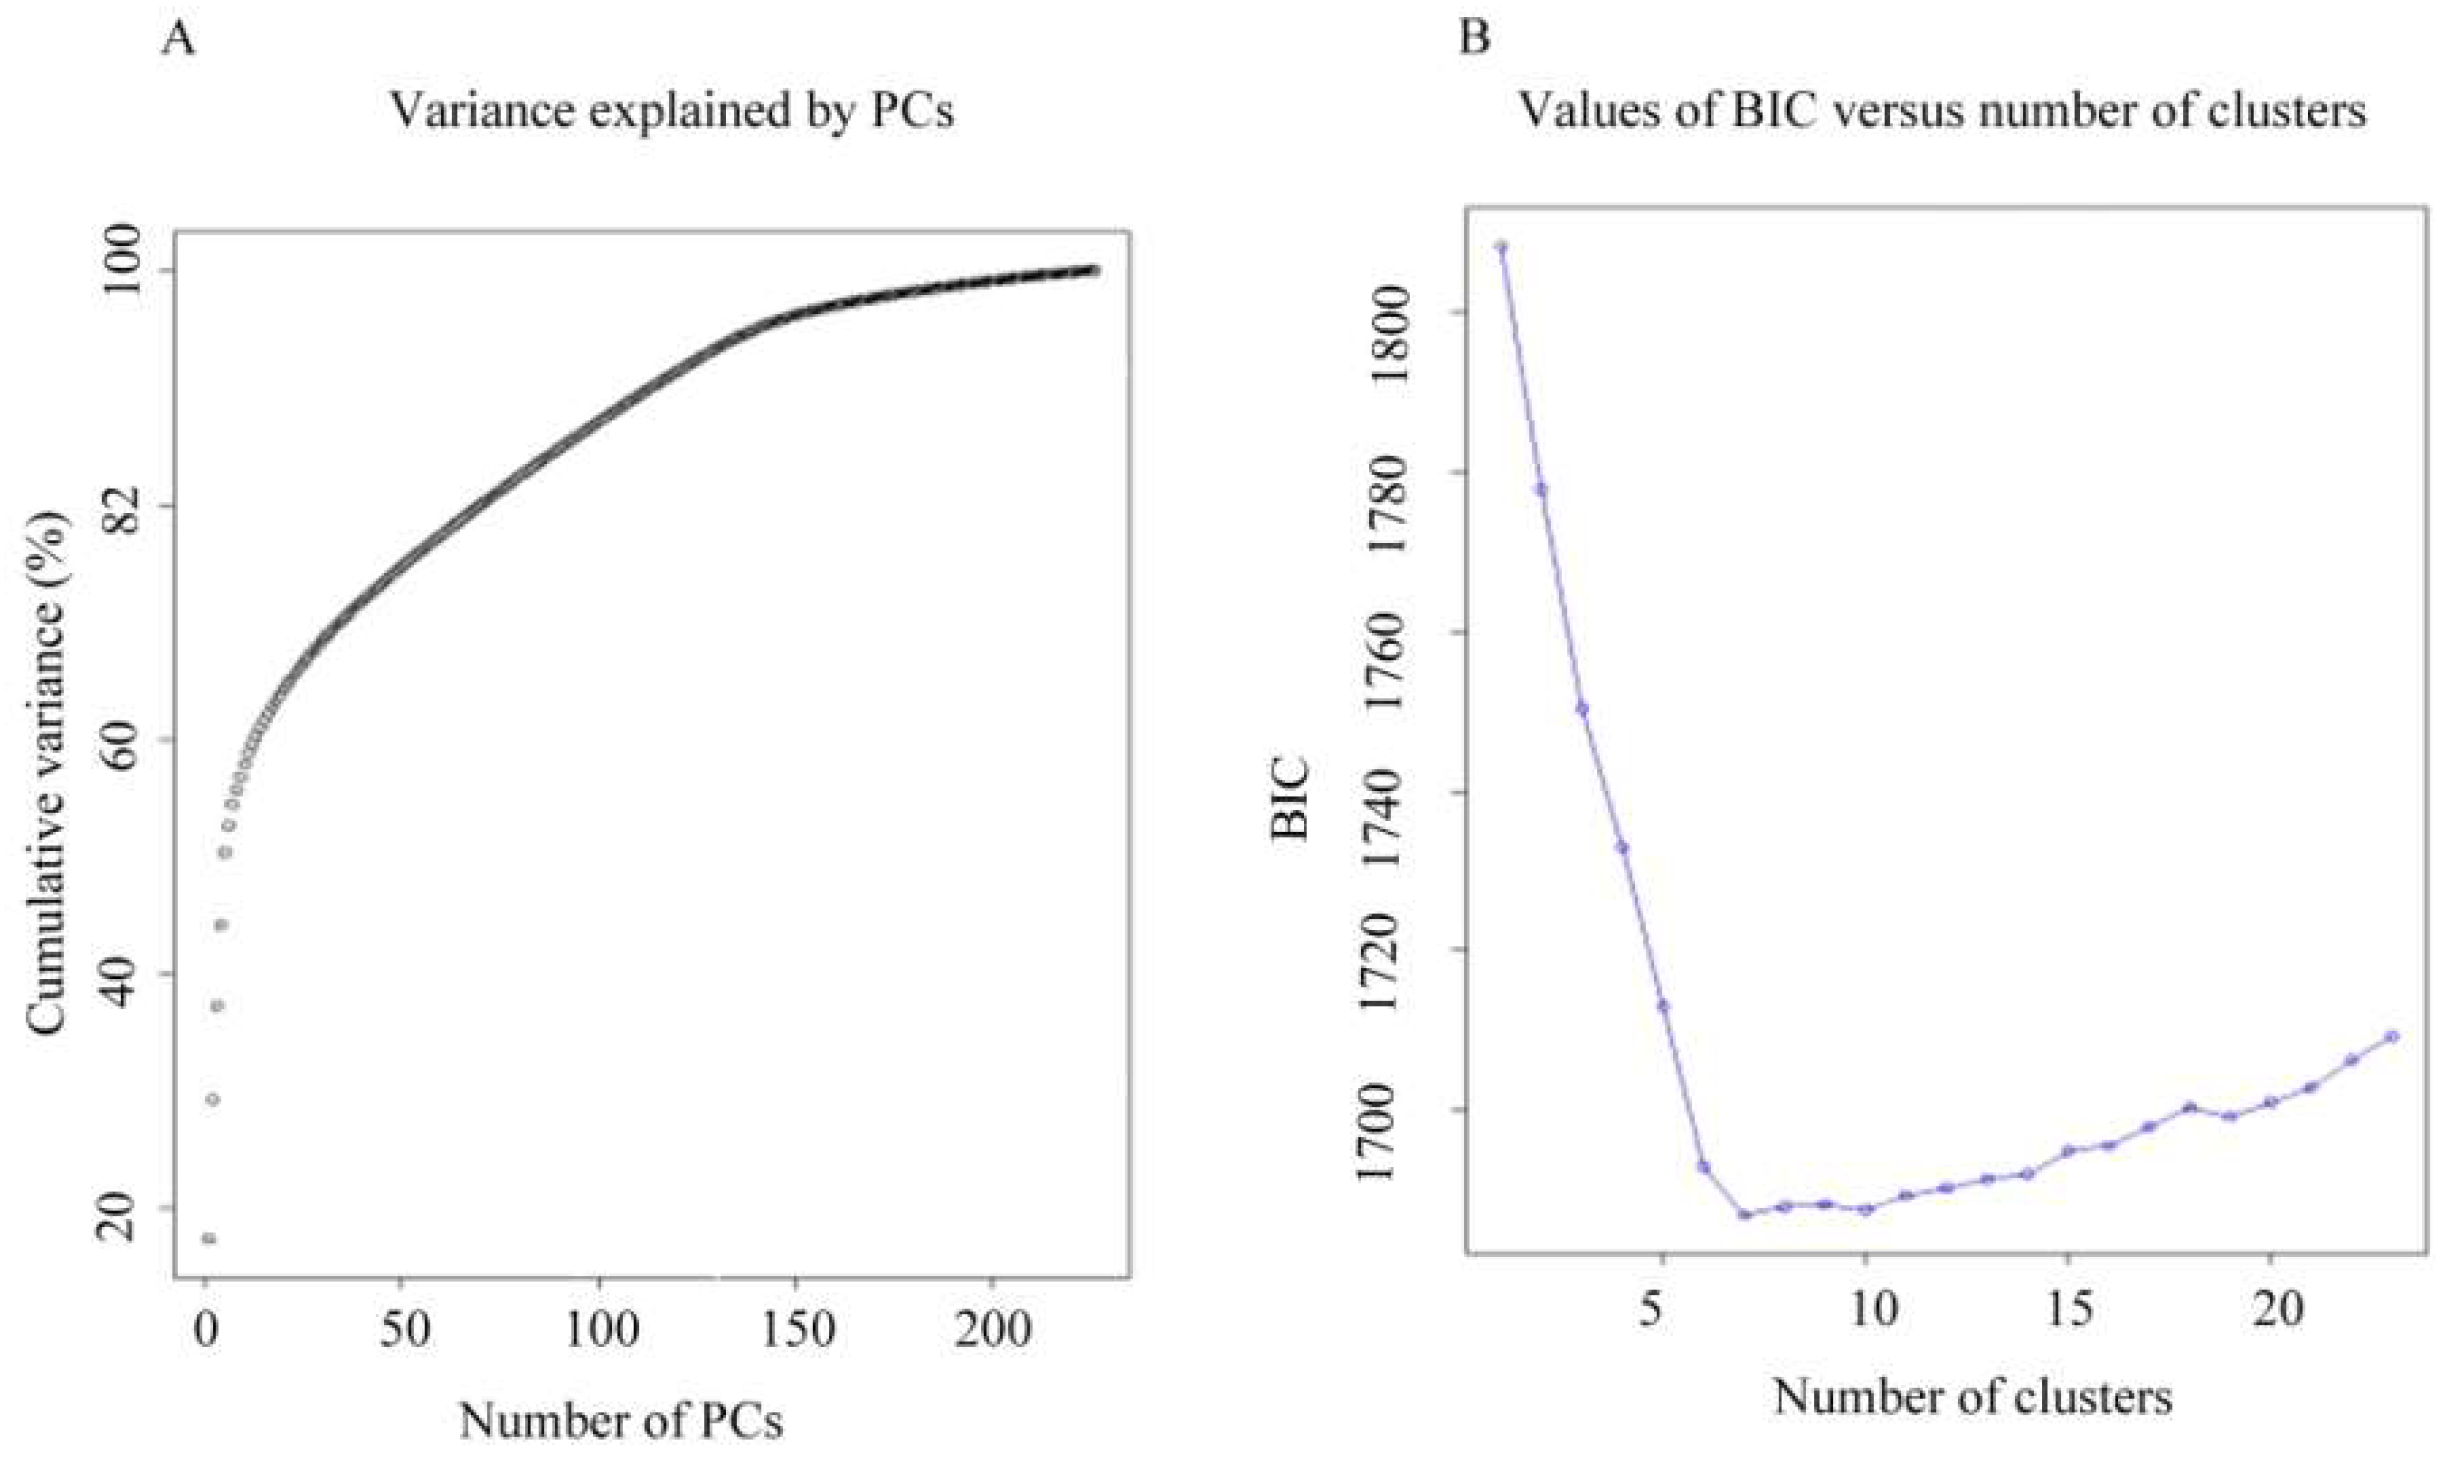
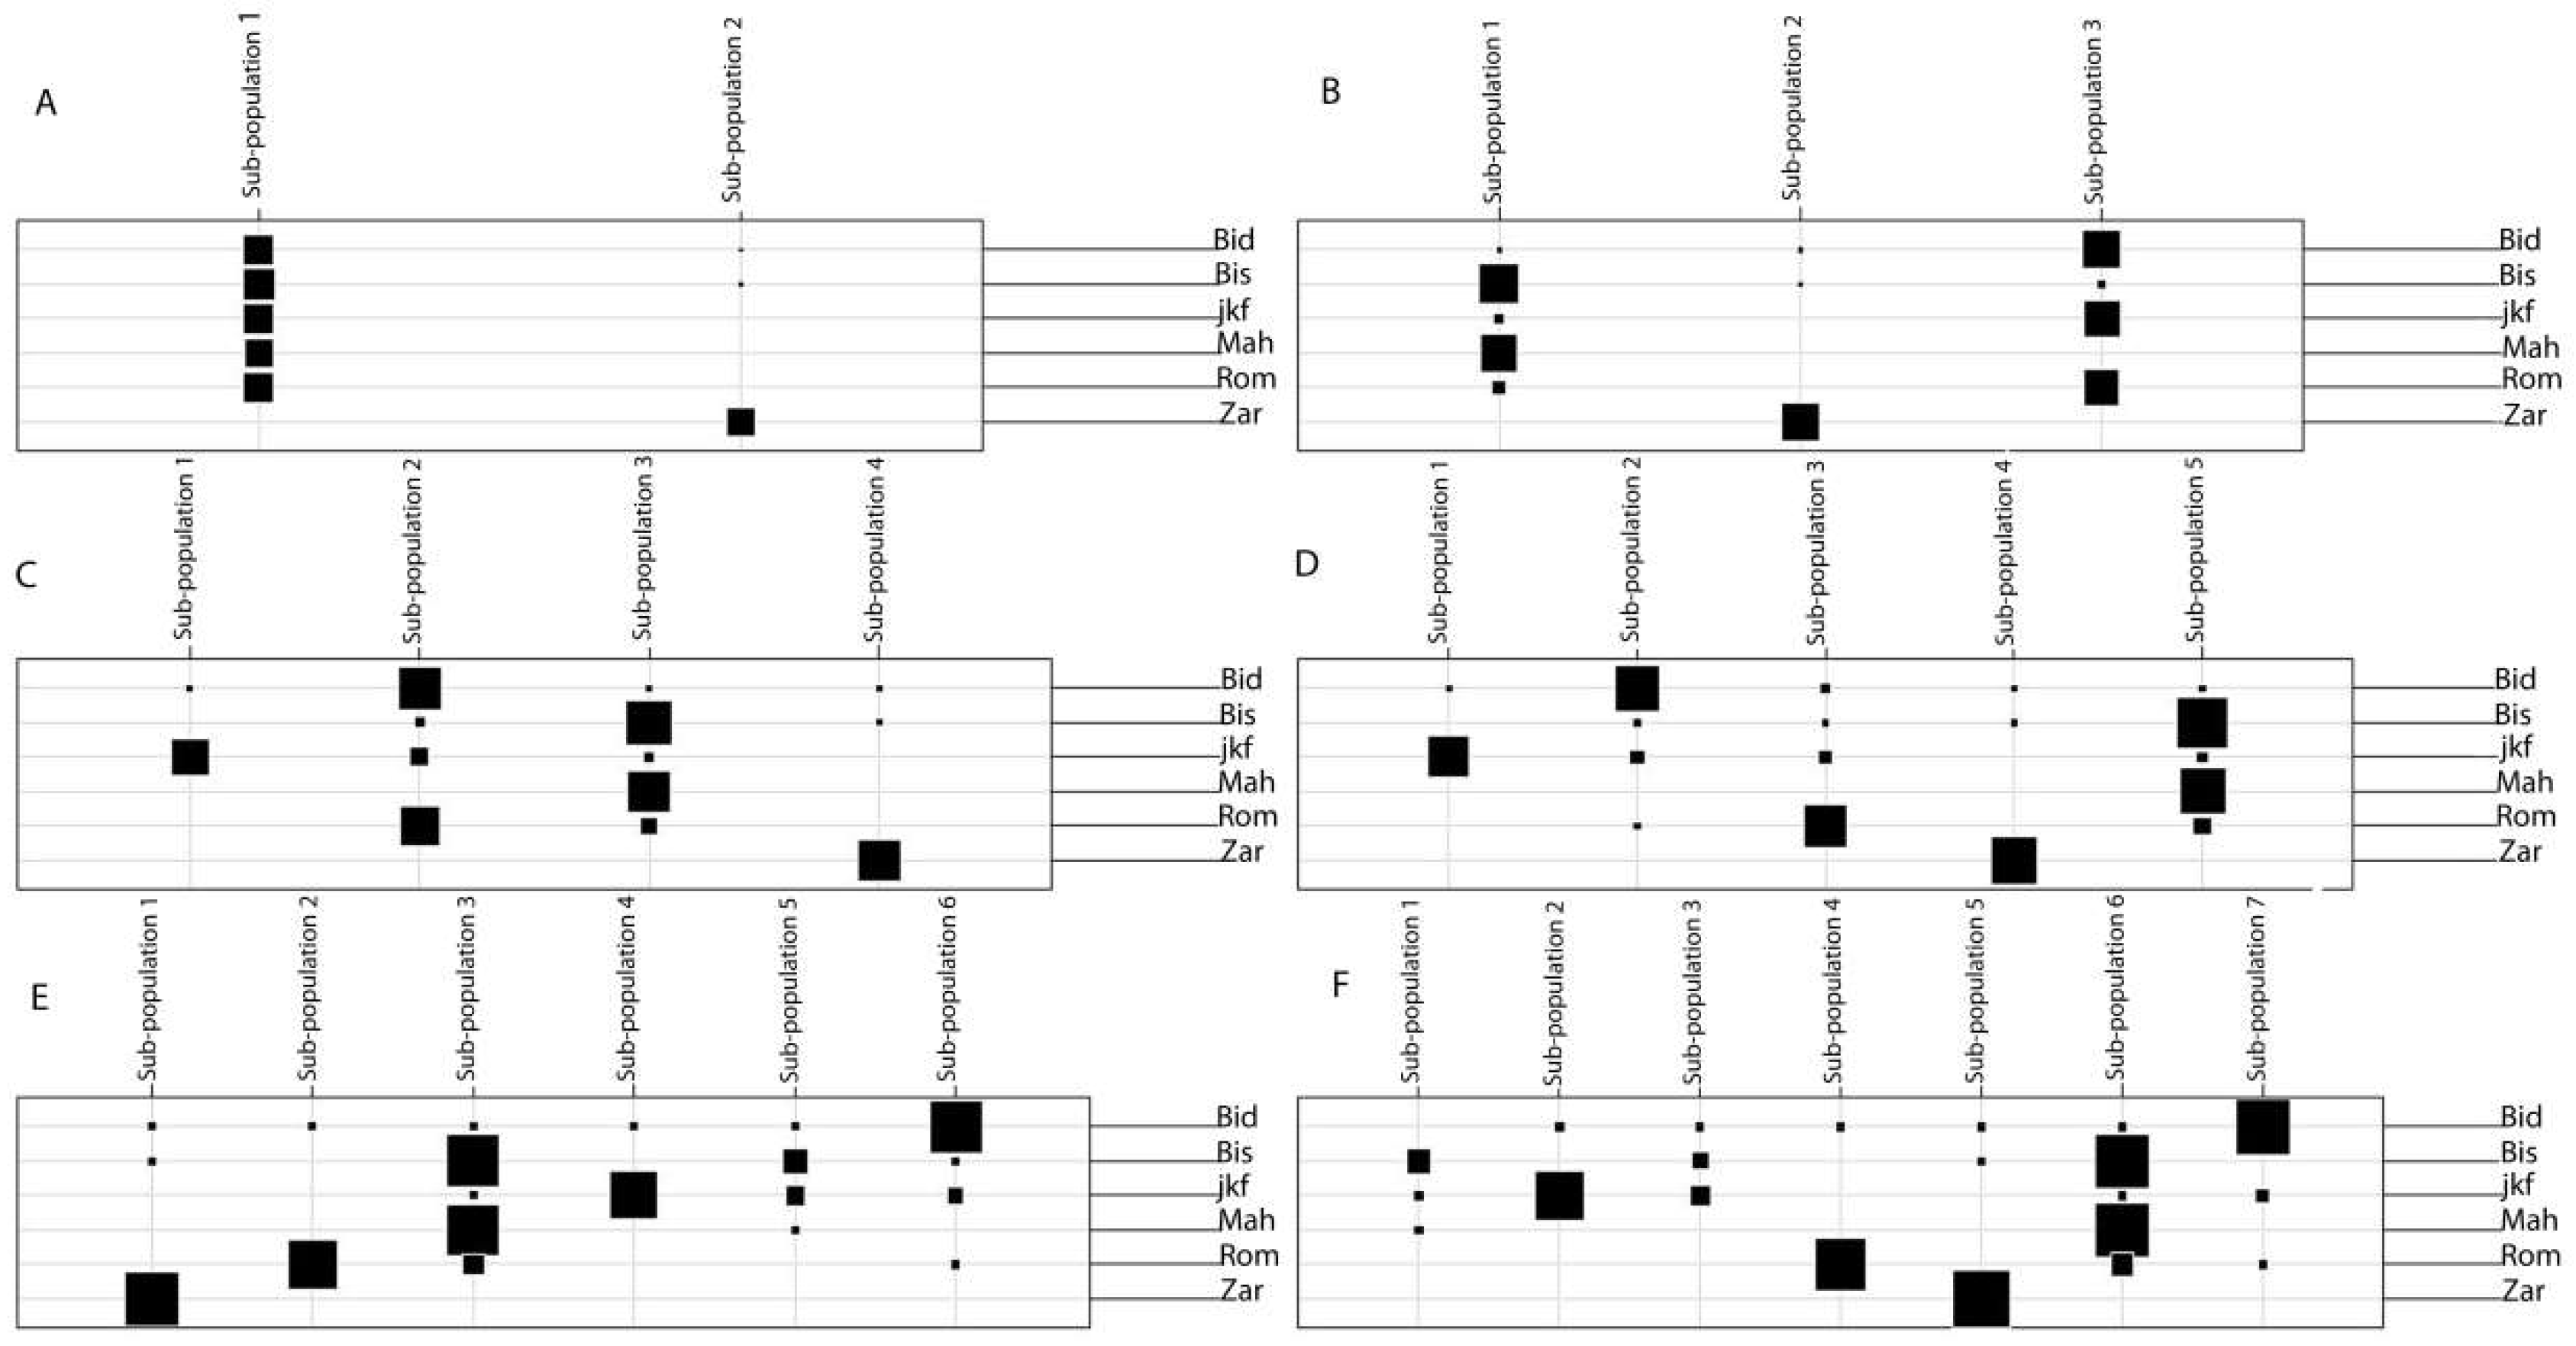
2.3. Population Structure of the Tunisian Landraces
2.4. Genetic Diversity and Genetic Distance between Tunisian Landraces
2.5. Linking the Mis-Classified Lines to Local Landraces and Improved Varieties or/and to the ICARDA/CIMMYT Elite Lines
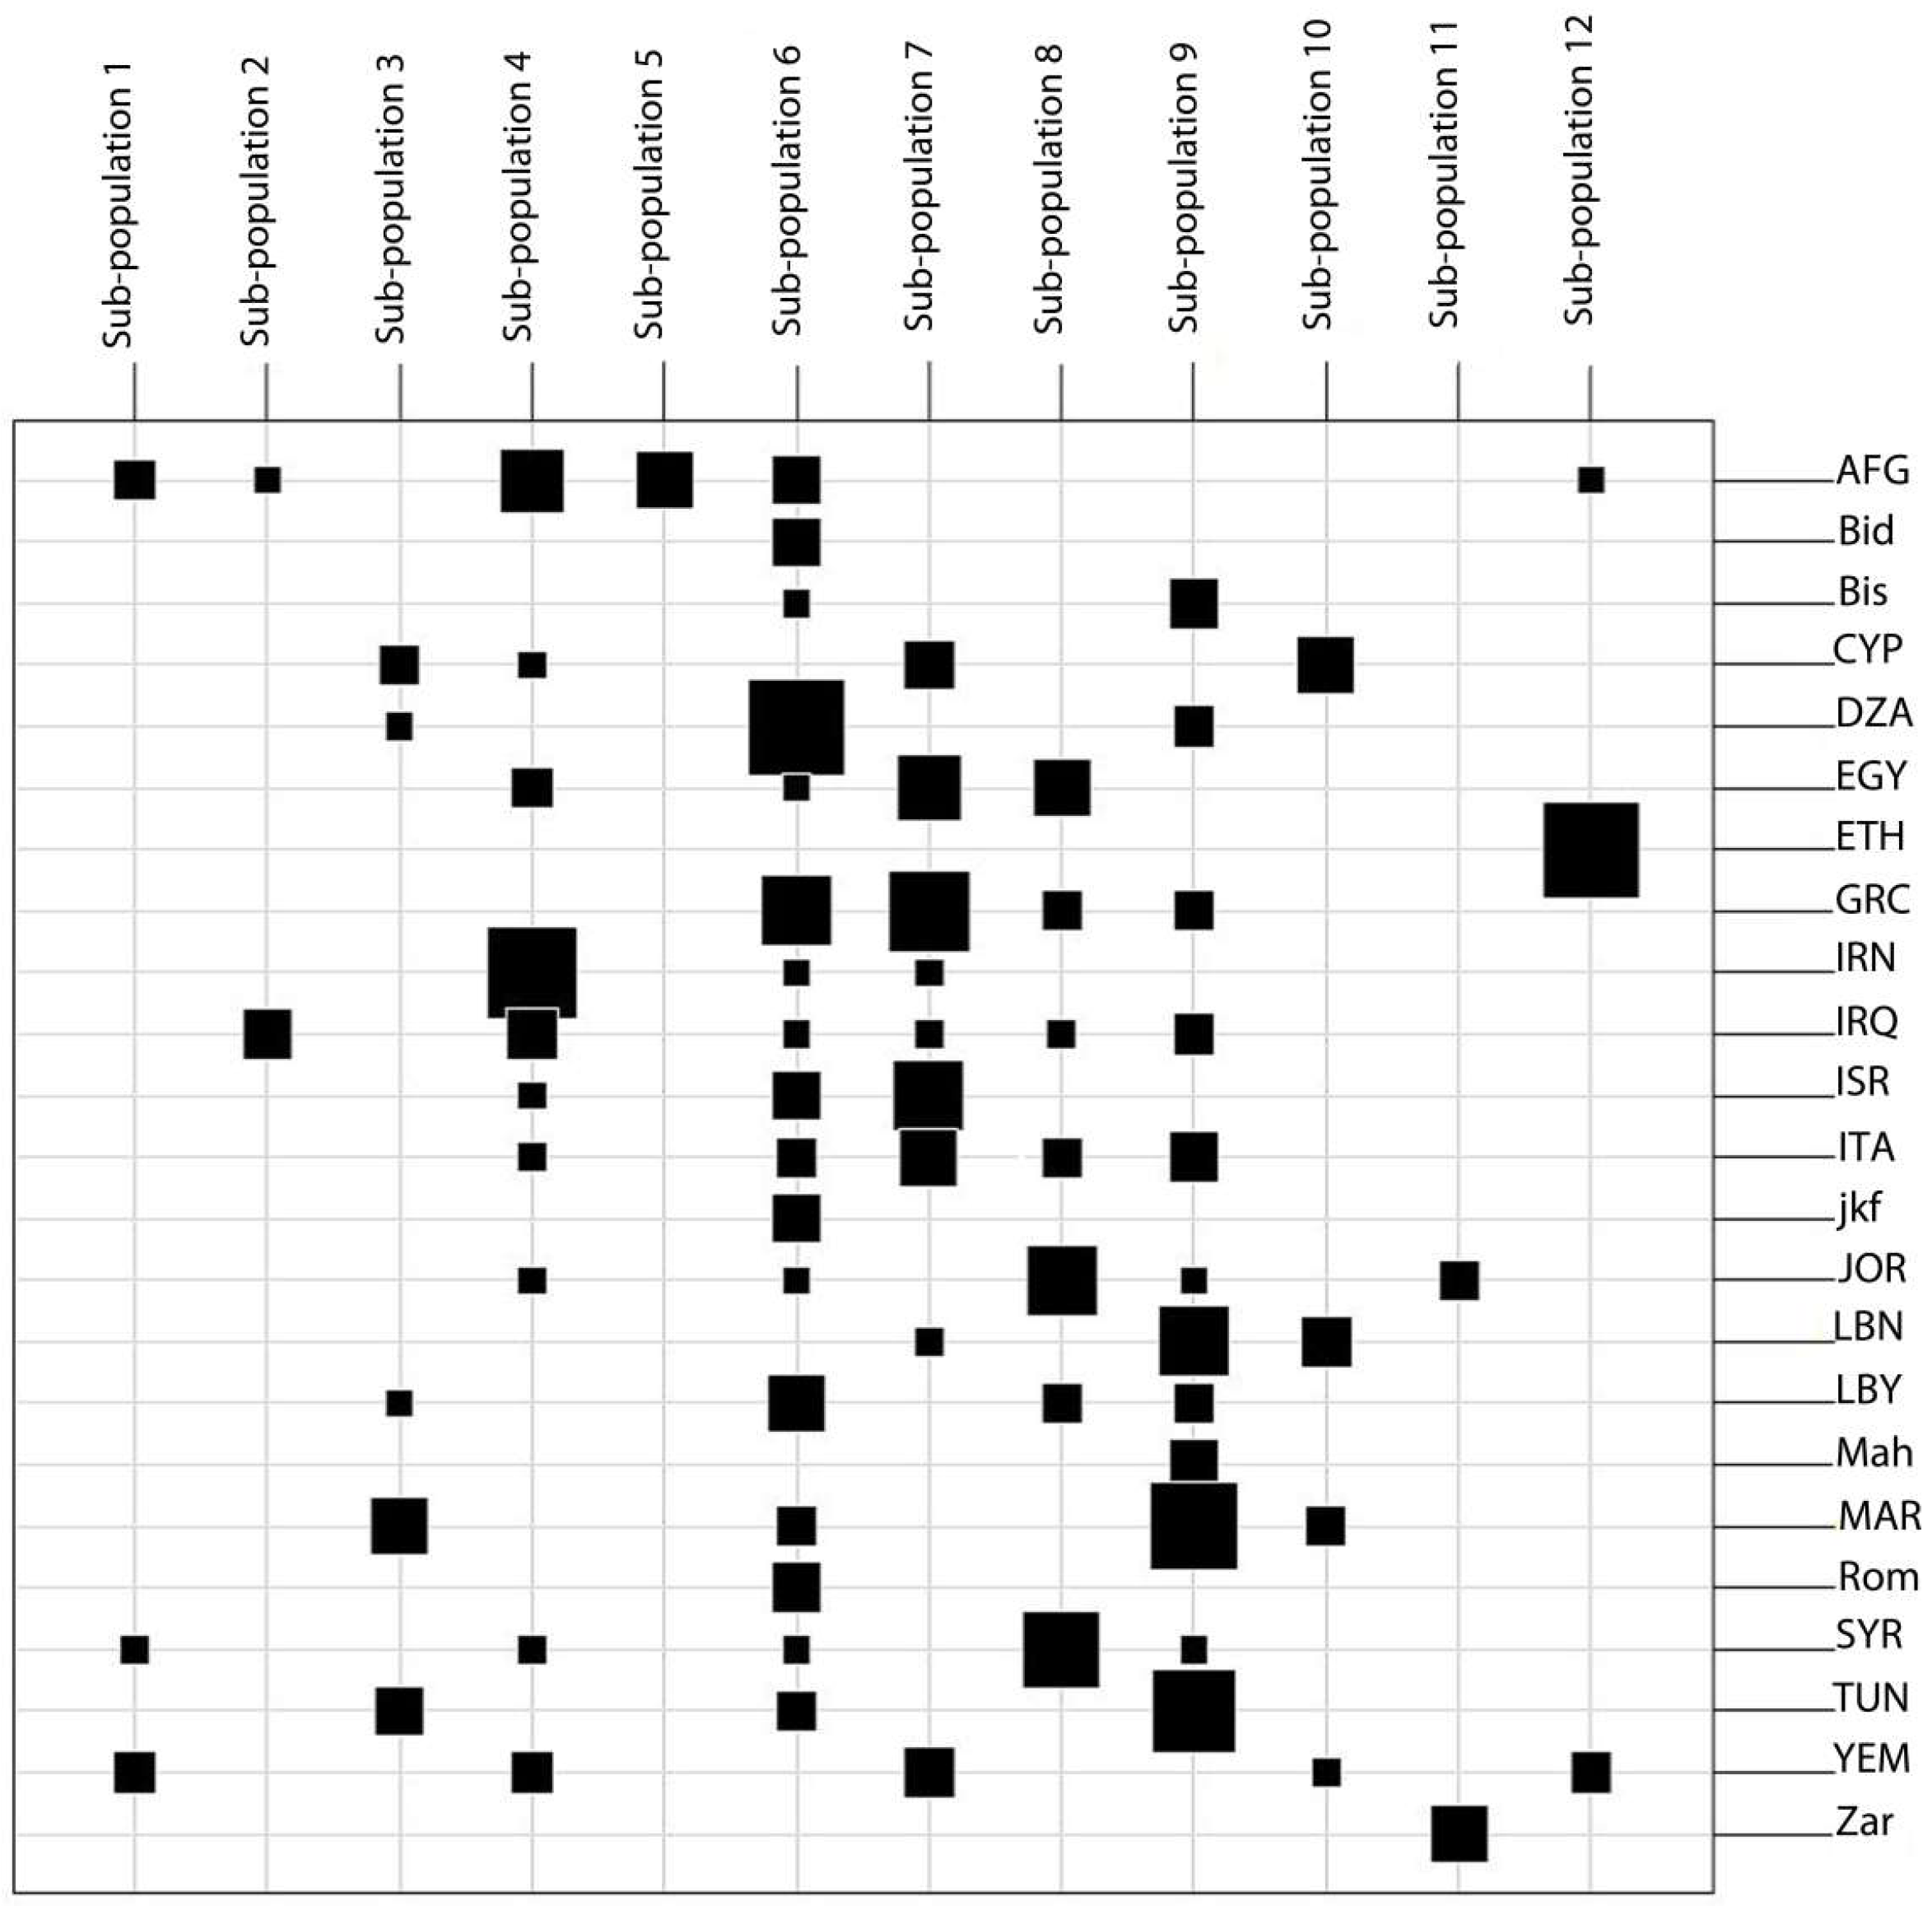
2.6. Comparison of Tunisian Landraces to Landraces from Mediterranean and West Asia Regions
3. Discussion
3.1. DArTseq Polymorphism of Tunisian Durum Wheat Landraces
3.2. Genetic Diversity and Population Structure of the Tunisian Durum Wheat Landraces
3.3. Origin of Tunisian Durum Wheat Landraces
3.4. Implications on Conservation and Use of Genetic Resources
4. Materials and Methods
4.1. Plant Material
- Set 1: A total of 196 pure lines issued from six Tunisian durum wheat landraces known as Mahmoudi, Rommani, Jenah Zarzoura, Bidi, Jenah Khotifa, and Biskri, collected from 5 regions between 2009 and 2010 and conserved by the National Genebank of Tunisia (NGBT), were used for assessing the intra and inter genetic diversity (Table 6). The landraces Mahmoudi and Jenah Zarzoura are constituted by 30 lines each, and Rommani and Bidi are constituted by 33 lines each. The landraces Biskri and Jenah Khotifa are represented by two populations each: Biskri1 (31), Biskri2 (7), Jenah Khotifa1 (29), and Jenah Khotifa2 (3).
- Set 2: A total of 40 accessions composed of six improved varieties released in Tunisia, seven ICARDA/CIMMYT elite inbred lines and 27 Tunisian durum wheat landraces (15 landraces are represented by one accession; Jenah Khotifa, Biskri, and Chetla are represented by two accessions each; Bidi and Rommani are represented by three accessions each) were used for identification of potential mis-classified lines from Set 1 and for comparison between Tunisian durum wheat landraces and improved germplasm (Table 7).
- Set 3: A total of 207 durum wheat landraces collected from Mediterranean and West Asia countries—Morocco (17), Algeria (14), Tunisia (13), Libya (9), Egypt (12), Lebanon (10), Syria (11), Jordan (11), Israel/Palestine (10), Iraq (11), Iran (12), Afghanistan (16), Yemen (10), Greece (18), Cyprus (10), Italy (12), and Ethiopia (11)—randomly chosen from the ICARDA genebank collection along with four lines representing each Tunisian landraces from Set 1 were used for a genetic relationship study ( Table 8).
4.2. Genotypic Characterization Using the DArtseq™ Method
4.3. DArTseq Markers and Cluster Analysis
4.4. Population Structure and Genetic Differentiation
Author Contributions
Funding
Acknowledgments
Conflicts of Interest
Abbreviations
| DarTseq | diversity array technology sequencing |
| DAPC | discriminant analysis of principal components |
| AMOVA | analysis of molecular variance |
| RE | restriction enzyme |
References
- Gioia, T.; Nagel, K.A.; Beleggia, R.; Fragasso, M.; Ficco, D.B.M.; Pieruschka, R.; De Vita, P.; Fiorani, F.; Papa, R. Impact of Domestication on the Phenotypic Architecture of Durum Wheat under Contrasting Nitrogen Fertilization. J. Exp. Bot. 2015, 66, 5519–5530. [Google Scholar] [CrossRef] [PubMed]
- The World Wheat Book: A History of Wheat Breeding; Bonjean, A.P.; Angus, W.J.; van Ginkel, M. (Eds.) Lavoisier: Paris, France, 2016; Volume 3, ISBN 9782743020910. [Google Scholar]
- Daaloul, A.; Harrabi, M.; Amara, H. Evaluation de la collection nationale de blé dur. In Revure de l’INAT; numéro spécial; INAT: Tunis, Tunisia, 1998; pp. 337–358. (In French) [Google Scholar]
- Deghaïs, M.; Kouki M, M.; Gharbi M, M.; El Felah, M. Les Variétés de Céréales Cultivées en Tunisie (blé dur, blé Tendre, orge et Triticale); INRAT: Tunis, Tunisia, 2007. (In French) [Google Scholar]
- Dvorak, J.; Akhunov, E.D. Tempos of Gene Locus Deletions and Duplications and Their Relationship to Recombination Rate During Diploid and Polyploid Evolution in the Aegilops-Triticum Alliance. Genetics 2005, 171, 323–332. [Google Scholar] [CrossRef] [PubMed]
- Feldman, M.; Levy, A.A. Allopolyploidy—A Shaping Force in the Evolution of Wheat Genomes. Cytogenet. Genome Res. 2005, 109, 250–258. [Google Scholar] [CrossRef] [PubMed]
- Salamini, F.; Özkan, H.; Brandolini, A.; Schäfer-Pregl, R.; Martin, W. Genetics and Geography of Wild Cereal Domestication in the near East. Nat. Rev. Genet. 2002, 3, 429–441. [Google Scholar] [CrossRef] [PubMed]
- Matsuoka, Y. Evolution of Polyploid Triticum Wheats under Cultivation: The Role of Domestication, Natural Hybridization and Allopolyploid Speciation in Their Diversification. Plant Cell Physiol. 2011, 52, 750–764. [Google Scholar] [CrossRef] [PubMed]
- Zohary, D.; Hopf, M. Domestication of Plants in the Old World: The Origin and Spread of Cultivated Plants in West Asia, Europe, and the Nile Valley, 3rd ed.; Oxford University Press: Oxford, UK, 2000; ISBN 9780198503576 9780198503569. [Google Scholar]
- Vavilov, N.I. The Origin, Variation, Immunity and Breeding of Cultivated Plants. Soil Sci. 1951, 72, 482. [Google Scholar] [CrossRef]
- Boeuf, F. Le blé en Tunisie: La Plante. Le Milieu Physico-Chimique; Société Anonyme de L’Imprimerie Rapide de Tunis: Tunis, Tunisia, 1932; Volume 1. [Google Scholar]
- Lala, S.; Amri, A.; Maxted, N. Towards the Conservation of Crop Wild Relative Diversity in North Africa: Checklist, Prioritisation and Inventory. Genet. Resour. Crop Evol. 2018, 65, 113–124. [Google Scholar] [CrossRef]
- Khoufi, S. Morphological and Molecular Characterization of Six of the Most Frequently Cultivated Hard Wheat Varieties in Tunisia. J. Plant Breed. Crop Sci. 2012, 4. [Google Scholar] [CrossRef]
- Lopes, M.S.; El-Basyoni, I.; Baenziger, P.S.; Singh, S.; Royo, C.; Ozbek, K.; Aktas, H.; Ozer, E.; Ozdemir, F.; Manickavelu, A.; et al. Exploiting Genetic Diversity from Landraces in Wheat Breeding for Adaptation to Climate Change. J. Exp. Bot. 2015, 66, 3477–3486. [Google Scholar] [CrossRef]
- Sourour, A.; Chahine, K.; Youssef, T.; Olfa, S.; Hajer, S. Phenotypic Diversity of Tunisian Durum Wheat Landraces. Afr. Crop Sci. J. 2010, 18. [Google Scholar] [CrossRef]
- Sourour, A.; Hajer, S. Distribution and Phenotypic Variability Aspects of Some Quantitiative Traits among Durum Wheat Accessiions. Afr. Crop Sci. J. 2010, 16. [Google Scholar] [CrossRef]
- Ya, N.; Raveendar, S.; Bayarsukh, N.; Ya, M.; Lee, J.-R.; Lee, K.-J.; Shin, M.-J.; Cho, G.-T.; Ma, K.-H.; Lee, G.-A. Genetic Diversity and Population Structure of Mongolian Wheat Based on SSR Markers: Implications for Conservation and Management. Plant Breed. Biotechnol. 2017, 5, 213–220. [Google Scholar] [CrossRef] [Green Version]
- Sohail, Q.; Manickavelu, A.; Ban, T. Genetic Diversity Analysis of Afghan Wheat Landraces (Triticum aestivum) Using DArT Markers. Genet. Resour. Crop Evol. 2015, 62, 1147–1157. [Google Scholar] [CrossRef]
- Khan, M.K.; Pandey, A.; Choudhary, S.; Hakki, E.E.; Akkaya, M.S.; Thomas, G. From RFLP to DArT: Molecular Tools for Wheat (Triticum spp.) Diversity Analysis. Genet. Resour. Crop Evol. 2014, 61, 1001–1032. [Google Scholar] [CrossRef]
- Kehel, Z.; Garcia-Ferrer, A.; Nachit, M.M. Using Bayesian and Eigen Approaches to Study Spatial Genetic Structure of Moroccan and Syrian Durum Wheat Landraces. AJMB 2013, 03, 17–31. [Google Scholar] [CrossRef]
- Medini, M.; Hamza, S.; Rebai, A.; Baum, M. Analysis of Genetic Diversity in Tunisian Durum Wheat Cultivars and Related Wild Species by SSR and AFLP Markers. Genet. Resour. Crop Evol. 2005, 52, 21–31. [Google Scholar] [CrossRef]
- Maccaferri, M.; Ricci, A.; Salvi, S.; Milner, S.G.; Noli, E.; Martelli, P.L.; Casadio, R.; Akhunov, E.; Scalabrin, S.; Vendramin, V.; et al. A High-Density, SNP-Based Consensus Map of Tetraploid Wheat as a Bridge to Integrate Durum and Bread Wheat Genomics and Breeding. Plant Biotechnol. J. 2015, 13, 648–663. [Google Scholar] [CrossRef]
- Borrill, P.; Adamski, N.; Uauy, C. Genomics as the Key to Unlocking the Polyploid Potential of Wheat. New Phytol. 2015, 208, 1008–1022. [Google Scholar] [CrossRef]
- Kabbaj, H.; Sall, A.T.; Al-Abdallat, A.; Geleta, M.; Amri, A.; Filali-Maltouf, A.; Belkadi, B.; Ortiz, R.; Bassi, F.M. Genetic Diversity within a Global Panel of Durum Wheat (Triticum durum) Landraces and Modern Germplasm Reveals the History of Alleles Exchange. Front. Plant Sci. 2017, 8, 1277. [Google Scholar] [CrossRef]
- Holtz, Y.; Ardisson, M.; Ranwez, V.; Besnard, A.; Leroy, P.; Poux, G.; Roumet, P.; Viader, V.; Santoni, S.; David, J. Genotyping by Sequencing Using Specific Allelic Capture to Build a High-Density Genetic Map of Durum Wheat. PLoS ONE 2016, 11, e0154609. [Google Scholar] [CrossRef]
- He, J.; Zhao, X.; Laroche, A.; Lu, Z.-X.; Liu, H.; Li, Z. Genotyping-by-Sequencing (GBS), an Ultimate Marker-Assisted Selection (MAS) Tool to Accelerate Plant Breeding. Front. Plant Sci. 2014, 5, 484. [Google Scholar] [CrossRef]
- Sieber, A.-N.; Longin, C.F.H.; Würschum, T. Molecular Characterization of Winter Durum Wheat (Triticum durum) Based on a Genotyping-by-Sequencing Approach. Plant Genet. Resour. 2017, 15, 36–44. [Google Scholar] [CrossRef]
- Alipour, H.; Bihamta, M.R.; Mohammadi, V.; Peyghambari, S.A.; Bai, G.; Zhang, G. Genotyping-by-Sequencing (GBS) Revealed Molecular Genetic Diversity of Iranian Wheat Landraces and Cultivars. Front. Plant Sci. 2017, 8, 1293. [Google Scholar] [CrossRef]
- Wenzl, P.; Carling, J.; Kudrna, D.; Jaccoud, D.; Huttner, E.; Kleinhofs, A.; Kilian, A. Diversity Arrays Technology (DArT) for Whole-Genome Profiling of Barley. Proc. Natl. Acad. Sci. USA 2004, 101, 9915–9920. [Google Scholar] [CrossRef] [PubMed]
- Akbari, M.; Wenzl, P.; Caig, V.; Carling, J.; Xia, L.; Yang, S.; Uszynski, G.; Mohler, V.; Lehmensiek, A.; Kuchel, H.; et al. Diversity Arrays Technology (DArT) for High-Throughput Profiling of the Hexaploid Wheat Genome. Theor. Appl. Genet. 2006, 113, 1409–1420. [Google Scholar] [CrossRef]
- Sansaloni, C.; Petroli, C.; Jaccoud, D.; Carling, J.; Detering, F.; Grattapaglia, D.; Kilian, A. Diversity Arrays Technology (DArT) and next-Generation Sequencing Combined: Genome-Wide, High Throughput, Highly Informative Genotyping for Molecular Breeding of Eucalyptus. BMC Proc. 2011, 5 (Suppl. 7), P54. [Google Scholar] [CrossRef]
- Baloch, F.S.; Alsaleh, A.; Shahid, M.Q.; Çiftçi, V.E.; Sáenz de Miera, L.; Aasim, M.; Nadeem, M.A.; Aktaş, H.; Özkan, H.; Hatipoğlu, R. A Whole Genome DArTseq and SNP Analysis for Genetic Diversity Assessment in Durum Wheat from Central Fertile Crescent. PLoS ONE 2017, 12, e0167821. [Google Scholar] [CrossRef] [PubMed]
- Li, H.; Vikram, P.; Singh, R.P.; Kilian, A.; Carling, J.; Song, J.; Burgueno-Ferreira, J.A.; Bhavani, S.; Huerta-Espino, J.; Payne, T.; et al. A High Density GBS Map of Bread Wheat and Its Application for Dissecting Complex Disease Resistance Traits. BMC Genom. 2015, 16. [Google Scholar] [CrossRef]
- Yang, X.; Ren, R.; Ray, R.; Xu, J.; Li, P.; Zhang, M.; Liu, G.; Yao, X.; Kilian, A. Genetic Diversity and Population Structure of Core Watermelon (Citrullus lanatus) Genotypes Using DArTseq-Based SNPs. Plant Genet. Resour. 2016, 14, 226–233. [Google Scholar] [CrossRef]
- Valdisser, P.A.M.R.; Pereira, W.J.; Almeida Filho, J.E.; Müller, B.S.F.; Coelho, G.R.C.; de Menezes, I.P.P.; Vianna, J.P.G.; Zucchi, M.I.; Lanna, A.C.; Coelho, A.S.G.; et al. In-Depth Genome Characterization of a Brazilian Common Bean Core Collection Using DArTseq High-Density SNP Genotyping. BMC Genom. 2017, 18. [Google Scholar] [CrossRef]
- Marcotuli, I.; Gadaleta, A.; Mangini, G.; Signorile, A.; Zacheo, S.; Blanco, A.; Simeone, R.; Colasuonno, P. Development of a High-Density SNP-Based Linkage Map and Detection of QTL for β-Glucans, Protein Content, Grain Yield per Spike and Heading Time in Durum Wheat. Int. J. Mol. Sci. 2017, 18, 1329. [Google Scholar] [CrossRef] [PubMed]
- Patil, R.M.; Oak, M.D.; Tamhankar, S.A.; Sourdille, P.; Rao, V.S. Mapping and Validation of a Major QTL for Yellow Pigment Content on 7AL in Durum Wheat (Triticum turgidum L. ssp. durum). Mol. Breed 2008, 21, 485–496. [Google Scholar] [CrossRef]
- Colasuonno, P.; Lozito, M.L.; Marcotuli, I.; Nigro, D.; Giancaspro, A.; Mangini, G.; De Vita, P.; Mastrangelo, A.M.; Pecchioni, N.; Houston, K.; et al. The Carotenoid Biosynthetic and Catabolic Genes in Wheat and Their Association with Yellow Pigments. BMC Genom. 2017, 18. [Google Scholar] [CrossRef]
- Turki, N.; Shehzad, T.; Harrabi, M.; Okuno, K. Detection of QTLs Associated with Salinity Tolerance in Durum Wheat Based on Association Analysis. Euphytica 2015, 201, 29–41. [Google Scholar] [CrossRef]
- Mangini, G.; Gadaleta, A.; Colasuonno, P.; Marcotuli, I.; Signorile, A.M.; Simeone, R.; De Vita, P.; Mastrangelo, A.M.; Laidò, G.; Pecchioni, N.; et al. Genetic Dissection of the Relationships between Grain Yield Components by Genome-Wide Association Mapping in a Collection of Tetraploid Wheats. PLoS ONE 2018, 13, e0190162. [Google Scholar] [CrossRef]
- Chen, T.; Tantasawat, P.A.; Wang, W.; Gao, X.; Zhang, L. Population Structure of Chinese Southwest Wheat Germplasms Resistant to Stripe Rust and Powdery Mildew Using the DArT-Seq Technique. Cienc. Rural 2018, 48. [Google Scholar] [CrossRef]
- Nadeem, M.A.; Nawaz, M.A.; Shahid, M.Q.; Doğan, Y.; Comertpay, G.; Yıldız, M.; Hatipoğlu, R.; Ahmad, F.; Alsaleh, A.; Labhane, N.; et al. DNA Molecular Markers in Plant Breeding: Current Status and Recent Advancements in Genomic Selection and Genome Editing. Biotechnol. Biotechnol. Equip. 2018, 32, 261–285. [Google Scholar] [CrossRef]
- Ren, J.; Sun, D.; Chen, L.; You, F.; Wang, J.; Peng, Y.; Nevo, E.; Sun, D.; Luo, M.-C.; Peng, J. Genetic Diversity Revealed by Single Nucleotide Polymorphism Markers in a Worldwide Germplasm Collection of Durum Wheat. Int. J. Mol. Sci. 2013, 14, 7061–7088. [Google Scholar] [CrossRef] [Green Version]
- Botstein, D.; White, R.L.; Skolnick, M.; Davis, R.W. Construction of a Genetic Linkage Map in Man Using Restriction Fragment Length Polymorphisms. Am. J. Hum. Genet. 1980, 32, 314–331. [Google Scholar]
- Soriano, J.M.; Villegas, D.; Sorrells, M.E.; Royo, C. Durum Wheat Landraces from East and West Regions of the Mediterranean Basin Are Genetically Distinct for Yield Components and Phenology. Front. Plant Sci. 2018, 9, 80. [Google Scholar] [CrossRef]
- Oliveira, H.R.; Hagenblad, J.; Leino, M.W.; Leigh, F.J.; Lister, D.L.; Penã-Chocarro, L.; Jones, M.K. Wheat in the Mediterranean Revisited – Tetraploid Wheat Landraces Assessed with Elite Bread Wheat Single Nucleotide Polymorphism Markers. BMC Genet. 2014, 15, 54. [Google Scholar] [CrossRef] [PubMed]
- Miège, E. Les principales espèces et variétés de Blé cultivées en Afrique du Nord (Suite et Fin). Revue Internationale de Botanique Appliquée et d’Agriculture Tropicale 1950, 30, 203–215. (In French) [Google Scholar] [CrossRef] [Green Version]
- Jombart, T.; Devillard, S.; Balloux, F. Discriminant Analysis of Principal Components: A New Method for the Analysis of Genetically Structured Populations. BMC Genet. 2010, 11, 94. [Google Scholar] [CrossRef] [PubMed]
- Soriano, J.M.; Villegas, D.; Aranzana, M.J.; García del Moral, L.F.; Royo, C. Genetic Structure of Modern Durum Wheat Cultivars and Mediterranean Landraces Matches with Their Agronomic Performance. PLoS ONE 2016, 11, e0160983. [Google Scholar] [CrossRef]
- Ruiz, M.; Giraldo, P.; Royo, C.; Villegas, D.; Aranzana, M.J.; Carrillo, J.M. Diversity and Genetic Structure of a Collection of Spanish Durum Wheat Landraces. Crop Sci. 2012, 52, 2262. [Google Scholar] [CrossRef] [Green Version]
- Eltaher, S.; Sallam, A.; Belamkar, V.; Emara, H.A.; Nower, A.A.; Salem, K.F.M.; Poland, J.; Baenziger, P.S. Genetic Diversity and Population Structure of F3:6 Nebraska Winter Wheat Genotypes Using Genotyping-By-Sequencing. Front. Genet. 2018, 9, 76. [Google Scholar] [CrossRef]
- Jaradat, A. Wheat Landraces: A Mini Review. Emir. J. Food Agric. 2013, 25, 20. [Google Scholar] [CrossRef]
- Mangini, G.; Margiotta, B.; Marcotuli, I.; Signorile, M.A.; Gadaleta, A.; Blanco, A. Genetic Diversity and Phenetic Analysis in Wheat (Triticum turgidum subsp. durum and Triticum aestivum subsp. aestivum) Landraces Based on SNP Markers. Genet. Resour. Crop Evol. 2017, 64, 1269–1280. [Google Scholar] [CrossRef]
- Sahri, A.; Chentoufi, L.; Arbaoui, M.; Ardisson, M.; Belqadi, L.; Birouk, A.; Roumet, P.; Muller, M.-H. Towards a Comprehensive Characterization of Durum Wheat Landraces in Moroccan Traditional Agrosystems: Analysing Genetic Diversity in the Light of Geography, Farmers’ Taxonomy and Tetraploid Wheat Domestication History. BMC Evol. Biol. 2014, 14. [Google Scholar] [CrossRef]
- Mac Key, J. Wheat: Its concept, evolution and taxonomy. In Durum Wheat Breeding: Current Approaches and Future Strategies; Royo, C., Nachit, M., Di Fonzo, N., Araus, J.L., Pfeiffer, W.H., Slafer, G.A., Eds.; Food Products Press: Binghamton, NY, USA, 2005; pp. 3–61. ISBN 9781482277883. [Google Scholar]
- Moragues, M.; Moralejo, M.; Sorrells, M.E.; Royo, C. Dispersal of Durum Wheat [Triticum turgidum L. ssp. turgidum Convar. durum (Desf.) MacKey] Landraces across the Mediterranean Basin Assessed by AFLPs and Microsatellites. Genet. Resour. Crop Evol. 2007, 54, 1133–1144. [Google Scholar] [CrossRef]
- Oliveira, H.R.; Campana, M.G.; Jones, H.; Hunt, H.V.; Leigh, F.; Redhouse, D.I.; Lister, D.L.; Jones, M.K. Tetraploid Wheat Landraces in the Mediterranean Basin: Taxonomy, Evolution and Genetic Diversity. PLoS ONE 2012, 7, e37063. [Google Scholar] [CrossRef] [PubMed]
- Nazco, R.; Villegas, D.; Ammar, K.; Peña, R.J.; Moragues, M.; Royo, C. Can Mediterranean Durum Wheat Landraces Contribute to Improved Grain Quality Attributes in Modern Cultivars? Euphytica 2012, 185, 1–17. [Google Scholar] [CrossRef]
- Essid, M.Y. Chapter 2. History of Mediterranean food, CIHEAM ed. In MediTERRA 2012 (english): The Mediterranean Diet for Sustainable Regional Development; Presses de Sciences Po (P.F.N.S.P.): France, Paris, 2012; pp. 51–69. [Google Scholar]
- Perrino, P.; Porceddu, E. Wheat Genetic Resources in Ethiopia and the Mediterranean Region. In Wheat Genetic Resources: Meeting Diverse Needs; John Wiley & Sons: Chichester, UK, 1990; Volume 27, pp. 161–178, 364–365. ISBN 0471928801. [Google Scholar]
- Feldman, M. Origin of Cultivated Wheat. In The World Wheat Book: A History of Wheat Breeding; Bonjean, A.P., Angus, W.J., Eds.; Lavoisier: Paris, France, 2001; pp. 3–56. [Google Scholar]
- Thompson, D.A.W. Wheat in Antiquity - Naum Jasny: The Wheats of Classical Antiquity. (Johns Hopkins University Studies in Historical and Political Science, Series LXII, No. 3.) Pp. 176; 2 Plates. Baltimore: Johns Hopkins Press, 1944. Paper, $1.75. Class. Rev. 1946, 60, 120–122. [Google Scholar] [CrossRef]
- Zaharieva, M.; Bonjean, A.; Monneveux, P. Saharan Wheats: Before They Disappear. Genet. Resour. Crop Evol. 2014, 61, 1065–1084. [Google Scholar] [CrossRef]
- Hoisington, D.; Khairallah, M.; Gonzalez-de-Leon, D. Laboratory Protocols, CIMMYT Applied Molecular Genetics Laboratory, 2nd ed.; CIMMYT: Texcoco, Mexico, 1994; Available online: http://repository.cimmyt.org/xmlui/bitstream/handle/10883/1333/91195.pdf (accessed on 20 April 2015).
- R core team. R: A Language and Environment for Statistical Computing; R Foundation for Statistical Computing: Vienna, Austria, 2015; Available online: http://www.R-project.org/ (accessed on 3 November 2018).
- Gao, X.; Martin, E.R. Using Allele Sharing Distance for Detecting Human Population Stratification. Hum. Hered 2009, 68, 182–191. [Google Scholar] [CrossRef] [PubMed] [Green Version]
- Ward, J.H. Hierarchical Grouping to Optimize an Objective Function. J. Am. Stat. Assoc. 1963, 58, 236–244. [Google Scholar] [CrossRef] [Green Version]
- Jombart, T. Multivariate Analysis of Genetic Data: Exploring Group Diversity. Available online: http://adegenet.r-forge.r-project.org/files/PRstats/practical-MVAgroups.1.0.pdf (accessed on 18 August 2016).
- Schwarz, G. Estimating the Dimension of a Model. Ann. Stat. 1978, 6, 461–464. [Google Scholar] [CrossRef]
- Excoffier, L.; Smouse, P.E.; Quattro, J.M. Analysis of Molecular Variance Inferred from Metric Distances among DNA Haplotypes: Application to Human Mitochondrial DNA Restriction Data. Genetics 1992, 131, 479–491. [Google Scholar]
- Reynolds, J.; Weir, B.S.; Cockerham, C.C. Estimation of The Coancestry Coefficient: Basis For A Short-Term Genetic Distance. Genetics 1983, 105, 767–779. [Google Scholar]
- Wright, S. Coefficients of Inbreeding and Relationship. Am. Nat. 1922, 56, 330–338. [Google Scholar] [CrossRef]


| A Genome | B Genome | |||||
|---|---|---|---|---|---|---|
| Chromosome | n | He | Ho | n | He | Ho |
| 1 | 562 | 0.27 | 0.15 | 658 | 0.26 | 0.14 |
| 2 | 569 | 0.25 | 0.14 | 864 | 0.27 | 0.13 |
| 3 | 633 | 0.24 | 0.14 | 777 | 0.26 | 0.14 |
| 4 | 511 | 0.24 | 0.16 | 429 | 0.25 | 0.16 |
| 5 | 587 | 0.24 | 0.18 | 639 | 0.24 | 0.16 |
| 6 | 452 | 0.25 | 0.15 | 573 | 0.28 | 0.15 |
| 7 | 797 | 0.25 | 0.14 | 719 | 0.26 | 0.15 |
| Total | 4201 | 4659 | ||||
| Unassigned | 7324 | 0.25 | 0.18 | |||
| Variance | |||
|---|---|---|---|
| Number of Sub-Populations | Among Landraces (%) | Among Lines within Landrace (%) | Among Lines (%) |
| K = 2 | 31.92 | 11.32 | 56.76 |
| K = 3 | 28.75 | 5.60 | 65.65 |
| K = 4 | 31.29 | 1.59 | 67.12 |
| K = 5 | 31.77 | 0.00 | 68.23 |
| K = 6 | 31.71 | 0.00 | 68.29 |
| K = 7 | 31.51 | 0.00 | 68.49 |
| Real groups | 28.79 | 0.82 | 70.39 |
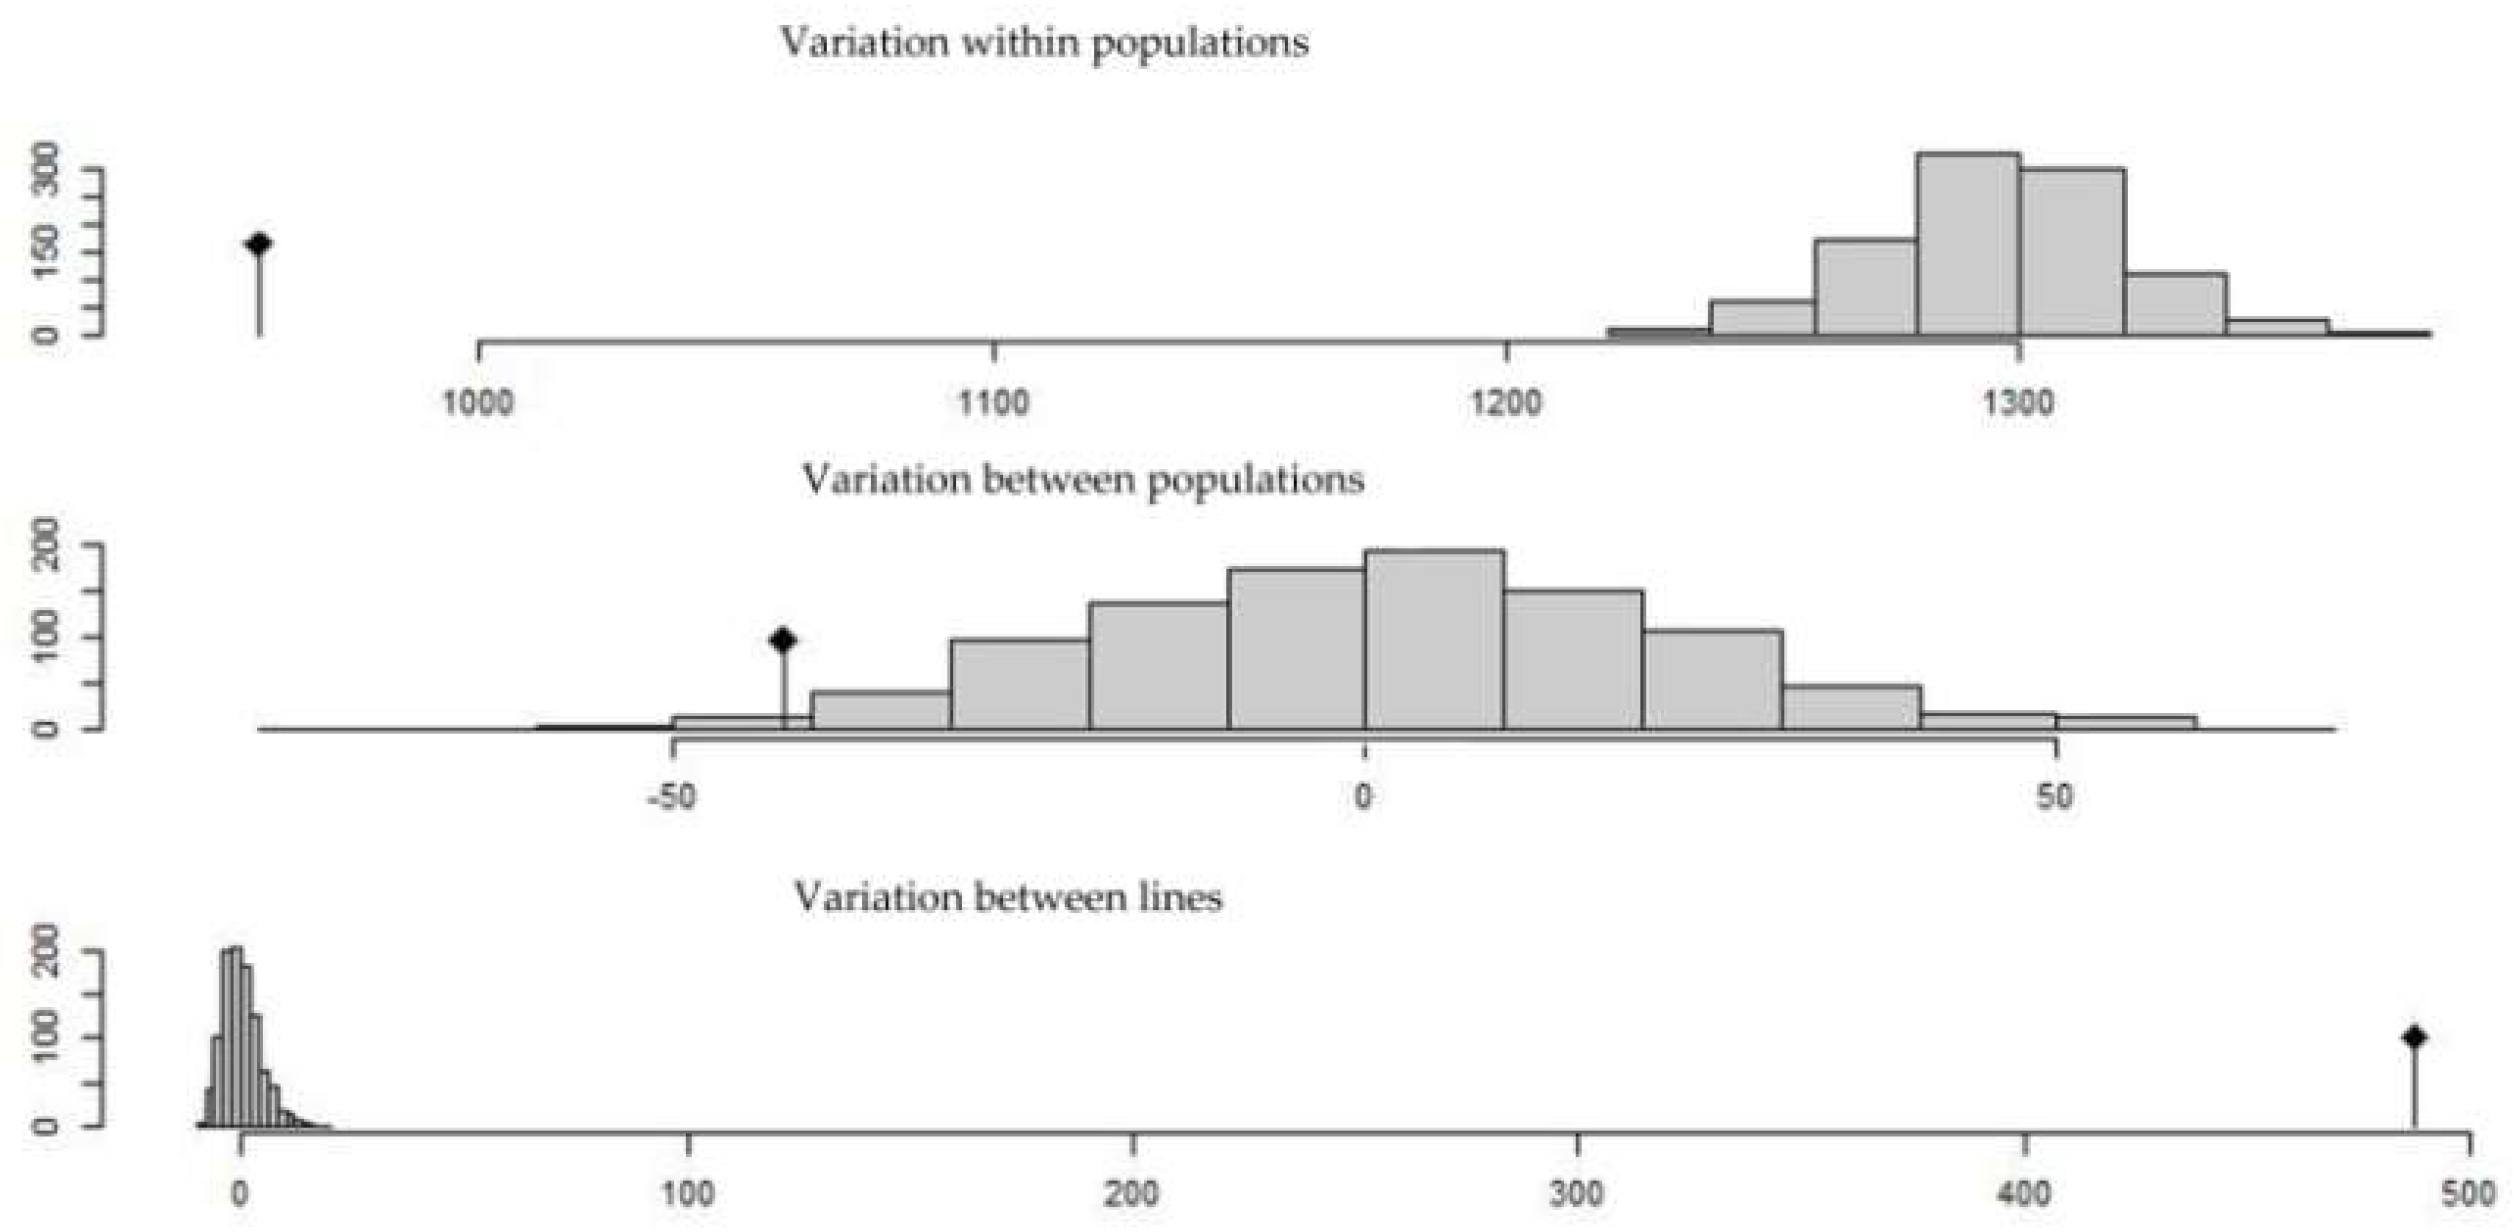
| Subdivision Strata | Variance Components | Percentage |
|---|---|---|
| Variations between K = 2 | 271.63 | 17.18 |
| Variations between K = 3 and K = 2 | 0 | 0 |
| Variations between K = 4 and K = 3 | 13.46 | 0.85 |
| Variations between K = 5 and K = 4 | 420.82 | 26.62 |
| Variations between lines and K = 5 | 957.20 | 60.56 |
| Variations between lines | 0 | 0 |
| Total variations | 1580.63 | 100 |
| Landraces | BID | ZAR | BIS + MAH | JFK |
|---|---|---|---|---|
| ZAR | 0.816 | |||
| BIS+MAH | 0.624 | 0.730 | ||
| JFK | 0.557 | 0.682 | 0.466 | |
| ROM | 0.729 | 0.820 | 0.645 | 0.577 |
| Landraces | n | He | FST |
|---|---|---|---|
| ZAR | 32 | 0.27 | 0.05 |
| JFK | 25 | 0.20 | 0.47 |
| BID | 34 | 0.12 | 0.57 |
| ROM | 32 | 0.27 | 0.30 |
| BIS+MAH | 73 | 0.24 | 0.26 |
| Landraces | Number of Lines | Province |
|---|---|---|
| Bidi | 33 | Kairouan |
| Biskri1 | 31 | Gafsa (Djebel ouled ouhiba) |
| Biskri2 | 7 | Medenine (Zarzis) |
| Jenah Khotifa1 | 29 | Kairouan |
| Jenah Khotifa2 | 3 | Tozeur (El Frid) |
| Jenah Zarzoura | 30 | Matmata (Oasis of Mareth) |
| Mahmoudi | 30 | Gafsa (Snad) |
| Rommani | 33 | Gafsa (Djebel Ouled Ouhiba) |
| Total | 196 |
| Tunisian Landraces | N | Origin | Accession Identifier | Pedigree |
| Agili | 1 | NGBT | IG 23903 | - |
| Aouadi | 1 | NGBT | IG 23908 | - |
| Arbi | 1 | NGBT | IG 23903 | - |
| Azizi | 1 | NGBT | IG 23904 | - |
| Bayadha | 1 | NGBT | IG 23905 | - |
| Bidi | 3 | NGBT | IG 19553; IG 23906; IG 23929 | - |
| Biskri | 2 | NGBT | IG 19551; IG 23907 | - |
| Chetla | 2 | NGBT | IG 19555; IG 19557 | - |
| Chili | 1 | NGBT | IG 23908 | - |
| Derbessi | 1 | NGBT | IG 23909 | - |
| Hmira | 1 | NGBT | IG 23910 | - |
| Jneh khotifa | 2 | NGBT | IG 23915; IG 999 | - |
| Mahmoudi | 1 | NGBT | IG 23911 | - |
| Richi | 1 | NGBT | IG 23912 | - |
| Rommani | 3 | NGBT | IG 19552; IG 19554; IG 19558 | - |
| Sbei | 1 | NGBT | IG 23913 | - |
| Souri | 1 | NGBT | IG 23914 | - |
| Swabei algia | 1 | NGBT | IG 23916 | - |
| Tounsia | 1 | NGBT | IG 19559 | - |
| Ward bled | 1 | NGBT | IG 23917 | - |
| Tunisian Improved Varieties | N | Origin | Accession Identifier | Pedigree |
| Inrat69 * | 1 | NGBT | IG 23919 | Mahamoudi/Kyperounda |
| Karim * | 1 | NGBT | IG 23924 | Jori“S”/Anhinga“S”//Flamingo“S” |
| Khiar * | 1 | NGBT | IG 23922 | Chen/Altar 84 |
| Om Rabii * | 1 | NGBT | IG 23921 | Jori C69/ Hau |
| Nasr * | 1 | NGBT | IG 23923 | GoVZ512/Cit//Ruff/Fg/3/Pin/Gre//Trob |
| Maali * | 1 | NGBT | IG 23920 | CMH80A.1060/4/T.TURA/CMH74A.370//CMH77.774/3/YAV79/5/RAZZAK/6/DACK/YEL//KHIAR |
| ICARDA/CIMMYT Elite Lines | N | Origin | Accession Identifier | Pedigree |
| 1 | ICARDA | MCHCB-102 | OmRabi3/T.urartu500651/ch5//980947/3/Otb4//Ossl1/Rfm6 | |
| IcaJoudy1 * | 1 | ICARDA | MCHCB-100 | Atlast1/961081//Icasyr1 |
| Nachit * | 1 | ICARDA | DAWRYT-106 | Ameddkul1/T. dicoccoides Syrian collection//Loukos |
| Zeina4 * | 1 | ICARDA | MCHCB-154 | GdoVZ512/Cit//Ruff/Fg/3/Src3 |
| Louiza * | 1 | ICARDA | -- | Rscn39/Til1 |
| Ammar 6 * | 1 | ICARDA | IDYT37-5 | ICAMORTA0472/Ammar7 |
| Ammar 10 * | 1 | ICARDA | MCHCB-99 | Lgt3/Bicrecham1 |
| Geographical Origin | Number of Landraces |
|---|---|
| Afghanistan | 16 |
| Cyprus | 10 |
| Algeria | 14 |
| Egypt | 12 |
| Ethiopia | 11 |
| Greece | 18 |
| Iran | 12 |
| Iraq | 11 |
| Israel | 10 |
| Italy | 12 |
| Jordan | 11 |
| Lebanon | 10 |
| Libya | 9 |
| Morocco | 17 |
| Syria | 11 |
| Tunisia | 13 |
| Yemen | 10 |
© 2019 by the authors. Licensee MDPI, Basel, Switzerland. This article is an open access article distributed under the terms and conditions of the Creative Commons Attribution (CC BY) license (http://creativecommons.org/licenses/by/4.0/).
Share and Cite
Robbana, C.; Kehel, Z.; Ben Naceur, M.; Sansaloni, C.; Bassi, F.; Amri, A. Genome-Wide Genetic Diversity and Population Structure of Tunisian Durum Wheat Landraces Based on DArTseq Technology. Int. J. Mol. Sci. 2019, 20, 1352. https://doi.org/10.3390/ijms20061352
Robbana C, Kehel Z, Ben Naceur M, Sansaloni C, Bassi F, Amri A. Genome-Wide Genetic Diversity and Population Structure of Tunisian Durum Wheat Landraces Based on DArTseq Technology. International Journal of Molecular Sciences. 2019; 20(6):1352. https://doi.org/10.3390/ijms20061352
Chicago/Turabian StyleRobbana, Cyrine, Zakaria Kehel, M’barek Ben Naceur, Carolina Sansaloni, Filippo Bassi, and Ahmed Amri. 2019. "Genome-Wide Genetic Diversity and Population Structure of Tunisian Durum Wheat Landraces Based on DArTseq Technology" International Journal of Molecular Sciences 20, no. 6: 1352. https://doi.org/10.3390/ijms20061352