Unbiased Lipidomic Profiling of Triple-Negative Breast Cancer Tissues Reveals the Association of Sphingomyelin Levels with Patient Disease-Free Survival

 ,
,
Abstract
:1. Introduction
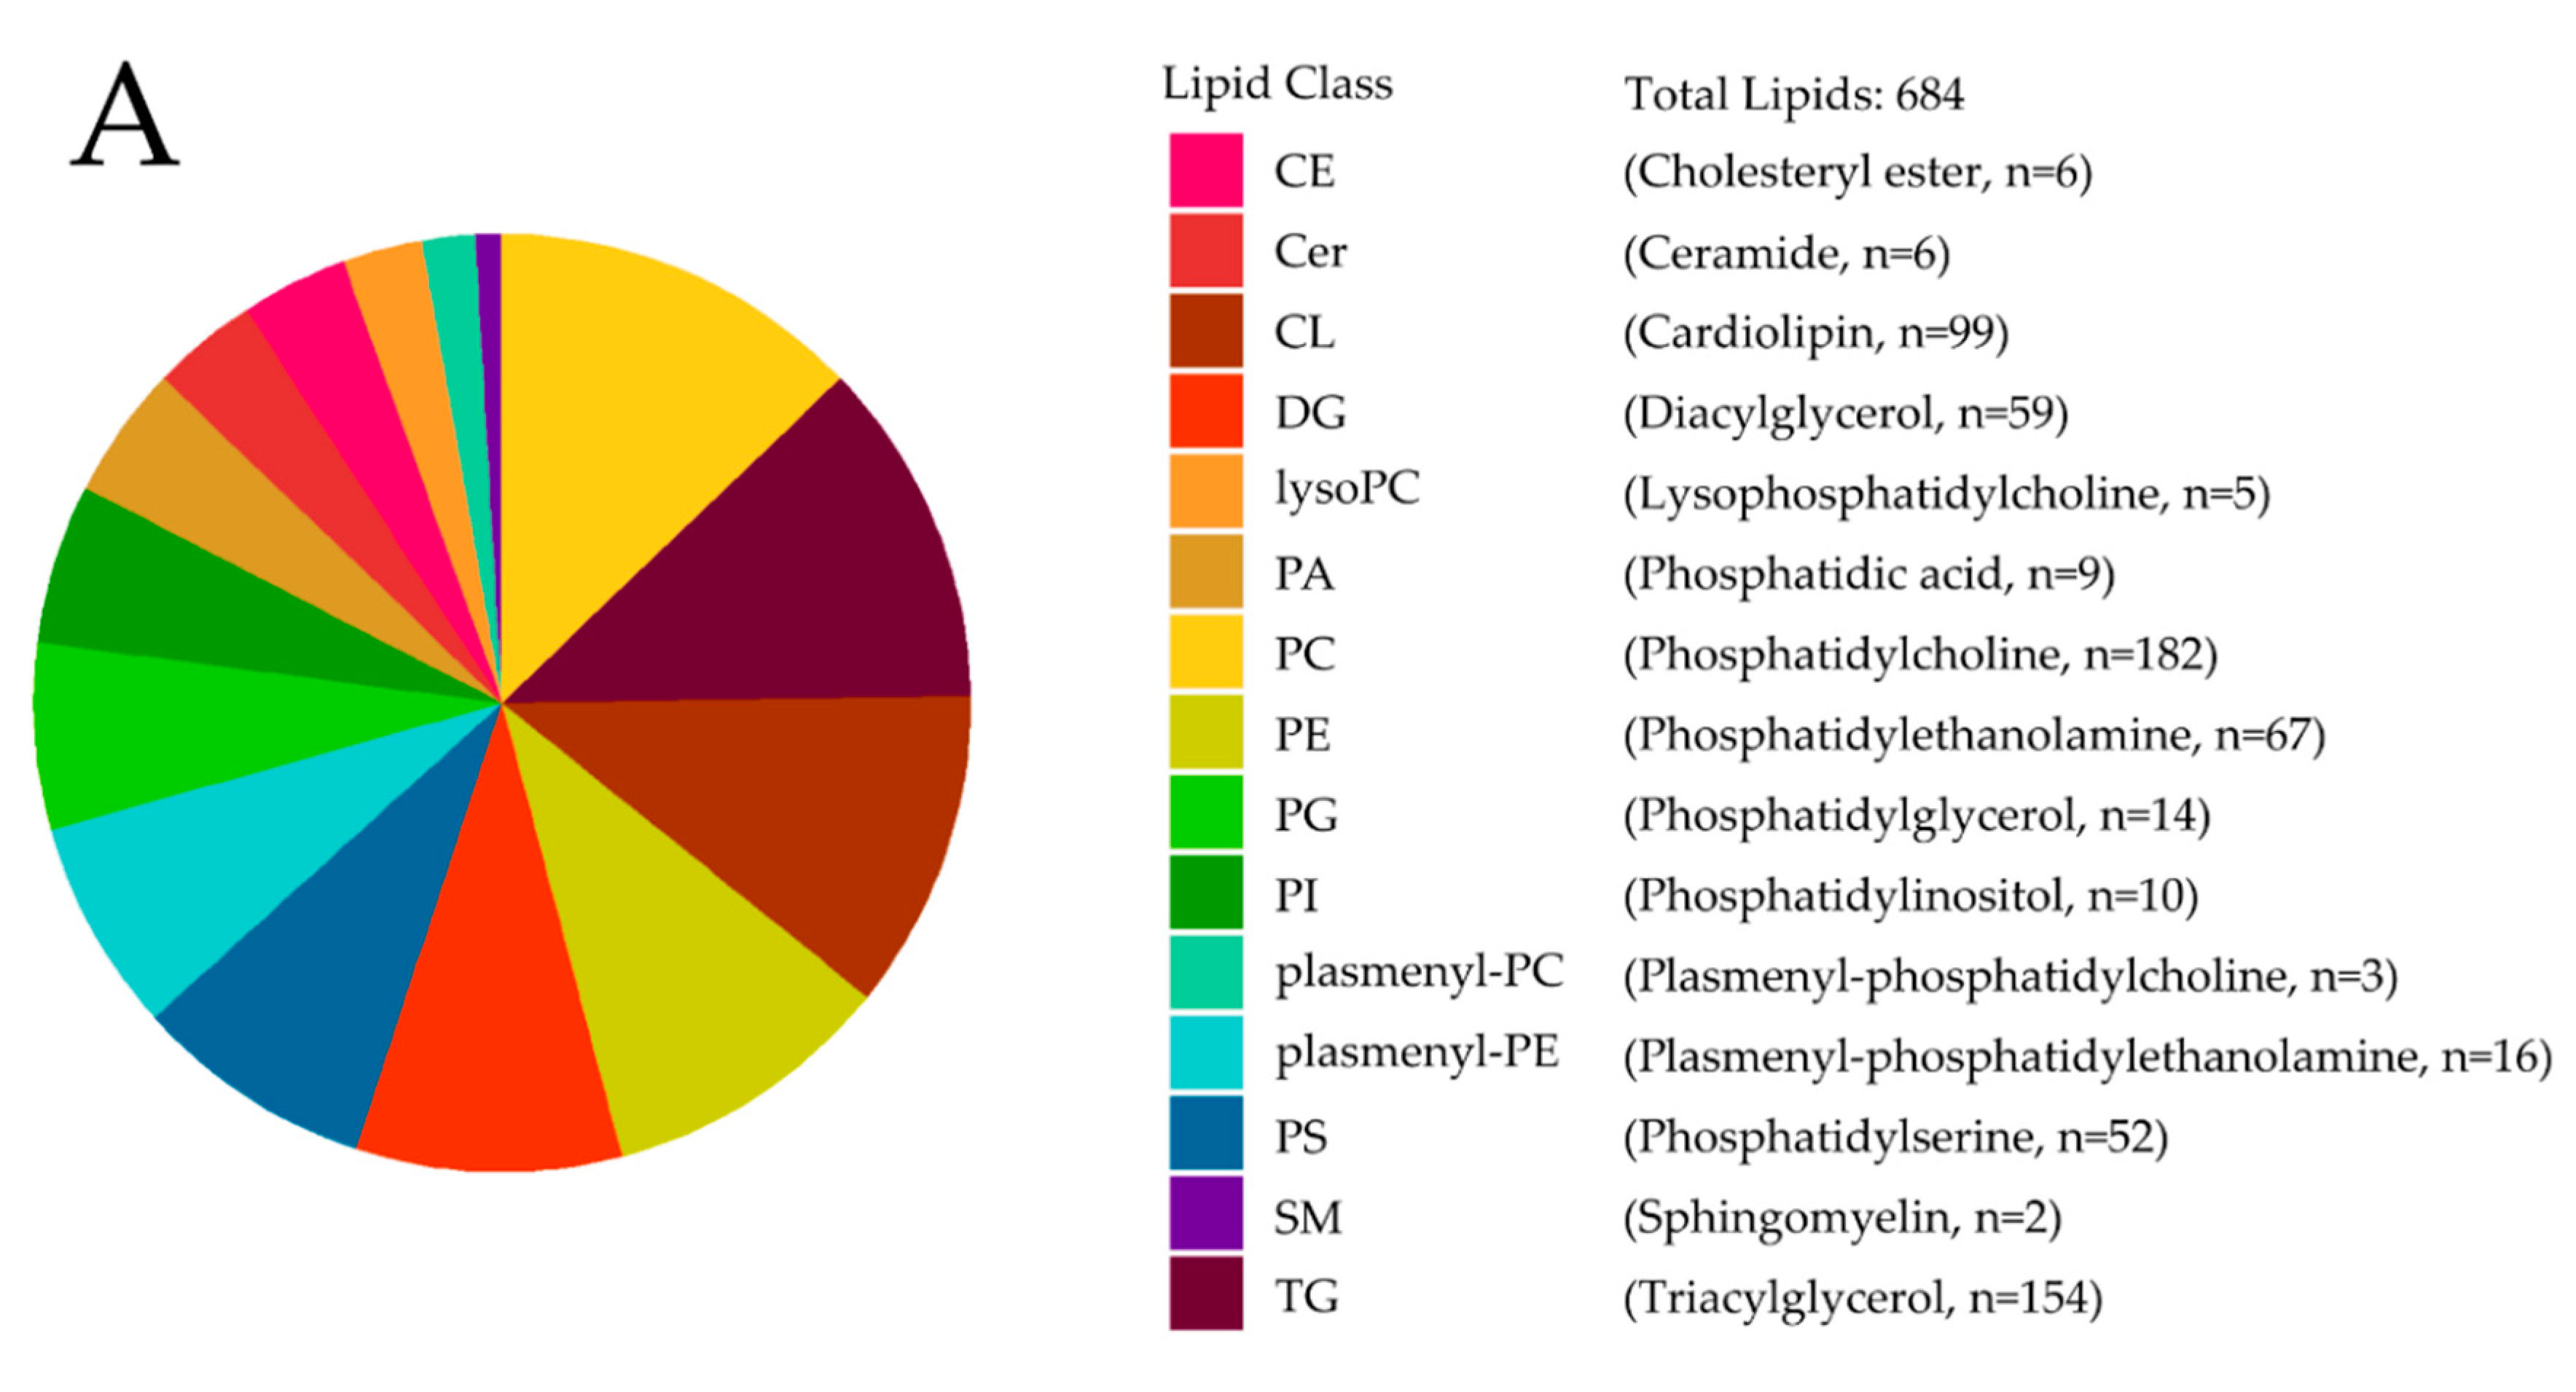
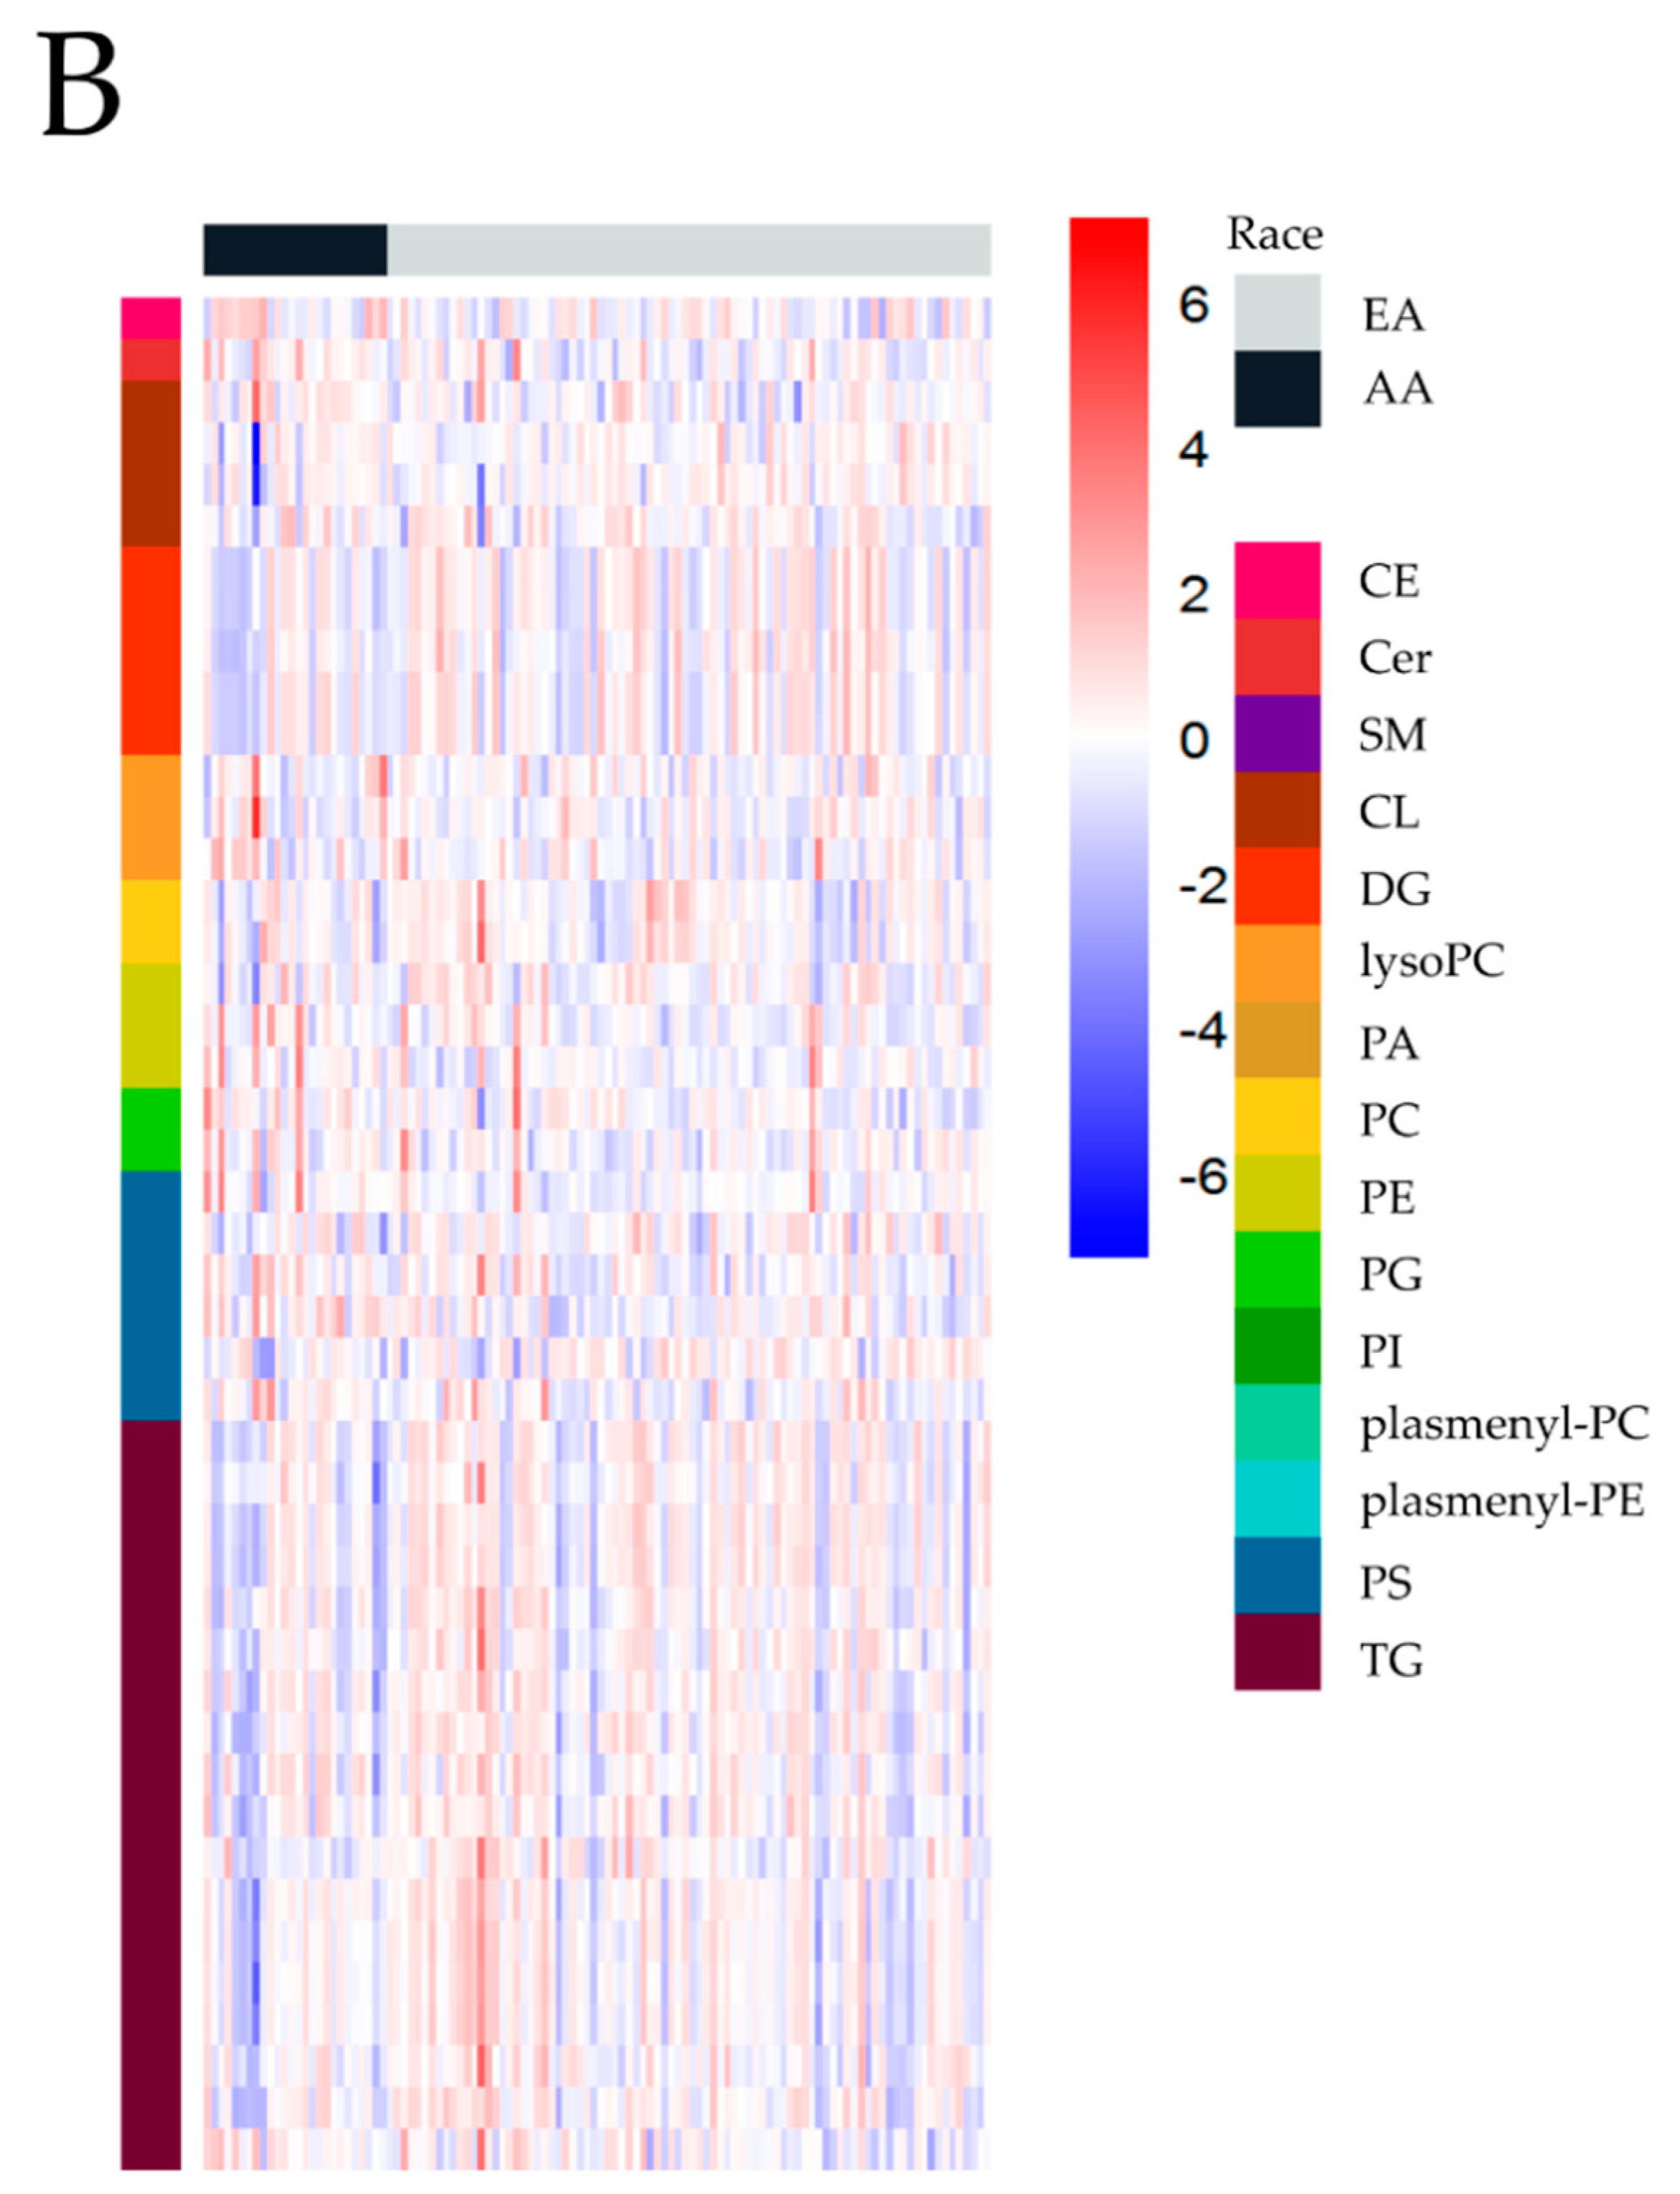
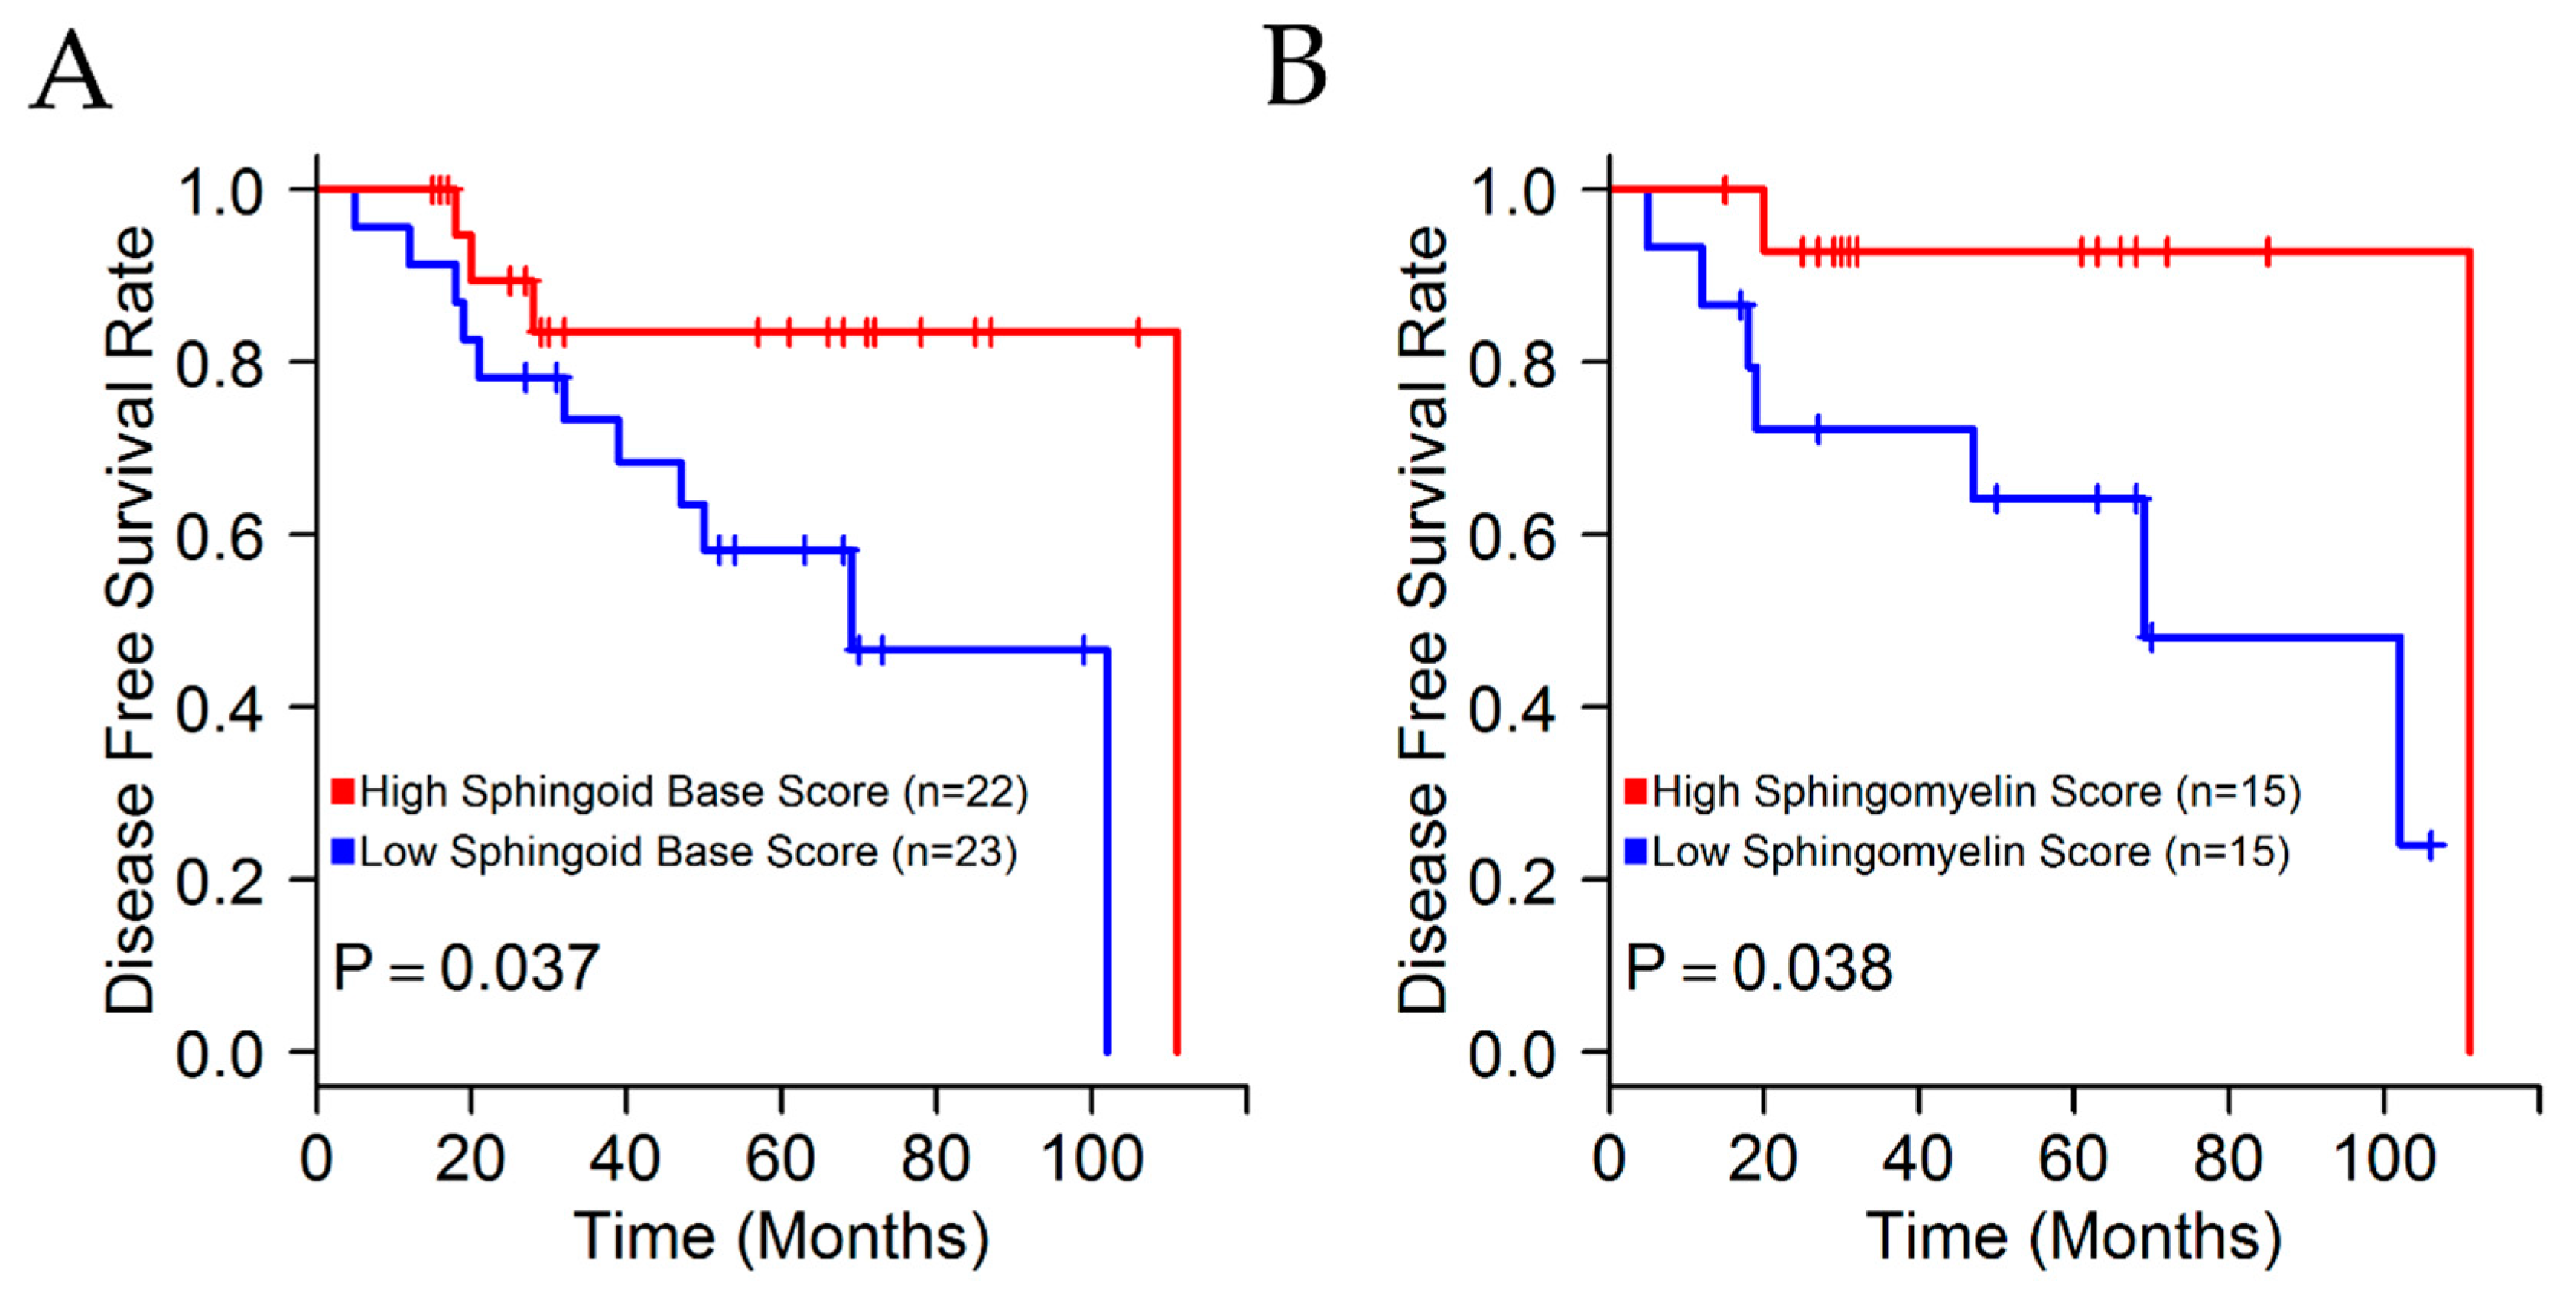
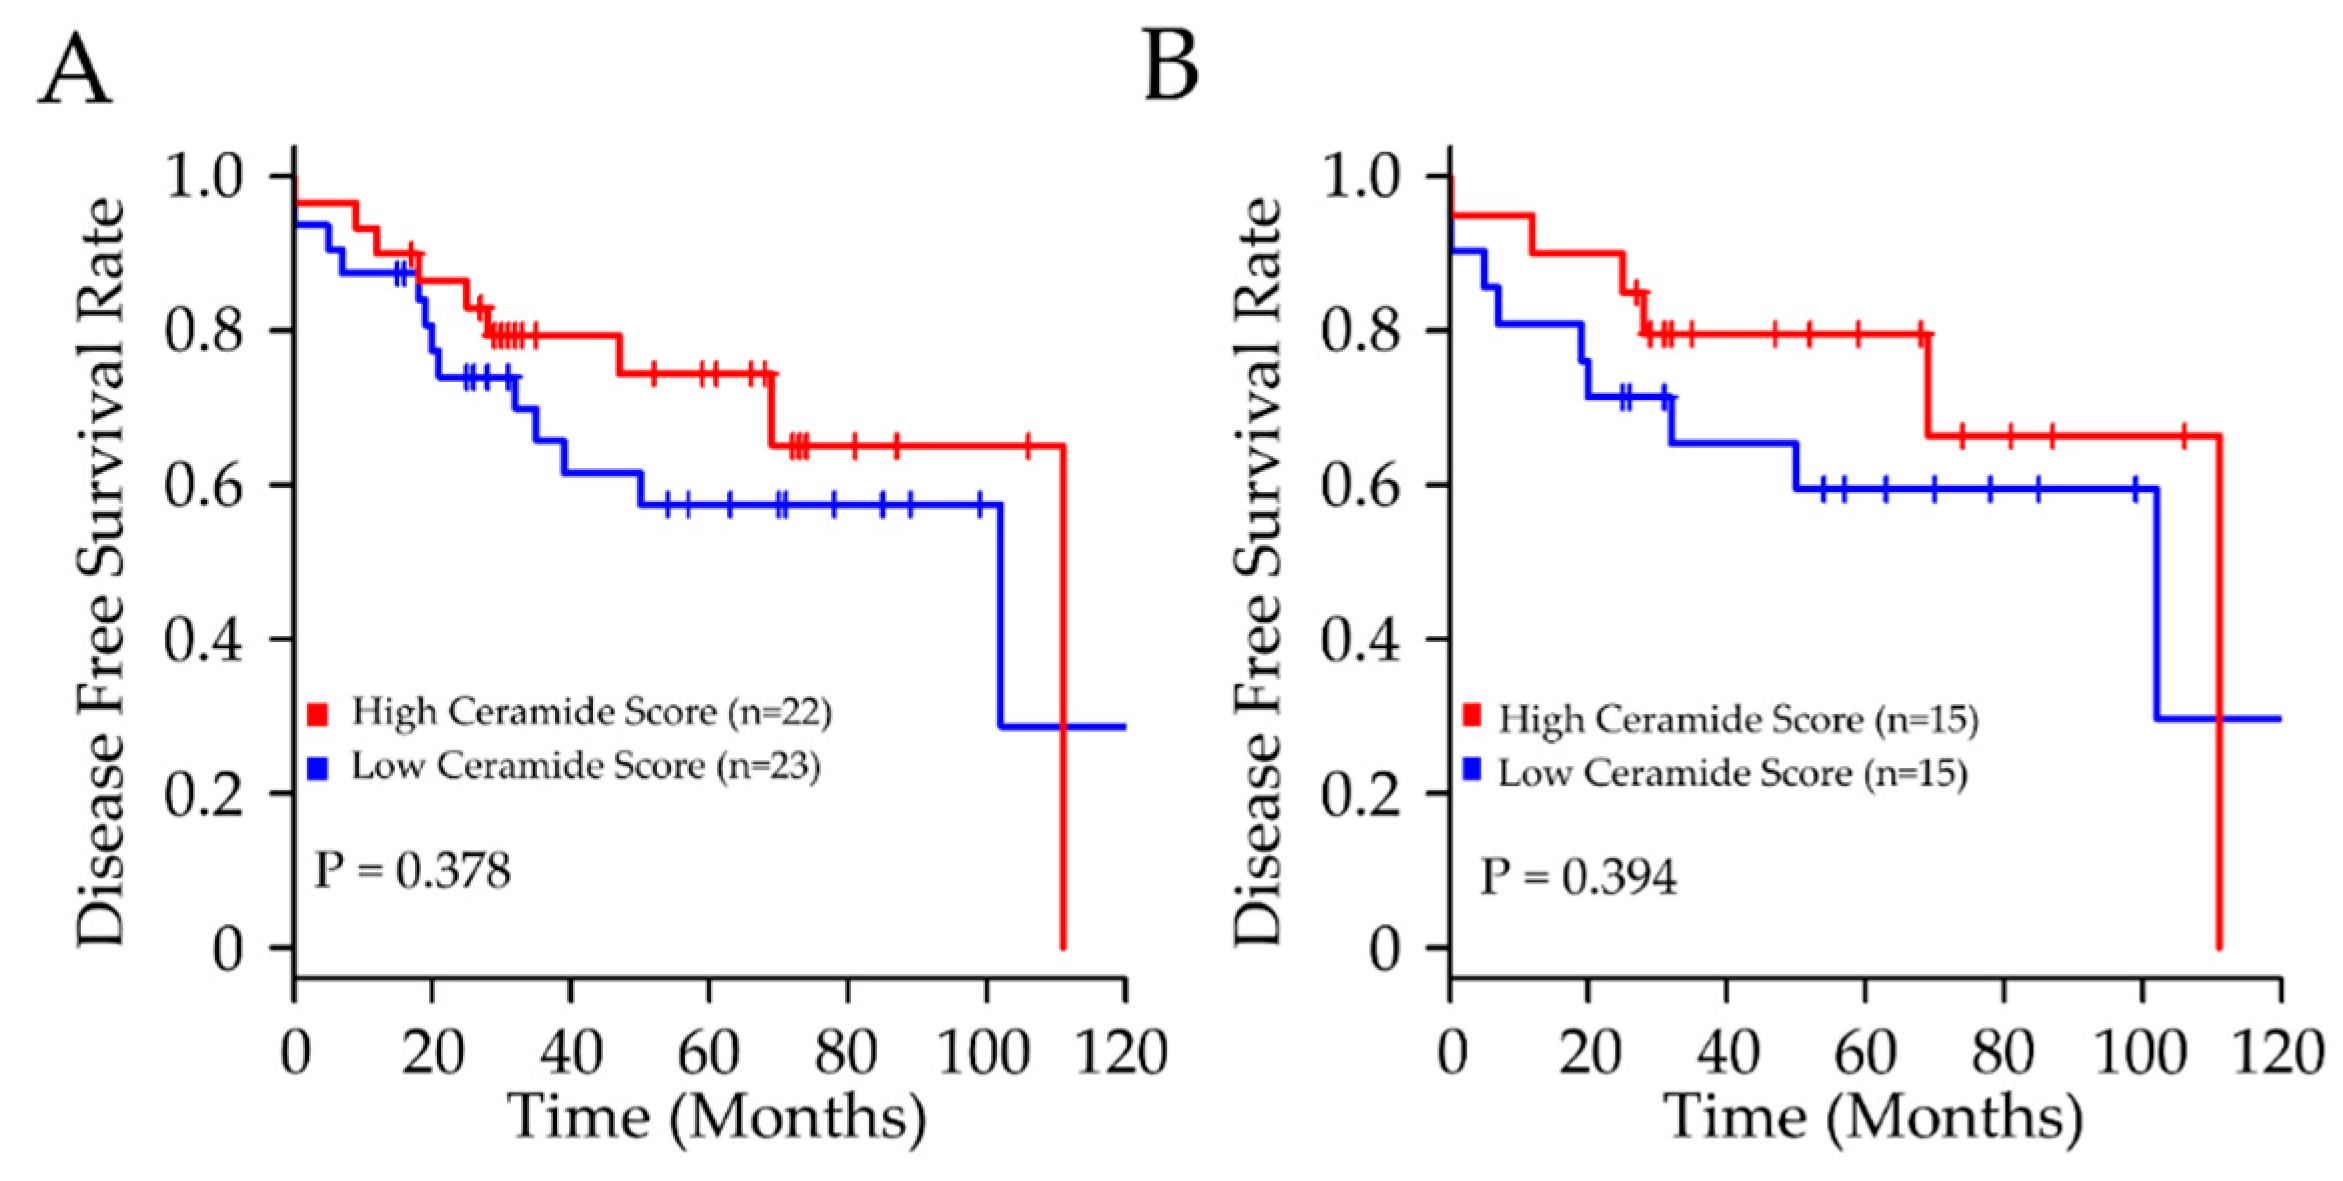
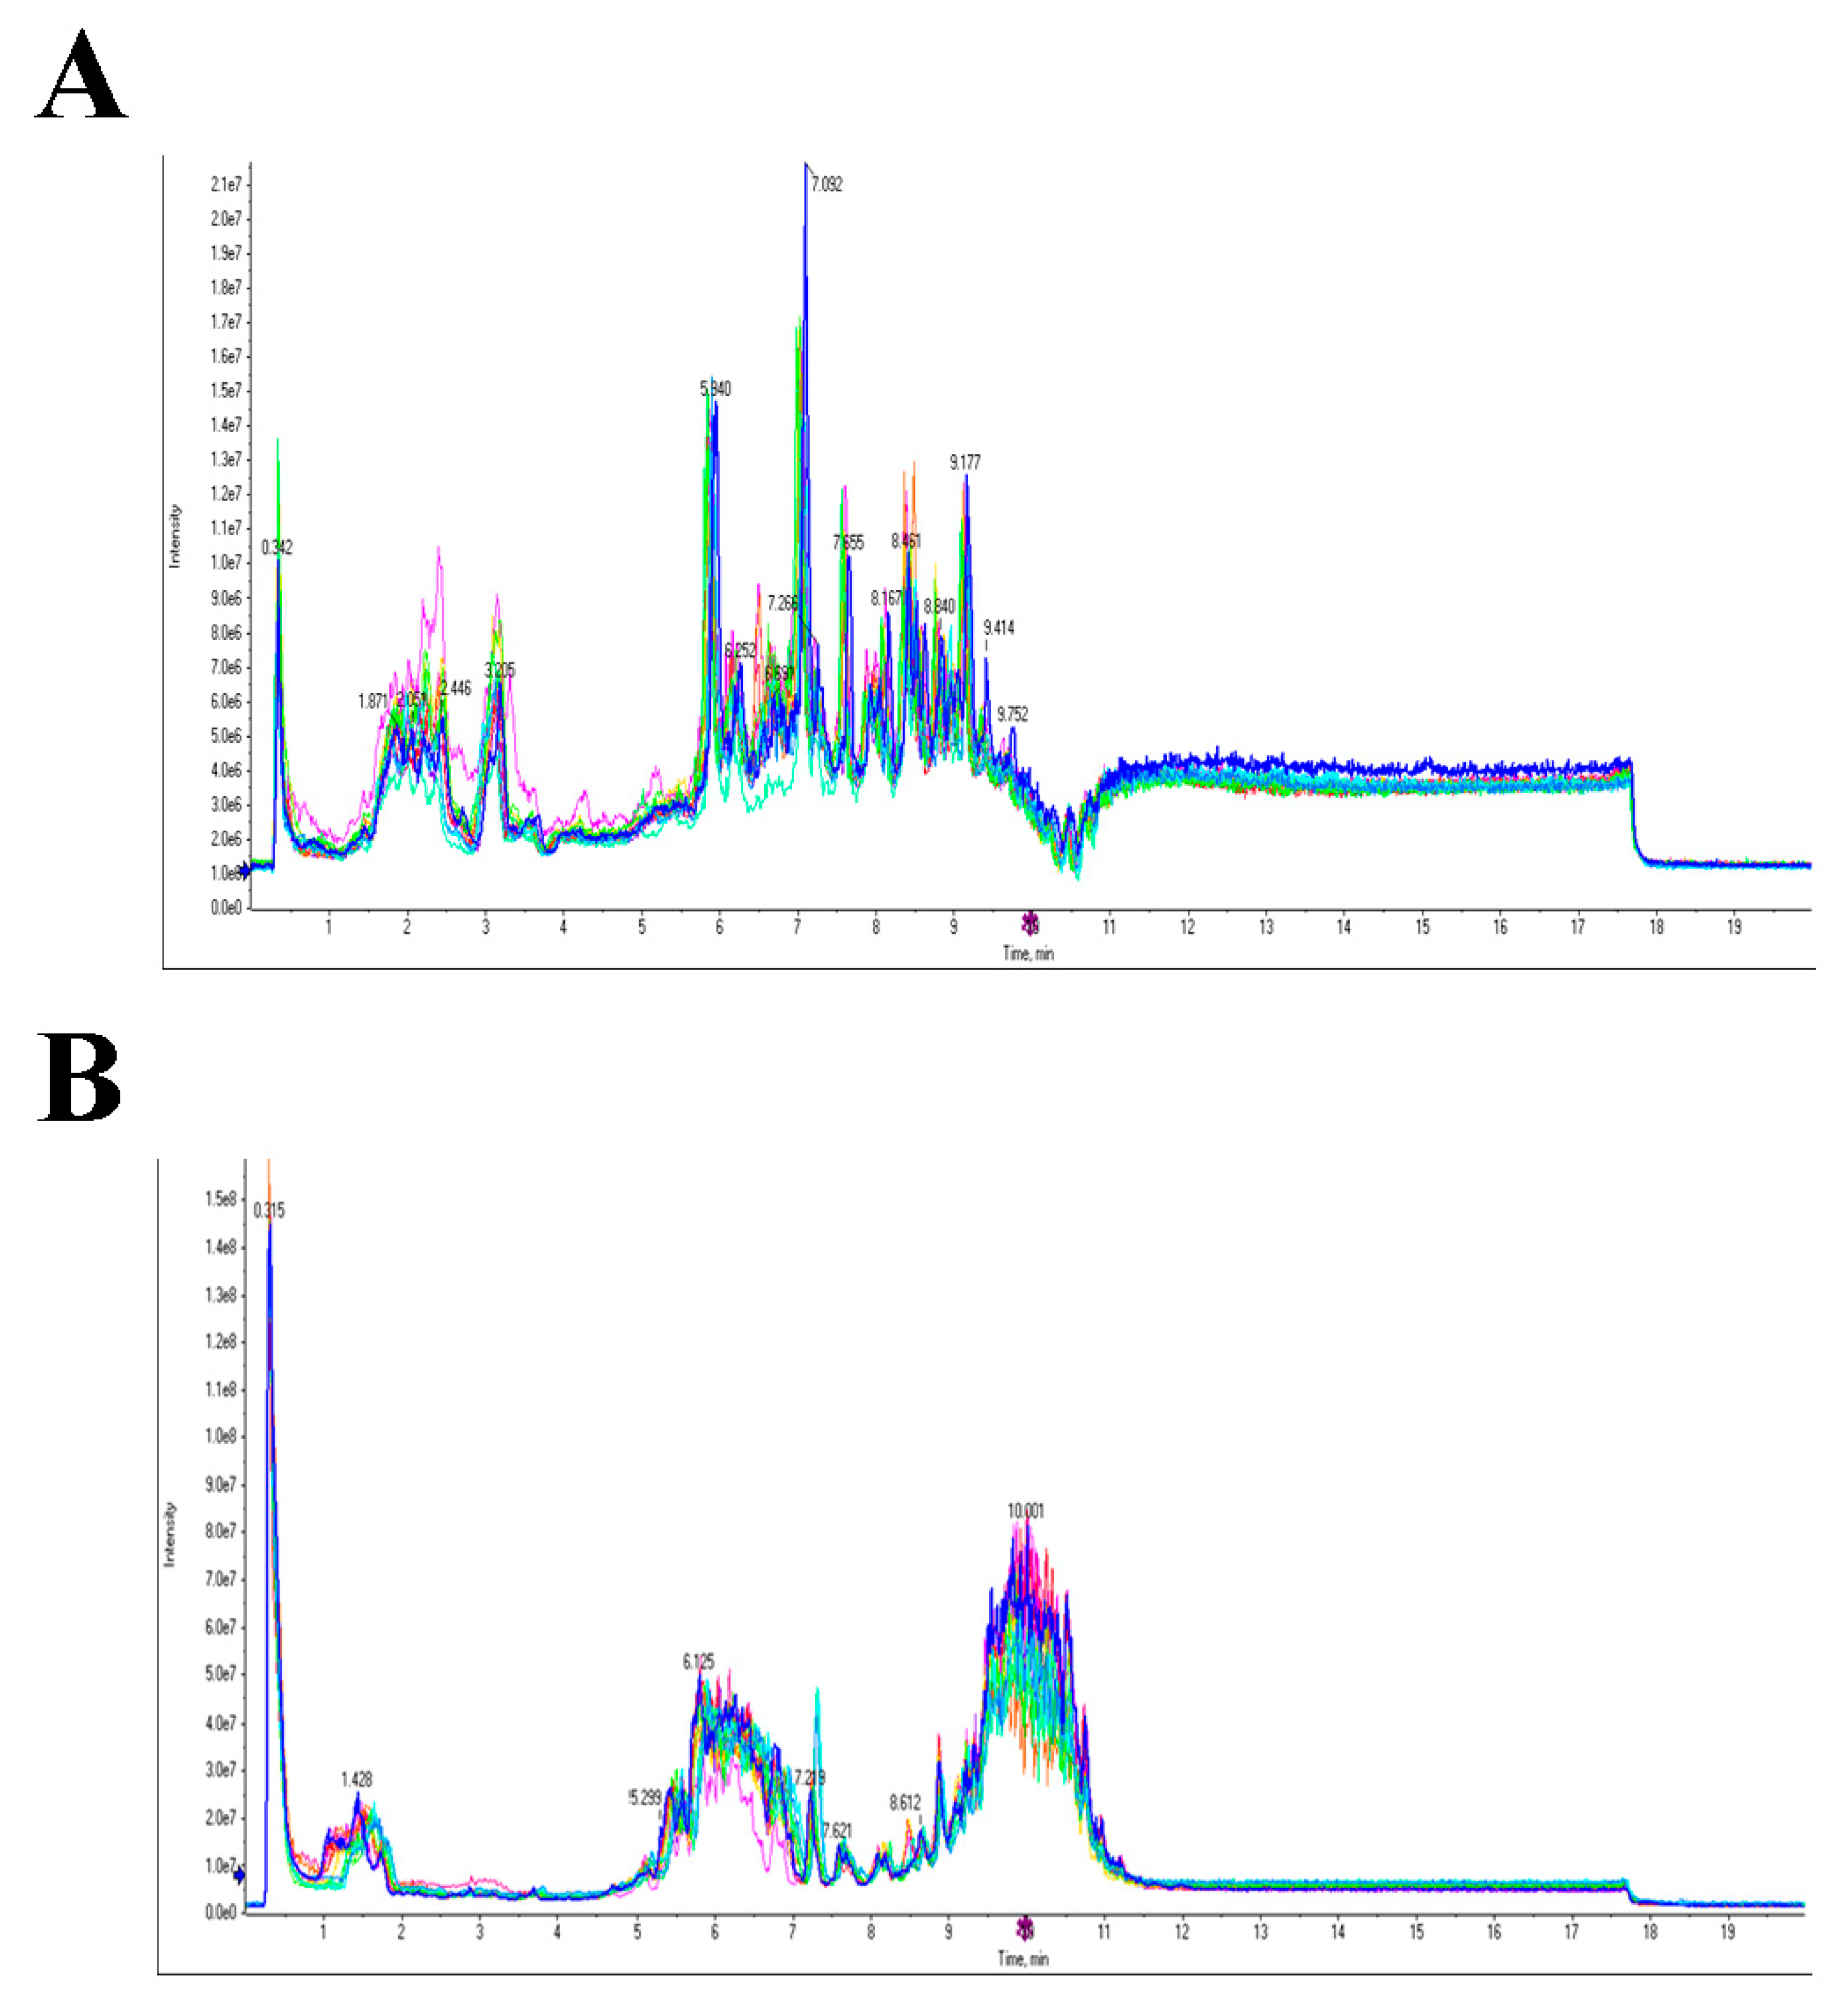
2. Results
3. Discussion
4. Materials and Methods
Supplementary Materials
Author Contributions
Funding
Acknowledgments
Conflicts of Interest
Appendix A


References
- Dent, R.; Trudeau, M.; Pritchard, K.I.; Hanna, W.M.; Kahn, H.K.; Sawka, C.A.; Lickley, L.A.; Rawlinson, E.; Sun, P.; Narod, S.A. Triple-Negative Breast Cancer: Clinical Features and Patterns of Recurrence. Clin. Cancer Res. 2007, 13, 4429–4434. [Google Scholar] [CrossRef] [PubMed] [Green Version]
- Foulkes, W.D.; Smith, I.E.; Reis-Filho, J.S. Triple-Negative Breast Cancer. N. Engl. J. Med. 2010, 363, 1938–1948. [Google Scholar] [CrossRef] [PubMed]
- Carey, L.A.; Dees, E.C.; Sawyer, L.; Gatti, L.; Moore, D.T.; Collichio, F.; Ollila, D.W.; Sartor, C.I.; Graham, M.L.; Perou, C.M. The Triple Negative Paradox: Primary Tumor Chemosensitivity of Breast Cancer Subtypes. Clin. Cancer Res. 2007, 13, 2329–2334. [Google Scholar] [CrossRef] [PubMed] [Green Version]
- Liedtke, C.; Mazouni, C.; Hess, K.R.; André, F.; Tordai, A.; Mejia, J.A.; Symmans, W.F.; Gonzalez-Angulo, A.M.; Hennessy, B.; Green, M.; et al. Response to Neoadjuvant Therapy and Long-Term Survival in Patients With Triple-Negative Breast Cancer. J. Clin. Oncol. 2008, 26, 1275–1281. [Google Scholar] [CrossRef] [PubMed]
- Jatoi, I.; Becher, H.; Leake, C.R. Widening disparity in survival between white and African-American patients with breast carcinoma treated in the U. S. Department of Defense Healthcare system. Cancer 2003, 98, 894–899. [Google Scholar] [CrossRef] [PubMed] [Green Version]
- Bauer, K.R.; Brown, M.; Cress, R.D.; Parise, C.A.; Caggiano, V. Descriptive analysis of estrogen receptor (ER)-negative, progesterone receptor (PR)-negative, and HER2-negative invasive breast cancer, the so-called triple-negative phenotype: A population-based study from the California cancer Registry. Cancer 2007, 109, 1721–1728. [Google Scholar] [CrossRef] [PubMed]
- Stead, L.A.; Lash, T.L.; Sobieraj, J.E.; Chi, D.D.; Westrup, J.L.; Charlot, M.; Blanchard, R.A.; Lee, J.C.; King, T.C.; Rosenberg, C.L. Triple-negative breast cancers are increased in black women regardless of age or body mass index. Breast Cancer Res. 2009, 11. [Google Scholar] [CrossRef] [PubMed] [Green Version]
- Beloribi-Djefaflia, S.; Vasseur, S.; Guillaumond, F. Lipid metabolic reprogramming in cancer cells. Oncogenesis 2016, 5, e189. [Google Scholar] [CrossRef] [PubMed]
- Santos, C.R.; Schulze, A. Lipid metabolism in cancer: Lipid metabolism in cancer. FEBS J. 2012, 279, 2610–2623. [Google Scholar] [CrossRef] [PubMed]
- Hirsch, H.A.; Iliopoulos, D.; Joshi, A.; Zhang, Y.; Jaeger, S.A.; Bulyk, M.; Tsichlis, P.N.; Shirley Liu, X.; Struhl, K. A Transcriptional Signature and Common Gene Networks Link Cancer with Lipid Metabolism and Diverse Human Diseases. Cancer Cell 2010, 17, 348–361. [Google Scholar] [CrossRef] [PubMed] [Green Version]
- Zhang, F. Dysregulated lipid metabolism in cancer. World J. Biol. Chem. 2012, 3, 167. [Google Scholar] [CrossRef] [PubMed]
- Nagahashi, M.; Tsuchida, J.; Moro, K.; Hasegawa, M.; Tatsuda, K.; Woelfel, I.A.; Takabe, K.; Wakai, T. High levels of sphingolipids in human breast cancer. J. Surg. Res. 2016, 204, 435–444. [Google Scholar] [CrossRef] [PubMed] [Green Version]
- Ruckhäberle, E.; Rody, A.; Engels, K.; Gaetje, R.; von Minckwitz, G.; Schiffmann, S.; Grösch, S.; Geisslinger, G.; Holtrich, U.; Karn, T.; et al. Microarray analysis of altered sphingolipid metabolism reveals prognostic significance of sphingosine kinase 1 in breast cancer. Breast Cancer Res. Treat. 2008, 112, 41–52. [Google Scholar] [CrossRef] [PubMed]
- Ogretmen, B.; Hannun, Y.A. Biologically active sphingolipids in cancer pathogenesis and treatment. Nat. Rev. Cancer 2004, 4, 604–616. [Google Scholar] [CrossRef] [PubMed]
- Sarkar, S.; Maceyka, M.; Hait, N.C.; Paugh, S.W.; Sankala, H.; Milstien, S.; Spiegel, S. Sphingosine kinase 1 is required for migration, proliferation and survival of MCF-7 human breast cancer cells. FEBS Lett. 2005, 579, 5313–5317. [Google Scholar] [CrossRef] [PubMed] [Green Version]
- Vethakanraj, H.S.; Babu, T.A.; Sudarsanan, G.B.; Duraisamy, P.K.; Ashok Kumar, S. Targeting ceramide metabolic pathway induces apoptosis in human breast cancer cell lines. Biochem. Biophys. Res. Commun. 2015, 464, 833–839. [Google Scholar] [CrossRef] [PubMed]
- Ponnusamy, S.; Meyers-Needham, M.; Senkal, C.E.; Saddoughi, S.A.; Sentelle, D.; Selvam, S.P.; Salas, A.; Ogretmen, B. Sphingolipids and cancer: Ceramide and sphingosine-1-phosphate in the regulation of cell death and drug resistance. Future Oncol. 2010, 6, 1603–1624. [Google Scholar] [CrossRef] [PubMed]
- Pyne, N.J.; Pyne, S. Sphingosine 1-phosphate and cancer. Nat. Rev. Cancer 2010, 10, 489–503. [Google Scholar] [CrossRef] [PubMed]
- Hirata, N.; Yamada, S.; Shoda, T.; Kurihara, M.; Sekino, Y.; Kanda, Y. Sphingosine-1-phosphate promotes expansion of cancer stem cells via S1PR3 by a ligand-independent Notch activation. Nat. Commun. 2014, 5, 4806. [Google Scholar] [CrossRef] [PubMed] [Green Version]
- Hait, N.C.; Oskeritzian, C.A.; Paugh, S.W.; Milstien, S.; Spiegel, S. Sphingosine kinases, sphingosine 1-phosphate, apoptosis and diseases. Biochim. Biophys. Acta BBA Biomembr. 2006, 1758, 2016–2026. [Google Scholar] [CrossRef] [PubMed]
- Liu, Y.-Y.; Han, T.-Y.; Giuliano, A.E.; Cabot, M.C. Expression of Glucosylceramide Synthase, Converting Ceramide to Glucosylceramide, Confers Adriamycin Resistance in Human Breast Cancer Cells. J. Biol. Chem. 1999, 274, 1140–1146. [Google Scholar] [CrossRef] [PubMed] [Green Version]
- Stover, T. Liposomal Delivery Enhances Short-Chain Ceramide-Induced Apoptosis of Breast Cancer Cells. J. Pharmacol. Exp. Ther. 2003, 307, 468–475. [Google Scholar] [CrossRef] [PubMed] [Green Version]
- Struckhoff, A.P. Novel Ceramide Analogs as Potential Chemotherapeutic Agents in Breast Cancer. J. Pharmacol. Exp. Ther. 2004, 309, 523–532. [Google Scholar] [CrossRef] [PubMed] [Green Version]
- Aoyagi, T.; Nagahashi, M.; Yamada, A.; Takabe, K. The Role of Sphingosine-1-Phosphate in Breast Cancer Tumor-Induced Lymphangiogenesis. Lymphat. Res. Biol. 2012, 10, 97–106. [Google Scholar] [CrossRef] [PubMed] [Green Version]
- Mukhopadhyay, P.; Ramanathan, R.; Takabe, K. S1P promotes breast cancer progression by angiogenesis and lymphangiogenesis. Breast Cancer Manag. 2015, 4, 241–244. [Google Scholar] [CrossRef] [PubMed] [Green Version]
- Ahn, E.H.; Chang, C.-C.; Schroeder, J.J. Evaluation of Sphinganine and Sphingosine as Human Breast Cancer Chemotherapeutic and Chemopreventive Agents. Exp. Biol. Med. 2006, 231, 1664–1672. [Google Scholar] [CrossRef]
- Schiffmann, S.; Sandner, J.; Birod, K.; Wobst, I.; Angioni, C.; Ruckhäberle, E.; Kaufmann, M.; Ackermann, H.; Lötsch, J.; Schmidt, H.; et al. Ceramide synthases and ceramide levels are increased in breast cancer tissue. Carcinogenesis 2009, 30, 745–752. [Google Scholar] [CrossRef] [PubMed] [Green Version]
- Kim, H.-Y.; Lee, K.-M.; Kim, S.-H.; Kwon, Y.-J.; Chun, Y.-J.; Choi, H.-K. Comparative metabolic and lipidomic profiling of human breast cancer cells with different metastatic potentials. Oncotarget 2016, 7. [Google Scholar] [CrossRef] [PubMed]
- Lánczky, A.; Nagy, Á.; Bottai, G.; Munkácsy, G.; Szabó, A.; Santarpia, L.; Győrffy, B. miRpower: A web-tool to validate survival-associated miRNAs utilizing expression data from 2178 breast cancer patients. Breast Cancer Res. Treat. 2016, 160, 439–446. [Google Scholar] [CrossRef] [PubMed]
- Kang, H.S.; Lee, S.C.; Park, Y.S.; Jeon, Y.E.; Lee, J.H.; Jung, S.-Y.; Park, I.H.; Jang, S.H.; Park, H.M.; Yoo, C.W.; et al. Protein and lipid MALDI profiles classify breast cancers according to the intrinsic subtype. BMC Cancer 2011, 11. [Google Scholar] [CrossRef] [PubMed]
- Deshmukh, S.K.; Srivastava, S.K.; Bhardwaj, A.; Singh, A.P.; Tyagi, N.; Marimuthu, S.; Dyess, D.L.; Dal Zotto, V.; Carter, J.E.; Singh, S. Resistin and interleukin-6 exhibit racially-disparate expression in breast cancer patients, display molecular association and promote growth and aggressiveness of tumor cells through STAT3 activation. Oncotarget 2015, 6. [Google Scholar] [CrossRef] [PubMed]
- Song, M.-A.; Brasky, T.M.; Marian, C.; Weng, D.Y.; Taslim, C.; Dumitrescu, R.G.; Llanos, A.A.; Freudenheim, J.L.; Shields, P.G. Racial differences in genome-wide methylation profiling and gene expression in breast tissues from healthy women. Epigenetics 2015, 10, 1177–1187. [Google Scholar] [CrossRef] [PubMed] [Green Version]
- Cuvillier, O.; Pirianov, G.; Kleuser, B.; Vanek, P.G.; Coso, O.A.; Gutkind, J.S.; Spiegel, S. Suppression of ceramide-mediated programmed cell death by sphingosine-1-phosphate. Nature 1996, 381, 800–803. [Google Scholar] [CrossRef] [PubMed]
- Baran, Y.; Salas, A.; Senkal, C.E.; Gunduz, U.; Bielawski, J.; Obeid, L.M.; Ogretmen, B. Alterations of Ceramide/Sphingosine 1-Phosphate Rheostat Involved in the Regulation of Resistance to Imatinib-induced Apoptosis in K562 Human Chronic Myeloid Leukemia Cells. J. Biol. Chem. 2007, 282, 10922–10934. [Google Scholar] [CrossRef] [PubMed]
- Senkal, C.E.; Ponnusamy, S.; Bielawski, J.; Hannun, Y.A.; Ogretmen, B. Antiapoptotic roles of ceramide-synthase-6-generated C16-ceramide via selective regulation of the ATF6/CHOP arm of ER-stress-response pathways. FASEB J. 2010, 24, 296–308. [Google Scholar] [CrossRef] [PubMed]
- Kachler, K.; Bailer, M.; Heim, L.; Schumacher, F.; Reichel, M.; Holzinger, C.D.; Trump, S.; Mittler, S.; Monti, J.; Trufa, D.I.; et al. Enhanced Acid Sphingomyelinase Activity Drives Immune Evasion and Tumor Growth in Non–Small Cell Lung Carcinoma. Cancer Res. 2017, 77, 5963–5976. [Google Scholar] [CrossRef] [PubMed]
- Moro, K.; Kawaguchi, T.; Tsuchida, J.; Gabriel, E.; Qi, Q.; Yan, L.; Wakai, T.; Takabe, K.; Nagahashi, M. Ceramide species are elevated in human breast cancer and are associated with less aggressiveness. Oncotarget 2018, 9. [Google Scholar] [CrossRef] [PubMed]
- Scarlatti, F.; Sala, G.; Somenzi, G.; Signorelli, P.; Sacchi, N.; Ghidoni, R. Resveratrol induces growth inhibition and apoptosis in metastatic breast cancer cells via de novo ceramide signaling. FASEB J. 2003, 17, 2339–2341. [Google Scholar] [CrossRef] [PubMed]
- Cianchi, F.; Papucci, L.; Schiavone, N.; Lulli, M.; Magnelli, L.; Vinci, M.C.; Messerini, L.; Manera, C.; Ronconi, E.; Romagnani, P.; et al. Cannabinoid Receptor Activation Induces Apoptosis through Tumor Necrosis Factor-Mediated Ceramide De novo Synthesis in Colon Cancer Cells. Clin. Cancer Res. 2008, 14, 7691–7700. [Google Scholar] [CrossRef] [PubMed]
- Chalfant, C.E.; Rathman, K.; Pinkerman, R.L.; Wood, R.E.; Obeid, L.M.; Ogretmen, B.; Hannun, Y.A. De Novo Ceramide Regulates the Alternative Splicing of Caspase 9 and Bcl-x in A549 Lung Adenocarcinoma Cells: DEPENDENCE ON PROTEIN PHOSPHATASE-1. J. Biol. Chem. 2002, 277, 12587–12595. [Google Scholar] [CrossRef] [PubMed]
- Moussavi, M. Curcumin mediates ceramide generation via the de novo pathway in colon cancer cells. Carcinogenesis 2005, 27, 1636–1644. [Google Scholar] [CrossRef] [PubMed] [Green Version]
- Song, M.; Zang, W.; Zhang, B.; Cao, J.; Yang, G. GCS overexpression is associated with multidrug resistance of human HCT-8 colon cancer cells. J. Exp. Clin. Cancer Res. 2012, 31, 23. [Google Scholar] [CrossRef] [PubMed]
- Piyarathna, D.W.B.; Rajendiran, T.M.; Putluri, V.; Vantaku, V.; Soni, T.; von Rundstedt, F.-C.; Donepudi, S.R.; Jin, F.; Maity, S.; Ambati, C.R.; et al. Distinct Lipidomic Landscapes Associated with Clinical Stages of Urothelial Cancer of the Bladder. Eur. Urol. Focus 2017, 17, S2405–S4569. [Google Scholar] [CrossRef] [PubMed]
- Templ, M.; Alfons, A.; Filzmoser, P. Exploring incomplete data using visualization techniques. Adv. Data Anal. Classif. 2012, 6, 29–47. [Google Scholar] [CrossRef]
- Fahy, E.; Subramaniam, S.; Murphy, R.C.; Nishijima, M.; Raetz, C.R.H.; Shimizu, T.; Spener, F.; van Meer, G.; Wakelam, M.J.O.; Dennis, E.A. Update of the LIPID MAPS comprehensive classification system for lipids. J. Lipid Res. 2009, 50, S9–S14. [Google Scholar] [CrossRef] [PubMed]
- Ritchie, M.E.; Phipson, B.; Wu, D.; Hu, Y.; Law, C.W.; Shi, W.; Smyth, G.K. limma powers differential expression analyses for RNA-sequencing and microarray studies. Nucleic Acids Res. 2015, 43, e47. [Google Scholar] [CrossRef] [PubMed]
- Wickham, H. Ggplot2: Elegant Graphics for Data Analysis; Use R! Springer: New York, NY, USA, 2009; ISBN 978-0-387-98140-6. [Google Scholar]
- Kolde, R. pheatmap; Package ‘pheatmap’; The R Foundation: Vienna, Austria, 2015. [Google Scholar]


| Clinical Variable | Breast Tumor Samples (%) (n = 70) |
|---|---|
| Receptor Status, n (%) | |
| Triple-Negative | 70 (100) |
| ER+ | 0 (0) |
| Race, n (%) | |
| African-American | 14 (20) |
| European-American | 53 (75.7) |
| Other | 3 (4.3) |
| Histological Type, n (%) | |
| Ductal | 57 (81.4) |
| Other | 13 (18.6) |
| Grade, n (%) | |
| II | 6 (8.6) |
| III | 63 (90) |
| Other | 1 (1.4) |
| AJCC Stage, n (%) | |
| 1 | 17 (24.3) |
| 2 | 33 (47.1) |
| 3 | 14 (20) |
| 4 | 2 (2.9) |
| Unknown | 4 (5.7) |
| Sample Site, n (%) | |
| Primary | 66 (94.3) |
| Metastatic | 4 (5.7) |
| Clinical Follow-Up (months) | |
| Mean | 45.6 |
| Median | 35 |
| Standard Deviation | 32.4 |
| Factors | Disease-Free Survival | ||
|---|---|---|---|
| HR | 95% CI | p Value | |
| Stage (I/II vs. III) | 0.70 | 0.11–4.5 | 0.71 |
| CE | 1.22 | 0.85–1.75 | 0.27 |
| DG | 1.00 | 0.98–1.02 | 0.67 |
| LysoPC | 1.07 | 0.88–1.32 | 0.45 |
| PA | 0.86 | 0.65–1.15 | 0.32 |
| PC | 0.99 | 0.97–1.02 | 0.84 |
| Plasmenyl-PC | 1.19 | 0.62–2.3 | 0.59 |
| Plasmenyl-PE | 0.86 | 0.7–1.06 | 0.18 |
| TG | 1.00 | 0.98–1.02 | 0.77 |
| CL | 1.04 | 0.98–1.09 | 0.12 |
| SB | 0.77 | 0.6–0.98 | 0.03 |
| PE | 0.98 | 0.92–1.04 | 0.55 |
| PG | 0.93 | 0.8–1.07 | 0.33 |
| PI | 1.17 | 0.98–1.4 | 0.06 |
| PS | 1.01 | 0.95–1.08 | 0.55 |
| Factors | Disease-Free Survival | ||
|---|---|---|---|
| HR | 95% CI | p Value | |
| Stage (I/II vs. III) | 1.02 | 0.12–8.13 | 0.98 |
| CE | 1.56 | 0.91–2.66 | 0.1 |
| DG | 0.99 | 0.96–1.01 | 0.47 |
| LysoPC | 1.11 | 0.88–1.4 | 0.37 |
| PA | 0.86 | 0.61–1.22 | 0.41 |
| PC | 0.98 | 0.95–1.01 | 0.36 |
| Plasmenyl-PC | 1.2 | 0.53–2.72 | 0.65 |
| Plasmenyl-PE | 0.89 | 0.71–1.11 | 0.31 |
| TG | 0.99 | 0.97–1.01 | 0.81 |
| CL | 1.02 | 0.97–1.08 | 0.32 |
| Cer | 1.09 | 0.76–1.55 | 0.61 |
| SM | 0.37 | 0.17–0.77 | 0.008 |
| PE | 0.98 | 0.91–1.05 | 0.59 |
| PG | 0.92 | 0.78–1.09 | 0.35 |
| PI | 1.18 | 0.97–1.44 | 0.08 |
| PS | 1.04 | 0.97–1.11 | 0.25 |
© 2018 by the authors. Licensee MDPI, Basel, Switzerland. This article is an open access article distributed under the terms and conditions of the Creative Commons Attribution (CC BY) license (http://creativecommons.org/licenses/by/4.0/).
Share and Cite
Purwaha, P.; Gu, F.; Piyarathna, D.W.B.; Rajendiran, T.; Ravindran, A.; Omilian, A.R.; Jiralerspong, S.; Das, G.; Morrison, C.; Ambrosone, C.; et al. Unbiased Lipidomic Profiling of Triple-Negative Breast Cancer Tissues Reveals the Association of Sphingomyelin Levels with Patient Disease-Free Survival. Metabolites 2018, 8, 41. https://doi.org/10.3390/metabo8030041
Purwaha P, Gu F, Piyarathna DWB, Rajendiran T, Ravindran A, Omilian AR, Jiralerspong S, Das G, Morrison C, Ambrosone C, et al. Unbiased Lipidomic Profiling of Triple-Negative Breast Cancer Tissues Reveals the Association of Sphingomyelin Levels with Patient Disease-Free Survival. Metabolites. 2018; 8(3):41. https://doi.org/10.3390/metabo8030041
Chicago/Turabian StylePurwaha, Preeti, Franklin Gu, Danthasinghe Waduge Badrajee Piyarathna, Theckelnaycke Rajendiran, Anindita Ravindran, Angela R. Omilian, Sao Jiralerspong, Gokul Das, Carl Morrison, Christine Ambrosone, and et al. 2018. "Unbiased Lipidomic Profiling of Triple-Negative Breast Cancer Tissues Reveals the Association of Sphingomyelin Levels with Patient Disease-Free Survival" Metabolites 8, no. 3: 41. https://doi.org/10.3390/metabo8030041